
2023
Annual report
What’s Cooking? Annual report 2023 1

2 What’s Cooking? Annual report 2023
3 Introduction 1 Contents 3 What’s Cooking? - in brief 4 - 5 Our core values 6 - 7 Headlines and key figures in 2023 - Prospects for 2024 8 - 10 Strategic objectives 10 1. Business overview 12 Message from the Chairman 14 - 15 Piet Sanders, Chief Executive Officer 16 - 19 Eric Kamp, Chief Operations Officer 20 - 23 Yves Regniers, Chief Financial Officer 24 - 27 Engaged Employees Empowering Employees through Lean Management 28 - 29 Rebuild Innovation Yes, we pack more sustainable! 30 - 31 Making sustainable food consumption second nature 32 - 33 Portfolio Refocus Shaping of the portfolio of the future 34 - 35 Grow Excellence Come a casa®: to an international brand with a soul 36 - 37 Safety at work & wellbeing 38 - 39 Food Safety & Quality 40 - 43 Digital Acceleration Deliver maximal value through digital comfort 44 - 45 Lead our industry in sustainability Procurement & ESG 46 - 47 2. Non-financial information ......................................................... 49 3. Corporate governance............................................................ 140 4. Stock and shareholder information 164 5. Consolidated financial statements 167 Contact information ................................................................... 214 Contents What’s Cooking? Annual report 2023
Sales offices
1. Deeside, GB
Production site
2. Opole, PL
Production site
3. Mézidon-Vallée d’Auge, FR Production site
4. Wanze, BE Production site
Ready meals sites
6. Veurne, BE
Centre for slicing and packaging
7. Lievegem, BE
Head office
Production site
Centre for slicing and packaging
8. Wommelgem, BE
Production site
5. Marche-en-Famenne, BE Production site
Centre for slicing and packaging
Savoury Sites
9. Ridderkerk, NL
Centre for slicing and packaging
10. Aalsmeer, NL*
Centre for slicing and packaging
11. Borculo, NL
Production site
12. Wijchen, NL
Centre for slicing and packaging Sites
7 9 12 8 10 6 5 11 1 4 3 2
4 What’s Cooking? Annual report 2023
What’s Cooking? is an innovative European fresh savoury food group that brings tasty, nutritious and convenient Savoury and Ready Meals, with happy customers in no less than 37 countries.
With savoury cold cuts and ready meals as our two focal points, What’s Cooking? has twelve production sites in Belgium, the Netherlands*, France, Poland and the United Kingdom, seven commercial offices in Europe and a head office in Belgium. We employ about 2,500 people, around sixty of whom work at our headquarters. In 2023, our group achieved a turnover of 832 million euros.
*From March 2024 onwards, the activities of the plant in Aalsmeer were relocated to other plants in The Netherlands.
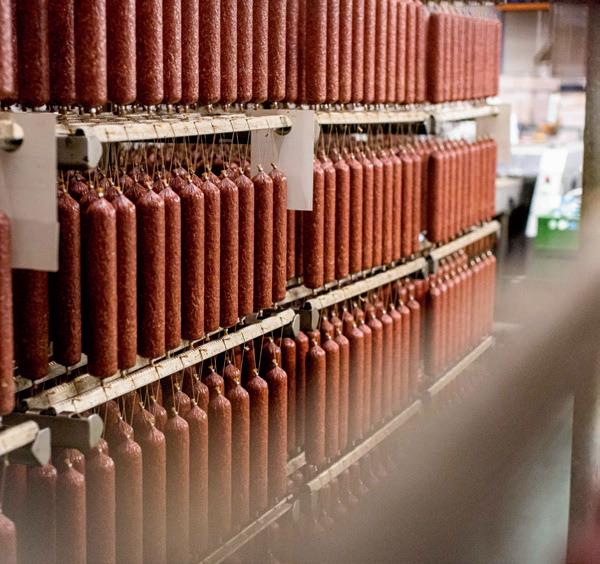
Savoury strategic business unit
is a producer and packer of savoury snacks, slices & spreads for the Benelux, the United Kingdom, Germany and for export
• has production sites in Belgium (Wommelgem and Lievegem) and the Netherlands (Borculo)
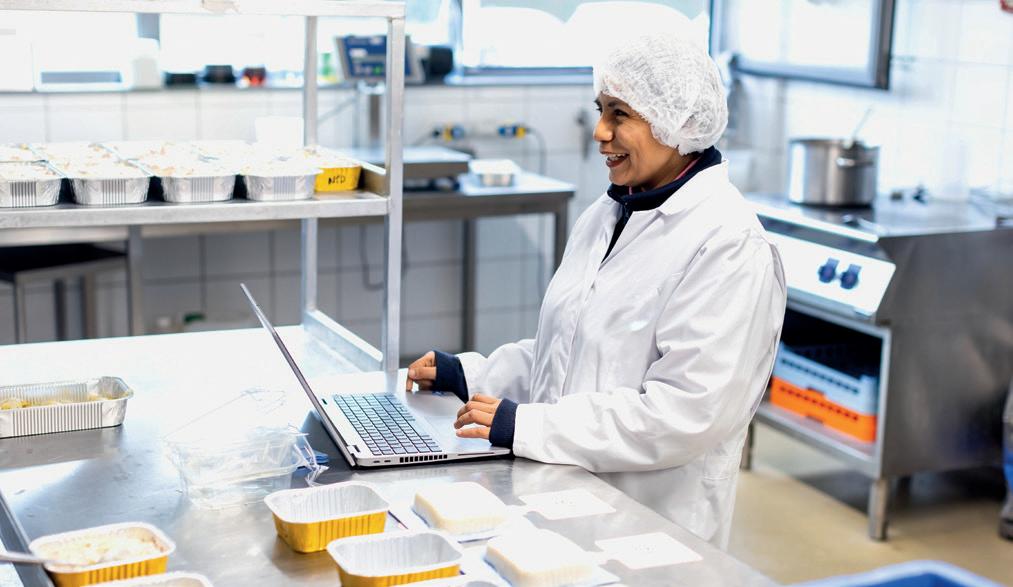
• has six centres for cutting and packaging meat products, three of which are in Belgium (Wommelgem, Lievegem and Veurne) and three in the Netherlands (Wijchen, Ridderkerk and up to early 2024 in Aalsmeer)
• is an innovator in the pre-packaged savoury products segment
• Sells products under distribution brands and own brand names such as Pluma®, Daniël Coopman® and Limco®
• employs about 1,115 people (excl. temps)
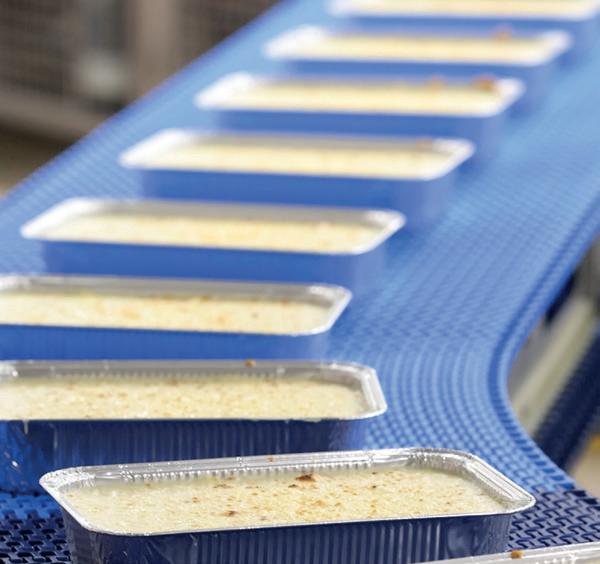
Ready meals strategic business unit
makes freshly prepared meals for the European market
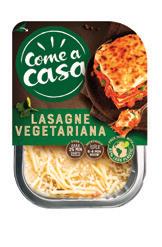
is the European market leader in fresh lasagna
has specialised production sites in Belgium (Wanze and Marche-en-Famenne), France (Mézidon-Vallée d’Auge), Poland (Opole) and the United Kingdom (Deeside)
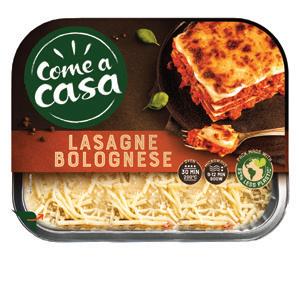
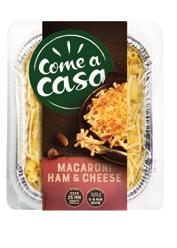
• sold under the Come a casa®, Vamos® and Stefano Toselli® brand names, and numerous distribution brands
• employs about 1,350 people (excl. temps)
What’s Cooking? Annual report 2023 5 What’s Cooking? - in brief

What’s Cooking? Annual report 2023 6
Stronger together thanks to our core values
1. Crafting with care, care by crafting
The care we put into our products is our contribution to the world. Quality is always on our hungry minds, as is the well-being and safety of our colleagues and consumers. We set new standards for taste and convenience, and we are mindful about sustainability.
2. Confident & courageous
We know we are pretty good at what we do, because we believe in our people and the skills they bring to the table. We encourage them to be just as ambitious as we are, never minding the honest mistakes they may make on the way.
3. Day by day, side by side
Big changes don’t happen overnight. That’s why we work towards our goals one day at a time, rolling up our sleeves together, as the team we are. We treat everyone equally while respecting their individuality, whether they’re our colleagues, customers, suppliers, or consumers.
7 What’s Cooking? Annual report 2023 Our core values
832
million euros in turnover
23.7
4.28
euros per share
About
2,531
Net cash generation of Gross dividend of million euros in investments (cash flow 2023) euros per share*
50
million euros
UEBITDA
employees (excl. temps)
19.94
* Ratio based on the average weighted number of shares in the financial year. The net cash flow per share consists of the result of the financial year excluding the contribution in the changes in equity plus (minus) non-cash expenses (revenues).
Highlights and key figures in 2023 Outlook for 2024
Consolidated results in 2023
Revenue growth of 6.5%
UEBITDA grows again due to the impact of pass-through inflation and continued focus on efficiency. As already indicated in the halfyear report, What’s Cooking bought the remaining 9% shares of What’s Cooking Deeside UK ltd. As a result, the group now holds 100% of the shares of What’s Cooking Deeside UK ltd. Holds.
Despite higher financing costs, What’s Cooking also managed to improve its net income. Focus on longer-term sustainable and profitable growth
What’s Cooking? Annual report 2023 8 Highlights and key figures in 2023 - looking ahead to 2024
Power lines
Our lines of force and key events
Despite difficult market conditions with high inflation and the sometimes problematic availability of raw materials, the group managed to increase consolidated turnover by 6.5% from EUR 781 to 832 million. The transparent pass-through of cost increases, in addition to continuous control of cost increases throughout the year, was a crucial factor in improving results. The year also featured the announcement of the new group strategy in March 2023 with the rebranding of Ter Beke into “What’s Cooking?” as a powerful signal.
Underlying EBITDA increases from EUR 38 million in 2022 to EUR 50 million in 2023. This despite pressure on volumes, as expected. The group did see volumes pick up in the second half of the year which is also clearly visible in the increased underlying EBITDA in the second half compared to the first half of the year.
Non-underlying EBITDA costs (EUR 4 million in total in 2023) in the current financial year mainly consist of costs related to the transfer of production in Aalsmeer to other Dutch sites (EUR 3 million). The other costs relate to the costs related to the rebranding at the beginning of 2023 and costs for the development of new vegetable products to be marketed in 2024.
Net financial debt reduced from EUR 68 million to EUR 61 million.
What’s Cooking has signed a new 5-year financing agreement for a EUR 175 million Revolving Credit Facility (RCF) with a consortium of existing and new banks. This agreement refinances the existing RCF and ensures the necessary financial stability in an uncertain changing macroeconomic and geopolitical context. The RCF allows What’s Cooking? to further realize its Sustainable Profitable Growth Plan 2030. The financing is unsecured and allows the group to take on a debt ratio of up to 3.5 times EBITDA. The financing agreement provides the option to link future margin to the group’s sustainability goals, an aspect that will be further detailed in the coming weeks.
Impact inflation - war in Ukraine - availability of raw materials
As expected, inflation also had a major impact on our business in 2023. Wage costs but also the cost of ingredients continued to rise sharply further compared to the previous financial year. However, due to the changed policy surrounding the conclusion of longterm contracts, contracts very often contain a clause to pass on cost increases for the biggest cost drivers in our sales prices or have a shorter duration. As a result, the impact of inflation on EBITDA results is less than in previous years.
The war in Ukraine had no direct impact on our results.
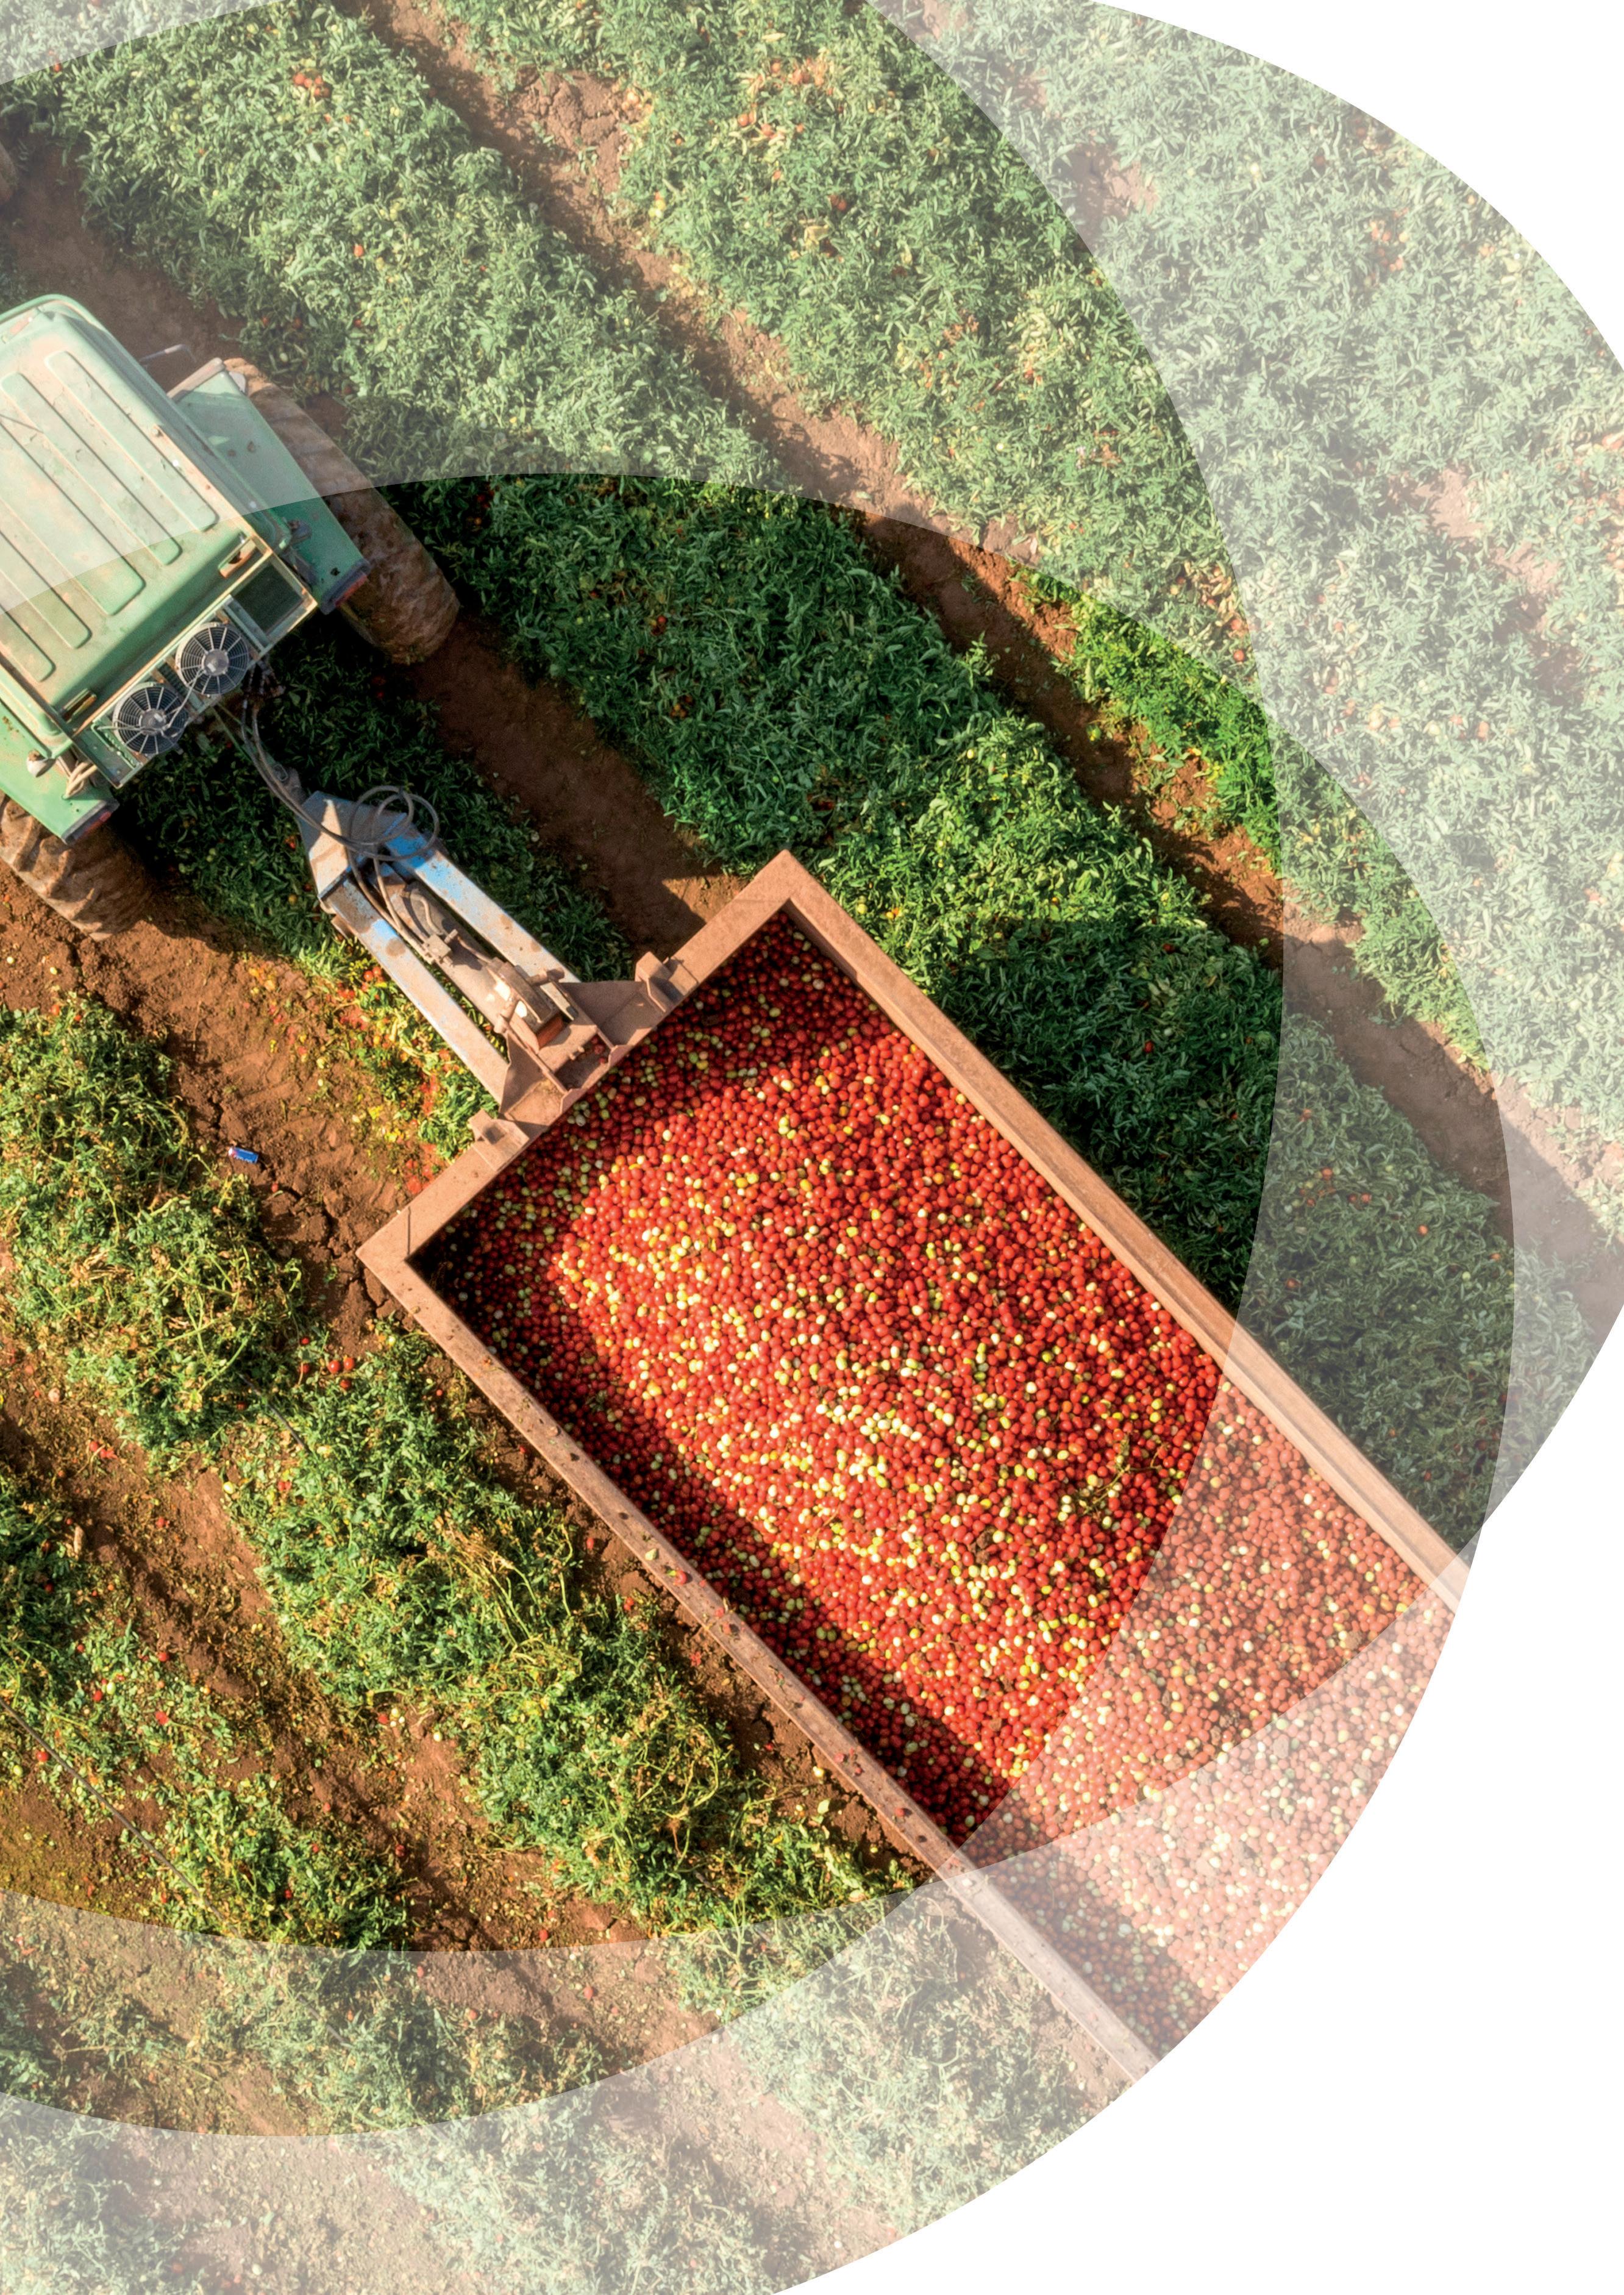
Availability of raw materials generally improved compared to previous years but certain raw materials seem to be increasingly affected by climatic conditions such as periods of extreme drought or precipitation. Such was the case for tomatoes and other ingredients. (What’s Cooking uses sun-ripened tomatoes for this purpose).
Strategic business unit Savoury (‘savoury toppings’)
Business unit sales increased 5% from EUR 443 million to EUR 464 million, mainly due to the transparent pass-through of increased labor and raw material costs. Volume in the business unit declined in a declining market. Furthermore, the business unit launched a number of new vegetable products and there are concrete plans to develop this further in the coming months.
The evolving product portfolio also includes hybrid, vegetarian and plant-based products, whose importance in the segment will gradually increase. What’s Cooking? also introduced a number of innovative packaging concepts for our customers in 2023. Under the leadership of Teun Haegens (previously Controller within the Savoury business unit) - from now on SBU Director SavouryWhat’s Cooking? will continue to focus on the realisation of our strategic ambitions and the further sustainability of our products and packaging.
The segment’s underlying EBITDA remained stable compared to 2022: EUR 21 million in 2023, compared to EUR 21 million in 2022.
The announced restructuring in Aalsmeer, the Netherlands is on track and will allow the group to produce and respond to customer demands in an even more sustainable way. Thanks to the investments made in Ridderkerk and Wijchen, What’s Cooking? can deliver our products even fresher, tastier and with improved service, packaged in very attractive packaging. During the restructuring, the group put maximum efforts into guiding the employees involved from job to job.
Net financial debts fell further by 7 million (from €67.8 million to €60.9 million).
What’s Cooking? Annual report 2023 9 Highlights and key figures in 2023 - looking ahead to 2024
In million euros 2022 2023 Difference in % Net sales 781 832 + 7 UEBITDA 38 50 + 31 EBITDA 36 45 + 27 U-EBIT 210 21 + 117 EBIT 8 17 + 117 Result of the financial year after tax 4,5 7,7 + 69
Strategic business unit Ready Meals (‘prepared meals’)
Turnover of the prepared meals business unit increased by 9% from EUR 339 million to EUR 369 million, mainly due to the passthru of cost increases. What’s Cooking? also succeeded in introducing a large number of innovative products both in the United Kingdom and on the continent. Although demand declined slightly in southern Europe, the company noted that its focus on quality broadly paid off despite the volume decline compared to last year. The successful introduction of a number of plant-based and vegetarian products also inspires optimism with a view to further growth of the product portfolio.
This portfolio offers a range of internationally known and regionally adapted products that are nutritional, delicious and affordable. The emphasis on quality and unburdening customers has led to the fact that What’s Cooking? won back a number of contracts, resulting in a nice growth in volumes in the second half of the year.
Modified sales contracts that better respond to purchase price volatility, as well as a number of investments in its plants that support production efficiency, drove a 41% improvement in the segment’s underlying EBITDA, from EUR22 million in 2022 to EUR31 million in 2023.
Dividend proposal
The Board of Directors will propose to the General Meeting to approve - after several years with an unchanged dividend - a 7% increase in the dividend compared to the previous year. This brings the gross dividend that will be submitted for approval to EUR 4.28 per share. Given the improved results and refinancing, the Board of Directors will not propose a scrip dividend.
Events after the balance date
No events except for the refinancing described above.
Outlook for 2024
The Board of Directors looks to 2024 with confidence, bolstered by volume growth in SBU Ready Meals and the group’s solid financial position and cash flow. The refinancing will also enable us to continue the implementation of the new strategy and make the planned investments. These investments, especially in SBU Ready Meals, are expected to be higher and more structural in the coming years than in previous years.
Savoury (‘savoury toppings’)
Within the savoury business unit, we expect to launch further blended, vegetarian and vegan products. For the further development of these products, we are looking at both in-house developments and collaborations. Collaborating with our customers around CO2 reduction of the products remains an absolute priority. We have already worked out a programme for this and will continue to fully commit to it in the coming months. Only in this way can we ensure that we and our customers can achieve the SBTI targets.
Ready Meals (‘prepared meals’)
We expect further market growth in ready meals both in 2024 and in the longer term. What’s Cooking will therefore continue to invest in the development of new products alongside further developments in its existing portfolio. Innovative products will also require investment in capacity in the coming years. The results of the capacity expansion are expected to be visible in the operating result especially in the coming years.
Group costs
What’s Cooking? expects operating costs to rise slightly as a result of the new strategy focusing on sustainability, R&D, digitalisation and further professionalisation of its human resources policy. These additional costs do contribute to the results of the coming years.
General
It remains difficult to predict inflation spikes and the availability of raw materials.
Strategic objectives
What’s Cooking? wants to create growth and added value for all stakeholders. To conclude this introduction, we remind some of our targets as initially set in 2023, with a view to 2030.
Must-do’s
• Prioritise safety and food safety
• Sustainable profitable growth
Strategic Beliefs
Engaged Employees
• Rebuild Innovation
Portfolio Refocus
• Grow Excellence
Digital Acceleration
• Lead our industry in sustainability
What’s Cooking? Annual report 2023 10 Highlights and key figures in 2023 - looking ahead to 2024

What’s Cooking? Annual report 2023 11 Turnover 2019 728,1 2020 717,4 2021 696,9 832 2022 2023 781,4 EBITDA 37,2 2019 37,1 2020 45,9 2021 35,9 45 2022 2023 EAT (Earnings After Tax) 4,4 2019 7,3 2021 4,5 7,7 2022 2023 -2,5 2020
business overview
What’s Cooking? Annual report 2023 12

Foreword by the Chairman
Bold moves in times of chaos
We have again enjoyed a very intense year. No crisis, no permacrisis, but just chaos…
Building organizations that thrive under every and any circumstance is now the major challenge of Leadership. The agenda items remain the same: people, performance and profitable growth. The sequence however for our business is crucial: ‘enable people to bring the performance that delivers growth’
Starting with our own employees, we build trustful relationships. Easy to say but hard to realize in the difficult value chain of the food industry where every partner - upstream and downstreamis facing major profitability challenges. The way out is an even better focus on value creation, with ‘value’ defined as ‘an answer to a need’.
Amongst other, the Sustainability agenda for our industry is a major opportunity to create such a value and partnership: we are eager and forced to collaborate in a transparent way in order to reach the targets set by regulation and more and more by the customer and end consumer. Here too, our company has opted

for Leadership. We are building and sharing our Sustainability agenda with suppliers and customers, establishing a fair share of knowledge, efforts and benefits. We are grateful for these opportunities.
At the same time, we move operational excellence to the next level. It is more and more embedded in our company culture and represents a fascinating invitation for our employees to contribute to it day by day and for which we express gratitude to all of them.
What’s Cooking? is our new company brand that stands for our purpose: ‘Day by day, we make sustainable food consumption second nature, by increasing the appetite for delicious convenient food, with care for both people and planet’. Together, we write the novel: page by page, chapter by chapter. The ambitions are bold and high. 2023 was a clear indication that the strategic choices start to deliver. Reasons to look forward with optimism and courage.
Paul Van Oyen Chairman of the Board of Directors
What’s Cooking? Annual report 2023 14
Chairman

What’s Cooking? Annual report 2023 15
Chairman

16 What’s Cooking? Annual report 2023
Chief Executive Officer
Piet Sanders, CEO
The winds of change
Looking back to the year 2023
Well, a lot is cooking, thankfully. Absolutely crucial in 2023 was the launch in March of our new strategy which included a purpose, our core strategic beliefs, the new values and last but not least a new company name to express – with a question mark and not an exclamation mark - the winds of change that are going through our group. This new strategy will make our group future-proof, and is giving the teams a new perspective and direction.
What’s Cooking? strategic beliefs
We decided to translate our purpose: ‘Day by day, we make sustainable food consumption second nature, by increasing the appetite for delicious convenient food, with care for both people and planet’, into some bundled strategic beliefs which are turned into actions and projects.
In this annual report, some of our colleagues will dive deeper into our six strategic pillars to deliver Sustainable Profitable Growth while always putting first our must-do target of World-class Safety & Food Safety:
It all starts with ‘Engaged Employees’: without engaged people, no strategic plan can ever be successful! ‘Rebuild Innovation’ means that we are very busy to renew the innovative drive that the former ‘Ter Beke’ had in the past, in order to make a meaningful difference for our customers and the consumers in these new demanding times. In ‘Portfolio Refocus’ there are quite some initiatives such as adding new global heroes - besides lasagna - to our Ready Meals portfolio, but we emphasize our desire to offer consumers also vegetarian & plant-based alternatives next to our delicious meat-based foods.
‘Grow Excellence’ underlines the continued program to improve our Operational Excellence, and deploy some activities to build also Sales & Marketing excellence (e.g. rolling out our Come a casa® brand in Central & Eastern Europe). ‘Digital acceleration & processes’ is a summary statement of the ongoing work to map, harmonize our core processes, and make them more lean, reinforced by the continued effort of supporting them with the right and modern digital solutions & systems.
Last and surely not least is our belief to ‘Lead our industry in sustainability’, using our slogan for internal mobilization and external communication: ‘Yes We Care’. For this important belief, we listened to our customers and suppliers, whose sustainability targets we analyzed well and combined with our own ambitions towards 2030, proposing some very specific solutions to reduce the CO2equivalents of the products we supply them, as well as the use of plastic. We had several supplier meetings to invite them to be part of our sustainability program, and collaborate more transparently on raw & packaging materials that can help our customers along the way towards their sustainability objectives.
Tangible results of the new strategy
We started to implement the strategy right away with clear focus and measurement of a few KPI’s that evidence the progress we make day by day. For example, our new Alu-Top Seal lasagna is launched in Poland having 85% less plastic than before, our plantbased product range that is in the process of being launched, the roll-out of our new digital planning process & platform, our improved engagement scores, and maybe as most spectacular one: we’ve managed to compute for each SKU in the group the specific CO2 footprint which allowed us not only to identify the biggest contributors but also embark on reformulation projects with
17
Cooking? Annual report 2023 Chief Executive Officer
What’s
customers to reduce that footprint. A great and very specific added value we can bring to our customers as good basis for our partnership and way beyond a nice ESG-powerpoint.
Turn company values into practice
Throughout the years and acquisitions of the past, there had not yet been a real set of well-identified values established. We have therefore queried a very diverse group of employees, trying to feel the culture they like across the group. From there, we could define some common elements but also some gaps in what employees felt as desired values that are necessary for an engaged workforce, performance and strategy execution. That is how we came to these quite unique vales. We do not think they mean a revolution, but they clarify what we have in common and do put guidance towards the future of the company.
The values we stand for
‘Confident and courageous’ embeds our message that we expect our people to take initiative, to improve results and bring the strategy forward. Mistakes are authorized to be made in the context of being ambitious to go for an action contributing to our business needs. Doing so, we make that each of our 3000 colleagues have an impact and are co-building on the strategic steps.
‘Day by day, side by side’ tells our people to be open to each other’s situation and collaborate transparently, breaking through a silo-model of individual self-centered objectives. Rome wasn’t built in one day, but every day, we do expect progress on our journey of strategy and results.
‘Crafting with care, care by crafting’, emphasizes that we want to be a food producer that cares for the safety of our people, for perfectly food-safe quality products and that we want to improve our sustainability impact on the planet as a force for good.
Looking to the results of 2023
Even though we had expected a less turbulent year than 2022 with its geopolitical turbulences and extreme inflation, it was again not a normal year. Pork rose to an all-time high price, our salary cost suffered from a double-digit indexation, the climate change – with severe drought and heavy rainfall – again impacted our raw materials, and so on… Still, we managed to substantially improve our results, with a 31% improvement of our underlying EBITDA versus last year. The end result is quite satisfactory, be it that we still need to continue to improve the overall profitability of the group to allow for a brighter and more sustainable future.
Our strategy implementation will obviously help there. In the framework of our Operational Excellence, we also decided to close the Aalsmeer slicing site in the Netherlands, the smallest site in the group, regrouping production, and ensuring a better support to our customers. The social cost of this decision, did impact our non-recurring expenses in 2023 reducing the net profit.
Let me conclude by thanking the ExCom team and all our colleagues for the hard and effective work, and our shareholders and board of directors for the support in this impactful transformation of the Group. We can all look forward with some justified optimism to 2024!
Piet Sanders CEO
What’s Cooking? Annual report 2023 18 Chief Executive Officer
What’s Cooking? Annual report 2023 19
What’s Cooking? Annual report 2023 20
Operations Officer
Chief
Eric Kamp, COO
Continuous improvement at the core of our Operational excellence
One of the strategic beliefs of What’s Cooking? is to have a clear and well-executed Operational Excellence Strategy. Operational Excellence is based on Engaged People, Safety, Quality, Sustainability (ESG), Efficiency and Service to our Customers. Moreover, Continuous Improvement is at the core of our Operational Excellence Strategy.
Our Engaged People service as the cornerstone of our operational performance. We diligently cultivate an environment that fosters engagement, motivation and inclusivity. Our focus areas in operations are communication and recognition, operator training and leadership skills development for our team leaders, fostering a positive and collaborative work culture based on our Values. All

plants have a monitoring tool to measure that engagement and act accordingly where necessary. The Learning & Development department has been strengthened to ensure professionalization of our Learning Academies supported by investments in digital platforms.
Safety is paramount at What’s Cooking?, epitomized by our mantra: ‘Everybody who works at What’s Cooking? returns home safely to their loved ones’. We have invested substantial time in safety trainings and communication to focus on human behaviour: See-Say-Stop reflects in easy words our Safe Behaviour and allows identification of potential hazards. This gradual shift towards Safe Behaviour has resulted in 2023 in a 24% decrease of accidents and 43% reduction of severe accidents.
What’s Cooking? Annual report 2023 21 Chief Operations Officer
10 LIFE Savers have been launched which focus on reducing the risk for serious and potentially life-changing incidents in terms of Safety and Food Safety. We remain dedicated to installing a complete safety culture.
Quality is at the core of our endeavours, with ongoing efforts to enhance our Food Quality System ensuring our products and facilities meet the highest standards. The organisation has been strengthened to ensure that we comply with IFS and BRC standards. A quality improvement program has been launched to make a fundamental transformation of our Food Safety & Quality culture in all the layers of the organisation.
Sustainability (ESG) in our operations revolves around utility consumption, waste and active involvement with our suppliers to minimize their footprint impact. Multidisciplinary teams across the business drive projects to minimize our overall environmental as well as CO2 footprint.
Operational Efficiency is pivotal to our success and we have strengthened the organisation with Continuous Improvement experts, invested in our machine park and made improvements in processes. Operator recruitment & training, preventive maintenance and leadership training are must win battles.
Relocation of Aalsmeer activities to the other factories in the Netherlands has been announced as part of a footprint network rationalisation. By March 2024 Aalsmeer will be closed.
Our Value engineering program DRIVE, has made a substantial step forward in exploring opportunities in terms of reducing complexity and CO2 footprint impact. Procurement has worked closely with strategic suppliers to enlarge the focus area and capture accordingly ideas and footprint opportunities.
Customer service is a non-negotiable commitment. Sales & Operations (S&OP) process has seen a substantial investment in a system and process upgrade of Demand and Capacity planning. This investment will take until 2026 and will help to further professionalize our S&OP process to achieve better forecasting, higher service levels, costs improvement and lower working capital. Another major change during the second half of 2023, was the switch of Logistic service provider for the Belgium market to further optimize efficient supply to our customers.
At the core of our Operational Excellence Strategy lies Continuous Improvement. We continued training Green Belts and started to train operators as Yellow Belts. A roadmap has been crafted with care, to drive and support our overall Continuous Improvement culture.
Eric Kamp Chief Operations Officer

Focus on reducing the risk on serious and potentially life-changing incidents in terms of Safety and Food Safety.
What’s Cooking? Annual report 2023 22
Operations Officer
Chief
10 LIFE Savers

Protect yourself against a fall when working at height
Obtain authorisation before entering a confined space
Lock Out Tag Out Try Out LOTOTO
Control flammables and ignition sources
Keep yourself and others out of the line of fire
Protect our food products from contamination
Keep the workspace clean and sanitized before work and at regular intervals
Execute inspections to control safety & quality risks
Participate actively in improving our Food Safety Culture
Maintain the quality of our products by rightful handling
What’s Cooking? Annual report 2023 23

24 What’s Cooking? Annual report 2023 Chief Financial Officer

Yves Regniers, CFO
Leading our industry in ESG, an ongoing journey
Sustainability & Profit: hand in hand
At What’s Cooking?, we start every meeting with Quality, Food Safety & Sustainability. Within our new strategy, sustainability took center stage…and we have really started changing the way we think and work.
Therefore, let’s elaborate first on sustainability – a topic close to my heart and possible to go hand in hand with profit.
Knowledge is power!
In order to be able to improve, measurement is key. We therefore started a very intense data gathering exercise involving multiple departments and using the software we implemented early 2023. The data insights combined with our materiality matrix allowed us to focus. Given the importance of climate change and the fact that scope 3 emissions represent the vast majority of emissions we put absolute focus on understanding the detailed footprint of
every product. Next to calculating the details by product, we also trained all our research & innovation (R&I) staff and commercial staff in calculating a product carbon footprint.
When developing and commercializing new branded or private label products, we ensure that we make them delicious, nutritious, affordable and … sustainable!
When looking at scope 3 emissions, we cannot only rely on product reformulations and innovations. We therefore also engaged with our direct suppliers and looked at the entire value chain to unlock opportunities for a more sustainable and lower footprint future.
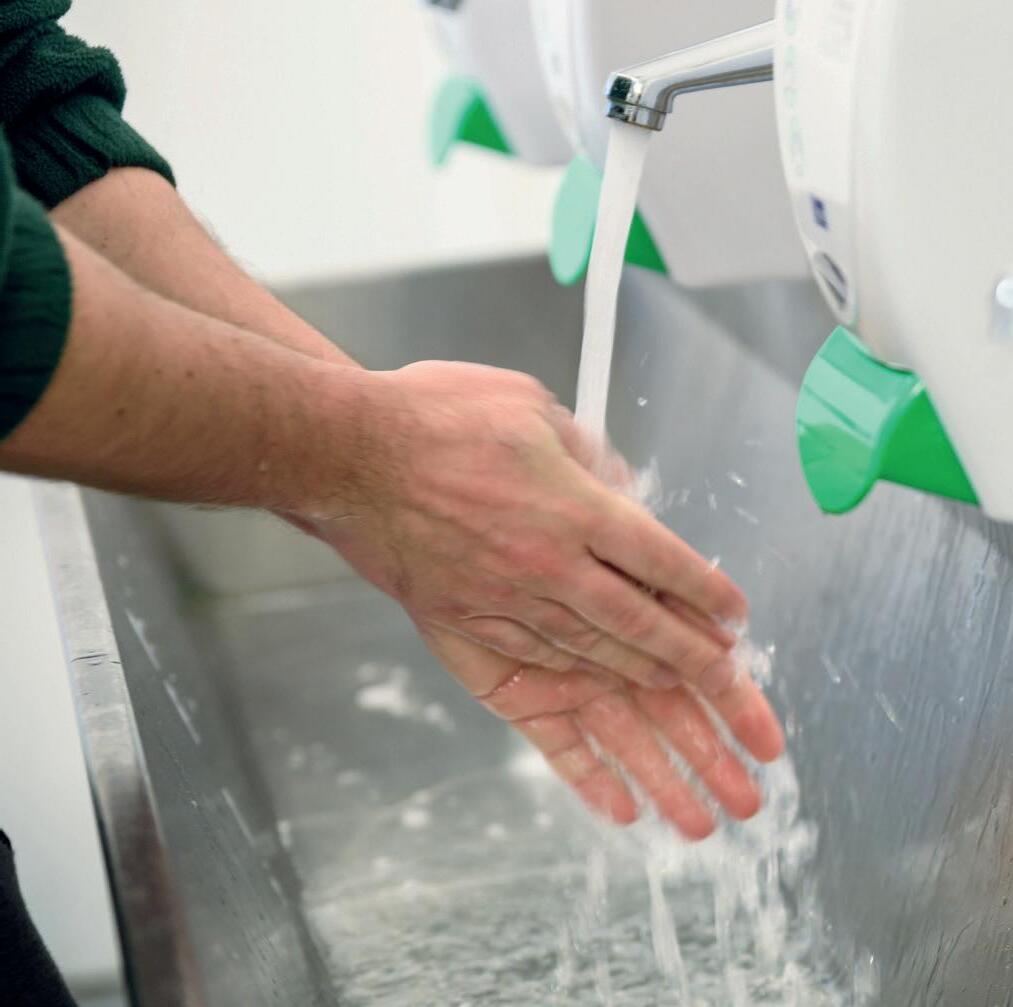
Looking only at our suppliers and scope 3 would be too easy, so we have also made good progress in reducing our own scope 1 & 2 emissions. We purchased 50% green energy in 2023 with the goal to make that 100% from 2024, and have developed plans to start reducing water usage per kg product sold.
What’s Cooking? Annual report 2023 25
Chief Financial Officer
Every bit counts & everyone can be part of the journey!
Even when our focus is very much on climate change as our most ‘material’ topic, when it comes to sustainability – every bit helps. Making sustainability ‘second nature’ requires a certain mindset. I am incredibly proud of the realizations by the different ESG ambassadors and the workstream teams that have really made sustainability top of mind within our Group. From the Board installing a sustainability committee and the implementation of a governance model to a team-driven event for a charity of choice, to a river cleanup action or the implementation of food waste reduction initiatives…. every bit helps and everyone can contribute to it.
‘Sustainable’ does not always mean ‘more expensive’
A common misconception is that ‘sustainable’ equals ‘expensive’. This is simply not true and our teams have demonstrated it. Indeed, certain sustainability improvements will require investments or are more expensive. Nevertheless, there are a huge number of improvements that can be implemented at lower or equal cost to the consumer. However, it sometimes takes courage to lead AND to take the consumer along the journey. At What’s Cooking? the sustainability ‘menu card’ is our tool to create a dialogue with our customers in order to jointly reach our common goal towards Science based targets initiative (SBTI) compliance AND to provide a more sustainable world for future generations. Want to find out more? Do ask us: “What’s Cooking?” and have a look at our Sustainability reporting.
Performance is key
In order to be able to execute our strategy, performance both short term and longer term is key. It provides the oxygen we need to invest in new technologies, new packaging, new processes, innovative products AND our people. It allows us to reach the com-
mon goals of What’s Cooking? at its customers: serve consumers delicious, nutritious, sustainable and affordable products.
Despite significant salary and ingredient inflation, our new strategy already started showing benefits and our EBITDA results improved. We had to e.g. adjust our footprint in the Netherlands and close our Aalsmeer site and we believe that this ultimately makes us stronger. We invested in newer technologies at our other facilities which will allow us to deliver superior quality and taste, and reduce our overall costs.
We are optimistic about the future, but remain vigilant in this VUCA world. We need to stay sharp and keep focusing on sustainable profitable growth and cost efficiency in order to realize our organic growth plan.
Net debt reduction & refinancing
We were able to reduce our net debt further and ultimately refinance the business early 2024. This will allow us to put full focus on the development of our strategic pillars and our long-term financial plans.
Ultimately, people make all the difference
Ultimately, whether it is financial performance or sustainability, people make the difference. Day by day, side by side, about 3000 colleagues have shaped 2023 to what it has become. A special thank you to these colleagues as well as all our stakeholders who embraced the new strategy and are going the extra mile every day to jointly ‘Cooking up a Better World’!
Yves Regniers
CFO
26 What’s Cooking? Annual report 2023 Chief Financial Officer

What’s Cooking? Annual report 2023 27 Chief Financial Officer
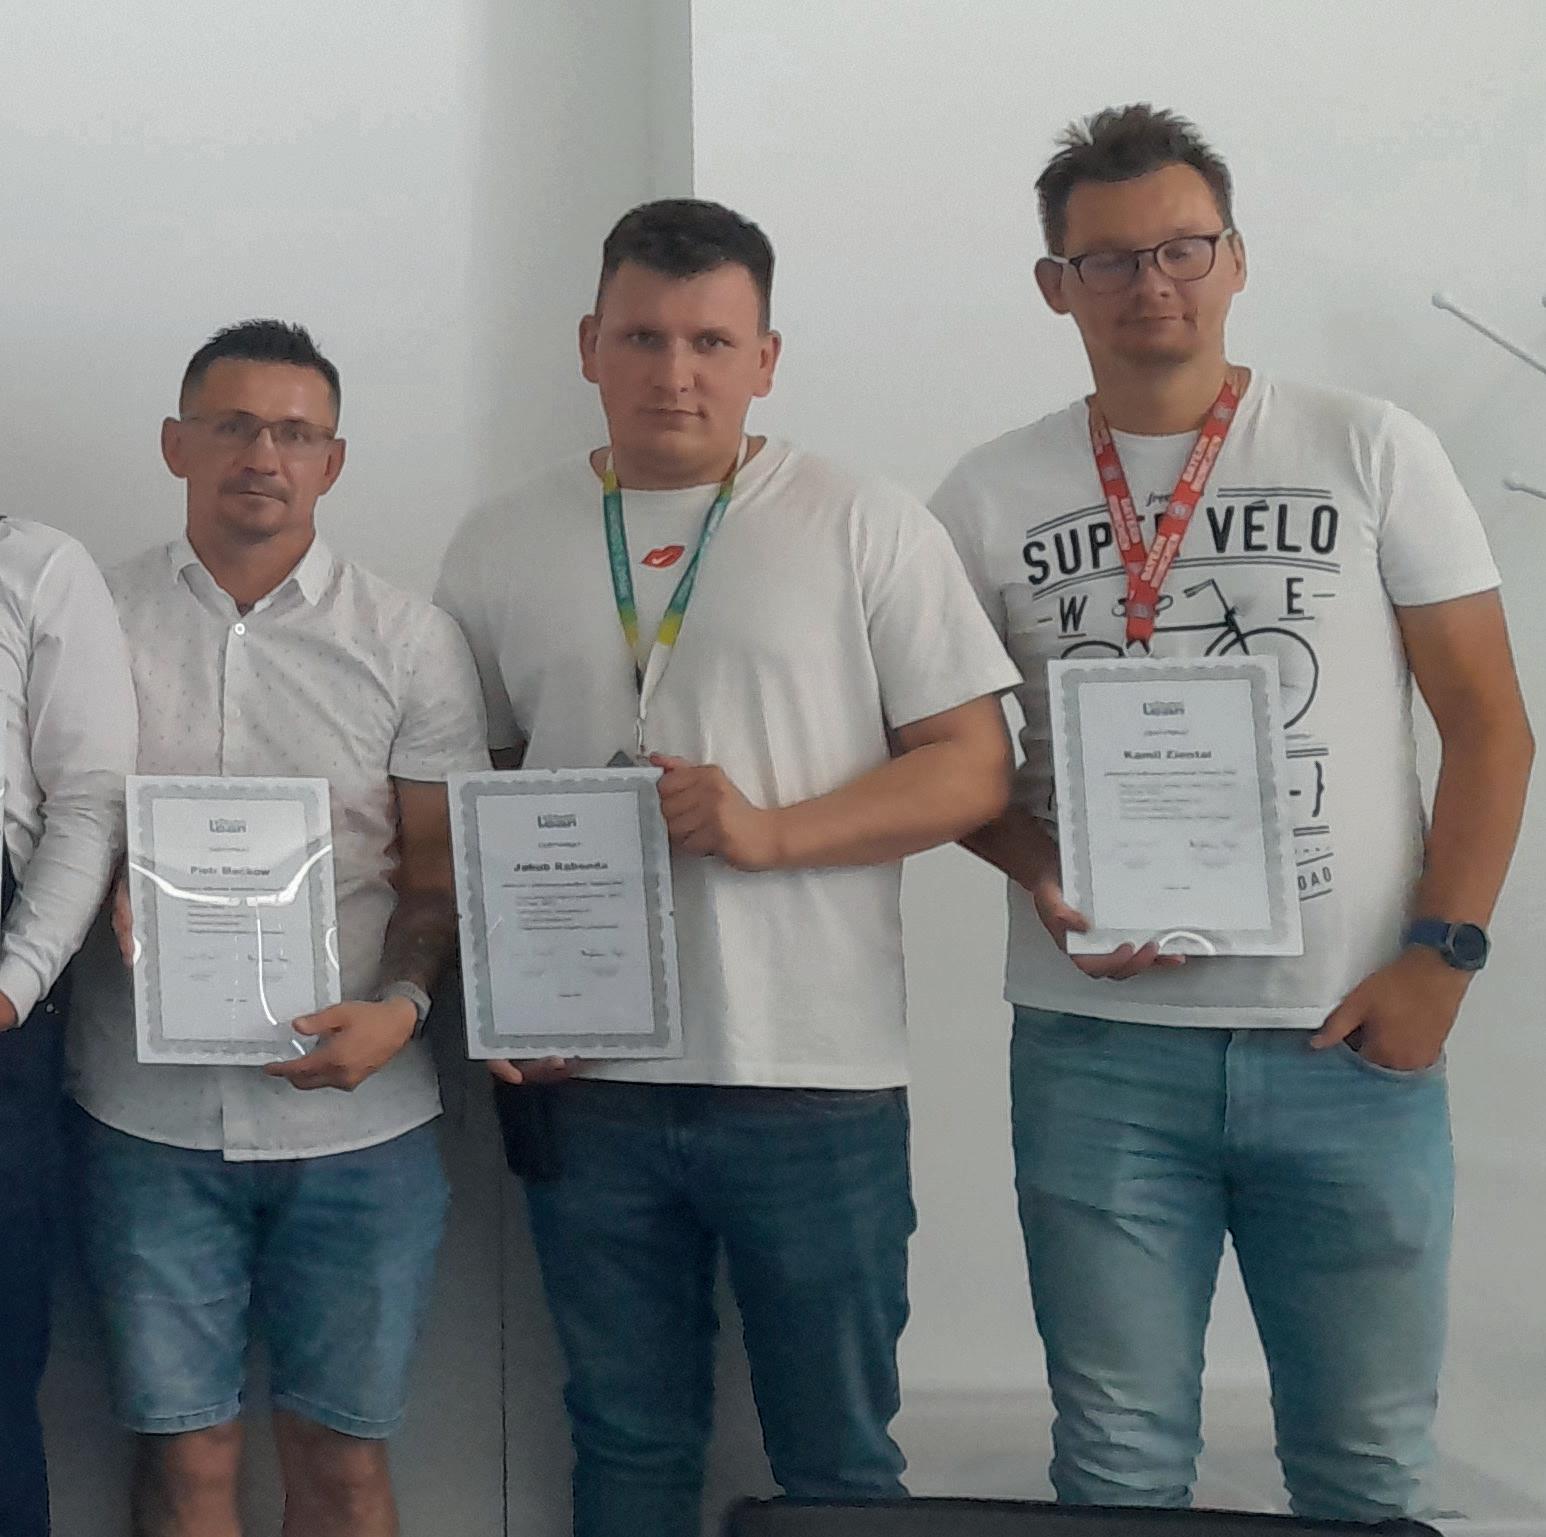
Engaged Employees
Empowering Employees through Lean Management
At What’s Cooking? our purpose is to ‘make sustainable food consumption second nature’. As a food producer we aim to have a real, lasting impact on eating habits, and to do so we need empowered and engaged employees. Empowering is not an overnight change; it’s a journey that requires time, commitment and a fundamental shift in organizational culture.
Lean Manufacturing
In the What’s Cooking Polska plant in Opole and to stir this strategic transformation in the mindset, we have decided to follow the Lean Manufacturing philosophy. This powerful method, rooted in efficiency and continuous improvement, not only streamlines processes but also helps to build strong engagement. It gives employees the tools, authority and autonomy to make decisions, contribute ideas, and take ownership of their work.
Opole journey
Before we started the Lean journey in Opole, the organization had followed a more traditional leadership model. Decision-making was centralized, communication moved downward and there were limited interactions outside the designated functions or departments. It was clear that this model would not be efficient
for turbulent times in a VUCA world where organizations need to adapt quickly to changing conditions.
Communication
One of the principles of Lean management is the establishment of open communication channels. In Opole, we introduced the system of regular meetings on all levels of organization. We involved those who know the best how to craft with care being our operators, technicians, warehouseman. The short agenda of the meetings is focused on analyzing current results and solving problems. Thanks to this changed approach, the meetings activated cooperation between departments and helped to build a clear escalation flow.
Decision-Making
By giving employees a platform to voice their ideas, by encouraging them to identify problems and implement solutions, day by day a sense of ownership and responsibility is created. Thanks to visual management boards which were introduced in the meeting spots and in the working areas, daily results are now available to everyone who is accountable for them. This helps employees to feel more connected to the success of the organization and allows them to experience the value of working together as one team, side by side
What’s Cooking? Annual report 2023 28 Strategic Beliefs
Development Opportunities
Lean management emphasizes the continuous development of skills and knowledge. In the Opole plant, we organize numerous workshops on Lean principles and methods. In addition, employees are equipped with tools which can be easily used at work and also applied in private life. A good example is the Lean approach to problem solving. It shows, how in a systematic way, with use of PDCA (Plan, Do, Check, Act), 5-Why analysis or Fishbone diagram techniques, problems can be addressed and solved.
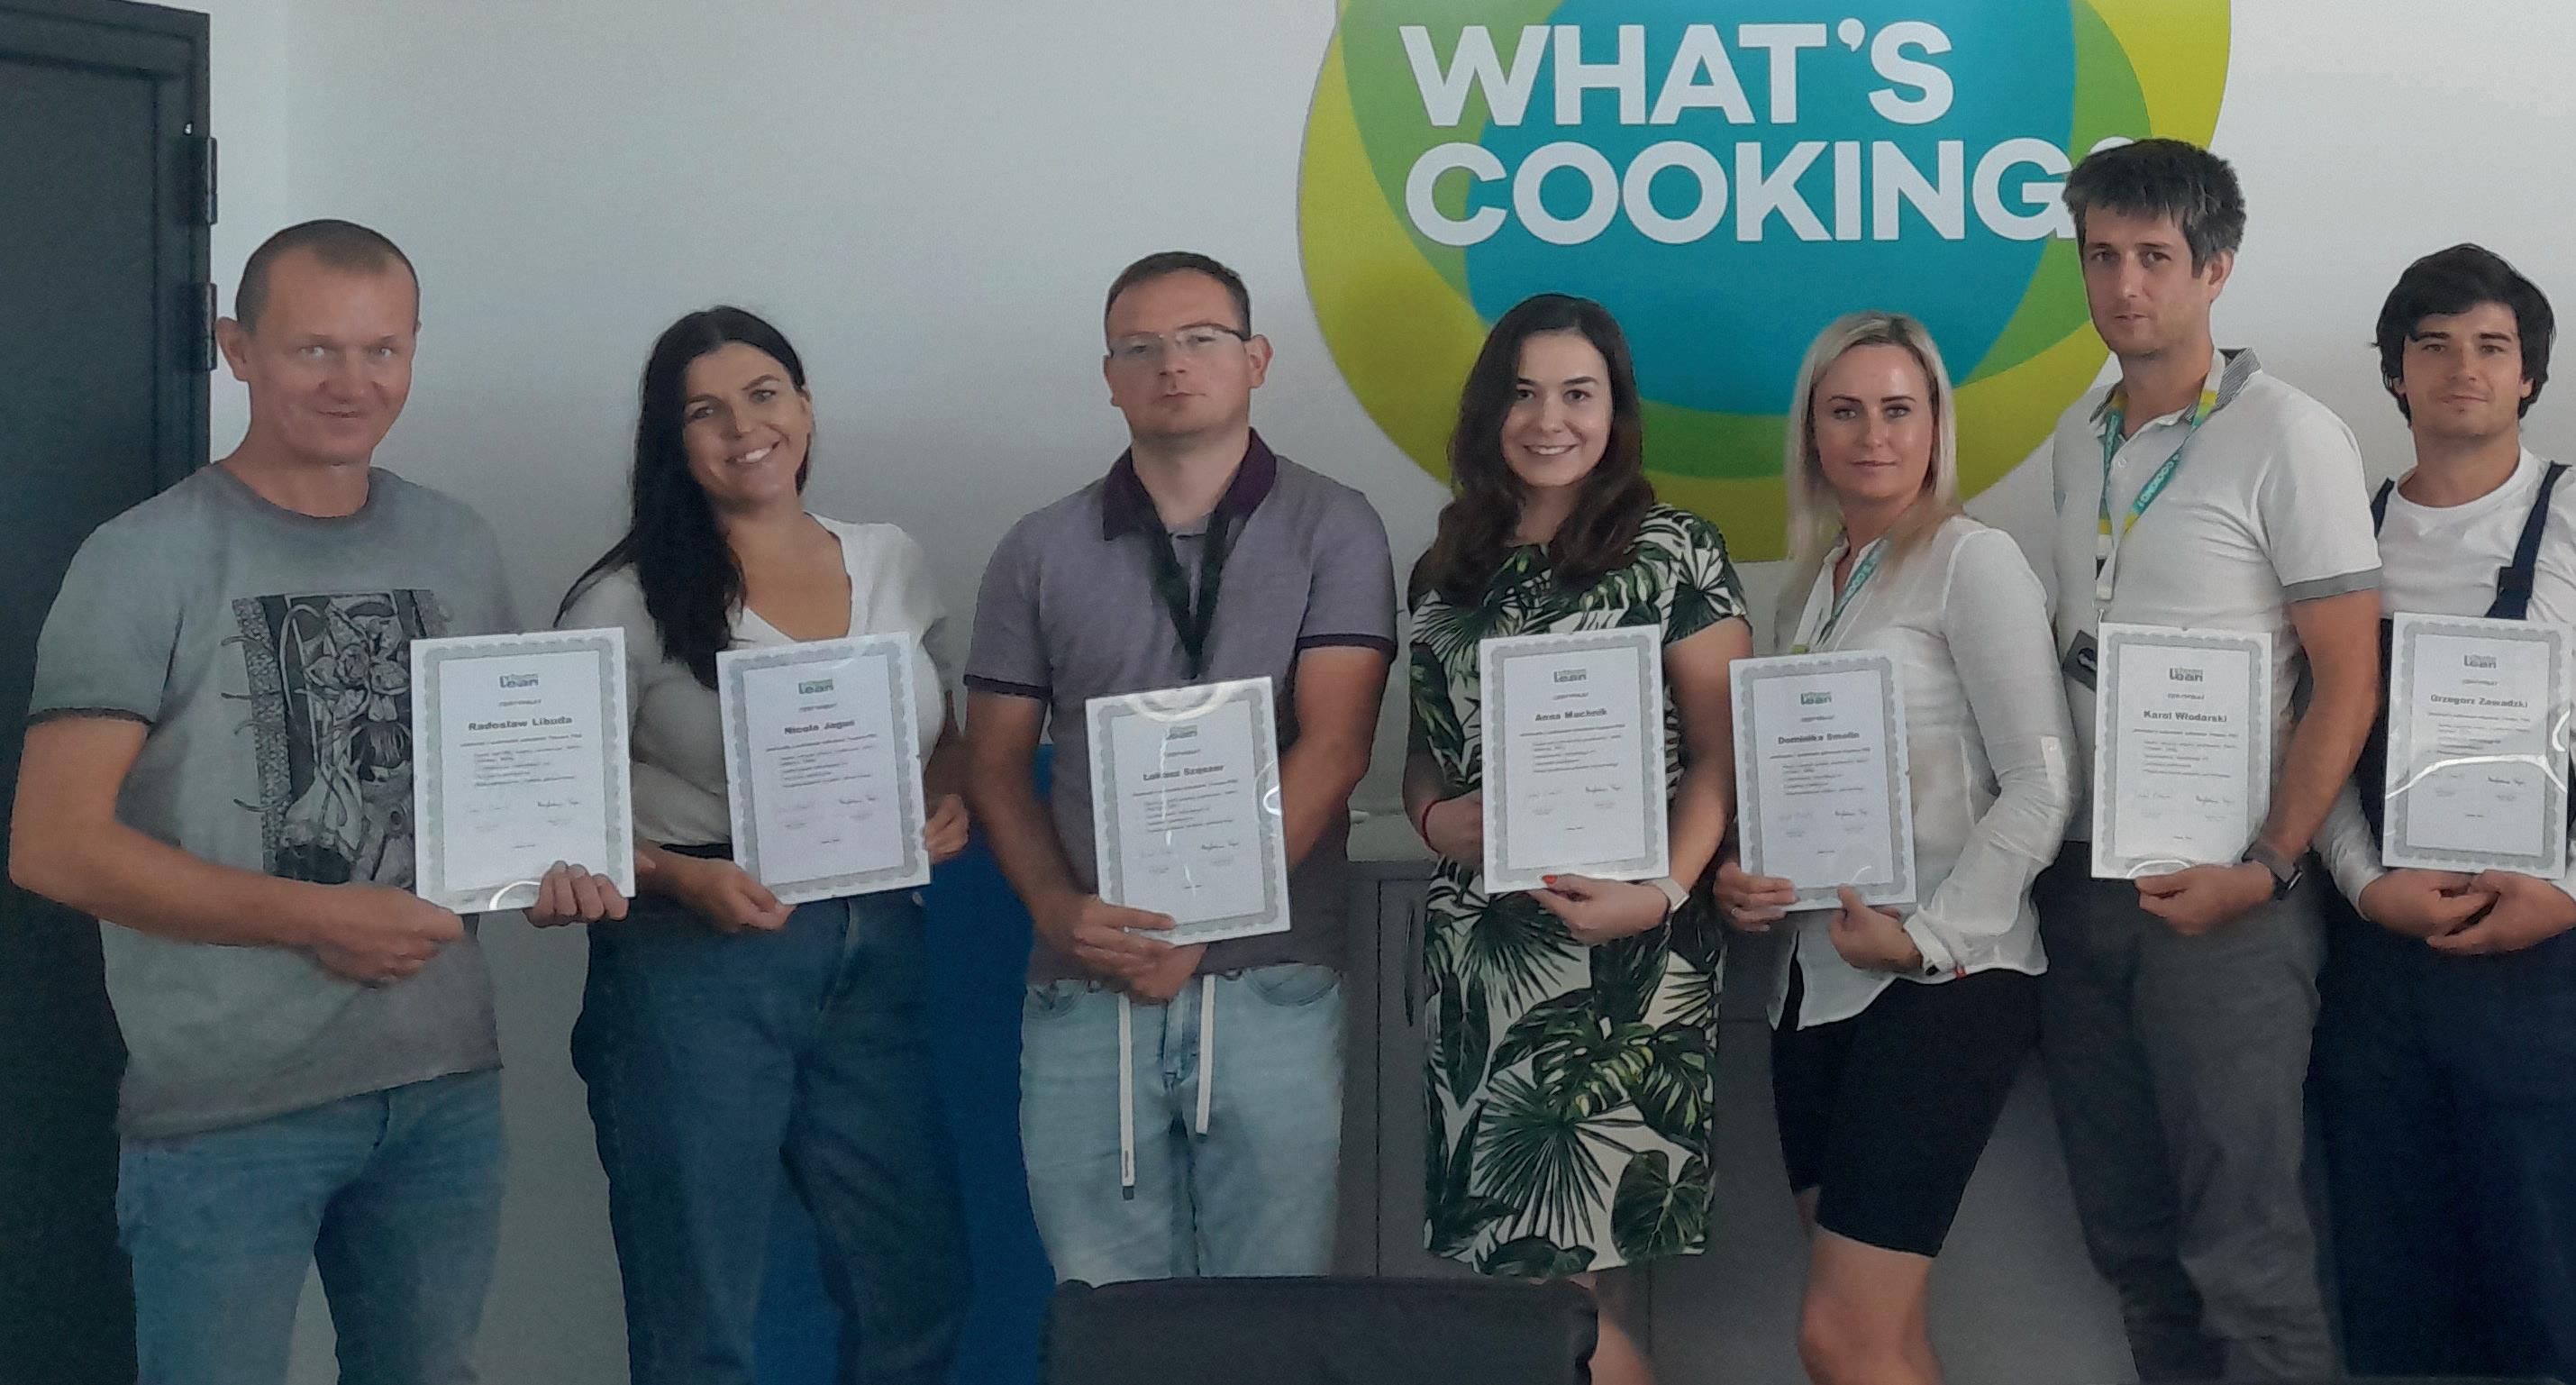
Because employees become used at practicing these techniques, they feel more in control of their work environment and issues they may come across. This empowers them to take on more responsibilities, often outside their comfort zone or departmental duties. They become confident & courageous to go an extra mile. In Opole, we have great examples of employees becoming internal trainers or project leaders, contributing a lot to the overall success of Lean Manufacturing initiatives.
Recognition & Appreciation

often celebrated with treats and always with a big round of applause. But even small gestures such as a handshake or just a ‘thank you’ can be very powerful. This all helps to install a sense of pride and accomplishment amongst employees.
Win-win
Recognition is an essential component of the Lean culture. As teams achieve milestones or make significant contributions, their efforts should be acknowledged. In Opole, team successes are
The Lean Manufacturing approach clearly delivers advantages for both the company and its employees. The plant benefits directly from higher productivity and effectiveness across nationalities and with respect of diversity. The employees get a more harmonious and collaborative work environment. Because they feel entrusted and valued, they also actively contribute to even higher standards for product quality, safety and innovation.
Dagmara Sikorska HR Manager
What’s Cooking Polska
What’s Cooking? Annual report 2023 29
What’s Cooking? Annual report 2023 30

Rebuild Innovation
Yes, we pack more sustainable!
With an R&D team of packaging specialists, What’s Cooking? is working full-time to improve and innovate its packaging. This is because packaging plays a crucial role in the shelf life of our products and attracts consumers’ first attention in the supermarket.
In addition, packaging is of great importance in conveying information to consumers so that safe, e.g. before the end of the BBD, consumption takes place. This is another way we contribute to ‘good food for all’! In addition to these functional properties, another important pillar has been added in recent years that has received a lot of attention: ‘Protect our planet’.
Reduce
For the ‘Protect our planet’ pillar, important steps have been taken and continue to be taken ‘day by day’ to meet the What’s Cooking? targets for 2025-2030. As a first step, we worked on reducing our packaging material, using thinner or lighter materials or even omitting packaging components altogether. After all, by 2025 we want to have reduced packaging material by 20% compared to 2020! To achieve this, we introduced an innovative packaging concept in 2023 that reduces plastic by more than 50% compared to the existing packaging, for example by completely omitting the ‘tray’.

Circular economy
Besides reducing packaging, we also worked on making our packaging circular by no longer using fossil fuels. An example is paper packaging or bio-plastics. These new materials must not compromise on the quality and food safety of our products and must therefore go through a strict selection procedure. More to come!
Recycle
Until packaging is fully circular (yet), it should at least be 100% recycle-ready. We have therefore set this as our goal by 2030. To achieve this, in 2023 we introduced, among other things, a full PP frankfurter packaging that is also 70% lighter than its predecessor. In addition, all our meat ‘Freshpack’ trays have been converted to the highly recyclable RPET.
Carbon footprint?
We are aware that packaging is only responsible for about 5% of the carbon footprint of the total product. With this, the shelf life and resealability of our packaging is of great importance, which will continue to prevent food waste in 2023 and beyond . As a result, we are once again contributing to continuously reducing our carbon footprint.
Brecht Vanlerberghe, Chief Research & Innovation Officer
31 What’s Cooking? Annual report 2023 Strategic Beliefs
Rebuild Innovation
Making sustainable food consumption second nature: an exciting and educational R&D journey!
From R&D product innovation, we are working hard to help deliver on our What’s Cooking? mission around sustainable food consumption. This was in 2023 and remains a very challenging but also exciting and educational journey and certainly for R&D.
What’s Cooking? set the goal of getting at least 15% of its volume from vegetarian or plant-based products by 2030. Those products must be nutritious, safe and comply with all legal guidelines in addition to being tasty. A challenging journey with the noble aim of making sustainable food consumption “second nature”. A challenge that, together with the R&D team, we gladly took up in 2023.
Our focus is largely on developing plant-based options within Savoury and Ready Meals. The biggest challenge is to develop a plant-based variation that scores well on all sensory criteria (taste, texture, dryness, smoothness) and also scores equal or better in terms of price, nutritional value and sustainability compared to the animal-based product.
Finding the right balance between different ingredients is a complex puzzle. What’s Cooking? is fully committed to research and development: we started with the necessary investments and we entered into partnerships with research institutes. Among other things, we recently invested in a rheometer. Rheology helps us understand how plant proteins and other functional components behave under different conditions during the production process, such as shear stress and temperature. This knowledge is crucial in the development and production of plant-based savoury and prepared meals. Less conventional alternatives to animal proteins such as algae, seaweed or fungal proteins also went along with the research.


We also discovered opportunities for blended products. These too have potential to reduce the carbon footprint of traditional pro ducts. These are products made from a combination of plant and animal ingredients. The aim is to combine the benefits of both to create a more sustainable yet healthier product. We took a multidisciplinary approach to the development of blended products, from recipe formulation and selecting the right ingredients to assessing the nutritional value, taste, texture and sustainability of the product.
We are fully committed to improving existing and developing new products that contribute to a balanced diet. This means that most of our products can be part of a healthy varied (bread) meal, including the right portions of macronutrients (carbohydrates, proteins and fats), fibre, essential vitamins and minerals. In addition, we have been and are actively working on reducing the sodium content and saturated fats in our products.
Contributing to our mission brings new challenges and surprises almost every day. It is a fascinating journey that enriches us with a wealth of knowledge and experience. A journey that brings us closer every day to a more sustainable food consumption and planet. Knowing that we can contribute to this is knowing that we are doing something good for people, animals and planet!
Elke De Witte R&D Manager, Savoury
Fanny Nguyen R&D Manager, Ready Meals
What’s Cooking? Annual report 2023 32 Strategic Beliefs

What’s Cooking? Annual report 2023 33

Portfolio Refocus
Shaping of the portfolio of the future
34 What’s Cooking? Annual report 2023
Beliefs
Strategic

A world changing faster than ever, but a clear target for us
If the world is changing faster than you, you are on your way to oblivion. A sentence that has never been so challenging. The world has been shaken last years by one crisis after the other, resulting in an accelerated pace of change.
Relying on our new company purpose and strategy, we are shaping a future proof product portfolio. Each development always starts with a close analysis of the consumer trends of tomorrow and beyond, with one clear goal: ‘we want to make sustainable food consumption second nature’.
Emergence of eco-activism and search for a better me
Next to digitalization, urbanization, rise of single households or the increasing need for convenience solutions, there are two overarching trends that perfectly fit our strategy : the ‘emergence of eco-active consumers’ and the ‘search for a better me’. Those two trends are clearly translated into our sustainability strategy: with “good food for all” and “protect our planet” we have two strong pillars that are driving the creation of our future proof portfolio.
New value propositions without compromises on taste & convenience
As a team, we aim at creating value propositions that in terms of footprint, nutritional composition, formulation and packaging are inspiring our customers without ever compromising on the two main drivers of our categories: taste & convenience.
In order to do so, we invested in tools allowing us to measure our footprint but also in our own people, creating workshops to develop and align our internal forces and craftsmanship.
Offering consumers a choice…
All our market researches are showing that a significant part of the consumers are consciously decreasing their meat consumption. They are driven by health reasons, animal welfare or environmental motivations. But like for all major disruptions, the consumer needs help and guidance without any compromise on taste.
We are convinced that by serving those consumers an accessible, recognizable and affordable delicious plant-based range of products, we support them in their succeeding in their transition and facilitating their choice.
Doesn’t mean cutting off meat!
Although decreasing meat consumption, a lot of consumers are not aiming at totally cutting off meat. We believe in a future with a more varied diet combining plant-based and meat proteins, or for those who really want only plant-based. Next to our plantbased developments, we are also working on improving the nutritional composition and environmental impact of our current range and creating new strong concepts.
Making sustainable food consumption second nature
Realizing our purpose day by day is what’s driving our portfolio strategy in 2023 and future developments. We don’t believe in a huge shift towards plant-based. We believe in variation and in small steps. Side by side with our customers, we can unburden the consumers, making their choice for a more sustainable food consumption an easy one. It’s the sum of all the small steps by everyone that will make a gigantic difference in the future.
Cédric Lemineur Marketing & Development Director, Ready Meals
Greet Van Laecke New Business Development Director
What’s Cooking? Annual report 2023 35
Grow Excellence
Come a casa®: from a Belgian love brand to an international brand with a soul
Anticipating a challenging year for A-brands in a economical context where the households’ purchase power would be under pressure, we worked out two main topics for our Come a casa® brand: the reinforcement of our brand in Belgium and the set-up of a development framework ensuring sustainable organic growth for the coming years.

’t leven is wat je ervan smaakt!
In Belgium, by consistently delivering the best lasagna experience, supported by our strong platform “’t leven is wat je ervan smaakt” (‘life is what you taste of it’), our brand stand was strong maintaining its market share in a context where shoppers were downtrading to save money. With 86% brand awareness and one in four Belgians regularly consuming our Come a casa® it is clearly confirmed to be a love brand in Belgium.
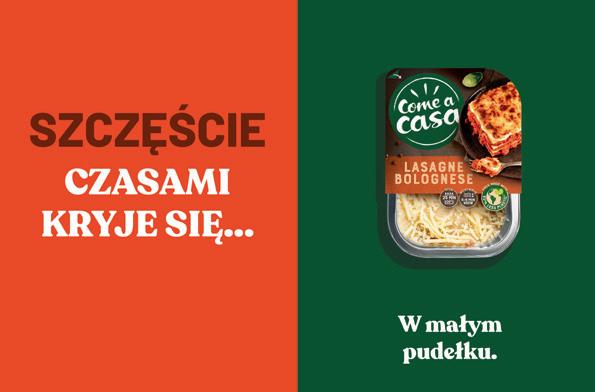
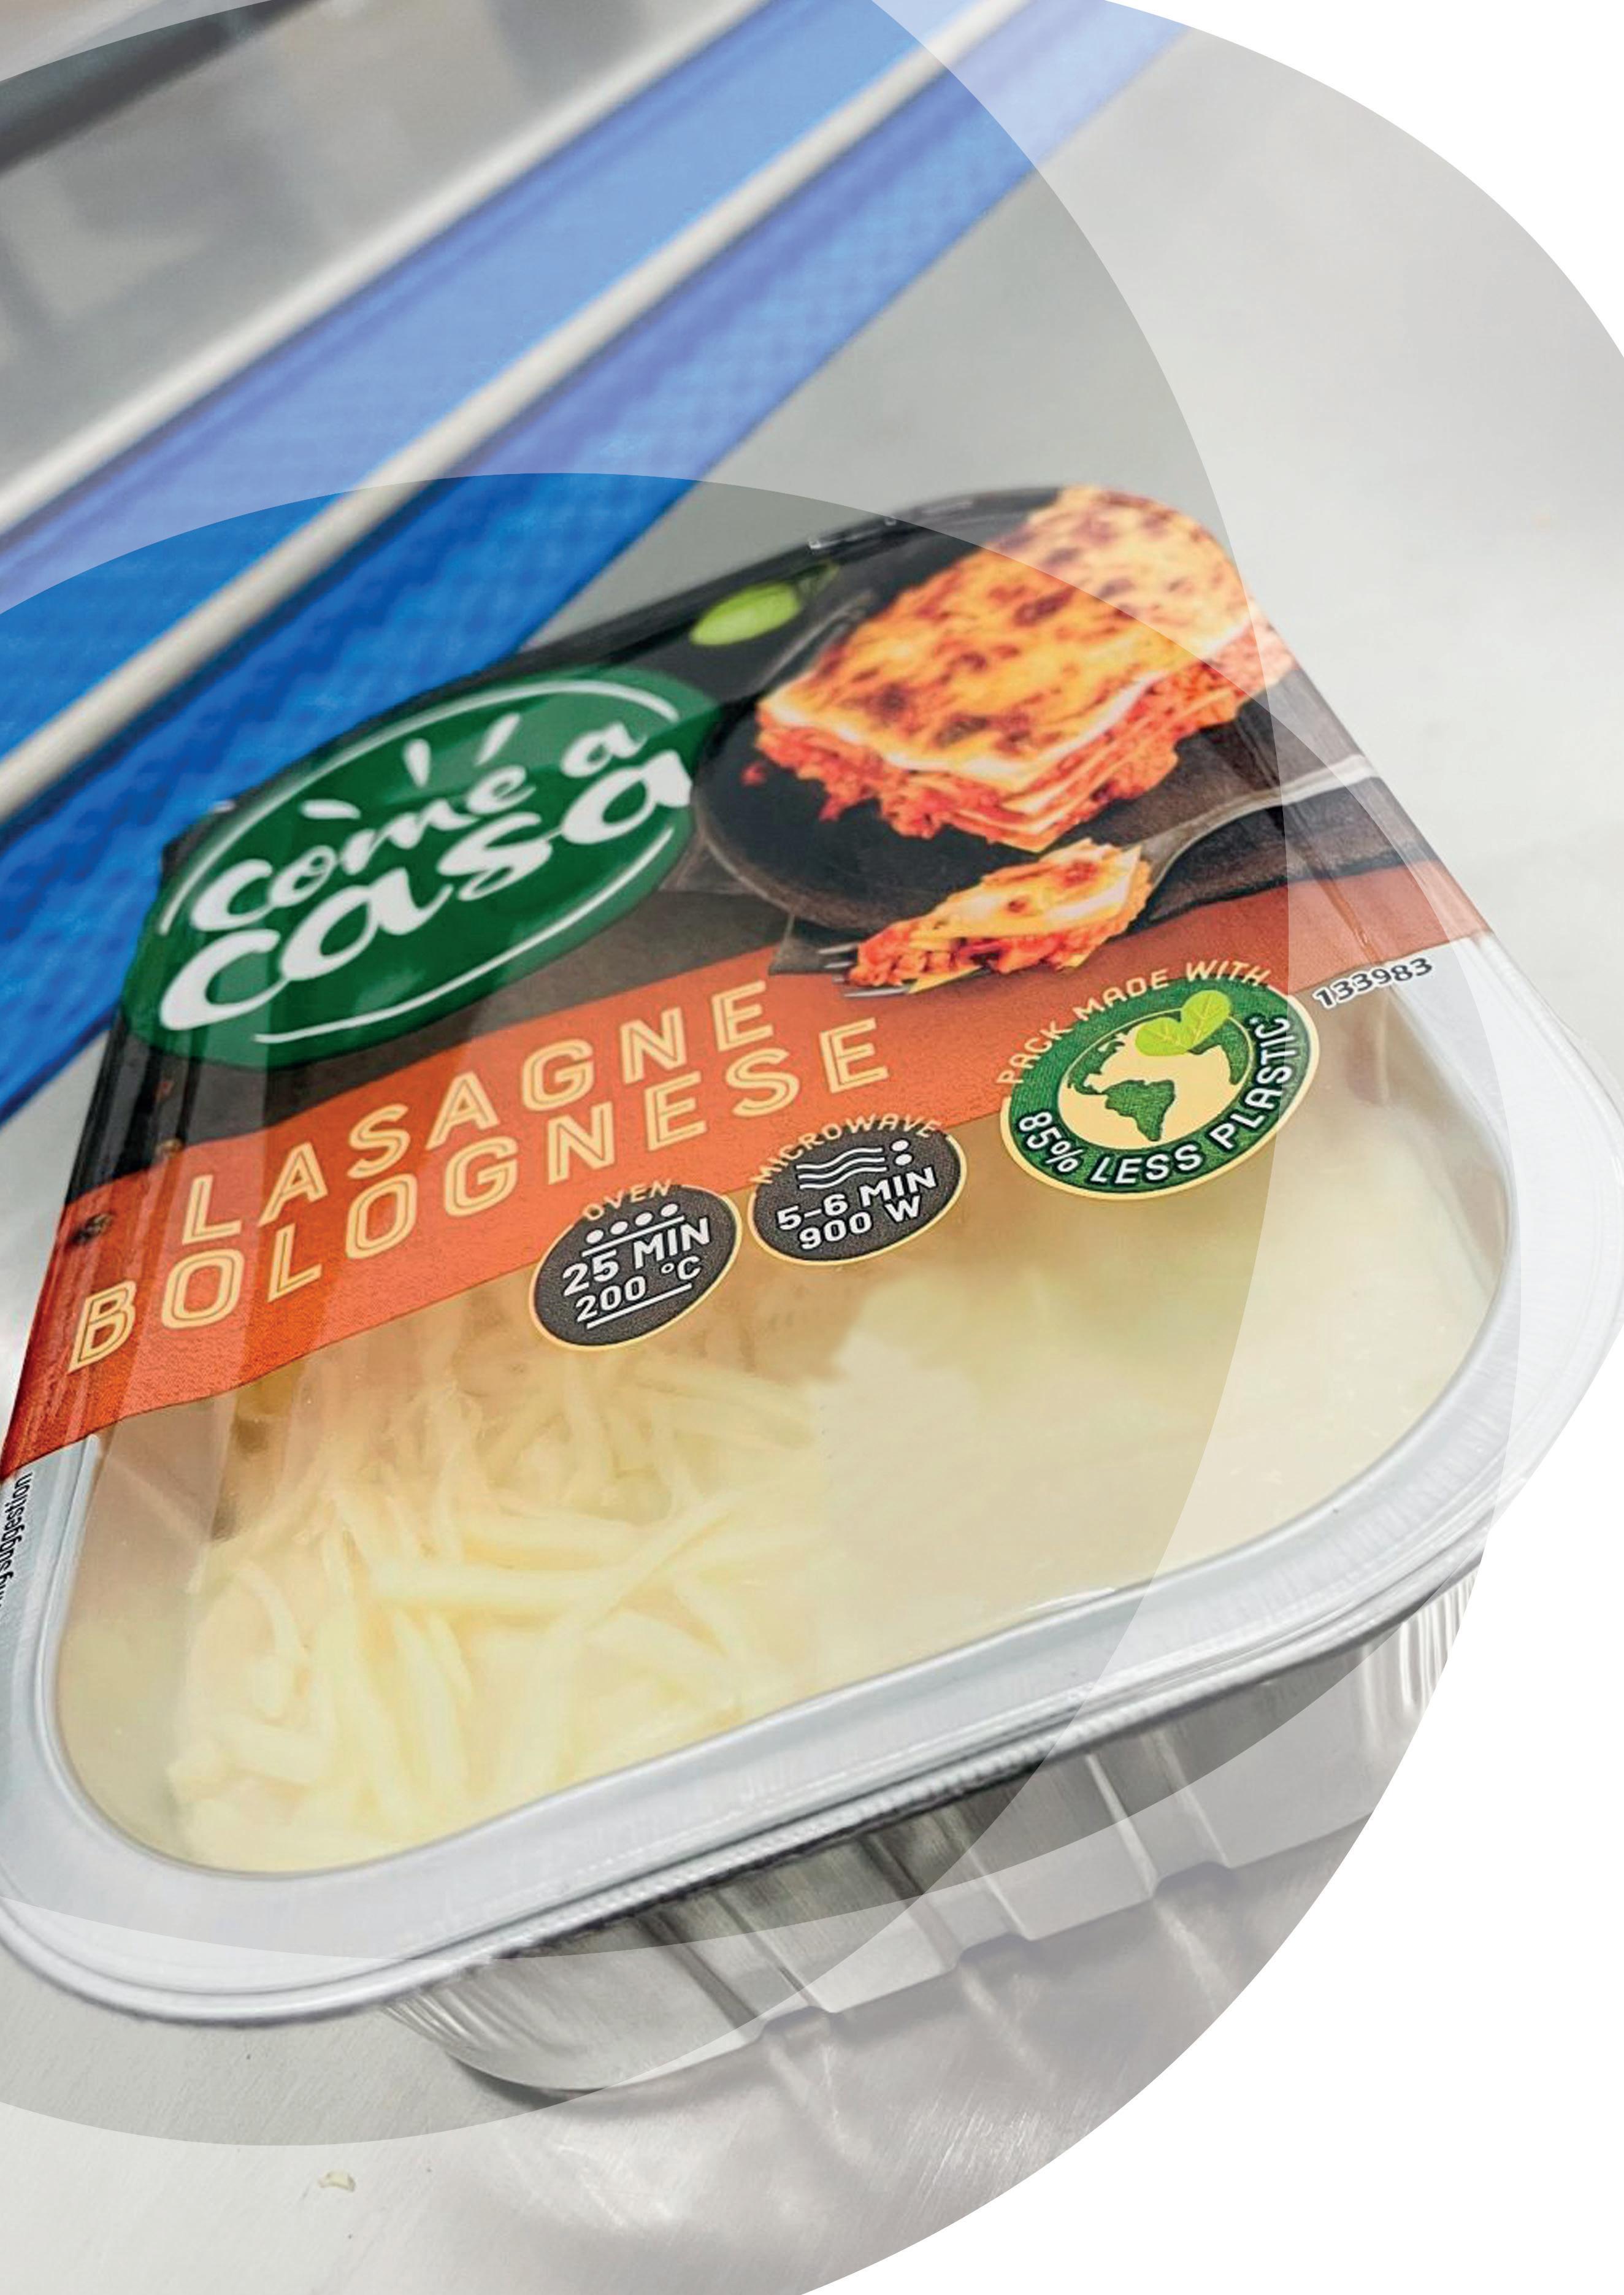
In the meantime, we also started to roll-out our growth plan in Central and Eastern Europe with Poland as first country, aiming at becoming Poland’s favorite and most convenient Ready Meals brand with innovative packaging, tasty products and excellent distribution:
• Our packaging has been adapted to better answer the market’s expectations both in terms of sustainability (top seal with 85% less plastic) as well as design with a look & feel close to the heart of the regional consumers.
• Our existing hero product being the lasagna Bolognese was already loved since years by the Polish consumers. Next to this, we have launched three pasta meals and have filled our pipeline with four other recipes, all of them validated by our consumer panel

• To ensure the accessibility of our product range, plans have been shared with all retailers and dedicated listings were organized in order to ensure the right distribution for our tasty brand with a soul.
Now these basics were set right, we became ready to boost our brand in Poland with a strong 360° marketing plan for the first time outside Belgium, also including television and supported by both digital and physical brand activation with hopefully high product rotations going forward.
What’s Cooking? Annual report 2023 36 Strategic Beliefs
NEW
Overall our Come a casa® brand does contribute to our new strategic framework: Good Food – Good Mood. Next to the existing pillars of pleasure and convenience, continuous improvement with innovations and renovations is part of our Come a casa® sustainability ambition: ensuring that our flagship brand, day by day helps us to reach our ambition of making sustainable food consumption second nature.
Trends in foodservice
A food service with more and more plant-based What used to be an exception in the past, becomes an absolute must-have for all restaurants: plant-based dishes on the menu. With the remarkable shift in eating habits, the amount or flexitarians, vegetarians and vegans has strongly increased. Not having a meat-free alternative on the menu means often …losing customers. And yes, with Come a casa® we provide such varied choice to the consumer.
Also more sustainable
Foodservice cannot ignore the raise of the eco-conscious consumers. With three European consumers out of four being worried about climate change and 64%² of the consumers planning to purchase more sustainably in the future, such is without any doubt changing the way foodservice is run.
Foodservice is not only offering alternative menus but also adopting more eco-friendly practices – think about our ready-to-heat packaging with less plastic – AND by challenging their suppliers with strong focus on reducing (food) waste with initiatives like for instance Too Good to Go to which What’s Cooking also participates.
Multi-cultural and fusion
Cultural diversity continues to expand driven by the European resident travelling, other nationalities joining Europe, and also a wider access to media from all over the world through streaming platforms e.g. squid game on Netflix. Consumers and chefs papilla’s are triggered by new taste and recipes that they either directly integrate in their menus or combine with global flavors to create fusion dishes, and we do support foodservice by offering our creative new Ready Meals dishes at an affordable price.
Workers wanted
Manpower is key: labor is becoming a key challenge for the foodservice industry. How to maintain the overall customer experience while the hands available to work are scarce. With the right technology making easy-to-make, tasty and nutritional balanced dishes is a key asset towards the future and we are tapping into it.
2. GFK Consumer life 2022
Sophie Verschraegen Product Development Manager, Ready Meals
Cédric Lemineur Marketing & Development Director, Ready Meals
37 What’s Cooking? Annual report 2023
What’s Cooking? Annual report 2023 38
Safety at work & wellbeing Grow
Excellence
We want our employees to go home safely to their loved ones
We are crafting with care, care by crafting and do care our people. We want each of them to go home safely to their loved ones.
Using the affective approach is the most effective one in order to cross the safety messages and train the relevant behavior to our employees. The affective approach is effective because most of our decisions are driven by passed experiences and the emotions associated with them.
Feelings and emotions often provide the basis for human reasoning. That is why we want to bring safety ‘through the heart to the head’ in order to change behavior around safety.
We want our people to make the right decisions when it comes to occupational health & safety. Key to this objective is to onboard our employees and contractors in such a way they feel the importance that we give to their safety.
The words ‘see’-‘say’-‘stop’ continue to be the illustration of our verbal warnings to avoid incidents.
Each incident is preventable: safety education rooms
Last year we started to deploy our safety rooms at our factories. The safety room is a large room where new employees and contractors come together before they go into the factory to work. The room has about 12 posters that tell a story about why safety and food safety is important and what we expect from employees to keep each other safe.
The room has no chairs but standing tables only, the session takes 30-45 minutes. The intent is that the team leader that will lead the employees in the factory, is facilitating the interactive session.
The first poster is a poster with two kids, asking the question: ‘What time will you be home tonight?’ From this moment on, the safety conversation is different than normal onboarding intro-
ductions; it is not only about rules and regulations, but we try to touch the newcomers by talking about the ‘why of safety’
This affective way of communicating will help us to achieve our objective that all employees and contractors go home safely to their loved ones.
Frans- Jozef Jaspers Group Director EHS
What’s Cooking? Annual report 2023 39 Strategic Beliefs
Grow Excellence
Food Safety & Quality
We are committed to guarantee our customers and consumers the safety of the food we produce as well as their quality expectations.
Our employees play a major role
Our employees play a leading role in the application of food safety and quality practices.
Through regular training, we strengthen their skills and develop their commitment and responsibilities.
The aim is to encourage our people to continuously monitor our activities and take advantage of their feedback to improve our operations for the better.
Distributing safe products...
Objectives and indicators are defined to assess the effectiveness of strategic processes, good practices, efficient cleaning, manage product microbiology, etc.
The results are analysed at monthly steering meetings: the effectiveness of the corrective actions are checked, emerging issues are identified and additional solutions are decided and implemented.
Digital tools to optimise our procedures, issues management, cleaning, improvements to technical facilities, new equipment etc. are reviewed and further upgraded this year.
...and top quality
Our customers’ requirements as well as our own requirements towards our suppliers are identified and set out in contractual documents and charters.
Our suppliers
• The revised referencing process strengthens the assessment of the supplier’s ability to deliver materials that meet our needs;
• aterials are checked to assess their conformity, and action is taken with suppliers in the event of discrepancies;
• New software will compile contractual and control data to measure a supplier’s performance. This will make it possible to target situations with eventually a search for an alternative;


What’s Cooking? Annual report 2023 40 Strategic Beliefs
In our workshops, thanks to formalised internal instructions and inspection programmes, we ensure that the expected characteristics are met at every stage of the manufacturing process.
In addition, more advanced product tasting programmes have been initiated. Our teams assess whether the products comply with the expected taste, texture and ingredients. If there are any discrepancies, they use their expertise to make the necessary corrections.
Side by side, through active communication of expectations, gaps and successes, we encourage the sharing of experiences and thus the continuous improvement of our system.
Day by day, many projects were carried out in 2023 to further guarantee the safety and quality of our products. This approach will continue in 2024.
Laurence Caillot Quality Manager, Ready Meals


41 What’s Cooking? Annual report 2023
Nutritional Policy
Day by day, we make sustainable food consumption second nature by increasing the appetite for delicious, convenient food with care for both people and planet.
What’s Cooking? is committed to producing affordable, high-quality savoury cold cuts, snacking and ready meals that not only delight our customers with their taste and convenience but also fit in a varied and balanced diet. We believe that more of the good things, less of bad things is essential, and we are dedicated to providing high-quality products that continuously improve their nutritional relevance, and do meet or exceed our nutritional standards.
This Nutritional Policy outlines our commitment to nutritional targets that are operational objectives for product renovation and innovation and are applicable to the whole What’s Cooking? portfolio across geographies and populations. They are based on nutrition science, take into account technical feasibility, and the customer and consumer acceptance journey while also adhering to regulatory guidelines.
Nutritional Targets
Specific criteria determine the What’s Cooking? Nutritional Targets:
1. The type of product: our What’s Cooking Nutritional Targets take into account the product type (savoury cold cuts, snacking, ready meals, plant-based options) by its place in food-based dietary guidelines such as food pyramids, eat-well plate and by its intended role in the diet;
2. The intended customer and consumer: our What’s Cooking Nutritional Targets are customized according to the mainstream needs and expectations of the consumer;
3. Prevailing Public Health Factors: in line with public health focusses, the following nutrients are generally included in our What’s Cooking? Nutritional Targets with maximum limits on energy (calories), sodium or salt, added sugars, total fat and/or saturated fatty acids.
4. An uncompromising principle: all criteria are equally important meaning that an excessive amount of nutrients to limit, cannot be compensated by the inclusion of higher amounts of nutrients to encourage.
Nutritional Target Guidelines
1. Balanced Nutrition: We are committed to creating products that provide varied and balanced nutrition, including appropriate portions of macronutrients (carbohydrates, proteins, and fats), fibers, vitamins and minerals (depending on category).
2. Sodium Control: We actively work to reduce the sodium in our products without compromising on taste and food safety. Excessive sodium intake is associated with health risks, and we aim to produce products that allows meeting nutritional recommendation for sodium/salt.
3. Saturated Fat Control: We actively work to reduce saturated fats in our products. High saturated fat intake is associated with health risks, and we aim to produce products that allows meeting nutritional recommendation for saturated fats.
4. Protein Content: We strive to include an appropriate amount of protein in our products, as it is an essential macronutrient for overall health and well-being as part of a varied and balanced diet while
taking into account total consumption of proteins per day of the average consumer. We are also committed to developing products with more sustainable and/or plant-based protein.
5. Dietary Fiber: We aim to include an adequate amount of dietary fiber in relevant product portfolios (e.g. ready meals) , as it is crucial for digestive health and overall well-being as part of a varied and balanced diet.
6. Allergen Awareness: We clearly label in full transparency the allergens present in our products in line with allergen labelling guidelines, helping those with food allergies to make informed choices.
7. Ingredient Transparency: We are committed to providing complete transparency about the ingredients used in our products, including non-confidential information about sourcing as well as quality, ethical and sustainability standards.
8. Portion Control: We provide clear information about recommended portion sizes on our packaging, helping consumers to make informed choices about their calorie and nutrient intake.
9. Reduced or Zero added/free Sugars: We actively work to avoid or at least reduce added sugars in our products, in line with dietary guidelines.
10. More Plant-Based options: We do develop and promote plantbased options for our traditional savoury cold cuts, snacking and ready meals bringing more plant-based on the plate of the consumer.
Quality Assurance
1. Ingredient Sourcing: We source high-quality ingredients, prioritizing sustainable and local options where possible in compliance with our Code of Business Conduct for Suppliers.
2. Food Safety: We adhere to strict food safety and hygiene standards, ensuring our products are safe for consumption.
3. Research and Development: We invest in research and development to create improved and new recipes that are both delicious and nutritionally balanced.
4. Nutritional Testing: Regular nutritional testing will be conducted ion our products to verufy their compliance with our nutritional guidelines.
Application to our Product portfolio
This policy applies to all products within the What’s Cooking? branded portfolio. For private label products produced in partnership with us, we encourage and advocate adherence to our What’s Cooking? Nutritional Policy. We believe that promoting and maintaining these Nutritional Targets do contribute to a varied and balanced life-style of our consumers.
Continuous Improvement
We understand that nutritional science is constantly evolving, and we commit to complement our knowledge about our products with the latest research and recommendations. What’s Cooking? Nutritional Targets will be regularly reviewed in the light of scientific innovation, as well as if the company’s product portfolio evolves.
Compliance with Regulations
We fully comply with all relevant regulations and guidelines governing the production and labeling of food products.
What’s Cooking? Annual report 2023 42 Our
Policies
FSQR Policy
At What’s Cooking? we believe that food safety is never to be compromised.
• We are crafting with care and delight our customers and consumers by putting quality top of mind.
• Confident and couragous, our people are key to our success by responsibly ensuring the production of food safe, high-quality products following applicable laws as well as our own standards and procedures. We speak up when we notice a non-compliance.
Day by day, side by side, our customers and consumers are central to all that we do. We apply transparent communication on product safety, quality and regutory matters both inter-nally and externally.
• What’s Cooking? management does provide the resources and support to adhere to this policy and to continuously improve our standards and procedures, in combination with independent integrity audits and GSFI recognised certification programs.
HSE Policy
At What’s Cooking? we believe that all incidents are preventable. Each of our employees should return home safely to their loved ones.
• We provide a work environment that promotes and safe guards the health, safety and wellbeing of our employees and contractors.
Our people are key to our success.
Day by day, we identify and manage risks. We continuously improve our safety standards, tools and methods.
• We are crafting with care, and are visibly ensuring safety side by side with our people, in all that we do.
• We comply with applicable laws and regulations.
• Confident and courageous, we are committed to minimize the environmental impact of our operation and do believe that acting responsibly for the environment is an integral part ofdoing good business.
Selected Reference Documents:


... only then we are successful.
• REGULATION (EU) No 1169/2011 OF THE EUROPEAN PARLIAMENT AND OF THE COUNCIL of 25 October 2011 on the provision of food information to consumers
• REGULATION (EU) No 1924/2006 OF THE EUROPEAN PARLIAMENT AND OF THE COUNCIL of 20 December 2006 on nutrition and health claims made on foods
• World Health Organization. Guideline: sugars intake for adults and children, 2015.
• Food and Agriculture Organization of the United Nations. Food-based dietary guidelines. https://www.fao.org/nutrition/education/food-dietary-guidelines/home/en/
• European Food Safety Authority Scientific Opinion on the evaluation of allergenic foods and food ingredients for labelling purposes. Efsa Journal 2014.
• World Obesity Federation, World Obesity Atlas 2023, March 2023.Top of Form
• World Health Organization (WHO), guidelines sodium intake for adults, 2012.
• World Health Organization (WHO), Noncommunicable Diseases Data Portal, 2022.
What’s Cooking? Annual report 2023 43 Our Policies
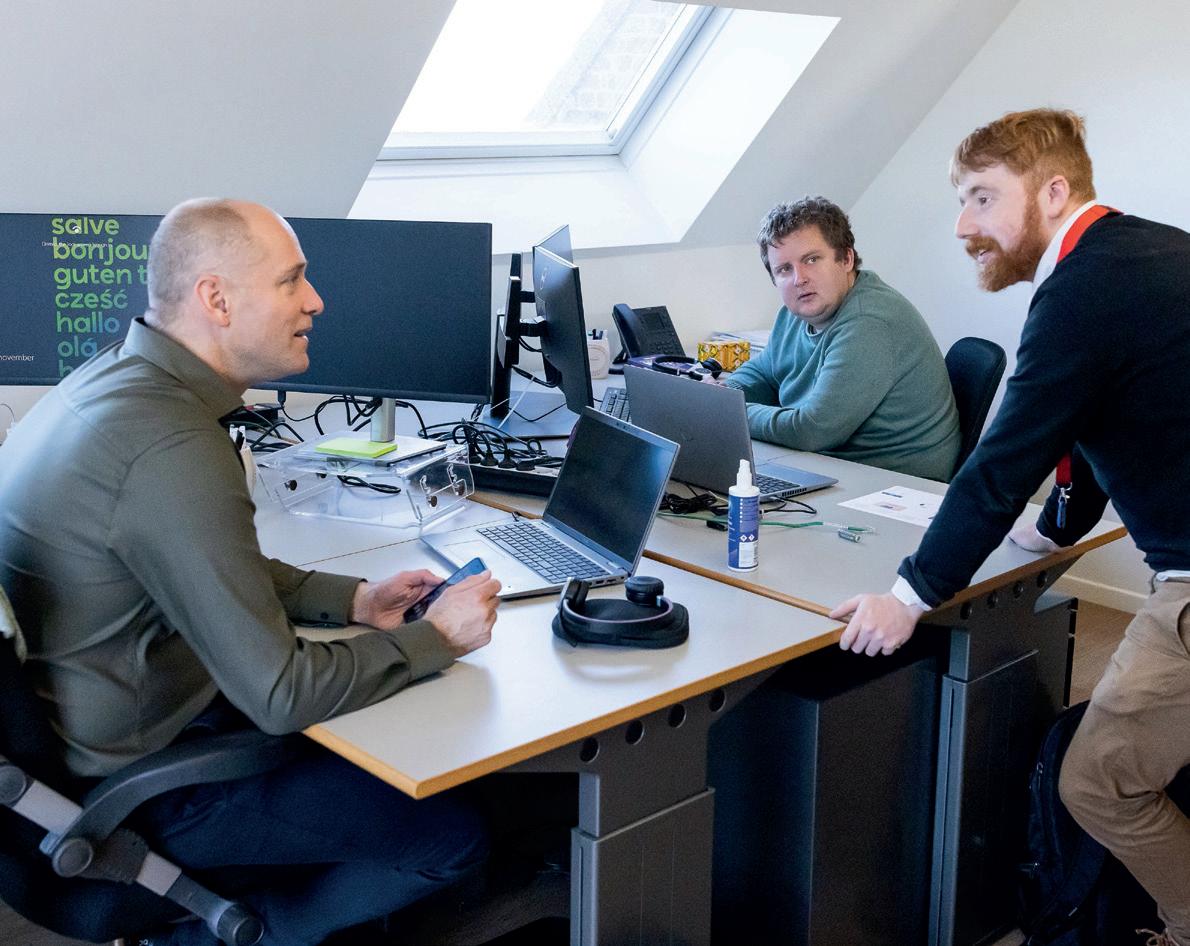
Digital Acceleration
In our digitalization efforts we want to deliver maximal value through digital comfort
Process excellence
Process excellence and digitalization are key enablers of our What’s Cooking? strategic ambitions as outlined in 2023. Optimizing and harmonizing processes goes hand in hand with accelerating their digitalization.
We are further growing as a process thinking organization. We have empowered our teams to collaboratively improve and digitalize our processes. Through the Business Process Architecture (BPA) and the IT Governance program , we installed cross-functional Activity Teams which are pursuing state-ofthe-art processes and unified systems that are providing actionable data.
In 2023 the focus of our process management organization was primarily on documenting our processes, with all its variants, and on identifying the short-term sub-process improvement opportunities. Gradually the attention is shifting to envisioning the desired end-to-end processes, and on expanding ther reach to plants in support of new systems roll-out.
Digital acceleration
In our digitalization efforts we want to deliver maximal value through digital comfort. By a mix of convenience, relevance, consistency, and quality we want to boost productivity and engagement in the usage of our systems.
End-to-end process improvements are implemented through breakthrough projects, such as the ERP harmonization (Synergy) project, the project to optimize planning and forecasting (OnePlan) or the project to standardize specification management (PLM).
In parallel a continuous stream of incremental IT systems improvements are delivering the sub-process enhancements. To this purpose an efficiency improvements factory that is on an ongoing basis delivering efficiency and quality improvements has been created.
Optimization loops are, in both projects and smaller enhancements, essential to boost value contribution.
Project excellence
To support the optimal execution of our strategic business and IT initiatives, a Project Management office has been installed. It ensures the systematic planning, execution, and control of our key projects to guarantee the achievement of their goals and objectives.
Digital innovation
In addition, we are fully engaged in anticipating What’s Cooking? in a new digital era, through the development of a digital partner network and the exploration and application of technology innovation, including usage of Artificial Intelligence.
Sofie Raes Internal Auditor
Jorgen
De Wael ICT Manager Infrastructure
What’s Cooking? Annual report 2023 44 Strategic Beliefs
45 What’s Cooking? Annual report 2023
What’s Cooking? Annual report 2023 46

Lead our industry in sustainability
Procurement & ESG
Sustainability and corporate social responsibility are now an essential pillar for long-term success. The Procurement department plays an important role here. Indeed, our suppliers are directly linked to Scope 3 emissions, which account for more than 80% of the total emissions of What’s Cooking?
By sourcing sustainably, we will realise a significant ESG impact for our business. From ensuring goods are sourced responsibly to ensuring human rights are respected throughout the supply chain.
The basis by which we make it happen:
1. Supplier selection
One of the first steps to accelerate ESG within Procurement is the careful selection of suppliers. Suppliers we work with in the future will therefore have to sign the Code of Conduct. In it, they indicate that they comply with the What’s Cooking? code of conduct, which focuses on sustainability, ethical and social standards, and good governance.
2. Sustainability information
We work with the Ecovadis platform to map our suppliers’ ESG performance. Through these ESG-related KPIs and reports, we can help our partners measure performance and identify necessary areas for improvement.
3. Sustainable sourcing strategies
Together with all other departments, we are actively working on developing sustainable sourcing strategies. This includes promoting circular economy as well as reducing waste within the overall supply chain. Purchasing green energy and sourcing sustainable materials are also important drivers in this regard.

4. Engagement
Engaging stakeholders, both internal and external, is crucial to the success of ESG initiatives. Procurement therefore works with suppliers, customers and employees to identify and achieve common sustainability goals.
5. Continuous improvement
Finally, it is important that we strive for continuous improvement. By gathering feedback, sharing best practices and continuously innovating, we as a department can continue to improve ESG performance. Therefore, ESG criteria will also be an integral part of future procurement strategy, tenders, and ESG clauses will be included in contracts with current and future suppliers.
Jan De Leersnyder Group Procurement Director
What’s Cooking? Annual report 2023 47 Strategic Beliefs

What’s Cooking? Annual report 2022
non-financial information
49 What’s Cooking? Annual report 2023

What’s Cooking? Annual report 2023 Sustainability Report 50
Sustainability Statement
At What’s Cooking? – we put sustainability at the center of our strategy & everything we do. Not just in words, but also in action. Our annual report & sustainability report reflect our strategic belief to lead our industry in sustainability.
We begin this statement with the three pillars of our sustainability strategy: providing GOOD FOOD for ALL, while PROTECTing our PLANET and HELPing our PEOPLE FLOURISH. To implement our pillars, we are using topnotch systems (for KPI tracking and for calculating the CO2 footprint of all What’s Cooking Products and ingredients), are working with our customers & suppliers in the value chain, are adjusting our products, processes and packaging to reduce CO2 as will be demonstrated in this report.
We’re in the middle of the value chain, but we take our responsibility and are setting- up collaborations with suppliers & farmers , and with customers, to create value across all players of the chain, whilst improving everyone’s CO2 footprint.
Our sustainability strategy was created after a rigorous process, including a double materiality exercise. We did not limit our research to our internal operations, but engaged stakeholders from across our value chain to determine our strategic direction. The engagement process ensured that our sustainability efforts resonate with stakeholders’ expectations and contribute positively to shared goals.
Subsequently, we delve into each pillar, outlining key topics and their significance, existing policies or systems, set targets, and actions taken to date. Each topic underscores our dedication to meaningful environmental and social impact.
Recognizing that sustainability is a collective effort, we emphasize the importance of creating a sustainability culture within our organization. Our commitment is demonstrated by initiatives such as the ESG ambassador program, quarterly ESG initiatives, and dedicated events aimed at embedding sustainability into the heart and mind of every employee. Additionally, the tone at the top and the governance model is crucial in setting the sustainability agenda. With our Sustainability Board Committee and the inclusion of sustainability as a recurring topic in every Executive Committee meeting, we ensure that sustainability remains a top priority and underscores the importance of our sustainability efforts at every level of leadership.
This first part of the sustainability statement concludes with an overview of our strategic metrics and targets, providing a transparent view of our aspirations and progress towards sustainability.

In the subsequent sustainability annex, we closely follow the ESRS (European Sustainability Reporting Standards) requirements, beginning with a detailed explanation of the impact and financial materiality assessment. Each material topic—environmental, social, and governance—is thoroughly examined, explaining the associated impacts, risks, opportunities, policies, actions, and metrics & targets. We frequently cross-reference with the strategic section of our sustainability statement to underscore the alignment of our actions with our overarching goals.
Finally, we present our ESRS Standards Reference Table, offering a comprehensive guide to locating information about all disclosure requirements according to ESRS standards. We tried to already align to the future CSRD (Corporate Sustainability Reporting Directive, with the ESRS as guidelines) as much as possible. From next year, our fully integrated sustainability report will also be audited.
We hope this report will give you a good flavour of what’s stirring in our ‘cooking pot’, but to really taste how passionate we are about changing for a better future… do not hesitate to get in touch and ask us: What’s Cooking?
Lore Muylle Group Sustainability Manager
Sustainability Report
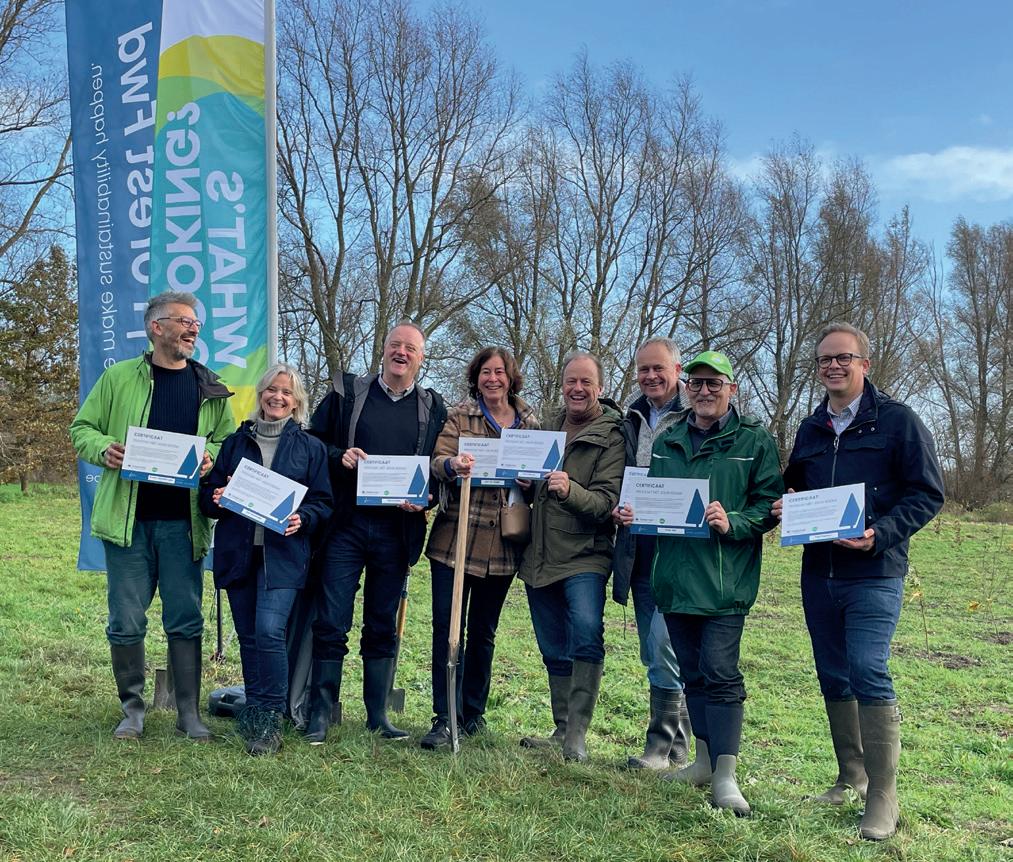
Executive Committee attending the tree planting project in Belgium in collaboration with Forest Forward, 2023.
The three pillars of our sustainability strategy
good food for all
Protect our planet
Fight climate change
Win the war on waste
• Source responsibly
At What’s Cooking? we want to provide good food for all, while protecting our planet and helping our people flourish. Sustainability is truly part of our company strategy and purpose.
Our first pillar, Good food for all, lies at the heart of our business. We are dedicated to making sustainable food consumption a natural choice for everyone. To achieve this, we are actively working on improving the nutritional profile of our delicious products whilst ensuring the overall well-being of our consumers. A central element of our strategy is expanding our portfolio of blended (hybrid), plant-based and vegetarian products to provide more sustainable choices to all our customers and all consumers on a daily basis.
Our commitment to Protect our planet reflects our determination to address climate change and reduce our carbon emissions, aligning with
• Ensure consumer wellbeing
Promote enhanced nutrition
• Grow portfolio plant-based products
Help people flourish
Guard employee safety
Boost employee engagement
• Respect human rights

the goals set in the United Nations Paris Climate Agreement. We recognize the critical importance of minimizing food waste, and we are investing in sustainable packaging solutions. Moreover, we are diligent in sourcing our ingredients responsibly.
The third pillar, Help people flourish underscores our dedication to creating a safe and engaging workplace for our team members. But our commitment extends beyond our company; it encompasses all the individuals involved in our value chain.
At What’s Cooking?, our commitment to sustainability is not just a statement, but a daily practice and at the core of our business. We strive to integrate these principles into every facet of our operations, as they are fundamental to our mission and purpose.
What’s Cooking? Annual report 2023 52
Sustainability Report
Crafting our strategy
The 3 pillars of our sustainability strategy are the result of the (double) materiality process, in which we consulted both internal and external stakeholders and reviewed sector and peer group data.
We carried out a questionnaire among our stakeholders, as we highly value their perspectives. This questionnaire served as a means to assess the impact materiality, which reflects the actual or potential impact our business has on people and the environment.
In addition to this inside-out assessment, we also examined the effects of social and environmental issues on our financial performance, known as financial materiality. A team of internal experts evaluated the associ-
ated risks and opportunities, considering both the likelihood of occurrence and the potential financial effects.
By plotting the results of the impact materiality (from the stakeholder questionnaire) on the vertical axis and the financial materiality results on the horizontal axis, we created a double materiality matrix. This matrix provides a clear view on the most significant topics, allowing us to identify the key priorities.
The detailed description of the process can be found in the Sustainability Annex
What’s Cooking? Annual report 2023 53
Sustainability Report
Value chain & stakeholder engagement
To meet our goals and advance the transformation of the food system, What’s Cooking? relies on collaborations with stakeholders throughout the whole value chain.
Farmers
We gain valuable insights into the operations of farmers through our supplier engagement program (as we have no direct relationship with the farmers), guided by our sustainability principles. We actively encourage our direct suppliers to collaborate with farmers in addressing important aspects such as animal welfare, regenerative practices, and taking steps to minimize the carbon footprint associated with the products they cultivate.
Suppliers
We source our raw materials, such as meat, dairy, grains, vegetables and other ingredients, from carefully selected suppliers near our factory wherever possible. Recognising that our suppliers have a major role to play in our mission to deliver responsible food products, we require them to sign our Business Code of Conduct for Suppliers, aligning with our core sustainability practices.
To further encourage their commitment to sustainability, we’ve established a supplier engagement program in collaboration with EcoVadis. Through this program, suppliers undergo comprehensive assessments of their sustainability performance across various aspects. We are dedicated to cultivating long-term partnerships that promote sustainable and inclusive growth. Transparency, as well as a mindset of continuous improvement, are key in this mutual engagement.
Suppliers play a crucial role in shaping our sustainability strategy. We involve them in the materiality assessment to determine our most critical
topics, ensuring that our efforts are aligned with the concerns and priorities of our supply chain partners. Additionally, our procurement department organizes supplier sessions every few months, providing a platform for suppliers to present innovative joint projects. These projects aim to increase operational efficiency, reduce our carbon footprint, introduce new technologies, and more. The insights and ideas shared during these sessions are invaluable, as they not only enrich our sustainability initiatives but also contribute to the continuous improvement of our overall strategy and business operations.
What’s Cooking? team
We believe in empowering our approximately 3,000 people to fulfil our company’s purpose. Grounded in our core values, we actively foster a culture in which performance and sustainability are interconnected, and where the strengths of both our local and global presence come together seamlessly. To achieve this, we set up an ESG ambassador program (see further for more details), offer sustainability training sessions and engage our internal stakeholders in the materiality assessment process. Social dialogue with works councils is important to us. Together, we aim to establish an innovative approach to skills-development, equipping our employees with the capabilities they need for current and future roles.
Through the engagement questionnaire, we seek to monitor our people’s happiness and wellbeing, inviting their input on how to enhance the What’s Cooking? work environment further. This feedback mechanism allows us to continuously improve and adapt our practices to create a more supportive and fulfilling workplace for our team members.
Creating & Cooking
Our food is carefully crafted by our experienced colleagues in 12 facilities across Europe and the UK, with a focus on food quality, taste, nutritional
What’s Cooking? Annual report 2023 54
Sustainability Report
enhancement, and sustainability. At each of these locations, we prioritize safety, operational excellence, carbon emissions reduction, responsible water management, and food waste minimization. In 2023, we already used 50% renewable electricity, and we want to achieve 100% renewable electricity usage in 2024. That’s just a start – as we will equally target gas consumption reduction or conversion in future years.
Slicing & Packaging
We unburden our customers by ensuring the supply chain end to end. At What’s Cooking? we slice our own savoury products, but also products from third party production. This allows us to create sustainable supply chains and introduce new innovative packaging formats for our customers. We are committed to continuous further innovation in packaging solutions, with a primary focus on reducing packaging, enhancing recyclability, and extending product shelf life (and therefore reducing food waste).
Warehousing, distribution & supply chain solutions
We collaborate with our logistics partners to assess their carbon footprint and share the portion of emissions associated with What’s Cooking? We actively promote the setting of ambitious reduction targets aligned with the Paris Climate Agreement and work together to explore strategies for decreasing carbon emissions in transport and warehousing. Together we minimize food waste through supply chain solutions. We are implementing an Advanced Planning System (APS) throughout the entire supply chain. This fully end-to-end integrated platform for the whole What’s Cooking? group consists of demand planning (DP), rough-cut capacity planning (RCCP), master production scheduling (MPS) and seamlessly linking these to support the What’s Cooking Sales & Operations process. The objective of Project OnePlan is to better service our customers thanks to more accurate demand plans (DP) which will allow us to take the right capacity allocation decisions in the longer term. This business project can clearly be related towards two important strategic pillars, being innovation and sustainability. Through the use of machine learning and artificial intelligence we can reduce waste in our supply chain further than was ever imagined possible.
In 2023, What’s Cooking? underwent a strategic transition, changing our third-party logistics provider in Belgium. This decision has resulted in a more efficient downstream freight process and more environmentally friendly warehousing practices and fleet. Furthermore, we have initiated plans to transfer the majority of activities from our Aalsmeer site to other group locations in the Netherlands. This strategic move is projected to significantly decrease transportation needs as well as cooling capacity, further reducing our carbon footprint.
Foodservice, Wholesale & B2B
At What’s Cooking? we want to serve all consumers – offering solutions for in-home but also out-of-home dining. We offer both branded products and private label products. Our focus is to ensure all consumers can enjoy our delicious, nutritious, sustainable and affordable ready meals and savoury products. In doing so – we each time aim to find the right product, packaging & solution for the customer. We offer both frozen products & fresh products and offer various logistics solutions to minimize waste further in the supply chain. In doing so – we don’t hesitate to use others. For instance – through partnerships with wholesalers to deliver our products to individual restaurants, pubs, bars but also hospitals and business-to-business customers.
Retail
At What’s Cooking?, we’re strengthening our collaboration with retailers to promote sustainable and healthy food choices. We customize products to match local tastes and activate our brand alongside our retail partners. Sustainability is our shared focus, aligning strategies across the value chain and involving retailers in our double materiality assessment. We’re committed to transparency and education, sharing data and jointly looking for solutions to create a more sustainable supply chain that resonates with environmentally conscious consumers.
A large part of the group’s turnover comes from private label products, including ready meals such as lasagna, pasta, pizza, and other delicious meals, as well as savoury items like poultry, cooked ham, salami, pâté, and more. In both business units, the group aims to increase the percentage of plant-based and vegetarian products, as well as blended (hybrid) options. However, it’s important to note that recipe changes for private label products require approval from the brand owners. For our own brands, we have more flexibility in modifying recipes, though we still depend on securing agreements with retailers to ensure these products are available on shelves.
Consumers
We listen and respond to the fast-changing expectations of consumers worldwide and minimize our environmental footprint and improve the nutritional profile of our products. This enables us to meet their desires for delicious, sustainable food products that are convenient to eat.
Through consumer panels, we ensure that we understand their expectations and take their input into account when shaping our strategy. This direct engagement with consumers allows us to stay informed about their preferences and needs, guiding our decisions as we strive to continually enhance the quality and sustainability of our offerings.
Shareholders
As an innovative food group, we embrace the concept of sustainable shared value creation, while caring for both people and planet. We are confident that, thanks to our commitment to all our stakeholders as well as to the strong Strategy 2030 that we have come up with, we will consistently generate increased value for every shareholder, day by day.
Entrepreneurs
We are entrepreneurs ourselves. We partner with start-ups that share our vision of a sustainable food future. Through strategic investments in innovative companies that introduce unique products and disruptive models, we accelerate their growth by providing them with our expertise and resources. Moreover, these collaborations will not only enrich our ecosystem but also infuse our organization with an entrepreneurial spirit, helping us to remain agile and adaptive in a rapidly evolving market landscape.
Researchers
Our growth strategy places significant emphasis on research into strategic areas such as food safety, nutritional excellence, sustainable packaging, and alternative protein sources. Aided by science, we seek to improve our understanding of health and nutrition issues and to deploy this knowledge to continually optimise our food products and purpose-driven product strategies.
What’s Cooking? Annual report 2023 55
Sustainability Report
Communities
At What’s Cooking?, we are involved in the communities surrounding our manufacturing and slicing facilities, working to reduce any adverse effects and amplify our positive influence. We also support local communities by contributing to meaningful charitable causes.
Mother nature
At What’s Cooking?, we recognize Mother Nature as a key stakeholder in the journey towards sustainability. As residents of a planet with finite
Stakeholder
Farmers & Suppliers
Employees
Customers
Consumers
Shareholders
Public Organisations
Communities
Engagement Strategy
• Business Code Of Conduct Suppliers
resources, we understand the need to operate within the planetary boundaries to ensure the well-being of future generations. We acknowledge that the ingredients we source, the processes we employ, and the footprint we leave behind impact the delicate balance of our shared environment. With this awareness, we strive to minimize our ecological footprint and embrace sustainable practices throughout our supply chain day by day and side by side.
• Supplier Day With Strategic Suppliers, Explaining New Strategy And Importance Of Sustainability
• Involvement In Materiality Assessment
Supplier Engagement Program Supported By Ecovadis
- Sustainability Assessment With Scorecard And Improvement Plan
- Carbon Assessment Through Carbon Action Module With Scorecard And Improvement Plan
- Supplier Sessions To Present Joint Projects And Inspire Each Other
- Training
• Business Code Of Conduct
• Employee Communication Through The Two-Monthly Newsletter
Performance And Career Development Reviews
• Involvement In Materiality Assessment
• ‘Connecting With You Transparently’ Calls With Staff
• Training
Collective Bargaining
Employee Wellbeing Programs Tailored To Each Operation & Country
• Business Reviews
Involvement In Materiality Assessment
• Customer Audits And Questionnaires
• Cross-Functional Meetings With Sustainability, Sales&Marketing, R&D, Quality, Purchase
• Daily Engagements In The Field
Value Chain Optimization Projects & Joint Improvement Projects
• Consumer Taste Panels
Website
Social Media
• Annual Report
Annual Shareholder’s Meeting
• Involvement In Materiality Assessment
• Annual Report
• Visits & Roadshows/Webinars In Collaboration With Selected Partners
• Involvement In Materiality Assessment
• Participation In Working Groups Of Industry Associations Meetings And Presentations
• Involvement In Materiality Assessment
• Organization Of Company Visit With Q&A Session
Social Media
What’s Cooking? Annual report 2023 56
Sustainability Report
We have classified our stakeholders into two categories:
• Affected stakeholders
Individuals or groups whose interests are affected or could be affected – positively or negatively – by What’s Cooking’s activities and direct and indirect business relationships across our value chain.
Under this category fall farmers and suppliers, our employees, our customers, our consumers, our communities, and Mother Nature. It is very important to engage with these affected stakeholders to understand their concerns and take their input into account. By actively involving them in our decision-making processes, we can better address their needs and preferences, fostering stronger relationships and ensuring that our actions contribute to positive outcomes for all parties involved.
• Users of the sustainability statements
Primary users of our general-purpose financial reporting (existing and potential investors, lenders and other creditors, including asset managers, credit institutions, insurance undertakings), and other users of our sustainability statements, including our business partners, trade unions and social partners, civil society and non-governmental organisations, governments, analysts and academics.
Investors, banks, governments, public organizations, researchers, etc., are equally included in this stakeholder category. It is crucial to provide comprehensive and transparent sustainability information to meet the diverse needs of these stakeholders, enabling informed decision-making and fostering trust and accountability in our operations.

What’s Cooking? Annual report 2023
57
good food for all
Ensure Consumer Wellbeing
Why Is This Important to Us?
At What’s Cooking?, the commitment to ensuring consumer well-being and food safety is not just a corporate responsibility, it’s a core value that permeates every aspect of our operations. Here’s why this commitment is top priority to us:
Consumer Trust and Health:
Our foremost priority is the well-being of our consumers. We believe that by delivering safe and high-quality food products, we not only protect their health but also earn and maintain their trust. We incorporate the quality standards our customers expect, ensuring that our products align perfectly with their preferences and desires.
Environmental and Economic Impact:
Beyond individual health, our dedication to food safety has far-reaching effects. By preventing the need for food recalls, we actively contribute to reducing environmental impact and minimizing associated economic costs.
Adherence to Stringent Standards:
We take pride in adhering to the rigorous standards set by globally recognized bodies such as IFS and BRC (International Food Safety and British Retail Consortium).
Continuous Improvement and Adaptability:
Quality is not static, it is a journey of continuous improvement. Our investments in technology and the cultivation of a robust food safety and quality culture showcase our adaptability. We embrace change to stay at the forefront of industry requirements, ensuring our products evolve in tandem with our consumers’ needs.
Promote Enhanced Nutrition
Why Is This Important to Us?
At the core of our identity as a food group is a recognition of the importance of nutritious and balanced food.
Addressing Consumer Expectations:
Recognizing the diverse preferences of our consumers, we acknowledge the desire for not only delicious but also nutritious options. Our commitment is to provide a range of choices that align with different tastes and preferences.
Recognising Responsibility as a Food Group:
We consider it our duty as a food group to ensure we can offer (parts of) a balanced diet, as nutritiously as possible, without compromising on taste, because then we would have less influence as fewer people would buy our products. It’s imperative for us to uphold our commitment to both flavour and nutrition, ensuring that our products not only satisfy consumer expectations but also contribute positively to their overall health and wellbeing.
Our Policies and Systems
To guarantee the delivery of secure products, we’ve implemented rigorous safety protocols throughout the entire supply chain. All 12 of our sites uphold the quality standards established by the Global Food Safety Initiative (GFSI), a renowned global non-profit organization committed to standardizing food safety norms. Additionally, we strive to engage with suppliers who adhere to GFSI standards.
As we believe that food safety is never to be compromised, we have established a FSQR policy, accessible on our website https://whatscooking. group/en-GB/our-engagement.
Our Sustainability Targets
100% of the What’s Cooking? production and slicing facilities have a higher level IFS or BRC score by 2025
Driving Change: Our Sustainability Actions
We refer to the article on Operational Excellence page 21
Elaborating on the interview on Operational Excellence with Laurence Caillot, we’d like to highlight additional key initiatives:
• Our Compliance Audit program, wherein our factories undergo periodic, unannounced assessments independent of operations to ensure compliance, thereby further supporting our improvement programs.
The implementation of IFS Integrity will contribute to achieving our sustainability objectives and continuously improving integrity within the supply chain.
We also have a whistle blowing program in place that also covers food safety & quality.
Our Policies and Systems
Our approach to elevating a product’s nutritional profile is customized based on its type and its role within a daily diet. This has led us to develop a nutritional policy for our two business units. You can find this policy on our website https://whatscooking.group/en-GB/our-engagement
Concrete targets are currently being fine-tuned over the next few months with the assistance of an external expert.
58 What’s Cooking? Annual report 2023
our
our nutritional
by 2030
Our Sustainability Targets 100% of
products meeting
policy
Sustainability Report
Driving Change: Our Sustainability Actions
Mindful Reduction of Sugar, Salt and Saturated Fats:
Taking a thoughtful approach, we actively work to reduce the levels of sugar, salt, and saturated fats in many of our products. This reflects our commitment to promoting healthier choices, while acknowledging the diversity within our product range.
Emphasis on Health-Promoting Elements:
We go beyond mere reduction by trying to incorporate more fibre and unsaturated fats into our products, as well as more vegetables. This deliberate choice is made with the aim of enhancing nutritional value without
Grow Portfolio Plant-Based Products
Why Is This Important to Us?
We strive to make sustainable food consumption second nature, ensuring the provision of good food for all. This encompasses an increased emphasis on the pivotal role of diverse and plant-based ingredients and products.
Meeting Consumer Demand for Sustainability:
This is important because we aim to meet our consumer demand for a more sustainable, nutritious, and balanced diet. Understanding and responding to the evolving preferences of our consumers is a cornerstone of our commitment.
Impact on Product Carbon Footprint:
Moving to plant-based products and ingredients holds significant importance due to its substantial impact on the product carbon footprint. This strategic shift plays a key role in helping us reach our carbon reduction targets, aligning with our broader sustainability goals and contributing to a healthier planet.
Mitigating Negative Impacts on Animal Welfare:
In addition, this transition decreases the potential negative impacts on animal welfare. Our commitment extends beyond environmental concerns to ethical considerations, ensuring that our choices resonate with values that prioritize the well-being of all living beings.
Our Policies and Systems
We are using a menu card approach to discuss the implementation of ‘new’ products with our customers. (See also p. 67) For the calculation of the impact on sustainability related to the implementation of new products, we use our ERP software CO2e calculation tool to assess the impact of the new products.
Our Sustainability Targets
15% of our sold products have to be plant-based or vegetarian by 2030
What’s Cooking? Annual report
compromising on the delightful taste that our consumers have come to expect from What’s Cooking?.
Collaboration for Nutri-score Improvement:
We collaborate closely with the brand owners to reformulate our products to adhere to the best possible Nutri-score. By working together, we ensure that our products meet the highest standards of nutritional quality, providing consumers with healthier options while maintaining the delicious flavour they love.
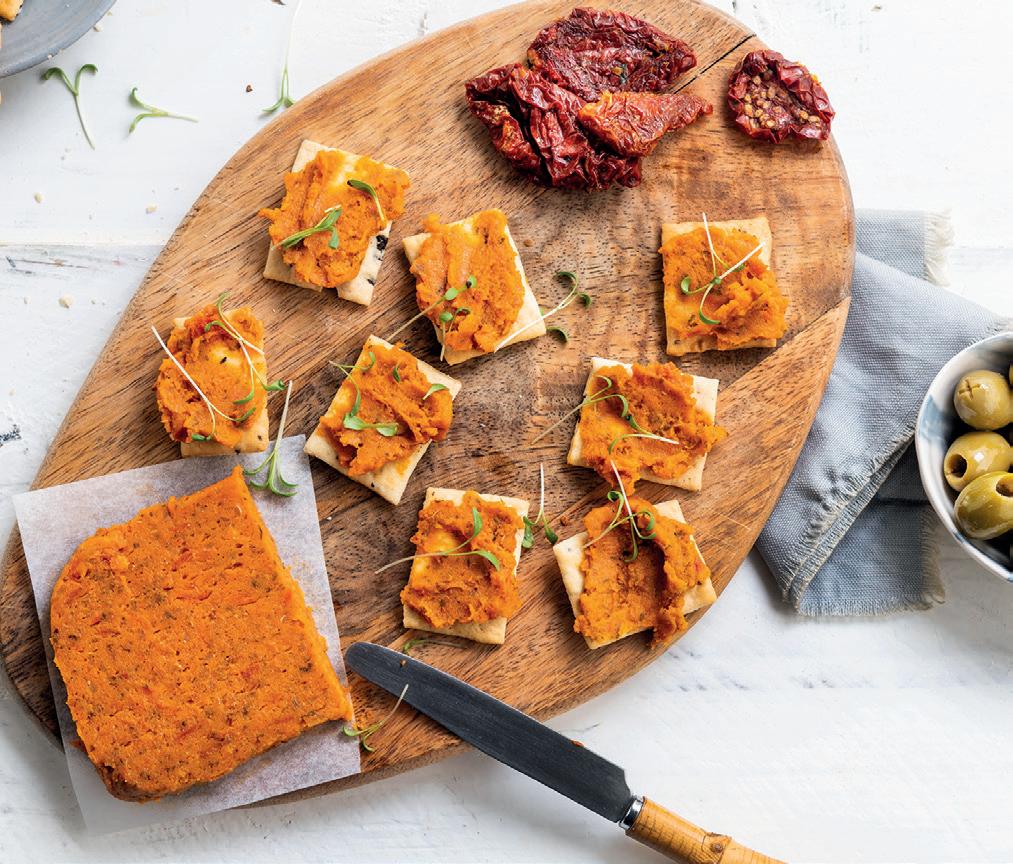
Driving Change: Our Sustainability Actions
We Refer to the article about Rebuilding Innovation by Elke De Witte and Fanny Nguyen in respect of plant-based developments. See page 32
It’s the conviction of What’s Cooking? that an increased amount of people and consumers strive to a higher variety in their eating pattern. A big group of consumers try to alternate meat days with meat-free days.
Their intentions are amongst others driven by climate / sustainability considerations and by their own health and wellbeing. For this group of consumers, we want to offer a range of products that stimulate variety and inspiration.
In terms of product development, it’s our overall aim to develop tasty products, that are nutritious and it’s our ambition to improve and expand our portfolio day by day.
2023
59 Sustainability Report
Protect our planet
Fight Climate Change • Climate Change Mitigation & Energy Consumption and Mix
Why Is This Important to Us?
Climate change is undeniably one of the most pressing challenges for both present and future generations, casting a shadow over various industries, including food companies like ours. The increasing frequency of extreme weather events such as floods, droughts, fires and heat waves in key sourcing regions put food companies at risk of crop failure for essential commodities, which may result in increased commodity prices and constrained availabilities.
For What’s Cooking?, addressing climate change is not just a matter of adapting to environmental shifts; it is a fundamental aspect of our sustainability commitment, driven by the following reasons:
Protecting life on Earth and Future Generations:
Our commitment to addressing climate change is deeply rooted in the responsibility to protect life on Earth and secure a thriving future for generations to come. At What’s Cooking?, we recognize that by mitigating the effects of climate change, we are not only protecting the environment, but also ensuring our ability to continue providing future generations with the nutritious and delicious food experiences they deserve.
Resilience in the Supply Chain:
Climate change poses a direct threat to the stability of our supply chain, particularly in regions vulnerable to extreme weather events. By addressing climate change, we strengthen the resilience of our supply chain, ensuring a consistent and secure source of essential ingredients.
Economic Sustainability:
Crop failures and subsequent increases in commodity prices pose economic challenges. Mitigating climate change risks ensures our economic sustainability by minimizing the impact of price volatility on our operating costs.
Long-Term Vision:
Climate change is a long-term challenge that requires a strategic and sustained response. By prioritizing climate change mitigation, we demonstrate a forward-thinking vision, acknowledging the need for sustainable solutions that benefit both our business and the broader ecosystem.
This is why we started calculating our corporate carbon footprint, which consists of our scope 1, 2 and 3 emissions.

Sustainability Report
report 2023
What’s Cooking? Annual


Scope 1 includes direct emissions from sources we own or operate, such as our stationary and mobile combustion engines, as well as process and fugitive emissions. Scope 2 includes indirect emissions released from the generation of purchased electricity. These are two emission groups on which What’s Cooking? can have a direct impact.
Finally, there is Scope 3. This includes all emissions in our value chain for which we as an organization are indirectly responsible. Consider emissions from purchased goods and services, upstream and downstream transportation, corporate waste, employee commuting, business travel, the use and end-of-life of our products, etc.
As a food processing company, it is no surprise that the biggest part of our emissions are situated in our supply chain and more specifically the upstream part. More than 90% are scope 3 emissions, approximately 84% of which come from the products we buy (meat, ingredients and packaging). True partnerships are needed to reduce these emissions. As many of them originate a few steps ahead of our direct suppliers, we need to work together across the whole value chain.
Scope 1: 3%
Scope 2: 1%
Scope 3: 96%
What’s Cooking? Annual report 2023 61 Sustainability Report
Figure: Scope 1, 2 and 3 What’s Cooking? 2023.
Scope 1 Direct Scope 3 Indirect Scope 3 Indirect Scope 2 Indirect Fixed combustion sources Employee commuting Business travels Purchased goods/ services Operational waste Transport & distribution Capital goods Fuel/energy related End of life for products Transport & distribution Mobile combustion sources Purchased electricity, steam, heat & cooling Process & Fugitive emissions Use of sold products
Figure: Green House Gas Protocol categories - What’s Cooking?
Our Policies and Systems
We committed to the internationally accepted near term Science Based Targets Initiative (SBTI) and our company is setting itself strict targets with a scientific basis for CO2 reduction by 2030. Through these objectives we are committed to lowering our corporate carbon footprint aligned with the global warming targets in the Paris Climate Agreement.
CEO Piet Sanders stated: ‘We are thrilled that What’s Cooking? strategy is now also committed to SBTI matching the vision of majority of the retailers in our sector. SBTI is official, actionable and measurable target setting with a formal submission process and publicly available information, reason why we want to pave this journey as frontrunner in our sector of Savoury and Ready Meals matching the current and future needs of our customers.’
Outlined in our environmental policy, which can be found on our website (https://whatscooking.group/en-GB/our-engagement) is a robust commitment to mitigating our scope 1&2 emissions, and scope 3 emissions associated with operational waste. Central to this commitment is a strong emphasis on lowering energy consumption and transitioning to a more sustainable and greener energy mix, which contributes to reducing our scope 1 and 2 emissions.
In our sustainable procurement policy, we pledge to reduce our scope 3 FLAG emissions, which are emissions related to the ingredient and meat products we source. Additionally, we are dedicated to lowering scope 3 emissions associated with both upstream and downstream transport. Our sustainable procurement policy can be consulted on our website https://whatscooking.group/en-GB/our-engagement
As part of our packaging policy, we commit to increasing the recycled content in our packaging materials, which helps us reduce the greenhouse gas emissions related to packaging. The packaging policy can be accessed on our website https://whatscooking.group/en-GB/our-engagement
As outlined throughout in this report – recipe reformulations (blended, vegetarian & vegan) but also ingredient substitution as well as working with our suppliers in the value chain can equally significantly contribute to help reduce emissions. Our strategy will continue to be a story of many combined actions in order to make the biggest possible impact.
Our Sustainability Targets
What’s Cooking? Annual report 2023 62
gas emissions 50% reduction of scope 1&2 emissions by 2030 (compared to 2021) 42% reduction of scope 3 industrial emissions by 2030 (compared to 2021) 30% reduction of scope 3 FLAG emissions by 2030 (compared to 2021) Energy 100% renewable electricity by 2024 15% reduction of natural gas consumption by 2030 (compared to 2022) 20% reduction of electricity consumption by 2030 (compared to 2022) Sustainability Report
Greenhouse


Driving Change: Transition Plan for Climate Change Mitigation
Green Energy
In 2023, we successfully transitioned to purchasing 50% of our electricity from renewable sources, resulting in an immediate 50% reduction in our scope 2 emissions. Going forward, we plan to further increase our environmental impact from 2024 by using 100% renewable electricity. We will also explore the technical feasibility to move away from gas fired steam boilers towards electric steam boilers in the future, reducing our dependency from fossil energy sources.
We also partnered with solar energy experts to ensure we maximise our roof / parking space to generate our own energy. At the majority of our sites we’ve already covered the roof and some of the parking areas in order to be less dependent on the grid. Even when this does not cover our entire energy demand, it helps to reduce our overall footprint.
Energy Efficiency Measures
At What’s Cooking?, we are committed to reducing our carbon footprint through a variety of energy efficiency measures. One key initiative is the establishment of a dedicated workstream on Utilities, where all maintenance, technical and engineering managers convene monthly to discuss projects and track progress toward our targets. These collaborative meetings serve as a platform for sharing insights and inspiring each other with innovative ideas and solutions.
Within this workstream, numerous projects are underway to enhance energy efficiency across our operations. For instance, we’ve undertaken audits to identify opportunities for improvement, such as the installation of steam traps to optimize energy usage. Additionally, we’ve invested in energy awareness to educate employees on best practices for conservation and efficiency.
Furthermore, both internal and external energy audits are regularly conducted to identify areas for improvement and implement targeted interventions. We’ve also already installed cogeneration systems, harness renewable energy sources and reduce reliance on traditional power grids.


In line with our commitment to real-time monitoring and optimization, smart measurement devices are being installed in all our factories. These devices enable us to closely track energy consumption in detail, allowing for timely adjustments and continuous improvement efforts.
Electrification of Lease Vehicles
Starting in 2024, What’s Cooking? has made the decision to exclusively provide new electric lease vehicles. This strategic choice is aimed at significantly reducing emissions stemming from our company cars.
Switch to Low Global Warming Potential Refrigerants
Through our Cooling Masterplan initiative, we are dedicated to transitioning to low global warming potential refrigerants across all our sites by 2030. As part of this commitment, we have chosen to adopt ammonia (NH3) as our refrigerant of choice. Ammonia has an emission factor of zero, resulting in a complete elimination of emissions related to refrigerants at What’s Cooking?.
Solar parking lot – Wommelgem site
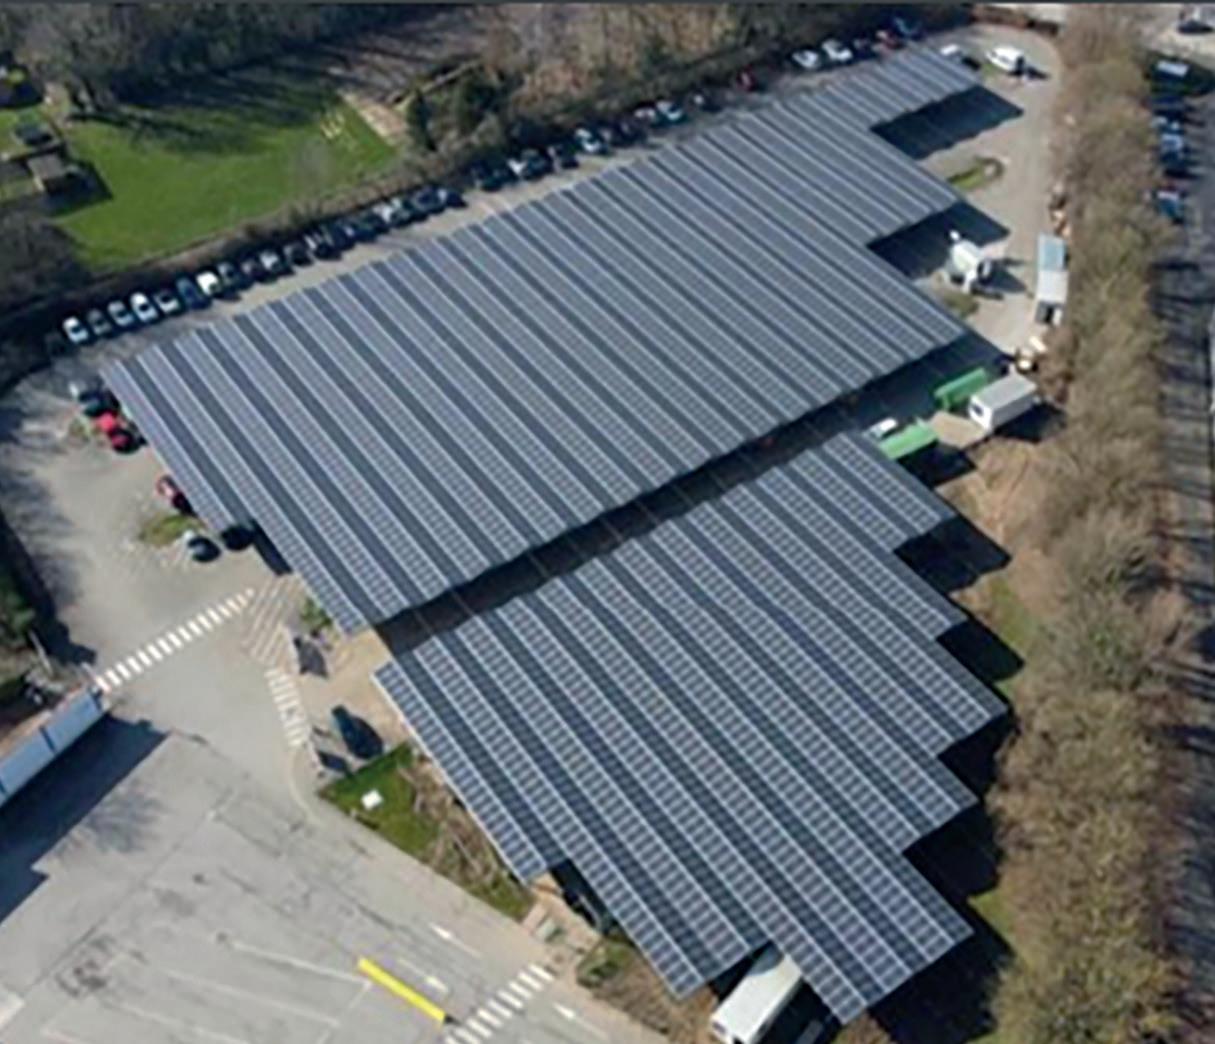
Cooking? Annual report 2023
What’s
Sustainability Report 63


War on Waste
We refer to our actions on food waste (Win the War on Waste – Fighting Food Waste - Driving Change: Our Sustainability actions) on page 69
Packaging Changes
We refer to the article ‘Rebuild innovation’ with respect to Packaging earlier in this report. (See page 31)
Transportation Optimization
We engage in collaborative efforts with our logistics partners to assess their carbon footprint, transparently sharing the specific emissions attributed to What’s Cooking?. We actively advocate for the adoption of ambitious reduction targets in alignment with the Paris Climate Agreement. Through ongoing collaboration, we explore and implement strategies aimed at reducing carbon emissions in transportation and warehousing.


Use of Sold Products
We also want to minimize emissions from our products’ use phase. For instance, our “Sunny” project aims to internally browning products such as lasagne in our factories. By doing so, we anticipate lower energy consumption compared to traditional methods. Consumers would simply reheat the pre-browned product at home, saving time and energy. While we’re confident in the benefits, concrete data is needed for confirmation. Nonetheless, we’re optimistic about the positive impact on sustainability and consumer experience.
Emissions related to fuels and energy
These are emissions related to the production of fuels and energy purchased or consumed by What’s Cooking?, but that are not included in scope 1 or 2. This includes upstream emissions of purchased fuels or electricity, more specifically the extraction, production and transportation. This category also takes into account transmission and distribution losses. These emissions will reduce together with their related scope 1 and 2 emissions.
What’s Cooking? Annual report 2023 64
Sustainability Report


We calculated the carbon footprint of all our products. Starting from a list with all raw materials we purchase, an emission factor was allocated to every


material. Through the bill of material, we used our costing tool to calculate the carbon footprint of every product instead of the cost. In this way, we get for example the total footprint of making a lasagne bolognaise.


Meat type 1 = ton CO2e Item Lasagne Bolognese = ton CO2e Energy type 1 = ton CO2e Meat type 1 = ton CO2e Ingredient type 1 = ton CO2e Packaging type 1 = ton CO2e Ingredient type 1 = ton CO2e Ingredient type 1 = ton CO2e Packaging type 1 = ton CO2e
of material Product Carbon Footprint ERP System (costing tool) What’s Cooking? Annual report 2023 65 Sustainability Report
Product Carbon Footprint
Bill
Product reformulations

The breakdown of our product carbon footprint provides valuable insights into the specific categories that contribute significantly to the overall environmental impact. This transparency enables our in-house Research and Innovation (R&I) teams to strategically focus on adapting recipes. Where feasible, we aim to replace carbon-intensive raw materials, either entirely or partially, with more sustainable alternatives, such as plantbased ingredients. By leveraging this data-driven approach, we strive to optimize our product reformulations, reducing our carbon footprint.
Product carbon footprint dashboard
Scope 1 & 2
Downstream transport
Eggs
Heating of lasagne by end consumer
Cereals
Spices, herbs & others
Vegetables
Packaging
Water, waste & industrial gases
Meat
Dairy
We organized a training day focused on the product carbon footprint for our internal Research and Innovation, Sales and Marketing, Specification Management, and Procurement Teams. Equipping these teams with comprehensive knowledge, this initiative empowers them to strategically engage with recipes, actively working towards the reduction of the product carbon footprint across our product range. This training shows our commitment to encouraging a collective understanding and actionable approach among key departments, driving sustainability initiatives throughout the entire product lifecycle.
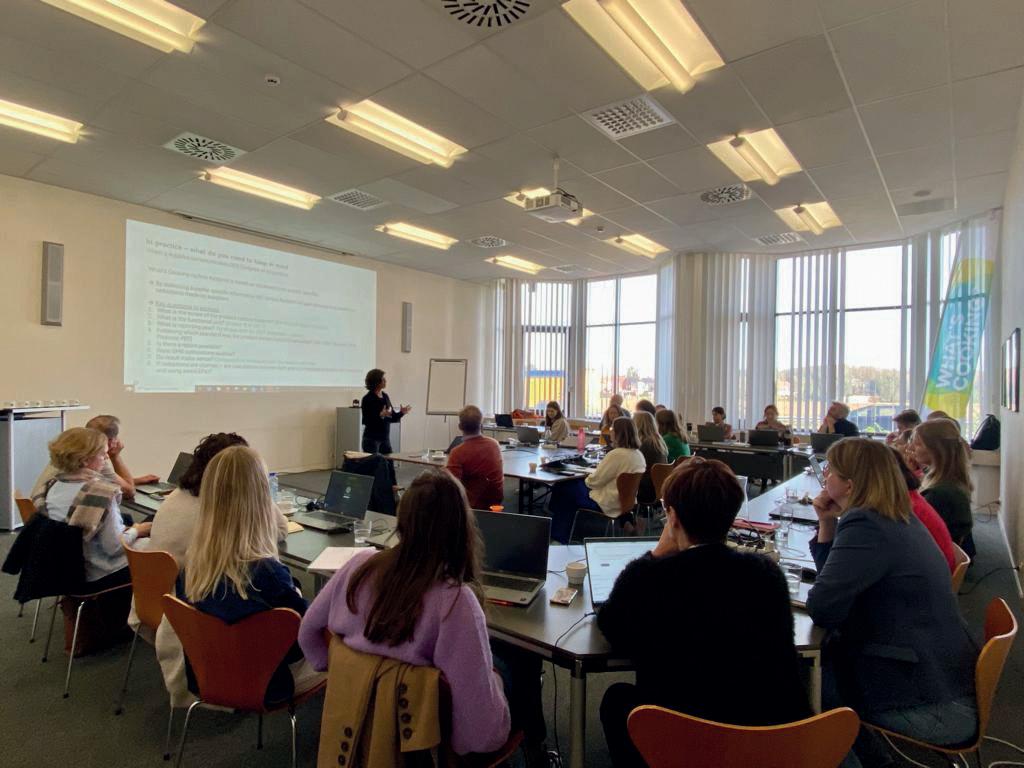
What’s Cooking? Annual report 2023
66
On the menu: delicious, nutritious, sustainable & affordable food choices
Our ‘menu card’ approach:
To ensure our engagement is aligned with that of our customers, we’ve developed a menu card with product, packaging and process improvements that can help reduce CO2 emissions further. As changes will be required on an ongoing basis, we divided our ‘menu card’ in starters (short term options), mains (mid-term options) and desserts (longer term options).
The benefit of a menu card is that we can focus our efforts on those key items ‘on the menu’ whilst leaving our customers a choice with respect to what items on the menu are a priority for them and their consumers.
We include Packaging – Process and Product options. At What’s Cooking?, we’re convinced that we cannot just be focussed on packaging. Packaging overall represents less than 5% in the total product carbon footprint, but it is an important and very visual item to consumers. We therefore want to focus on all 3 components (Product, Packaging and Process). Combined efforts will be required to achieve the SBTI targets.
Product examples could be plant based and vegetarian products, but could also be recipe reformulations, replacing meat by blended meat & alternative proteins or simply other ingredient changes. We also refer to the section ‘Grow Portfolio Plant Based Products’ on page 32 within this sustainability report.
• Packaging examples include both a reduction of the amount of packaging, the recyclability of the packaging, but also outer case packaging specifications. Technology is fast-evolving so we want to remain leading in this area.
Process examples include working in the supply chain to offer lower CO2 meat through working with our value chain partners on animal feed and other initiatives. We are also looking at supply chain optimizations such as for example reducing the water in the tomato paste we purchase to reduce transportation CO2. We believe there are huge opportunities in reducing the CO2 emissions from looking at value chain collaboration and process optimization. We also refer to the section on ‘Responsible Sourcing’ which focusses on supplier engagement. See page 47 within this report.
When evaluating menu card items, we focus on taste, nutrition, sustainability and affordability. Taste is clearly very important as repeat-buying is essential to create an impact. Nutrition is equally a very important factor as consumers do not want to compromise on nutrition.
Not every option has to increase the cost of the products and we need to remain mindful of affordability for all consumers. However, we also need to be transparent about potential increased costs related to certain menu card options and ensure a fair value chain for all involved. This is why our menu card will each time evaluate taste, nutrition score, CO2 reduction as well as a € cost price impact (up or down).
What’s Cooking? Annual report 2023 67
Sustainability Report
Win the War on Waste
Fighting Food waste
Why Is This Important to Us?
Globally, around 13% of food produced is lost between harvest and retail (United Nations).1
Fighting Climate Change:
By reducing food losses and waste, we actively combat climate change. We recognise our role in minimising our impact on the environment, as food that is lost and wasted accounts for 38% of the total energy usage in the global food system, according to the above mentioned United Nations report.
Preserving Resources:
Wasting food directly impacts the sustainability of our food systems. Valuable resources such as water, land, energy, labour, and capital invested in the production process are wasted. We are committed to efficient resource use within our operations.
Hunger in the World:
Addressing food losses and waste is a direct response to the rising global hunger crisis. By minimizing waste, we contribute to ensuring a steady and reliable food supply, aligning with our dedication to combat food insecurity.
Building Resilient Food Systems:
Reducing food waste is essential for building resilient food systems capable of withstanding external shocks. Our commitment to sustainability includes promoting robust systems that adapt to challenges and ensure a stable food supply.
Affordability of Food:
Food loss and waste contribute to an increase in the overall cost of food. Recognizing the economic impact on consumers, we are committed to adopting practices that reduce waste and maintain affordable prices for our products.
Our Policies and Systems
Lansink’s Ladder
Lansink’s Ladder, also known as the waste hierarchy, is a valuable framework for addressing and managing food waste in a sustainable way. At What’s Cooking? our priority is on avoiding waste through prevention and re-use (avoidance). The second priority is recovery, in which we first have recycling of waste (e.g. to animal feed) and then high-quality energy recovery. Disposal (incineration and landfill) is the least preferred option, which we try to avoid as much as possible.
Prevention
Re-use
Recycling
Incineration with energy production
Incineration
Landfill
Our commitment to reducing food waste is outlined in detail in our Environmental Policy, which can be found on our website: https://whatscooking.group/en-GB/our-engagement
Our Sustainability Targets
20% reduction of our operational food waste by 2024 (compared to 2022)
50% reduction of our operational food waste by 2030 (compared to 2022)
Driving Change: Our Sustainability Actions
In our ongoing efforts to combat food waste, our ‘War on Waste’ teams meet monthly, fostering a collaborative environment where best practices are exchanged among our factories. Dedicated teams oversee waste reduction initiatives at both our Savoury and Ready Meals sites, emphasizing the importance of awareness and collective action.
Several impactful projects illustrate our commitment to waste reduction. Initiatives such as enhancing our pigging system to minimize sauce waste, implementing non-destructive test probes for testing without generating food waste, and partnering with ‘Too Good To Go’ underscore our multifaceted approach.
Furthermore, our focus on rework projects and optimizing slicing efficiency through innovative slice grippers are instrumental in decreasing waste across production lines.
The integration of our new planning system marks a significant stride forward. This system enhances forecasting accuracy, enabling us to mitigate overstocks and minimize food waste at its source. Through these collective endeavours, we remain steadfast in our commitment to the war against food waste. We also built up experience collaborating very closely with certain of our key customers in the past few years. This experience has learned us that through increased collaboration – overstocks can also be reduced further in the supply chain, saving money for retailers. Partnerships in this respect can combine sustainability as well as financial benefits throughout the supply chain.
The initiatives taken have resulted in approximately a 6% reduction in food waste in 2023 compared to 2022, reflecting the tangible impact of our collective efforts and innovative solutions in combating food waste.
Adhering closely to the waste hierarchy principle, we prioritize waste prevention and recovery over disposal.
1 https://www.un.org/en/observances/end-food-waste-day
What’s Cooking? Annual report 2023 69 Sustainability Report
A glance at the doughnut chart showing the treatment methods of our food waste reveals a remarkable achievement: nearly 96% of our food waste undergoes recovery processes, leaving almost nothing destined for disposal.
Treatment methods food waste 2023
t
t
t
t
Our Policies and Systems
Our dedication to sustainable packaging and circularity is detailed in our Packaging Policy, accessible on our website: https://whatscooking.group/ en-GB/our-engagement
Our Sustainability Targets
100% recycle-ready
t
Food waste composted
Food waste digested anaerobically for production of biogas
Food waste recovered as animal feed
Food waste recovered as biodiesel
Food waste that contains meat recovered in the rendering industry
Total amount of other organic waste incinerated
Sustainable Packaging
Why Is This Important to Us?
Recognising Global Problems:
Sustainable packaging is crucial as we acknowledge and respond to global challenges, particularly the growing concerns about environmental degradation, plastic waste, and the broader impact on ecosystems.
Fighting Food Waste & Preserving Quality:
Eliminating packaging entirely is not a viable option for us. Packaging plays a critical role in protecting our products from various forms of damage, ensuring that we can consistently deliver the highest quality to our customers. Additionally, it plays a key role in extending shelf lives, ultimately contributing to the reduction of food waste—an essential aspect of our commitment to sustainability. So we search for the most sustainable solutions while ensuring food safety and quality and while avoiding food waste.
Circularity: Extending the life cycle of products
Moving from a linear economic model to a circular economy implies reducing waste to a minimum.
Reducing Carbon Emissions:
Utilizing recycled packaging provides opportunities for reductions in CO2 emissions and the overall quantity of waste that needs disposal.
Consumer and Customer Concerns:
Understanding and addressing the concerns of our consumers and customers is very important, as is educating them well.
Driving Change: Our Sustainability Actions
Whilst packaging is a very important topic for customers and consumers and we want to be at the forefront – introducing new packaging methods to reduce packaging waste and packaging intensity alongside recyclability…we also want to communicate transparently with our customers regarding the added value packaging brings when it comes to reducing food waste & guaranteeing shelf life as well as food safety. We consider it our duty to find solutions that can combine our packaging targets whilst guaranteeing quality and food safety. The importance of working with suppliers and (private label) customers on this topic, is key.
We also refer to the article by Brecht Van Lerberghe on page 31 of this report.
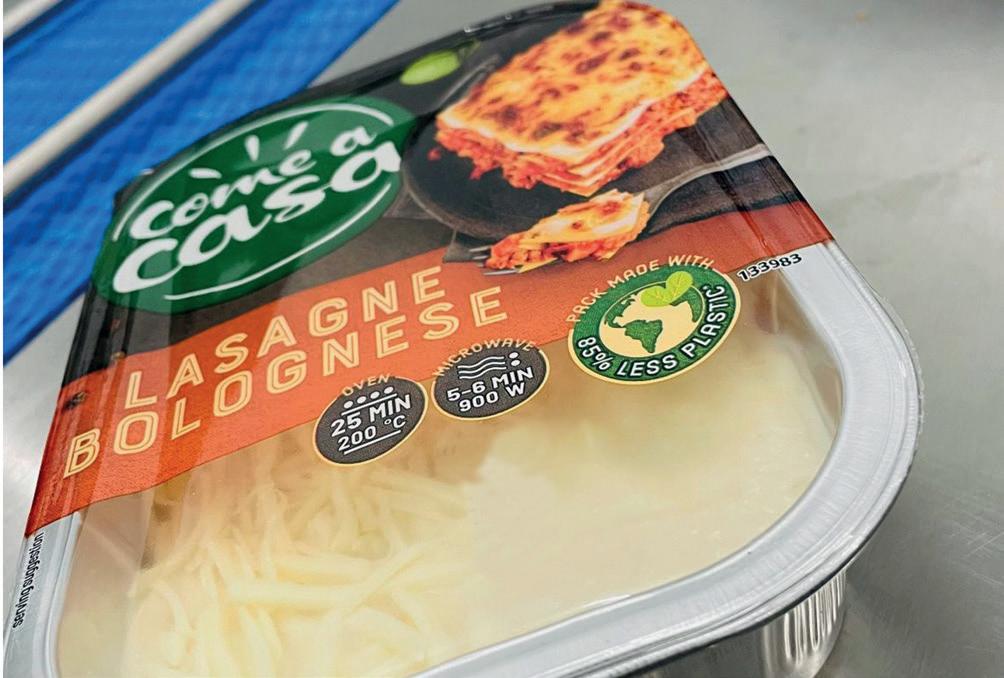
What’s Cooking? Annual report 2023 70
Report
Sustainability
packaging by 2025 30% recycled content in the packaging of our products by 2030 20% reduction of packaging intensity by 2030 (compared to 2022) Only FSC/PEFC certified cardboard & paper
1,793.07
8,894.74
940,78
748.78
87,92
Source Responsibly
Why Is This Important to Us?
Environmental Protection:
Responsible sourcing minimizes environmental impact by promoting sustainable farming practices, reducing deforestation, conserving water, and preserving biodiversity. This ensures that ecosystems remain intact for future generations.
Quality and Safety Assurance:
Responsible sourcing guarantees the quality and safety of ingredients. By selecting high-quality, responsibly sourced materials, we can provide consumers with healthier, safer, and more nutritious products.
Long-Term Viability:
Sustainable sourcing strategies are critical for the long-term viability of the food industry. They reduce reliance on finite resources, mitigate supply chain risks and ensure consistent access to ingredients, thereby promoting resilience to market fluctuations.
Consumer Trust and Reputation:
Consumers are increasingly conscious of the origins of their food. By demonstrating a commitment to responsible sourcing, we build trust, strengthen our brand reputation, and appeal to customers and consumers who value ethical and sustainable products.
Regulatory Compliance and Future-Proofing:
Responsible sourcing practices align with evolving regulations and standards in the food industry. Embracing these practices now can futureproof the company against regulatory changes.
Our Policies and Systems
Our Business Code of Conduct for Suppliers emphasizes the importance of upholding integrity and responsibility throughout our supply chain. Within our Code of Conduct, you can also find our ethics line and whistleblowing platform, where external and internal stakeholders can raise concerns. You can find these document on our website: https://whatscooking. group/en-GB/our-engagement
Furthermore, our Sustainable Procurement Policy and Supplier Code of Conduct outline our commitment to various standards, including those for animal welfare, 100% RSPO certified palm oil, ASC/MSC/Global GAP certified fish, and barn-raised eggs. You can access this policy on our website: https://whatscooking.group/en-GB/our-engagement
To monitor the sustainability performance and drive continuous improvement among our suppliers, we utilize the Supplier Assessment Tool provided by EcoVadis. This tool is further elaborated upon in our Sustainability actions.
Driving Change: Our Sustainability Actions
We set up a Supplier Engagement Program: “Cooking up sustainable partnerships”
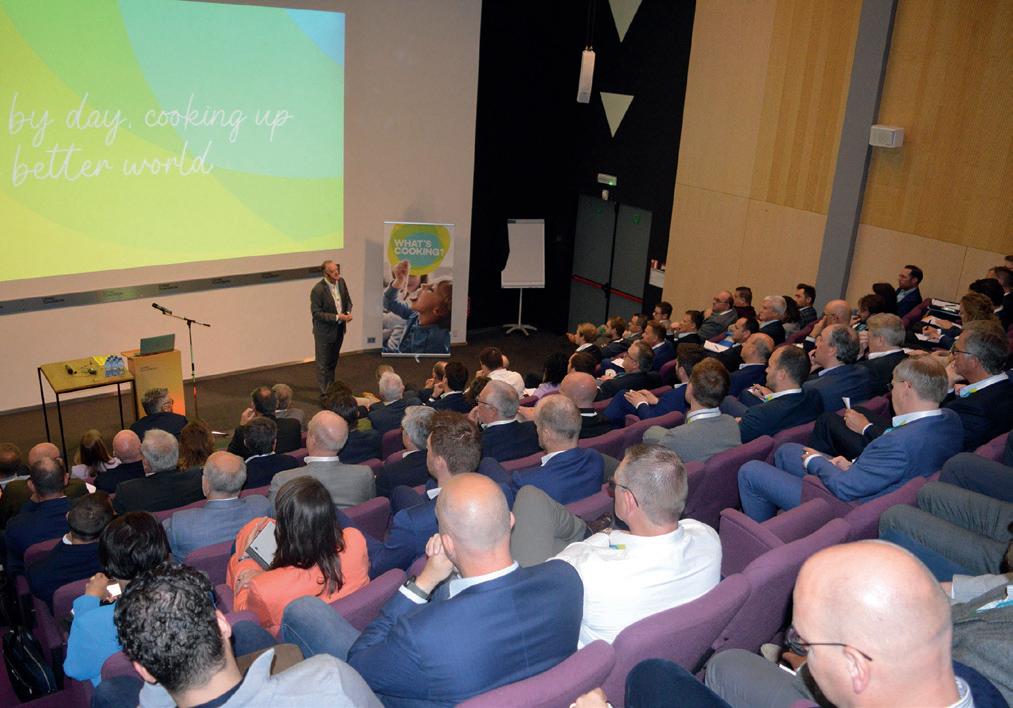
What’s Cooking? Annual report 2023 71 Sustainability Report
100% RSPO certified palm oil 100% ASC/MSC/Global GAP certified fish 100% barn eggs
welfare policy is part of our Sustainable Procurement Policy
Animal
Our Sustainability Targets
Code
by 2024
100% Spend of business critical suppliers covered by contracts with signed Business
of Conduct Suppliers
2025
80% MIP (Meat, Ingredients, Packaging) spend covered by supplier sustainability score by
What’s Cooking? Supplier Day 2023
The program was officially launched during our first Supplier Day in May. Our suppliers were informed about the new strategy of What’s Cooking? with a big focus on sustainability. Our communication underscored not only the criticality of sustainability but also highlighted the pivotal role our suppliers play in this shared journey. Working together across the whole value chain is key. We explained the three important aspects of our Supplier Engagement Program:
• Due Diligence
• Carbon Reduction
Joint Projects
Due Diligence
It is important to set up a process to identify, prevent, mitigate and account for how we address actual and potential adverse impacts related to corporate governance, workers, human rights, the environment, bribery and consumers not just within our own operations, but extending across our entire supply chain and business relationships. This is what is meant with due diligence. In this way, we can ensure a more effective protection of human rights and the environment within the whole value chain.
This process consists out of 6 steps, which are visualised well by the OECD (Organisation for Economic Co-operation and Development) Guidelines:
These steps are being implemented in our procurement process In 2023 we started the process, in order to evaluate the sustainability performance of our suppliers. We targeted 80% of our MIP (Meat, Ingredients, Packaging) spend for the first exercise. To ensure an objective analysis of supplier performance, we selected the EcoVadis Ratings tool. This process involves tailored questionnaires based on the sector and company size,
Communicate
covering four critical sustainability dimensions: environment, labour and human rights, ethics, and sustainable procurement.
What’s Cooking? Annual report 2023 72
Sustainability Report
How impacts are addressed
for or cooperate In remediation when approriate Cease, prevent or mitigate Adverse impacts Track Implementation and results 1 4 3 2 5 Embed Responsible Business conduct Into policies & managements systems 6
Identify & Asses Adverse Impacts In operations, supply chains & business relationships Provide
For every question, a document of proof has to be uploaded, which is analysed by the CSR experts of EcoVadis. This results in a scorecard of every rated supplier. In the graph beneath you can see the supplier performance of the rated What’s Cooking suppliers, ranging from insufficient (red) performance to outstanding (dark green). The chart depicts the number of suppliers, and does not reflect the actual spend with the supplier at this point in time. The shaded grey area shows the average distribution of scorecard of all companies rated by EcoVadis.
Carbon Reduction
As approximately 86% of our scope 3 emissions originate from the products we procure, it’s crucial to collaborate with our suppliers to reduce emissions and enhance the overall carbon footprint across the value chain.
All companies rated by Ecovadis
The program extends beyond a mere scoring system across four distinct themes. Each supplier receives a personalized corrective action plan that highlights their specific sustainability improvement areas. These are categorized by urgency and accompanied by detailed guidelines for enhancement. Our first-year response rate has been remarkably positive (reaching approximately 68%), largely due to our consistent emphasis on the assessment’s significance. We’ve reiterated its importance multiple times, leveraging various communication channels such as the Supplier Day, webinars, and email correspondence. Additionally, our buyers are being trained in sustainability practices and utilizing the EcoVadis tool to ensure comprehensive engagement.
Having gathered this data, we’re equipped to actively engage with suppliers who have received lower sustainability scores, collaborating with them to enhance their performance. This initial assessment served as a base year, providing insights into their current standing. Moving forward, we intend to monitor and track performance, integrating these sustainability metrics into our vendor rating system. Suppliers who consistently neglect or resist prioritizing sustainability might face the consequence of discontinued business relationships. This underscores our commitment to partnering with suppliers who align with our sustainability goals and values.
Other scope 3 emissions: 14%
Purchased goods: 86%
By using the EcoVadis Carbon Action Module, we gain insight into the carbon maturity levels of our suppliers. This allows us to target suppliers with different levels of carbon management and work together to measure their carbon footprint, set achievable targets and implement effective action plans.
In addition, in the coming years we will focus on collecting supplier specific data on the carbon footprint of the products we purchase. Currently, we rely on general data from databases due to the lack of supplier-specific information, but the PCF (Product Carbon Footprint) feature in the tool will help improve our data collection efforts.
Joint Projects
Our procurement team organized three dynamic sessions, inviting several suppliers to present appealing joint projects. These meetings serve as a platform for mutual inspiration and are not just about exchanging information; they are a catalyst for innovation. We encourage suppliers to take a proactive stance and invite them to propose inventive projects aimed at improving operational efficiency, raising sustainability standards and increasing the nutritional value of our products. Through these partnerships, What’s Cooking? envisions a future where sustainability is a shared journey, where the combined efforts of all involved contribute to mutual growth.
A special word of thanks goes to our procurement staff and the various suppliers who volunteered for the inspiration sessions.
What’s Cooking? Annual report 2023 73
Sustainability Report
Overall score distribution 100% 75% 50% 25% 0% 0 25 45 65 85 100 100% 75% 50% 25% 0% Carbon management level distribution Insufficient Beginner Intermediate Advanced Leader
Help people flourish
Guard Employee Safety
Why Is This Important to Us?
Employee Wellbeing
Our people are the cornerstone of our success. Promoting and safeguarding their health, safety, and well-being is non-negotiable. Every individual’s safety is a fundamental concern, aligning with our principle of crafting with care. We believe that all incidents are preventable and will only be successful when all our employees go home safely to their loved ones.
Strategic Importance
Accidents and work-related illnesses not only affect the individuals involved, but can impact their families and other employees, while potentially causing production stoppages, supply disruptions, operational costs and reputational damage to What’s Cooking? as an employer. A safe work environment is not just a box to check; it’s integral to our operational excellence. It’s a strategic priority for What’s Cooking?, integrated into our operations to ensure sustainable success.
Our Policies and Systems
At What’s Cooking?, we prioritize employee safety through our comprehensive Safety Policy, accessible on our website: https://whatscooking. group/en-GB/our-engagement
We have established one easy accessible document that describes the Health & Safety Management System. The Health and Safety Management System (HSMS) is a guide on how safety and health is managed and implemented in our daily processes according to the “Plan – Do –Check – Act” (PDCA) approach in line with the ISO45001 standard. The PDCA approach is used by What’s Cooking? to achieve continuous improvement. In doing so, we will comply with all relevant legal regulations and rules and consider industry best practices. The What’s Cooking? minimum requirements contained in the Health & Safety Management System ensure an appropriate level of safety and health on a group wide scale.
Our Sustainability
Targets
50% reduction of RIFR (Recordable Injury Frequency Rate) by 2024 (compared to 2022)
50% reduction of SIFR (Severity Injury Frequency Rate) by 2024 (compared to 2022)
We define Recordable injuries as Lost Time Injuries. These are injuries where somebody cannot come back to work after an injury at work. In 2022, the Recordable Injury Frequency rate (RIFR) was 4,2, this means for every 200 000 working hours we had 4,1 injuries. In 2023 we reduced this number by 20%, moving to a RIFR of 3,3.
The Severity Injury Frequency Rate measures the number of days that people have to stay home after an injury per 200 000 working hours. The SIFR has reduced from 100 to 61, representing a 39% decrease.
Driving Change: Our Sustainability Actions
Our strategy consists of 3 pillars:
Risk reduction
Further develop our Safety culture
All incidents are preventable
Adherence to Regulations
Reduce risk
This year, we initiated the implementation of the 5 Life Saving Rules, a comprehensive set of guidelines designed to avert serious injuries. Through rigorous training, management oversight, and continuous monitoring, we ensure the effective integration of these critical rules into our operational ethos. Moreover, we prioritize learning from potential near misses, conducting thorough investigations and disseminating key insights throughout the organization. Additionally, we’ve structured a targeted safety training matrix comprising six essential modules tailored for three key groups: managers, team leaders, and operators. Equally, we’ve enhanced the capabilities of our Health & Safety Managers through specialized training in the ICAM (Incident Cause Analysis Method) methodology. This approach enables us to delve deep into identifying organizational, task-related, environmental, team, and individual factors, as well as failed defences, fostering a proactive safety culture.
Increase adherence to regulations and rules
We have reinforced our commitment to regulatory adherence by establishing a robust Health & Safety Management system aligned with the ISO 45001 Standard. This system serves as a comprehensive reference guide outlining health and safety protocols across our operations. Furthermore, our ongoing safety assessments at each factory continually drive enhancements in safety protocols, ensuring alignment with evolving regulatory standards.
Further develop our safety culture
Central to our strategy is the development of a robust safety culture. We’ve introduced the safety room to provide new employees and contractors with a thorough understanding of our safety protocols and organizational values. Through this initiative, we underscore our dedication to ensure every individual returns home safely to their loved ones. Additionally, our 3S philosophy – SEE, SAY, STOP – coupled with the safe behaviour model, fosters a culture of vigilance and intervention. By encouraging open dialogue, we empower employees to proactively identify and address unsafe practices. Moreover, our managerial commitment is evidenced through regular safety visits, where leaders engage with frontline staff to reinforce safety protocols and ensure adherence to the 5 Life Saving Rules.
What’s Cooking? Annual report 2023 74 Sustainability Report
Boost Employee Engagement
Why Is This Important to Us?
Igniting Motivation & Elevating Productivity
At the heart of our people strategy is the belief that engaged employees are naturally motivated. We are committed to nurturing this engagement as it not only fuels motivation, but also increases productivity and unleashes a wave of creativity.
Fuelling Customer Satisfaction & Maximizing Profitability
The ripple effect of increased productivity and creativity of engaged employees is crucial for increasing customer satisfaction. This in turn has a direct impact on profitability by serving as a catalyst for innovation and improving operational efficiency across our organisation.
Fostering Safety & Elevating Quality Standards
Committed employees show increased levels of alertness and strong commitment, resulting in a tangible reduction in safety incidents and quality issues. Their dedicated approach cultivates a culture of alertness and quality awareness, effectively reducing errors and increasing overall operational efficiency.
Absenteeism & Employee Turnover
A workforce that is highly engaged in its role experiences a significant drop in absenteeism because employees are more committed to their responsibilities and work environment. Moreover, engaged workplaces have lower staff turnover rates, as people feel truly valued and connected to the company’s overarching strategy and values, resulting in a significant increase in retention rates.
Our Policies and Systems
At What’s Cooking?, we foster employee engagement through our Business Code of Conduct, available for consultation on our website: https:// whatscooking.group/en-GB/our-engagement. Additionally, we utilize the Engagement Index to measure engagement levels and implement targeted actions for improvement.
Our Sustainability Targets
Engagement
Driving Change: Our Sustainability Actions
Within the domain of Employee Engagement, we distinguish four crucial dimensions: Well-being, Learning & Development, Leadership, and Pride.
Well-being
Our commitment to employee wellbeing is going beyond the conventional approach. It goes beyond physical, mental and emotional health to create an environment where each individual feels truly valued, respected and included. A focus on diversity and inclusion creates a sense of belonging.
Initiatives such as Mindlab, collaboration with physio therapists, dedicated mental health weeks and the establishment of trust liaisons are pivotal components of our holistic approach.
Learning & Development
Our dedication to continuous learning pushes us forward. We invest in comprehensive training programs, empowering employees to not only meet but exceed expectations. This strategic investment in skill development fosters growth and confidence among our workforce.
In line with this commitment, we have created a dedicated Learning & Development (L&D) department consisting of three experienced professionals. The new team is leading the rollout of an L&D program and innovative tools. This demonstrates our ongoing commitment to providing employees with the knowledge, skills and resources vital to their professional journey and the continued success of What’s Cooking?.
Leadership
Leadership excellence is at the heart of our engagement strategy. Effective leadership inspires, motivates, and guides, cultivating a culture characterised by trust, respect, and accountability.
Our leadership initiatives, such as ‘Leadershift” calls and leadership ‘STIR’ meetings, play a crucial role in keeping our leadership team informed about our strategy and focus. These sessions serve as opportunities for learning and growth, enabling our leaders to gain valuable insights to share with their teams and enhance their leadership skills.
Pride
Encouraging a strong sense of pride is essential for strengthening our workplace community. Connecting employees with the company’s purpose, values and achievements increases morale and engagement.
Engagement initiatives such as product tastings, a strategic rebranding with surveys, a strong ambassadors network, strong communication through various channels (social media, newsletters) and good integration of our sustainability strategy into our organisation are crucial to fostering a culture of pride.
What’s Cooking? Annual report 2023 75 Sustainability Report
Index Average
of
by 2028 An average of 18 training hours/employee/year by 2030
Score
>80%
Respect Human Rights
Why Is This Important to Us?
Ethical Considerations:
Ethical sourcing prioritizes fair labour practices, ensuring workers throughout the supply chain are treated fairly, paid equitably, and provided safe working conditions. It also supports local communities, contributing to their economic development.
Consumer Trust and Reputation:
Consumers are increasingly conscious of the origins of their food. By demonstrating a commitment to responsible sourcing, we build trust, strengthen our brand reputation, and appeal to customers and consumers who value ethical and sustainable products.
Regulatory Compliance and Future-Proofing:
Responsible sourcing practices align with evolving regulations and standards in the food industry. Embracing these practices now can futureproof the company against regulatory changes.
Our Policies and Systems
Our Business Code of Conduct, accessible on our website: https://whatscooking.group/en-GB/our-engagement underscores our commitment to upholding human rights across all aspects of our business operations.
Additionally, our Sustainable Procurement Policy and Business Code of Conduct for Suppliers, also available on our website, set clear expectations for our partners regarding human rights standards.
We utilize the Supplier Assessment Tool provided by EcoVadis (see also earlier under ‘supplier engagement’) to monitor supplier sustainability performance, including adherence to human rights standards. Furthermore, with EcoVadis’ AI tool, we can detect potential human rights violations by screening the internet for relevant information.
Through these comprehensive measures, we remain committed to protecting and promoting human rights within our organization and across our supply chain.
Our Sustainability Targets
100% Spend of critical suppliers covered by contracts with signed Business Code of Conduct Suppliers by 2024
80% MIP (Meat, Ingredients, and Packaging) spend covered by supplier sustainability score by 2025
Driving Change: Our Sustainability Actions
In the section addressing responsible sourcing within our second pillar, “Fight Climate Change,” we’ve detailed our strategy centred on due diligence aligned with OECD guidelines and the upcoming Corporate Sustainability Due Diligence Directive (CSDDD) https://commission.europa.eu/publications/ proposal-directive-corporate-sustainability-due-diligence-and-annex_en
Our commitment to protecting human rights across the entirety of our value chain stands as a crucial component of our approach, alongside environmental considerations. We also evaluate our suppliers’ social impact via the EcoVadis platform, aiming to minimize the potential risks associated with human rights violations.

76
Sustainability Report
Sustainability Culture
Tone at the top
To demonstrate the importance of sustainability at What’s Cooking?, the Board decided to establish a Sustainability Board Committee at the start of 2023. This committee is chaired by our chairman. This – alongside a relentless focus during every company meeting on sustainability is the foundation for the sustainability culture at What’s Cooking? (See also the Corporate Governance Section for more details on the Sustainability Committee and its members.)
Each Executive Committee, 3 standard topics are used to open the meeting: Safety, Food Safety & Sustainability.
But a program can only be successful if everyone within the group is ‘on board’. In order to achieve this engagement, we started an ESG ambassador program. This, alongside the technical focus by workstreams on their area of expertise and regular steering committee meetings ensures a solid governance is in place.
ESG Ambassador Program
At What’s Cooking?, our commitment to sustainability is driven by a dedicated team of (volunteer) ESG ambassadors across various departments and functions. With at least one ambassador at every site, we’ve established a robust network that fosters a culture of sustainability within our organization.
Our monthly online meetings serve as a platform for sharing innovative projects and ideas across different sites, promoting cross-pollination and ensuring a streamlined communication flow to our communication manager. These sessions also include brainstorming sessions aimed at making sustainability an intrinsic part of our company’s DNA while keeping it engaging and relatable for everyone. We organize sustainability events centred around specific themes.
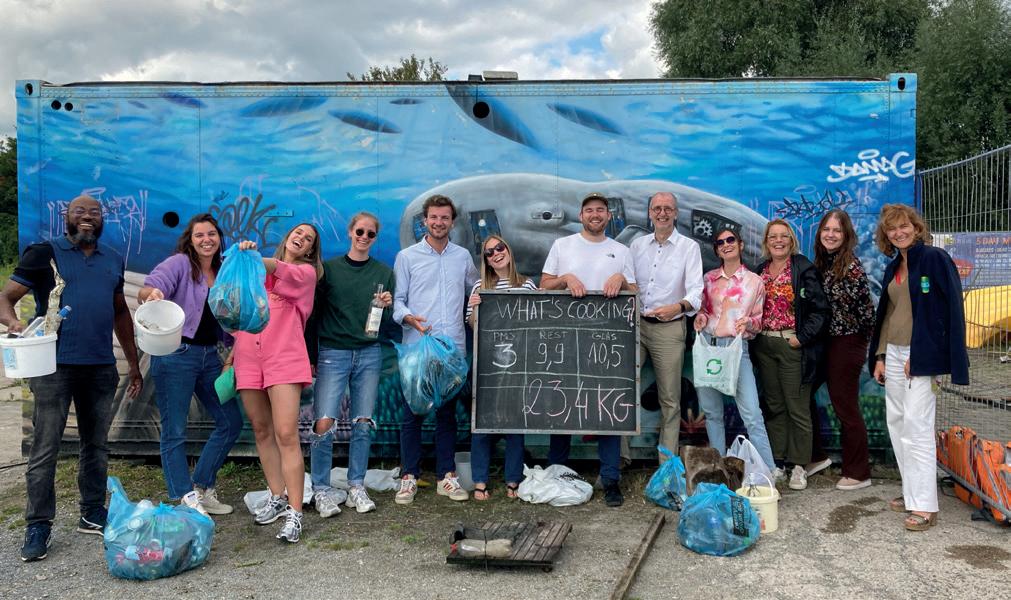
In addition to these monthly virtual meetings, we hosted an ESG ambassador ‘inspiration’ day, where a physical gathering allowed us to connect on a deeper level. The day started with a session on Climate Psychology, followed by group brainstorming sessions to outline our sustainability agenda for the upcoming year. In the afternoon, we joined forces to clean up garbage from the rivers of Ghent using canoes.
The ESG ambassadors play a crucial role in creating a sustainability culture and fostering intrinsic motivation among all team members. These ambassadors not only promote sustainability within our organizational framework but also serve as inspirational figures, setting an example for others within and beyond our company.
ESG Initiative of the Quarter
Winner Q1 2023:
In Ridderkerk, the team came up with a bright idea ! In which they apply a letterbox system, to check the size of the ham “endlogs”. So it can be that simple to reduce waste !
Winner Q2 2023:
On the 10th of May, the Corporate Procurement Department organized the first “Supplier Day”, to explore ideas and perspectives on how to build a better future together with our suppliers.
Winner Q3 2023:
Deeside has passed the ISO14001 environmental audit! This accreditation represents a family of standards by the International Organization for Standardization (ISO) related to environmental management that exists to help organizations minimize how their operations negatively affect the environment. As a group, What’s Cooking? is focused on prioritising sustainability and reducing any negative environmental impact, so we are hugely proud to have been recognised in this way. Here’s to empowering and protecting the planet we share !
Winners Q4 2023:
2 social topics came out as the winners for Q4.
1/ In Lievegem, the team organized “the warmest lunch”, with all proceeds going directly to a local initiative “De Warmste Week”. And for dessert, you could also purchase candy bags. The success of this initiative wasn’t just measured in the funds raised for charity. The simple act of selling a lunch/ candy became a powerful expression of solidarity.
2/ In Mézidon, they organized “a Christmas box collection“ for the most underprivileged.
ESG Events
World Water Day (March 22)
On World Water Day, we took the opportunity to raise awareness about water scarcity. Water will only become scarcer, so we need to use it responsibly.
World Safety Day (April 28)
At What’s Cooking Group we believe that all incidents are preventable. Each of our employees should return home safely to their loved ones. That’s why, we put the spotlight on world day for safety & health at work! We are crafting with care, and are visibly ensuring safety side by side with our people, in all that we do. It really is a team effort to assure that ‘no one gets hurt’!
World Food Safety Day (June 7)
Food safety matters to us every day. Food safety & food quality is never to be compromised. Our customers and consumers are central to all that we do and we apply transparent communication. Each of our employees contributes to food safety by putting quality top of mind. World Food Safety Day offers us an opportunity to speak up about continuous improvement, day by day.
During the “morning panel” of 7th of June, the Plant Manager & FSQR team focused on how the plant is performing against Food Safety:
#/trend on Food Safety complaints top-3
#/ type Recalls experienced related to Food Safety issues
• Results on CCP follow-up and/or auditing with regard to Food Safety
What’s Cooking? Annual report 2023 77
Sustainability Report
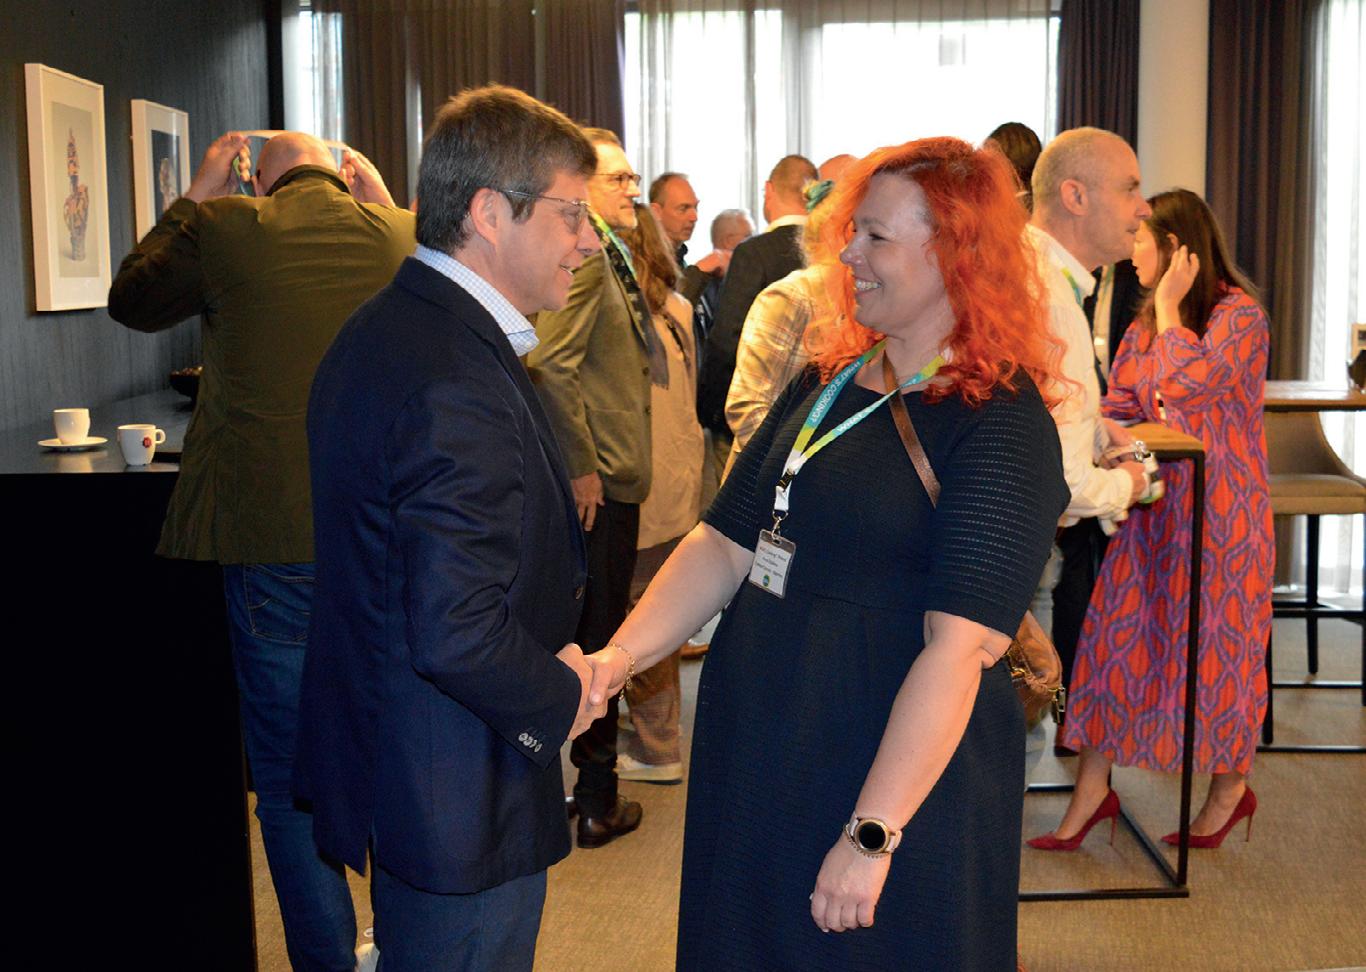

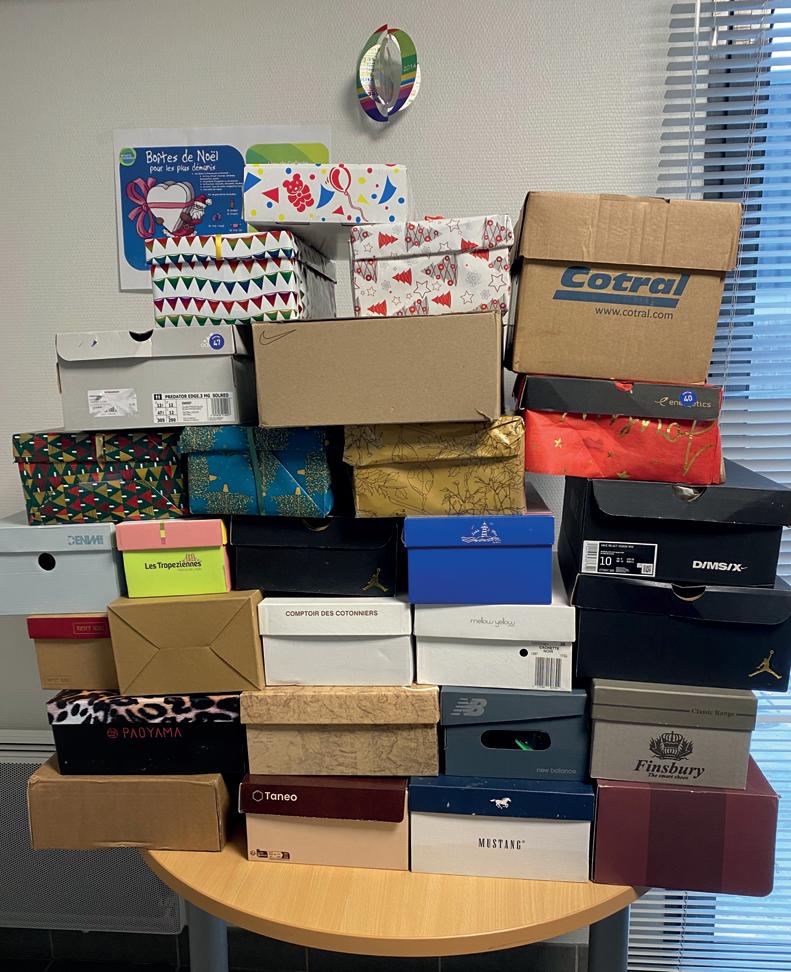
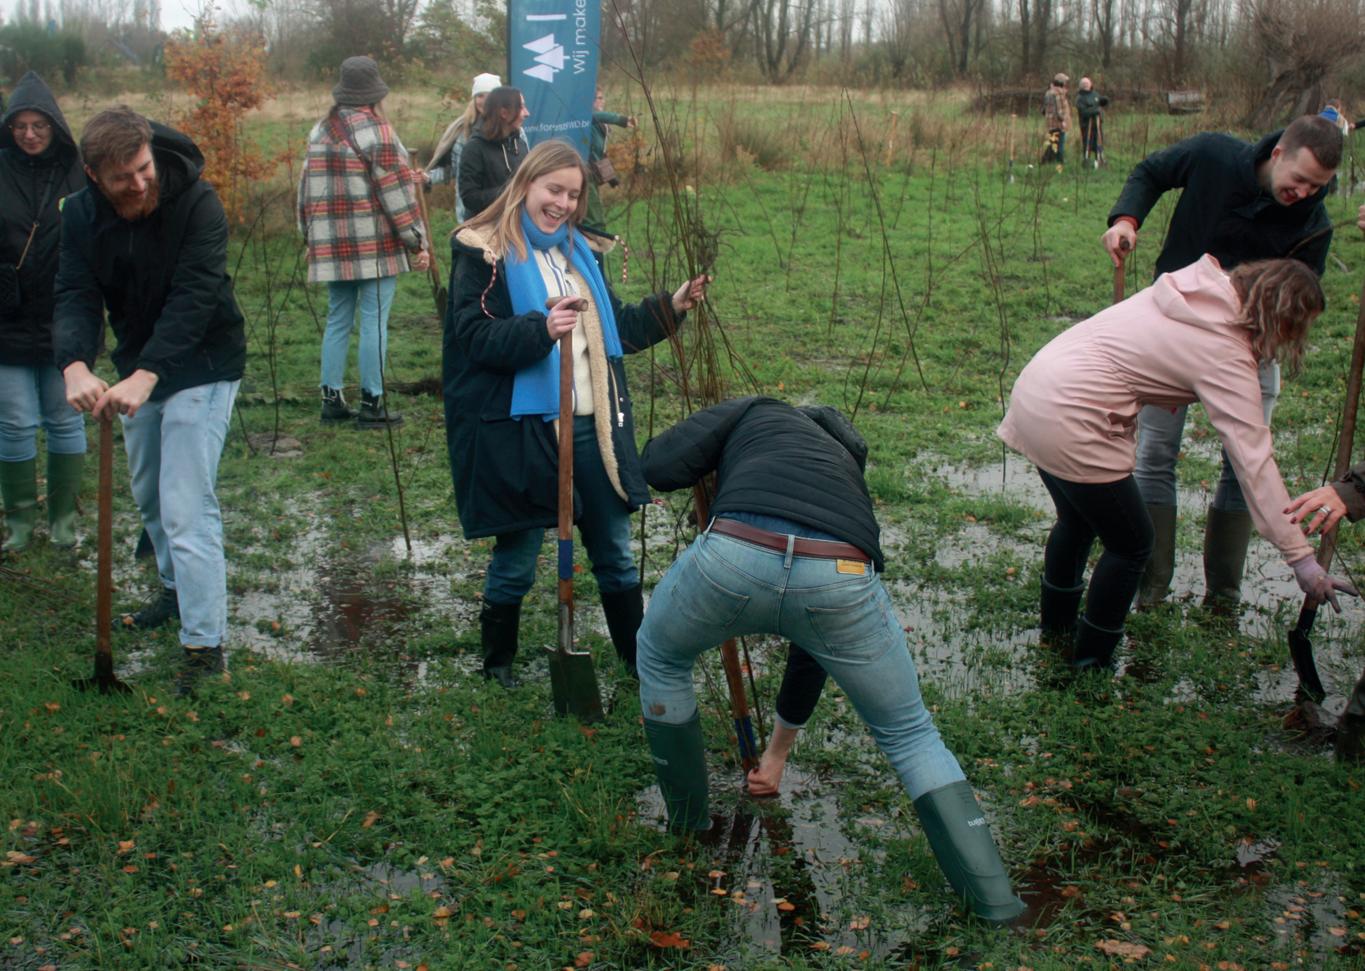
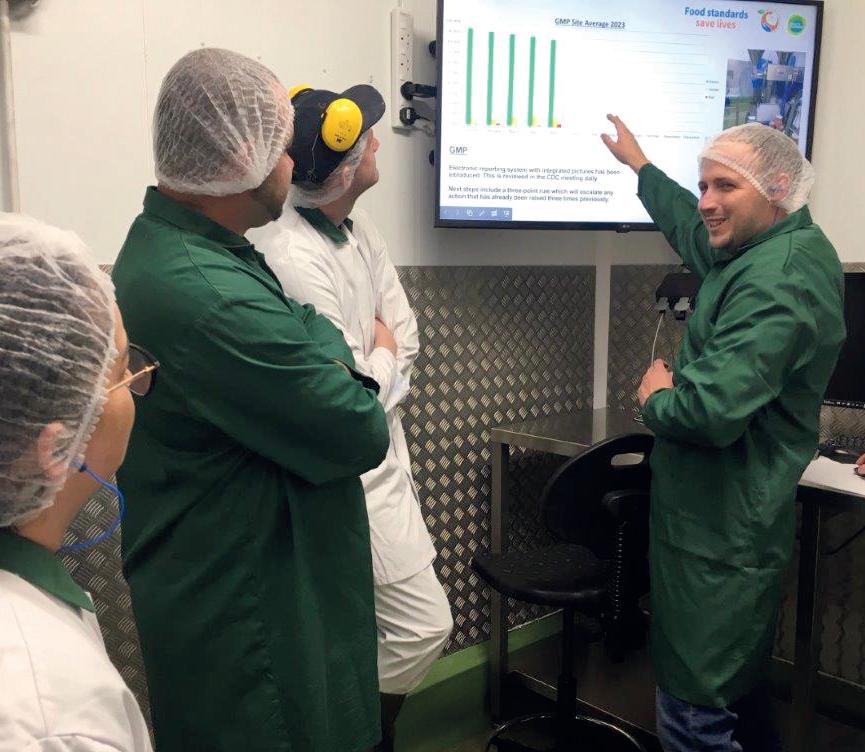
International Day of Awareness of Food Loss and Waste (September 29)
Saving food from going to waste is a step towards a greener cleaner planet. As part of our ESG ambition, we are determined to have as little food waste as possible: we aim to reduce our non-recovered food waste with 20% by 2024 (vs 2022) and use all efforts to assure that any left-over gets recycled.
Small steps, big impact! Since 2022, What’s Cooking? also distributes leftovers through the Too Good To Go app. So far, we have saved 20-ton of Savoury products which corresponds to about 140k kg CO2e or 150 flights to New York. And Yes! We decided to extend the partnership with Too Good To Go to our other sites in Belgium, as well look at similar options abroad. Do you join us on this journey? Do you take your step towards a greener, cleaner planet?
What’s Cooking? Forest (November 19)
Trees, trees, trees ... and … bees.
Yep, at What’s Cooking? we do put up a ‘serious tree’ about it. On the 19th of November several What’s Cooking? employees and their families planted our own company forest, with a nice walking path and spot for bees. Nature creation in our own region close to our headquarters and Lievegem plant. Nearby, so that our employees, their family and friends, and the community around us can enjoy it.
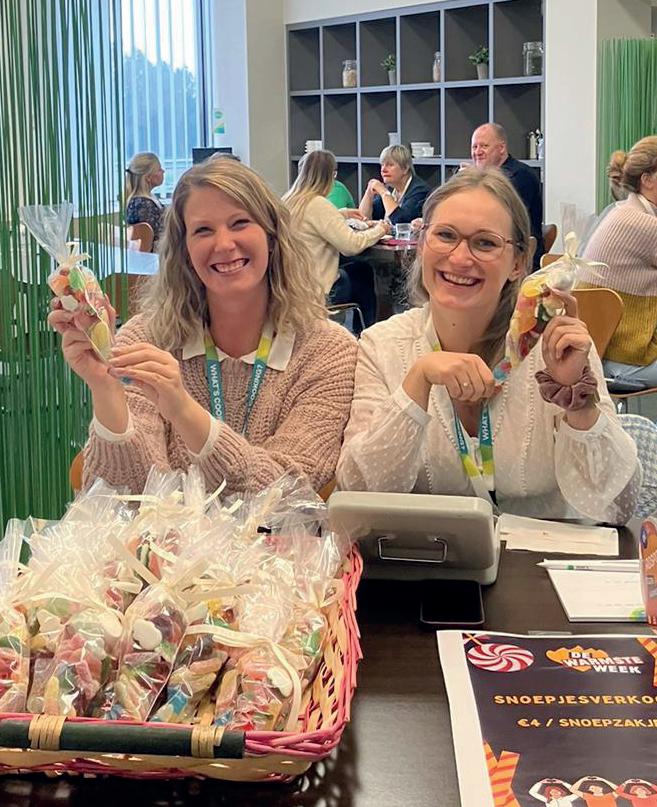
Creating nature is connecting people!
Planting trees together is not only fun, it also brings us closer together and makes our force for good tangible, outside our own company locations where day by day we invest in efforts to reduce the footprint of our products through innovations in production, packaging and product composition. It all fits our purpose: “Day by day, we make sustainable food consumption second nature”. And with our own local forest, we are taking new steps towards a better planet for people to enjoy.
Social initiatives
In Lievegem, we started a cooperation with the organisation “Blij Leven”. This is an organisation for Special Youth Care. They accompany vulnerable young people from special/problematic family situations. The guidance is growth-oriented. Specifically, a number of their young people (who reached the age of 18) will perform a holiday job with us this summer, at our plant in Lievegem. In this way, we help them grow towards independence in life and a better connection with everyone around them. We hope that they may develop further to become strong citizens in our society.
Sustainability Report
Annual report 2023 78
What’s Cooking?
Overview Of Strategic Metrics & Targets
For the first time, What’s Cooking includes quantitative measures in its sustainability report. It is our way to transparently share our achievements and challenges with our stakeholders.
Not all data was available for all years, but we are committed to keep measuring in order to keep improving!
What’s Cooking? Annual report 2023 Sustainability Report 79
Sustainability KPI Unit 2021 2022 2023 Target Number of sites with a higher level IFS or BRC score # 9 All our 12 sites by 2025 %Volume of products sold meeting our nutrition policy % Reporting from 2024 onwards 100% by 2030 %Volume sold that are plant based or vegetarian products % 5.90% 15% by 2030 Scope 1&2 carbon emissions ton CO2e 50,569 54,155 42,234 25,284 by 2030 Scope 3 carbon emissions ton CO2e 965,259 1, 142,141 912,422 657,946 by 2030 %Renewable electricity purchased % 0% 0% 50.9% 100% by 2024 Water withdrawal in litre /kg product sold m3/ton 6.45 6.73 4.51 by 2030 Amount of operational food waste ton 13,689 12,919 6,845 by 2030 %Recycle-ready primary packaging % 29.3% 31.6% 100% by 2025 %Recycled content of primary packaging % 14.5% 10.35% 30% by 2030 Packaging intensity kg packaging/kg product 0.09 0.08 0.07 by 2030 %Spend of critical suppliers covered by contracts with signed Supplier Code of Conduct % 83% 100% by 2024 %MIP (Meat, Ingredients, Packaging) spend covered by supplier sustainability score % 68% 80% by 2025 RIFR (Frequency of accidents) n 4.04 3.39 2.02 by 2024 SIFR (Severity of accidents) n 91.59 67.33 45.8 by 2024 Engagement Index Average Score % 75.54 80% by 2028 Average number of training hours/employee h/employee Reporting from 2024 onwards 18 hours/ employee by 2030 %Functions-at-risk covered by Business Code of Conduct training, incl. anti-corruption and anti-bribery % 0 100% 85% by 2023
Number of sites with a higher level IFS or BRC score
%Volume sold that are plant based or vegetarian products
The Ifs (International Featured Standards) Food Standard Reviews The Products And Production Processes To Evaluate A Food Producer’s Ability To Produce Safe, Authentic, And Quality Products According To Legal Requirements And Customer Specifications. (Https://Www.ifs-Certification.com/En/ Food-Standard )There Are Two Levels Of Certification – Foundation Level (Score Between 75 And 95%) And Higher Level (Score >95%). A Score Below 75% Means That No Certificate Can Be Granted. 8 Of Our Sites Have A Higher Level Score Of More Than 95%, 3 Sites Have A Score Between 92,98% And 94,3%.
The Brc (British Retail Consortium) Global Food Safety Standard Provides A Framework To Manage Product Safety, Integrity, Legality And Quality, And The Operational Controls For These Criteria In The Food And Food Ingredient Manufacturing, Processing And Packing Industry. (Https://Www.brcgs.com/ Our-Standards/Food-Safety/ )The Grading Scale For Brcgs Audits Goes From Aa As The Highest To Uncertified In The Order: Aa, A, B, C, D, Uncertified. An Unannounced Audit Will Have A ‘+’ After The Grade, For Example, Aa+. Two Of Our Sites Are Graded By The Brcgs Audit, One Reached A Aa(+) Score, The Other One An A(+) Score.
A Food Suitable For Vegans Can Be Defined As Follows:
Foods That Are Not Products Of Animal Origin And Where, At No Stage Of The Production And Processing Of The Food, The Following Products Of Animal Origin Have Been Used:
- ingredients (Including Food Additives, Flavourings And Enzymes), Or
- processing Aids, Or
- carriers And Substances Which Are Not Food Additives, But Which Are Used In Strictly Necessary Doses In The Same Way And With The Same Purpose As Carriers, Or
- substances That Are Not Food Additives But Are Used In The Same Way And With The Same Purpose As Processing Aids.
A Food Suitable For Vegetarians Can Be Defined As Follows:
Foods That Comply With The Requirements Of With Respect To Vegan Foods (See 3.1.) With The Difference That The Following Products, As Well As Components Or Derivatives Thereof, May Be Added Or Used In Their Production And Processing:
1. Milk And Dairy Products,
2. Colostrum,
3. Eggs,
4. Honey,
5. Beeswax,
6. Propolis, Or
7. Wool Fat, Including Lanolin Derived From The Wool Of Living Sheep.
We Look At Both Plant-Based And Vegetarian Products To Calculate The %, And Divide This Number By The Total Volume Sold.
Scope 1 & 2 carbon emissions
Scope 3 carbon emissions
We Calculated Our Carbon Emissions According To The Recognized Greenhouse Gas Protocol (Https://Ghgprotocol.org/)
Scope 1 Emissions Are All Direct Greenhouse Gas Emissions. For What’s Cooking? These Are Direct Emissions From Stationary Combustion Sources, Direct Fugitive Emissions And Direct Emissions From Mobile Sources With Combustion Engine.
Scope 2 Emissions Are Indirect Greenhouse Gas Emissions From Consumption Of Purchased Electricity, Heat Or Steam. For What’s Cooking This Is The Electricity We Purchase. We Calculate This Using The Market-Based Approach.
We Calculated Our Carbon Emissions According To The Recognized Greenhouse Gas Protocol (Https://Ghgprotocol.org/)
Scope 3 Emissions Are All Indirect Emissions Except The Scope 2 Emissions. For What’s Cooking? These Are The Indirect Emissions From Purchased Goods And Services, Indirect Emissions From Capital Goods, Emissions Related To Fuel And Energy (Not Included In Scope 1 And 2), Indirect Emissions From Upstream Freight And Distribution, Indirect Emissions From Operational Waste Generated, Indirect Emissions From Business Travels, Indirect Emissions From Employees Commuting, Indirect Emissions From Downstream Freight And Distribution, Indirect Emissions From Use Of Sold Products And Indirect Emissions From EndOf-Life Of Sold Products
What’s Cooking? Annual report 2023 Sustainability Report 80
KPI
information on strategic KPI calculation
Sustainability
Key
%Renewable electricity purchased Purchased Renewable Electricity Is The Electricity We Buy Covered By Guarantees Of Origin. We Divide This By The Total Amount Of Electricity We Buy (Both In Mwh) (Not Taking Into Account The Green Electricity We Generate On Our Own Sites)
Water withdrawal/ton product sold All Water That Is Withdrawn And Brought Into The Facility (Both Tap Water And Ground Water) Divided By The Volume Of Products Sold (Excluding The Intercompany Sales Numbers).
Amount of operational food waste The Amount Of Operational Food Waste Is Calculated By Adding Up The Total Amount Of Pasta Food Waste, The Total Amount Of Meat Food Waste, The Total Amount Of Other Food Waste Without Meat, The Total Amount Of Other Food Waste That Contains Meat And The Total Amount Of Other Organic Waste. It Excludes The Amount Of Sludge From The Water Treatment. We Take All Different Waste Disposal Options Into Account: Animal Feed, Anaerobic Digestion For Production Of Biogas, Compost, Recovery In The Rendering Industry, Recovery As Biodiesel And Incineration (No Food Waste Is Going To Landfill). Next To Striving For A Minimum Amount Of Operational Food Waste, We Strive To Be As High On The Lansink’s Ladder As Possible Concerning Waste Disposal Methods.
%Recycle-ready primary packaging
The Total Amount Of Purchased Primary Packaging That Is Recycle Ready Divided By The Total Amount Of Primary Packaging Purchased. For The Definition Recycle Ready Packaging, We Use The Definition Of Recyclass (Https://Recyclass.eu/Recyclability/Design-For-Recycling-Guidelines/ ).
This Means:
The Product Must Be Made Of A Material That Is Collected For Recycling, Has Market Value, And/Or Is Supported By A Legislatively Mandated Program. The Product Must Be Sorted And Aggregated Into Defined Streams For Recycling Processes. The Product Can Be Processed And Reclaimed/Recycled With Commercial Recycling Processes. The Recycled Material Becomes A Raw Material That Is Used In The Production Of New Products.
%Recycled content of primary packaging Purchased Volume Of Post Consumer + Post Industrial Primary Recycled Material. Post Consumer Recycled Material Is Material That Was Used By The Consumer And Then Recycled And Processed. Post-Industrial Recycled Material Is Material That Is Coming From The Manufacturing Process. Primary Packaging Is The Packaging In Direct Contact With The Product Itself. This Number Is Divided By The Total Purchased Volume Of Primary Packaging.
Packaging intensity
%Spend of critical suppliers covered by contracts with signed Supplier Code of Conduct
%Spend of critical suppliers covered by a supplier sustainability score
RIFR (Frequency of accidents)
SIFR (Severity of accidents)
Packaging Intensity Is Calculated By Dividing The Purchased Volume Of Packaging That Year By The Volume Of Products Sold In That Same Year.
What’s Cooking? Considers The Meat, Ingredients And Packaging Suppliers As Business Critical.
What’s Cooking? Considers The Meat, Ingredients And Packaging Suppliers As Business Critical. Having A Supplier Sustainability Score Means Having An Ecovadis Membership, As We Look At The Sustainability Scores Ecovadis Calculates Based On The Sustainability Input Our Supplier Put Into The Platform. Ecovadis Is A Widely Recognized Sustainability Ratings Provider (Https://Ecovadis.com/) Sustainability Is Measured On Four Themes: Environment, Labour & Human Rights, Ethics And Sustainable Procurement.
We Define Recordable Injuries As Lost Time Injuries. These Are Injuries Where Somebody Cannot Come Back To Work After An Injury At Work. In 2022, The Recordable Injury Frequency Rate (Rifr) Was 4,2, This Means For Every 200 000 Working Hours We Had 4,1 Injuries. In 2023 We Reduced This Number By 20%, Moving To A Rifr Of 3,3.
The Severity Injury Frequency Rate Measures The Number Of Days That People Have To Stay Home After An Injury Per 200 000 Working Hours.
What’s Cooking? Annual report 2023 Sustainability Report 81
Sustainability KPI Key information on strategic KPI calculation
%Functions-at-risk covered by Business Code of Conduct training, incl. anti-corruption and anti-bribery
To Calculate This Score We Look At Just 1 Question Today, “How Likely Are You To Recommend Whats As An Employer To Others?”. In Addition, We Ask 10 Questions, The Score Of Which Is Plotted On Gallup’s Engagement Pyramid. The Survey Is Done In All Our Plants On A Monthly Basis And Is Calculated On The Last 12 Months (Rolling 12 Months).
Enps = ((Promoters - Criticasters)/#Respondents) X100
Promoters = Score > 80%
Neutrals = Score > 65 < 80%
Criticasters = Score < 65%
*For The Future, It Is Important To Paint A More Nuanced Picture Around The Various Engagement Scores. Ideally We Should Not Limit Ourselves To 1 Engagement Number, But Evolve To A Measurement Across The Different Engagement Domains (Appreciation, Leadership,...) That Allows Us To Analyse The Data To A Deep Level And Allows Us To Effectively Take Targeted Actions.
To Consolidate The Engagement Figures, We Have Taken The Business Cluster Engagement Scores And Then Calculated A Weighted Average Of Those Scores, Taking Into Account The Number Of People Working Within The Cluster To Come Up With A Corporate Engagement Score.
At What’s Cooking?, The Functions At Risk For Corruption And Bribery Are The White-Collar Workers. They All Got A Training On Anti-Corruption And Anti-Bribery.
What’s Cooking? Annual report 2023 Sustainability Report
KPI Key information on strategic KPI calculation
Sustainability
Engagement Index Average Score We Use An Engagement Net Promoter Score (Enps) That We Convert To An Engagement Index Score Via A Conversion Table.
82
Sustainability Annex
General information
This sustainability statement has been prepared on a consolidated basis and the scope of consolidation is the same as for the financial statements. It excludes our joint venture ‘Davai’. Where specific company data is available, this data has been used to calculate the emissions or other data included in this report. For scope 3 emissions, we draw your attention to the fact that What’s Cooking? has used generic databases in the absence of specific data. Internationally recognized databases such as Agribalyse (for raw materials and ingredients) and Ecoinvent, Base empreinte as well as Plastics Europe (with respect to Packaging materials) were used amongst others.
Materiality Assessment
1. Process
Materiality assessment is the starting point for our sustainability strategy and reporting under ESRS.
In the figure above you can consult the different steps we took to come to the double materiality assessment.
We will provide a more detailed explanation of the process for assessing impact, financial materiality, and double materiality.
Impact Materiality
To determine the impact materiality, we conducted a stakeholder questionnaire in which stakeholders could indicate the level of impact What’s Cooking? has on the potential material topics. Input from 247 respondents was gathered, including internal stakeholders like employees, the management team and the board, as well as external stakeholders such as suppliers, customers, banks, sector organizations and local communities. This was then complemented with an expert analysis, evaluating the same topics based on severity, considering scale, scope and irremediability, and likelihood of positive and/or negative impacts.
Financial Materiality
Opportunity Assessment:
• Internal experts were consulted to assess the size of potential positive financial effects and their likelihood of occurrence for the list of possible material topics
• A scale of high, medium, and low was used to categorize both the size and likelihood (see table xxx, time horizons in line with the ESRS definitions)
Risk Assessment:
• Internal experts were consulted to assess the size of potential negative financial effects and their likelihood of occurrence for the list of possible material topics
Similar to opportunities, a scale of high, medium, and low was used to categorize both the size and likelihood
Scaling to Numerical Values:
The text categories (high, medium, low) were rescaled to numerical values of 5, 3, or 1.
This rescaling allows for quantitative calculations and analysis.
Quantitative Calculation:
Likelihood and the size of potential effects were multiplied for both opportunities and risks.
The results for opportunities and risks were then added together.
The maximum possible value was 50, which was rescaled to 5.
What’s Cooking? Annual report 2023 Sustainability Report 83
Legend Likehood Financial Impact High 5 High possibility that it will happen within next 1 year High 5 > 5 million turnover Medium 3 High possibility that it will happen within next 5 year Medium 3 1 million - 5 million turnover Low 1 Not probable that it will happen by 2030 Low 1 < 1million turnover
Double Materiality
Plotting the impact materiality on the vertical axis and the financial materiality on the horizontal axis, results in the matrix below:
To determine thresholds for identifying very high and high material topics, we set 80% of the maximum materiality as the threshold for very high
material topics. A threshold of 60% of the maximum materiality was applied to identify high material topics. The outcome was discussed and reviewed by the Executive Committee.
We took into account the key learnings from the double materiality matrix when developing our long term plans (including both Capex and Opex).
What’s Cooking? Annual report 2023 84 Sustainability Report
2. Outcome
Very high material topics:
Climate change
• Description of IRO (Impact, Risk, Opportunities), current and anticipated effects, expected time horizons, current financial effects, resilience of strategy can be found under E1-Climate Change
Highly material topics:
Product innovation
Description of IRO, current and anticipated effects, expected time horizons, current financial effects, resilience of strategy can be found under S4-Consumers and End-users and E1-Climate Change
Nutritious products
• Description of IRO, current and anticipated effects, expected time horizons, current financial effects, resilience of strategy can be found under S4-Consumers and End-users
Sustainable packaging
• Description of IRO, current and anticipated effects, expected time horizons, current financial effects, resilience of strategy can be found under E5-Resource Use and Circular Economy
Sustainable procurement
• Description of IRO, current and anticipated effects, expected time horizons, current financial effects, resilience of strategy can be found under S2-Workers in the Value Chain and G1-Business Conduct
(food) Waste management
• Description of IRO, current and anticipated effects, expected time horizons, current financial effects, resilience of strategy can be found under E5-Resource Use and Circular Economy
Water management
• Description of IRO, current and anticipated effects, expected time horizons, current financial effects, resilience of strategy can be found under E3-Water and Marine Resources
Food safety & quality
• Description of IRO, current and anticipated effects, expected time horizons, current financial effects, resilience of strategy can be found under S4-Consumers and End-users
Energy efficiency
Description of IRO, current and anticipated effects, expected time horizons, current financial effects, resilience of strategy can be found under E1-Climate Change
Safe working environment
Description of IRO, current and anticipated effects, expected time horizons, current financial effects, resilience of strategy can be found under S1-Own Workforce
Employee health & wellbeing
• Description of IRO, current and anticipated effects, expected time horizons, current financial effects, resilience of strategy can be found under S1-Own Workforce
Employee engagement
• Description of IRO, current and anticipated effects, expected time horizons, current financial effects, resilience of strategy can be found under S1-Own Workforce
Moderate material topics:
Actually some of the moderate material topics can also be found in the Sustainability Statement.
Human rights & Business ethics
Description of IRO, current and anticipated effects, expected time horizons, current financial effects, resilience of strategy can be found under G1-Business Conduct
Traceability raw materials
• Description of IRO, current and anticipated effects, expected time horizons, current financial effects, resilience of strategy can be found under S2-Workers in the Value Chain
Animal welfare
• Description of IRO, current and anticipated effects, expected time horizons, current financial effects, resilience of strategy can be found under G1- Business Conduct
Training & Development and Diversity & Inclusion
• Description of IRO, current and anticipated effects, expected time horizons, current financial effects, resilience of strategy can be found under S1-Own Workforce
What’s Cooking? Annual report 2023 85 Sustainability Report
EU-taxonomy
General
In 2019, the European Commission announced the Green Deal for the European Union. This Green Deal aims to increase sustainable investments to achieve climate neutrality by 2050. This economy with net-zero GHG (Greenhouse Gas) emissions by 2050 should already achieve a 55% emissions reduction by 2030. The EU taxonomy regulation should provide a mandatory and harmonized framework to determine which economic activities can be considered environmentally sustainable.
Legal Framework
Article 9 of Regulation 2020/852 (the European Taxonomy Regulation) covers the following six environmental objectives:
1. the mitigation of climate change
2. the adaptation to climate change
3. the sustainable use and protection of water and marine resources
4. the transition to a circular economy
5. the prevention and control of pollution
6. the protection and restoration of biodiversity and ecosystems
The European Union published a list of economic activities that must meet the first two environmental objectives. These are the energy sector, certain manufacturing activities, transportation and construction - but not (yet) the food sector.
First adoption
We only discuss the types of revenue relevant within the EU taxonomy, namely CapEx (capital expenditure) and OpEx (operating expenditure). As our core activities are not yet covered by the EU taxonomy regulation, the annual revenues eligible for the taxonomy are 0% of our total revenues both in 2022 and 2023. The group’s activities may appear later in the list of eligible activities for Objectives 3 to 6 above. Once more details are available for the other economic activities that may qualify, the group will schedule an analysis around this.
The following OpEx and CapEx are relevant to the group in the context of EU taxonomy & ‘climate mitigation’:
• 4.17 – Cogeneration of heat/Cool and power from solar energy
• 4.19 - Cogeneration of heat/cool and power from renewable non-fossil gaseous and liquid fuels
• 5.2 – Renewal of water collection, treatment and supply systems
• 5.4 – Renewal of waste water collection and treatment
• 6.4 – Operation of personal mobility devices, cycle logistics 6.5 – Transport by motorbikes, passenger cars and light commercial vehicles
• 7.2 – Renovation of existing buildings
• 7.4 – Installation, maintenance and repair of charging stations for electric vehicles in buildings (and parking spaces attached to buildings)
Given the focus on environmental investments that also contribute to keeping our energy costs manageable - also encouraged by (government) energy policy agreements and similar measures - our ratio for CapEx eligible under the taxonomy is 5% to our total capex for 2022 and 13% for 2023. (numerator = eligible CapEx under the taxonomy & denominator is the total acquisition value of tangible and intangible assets for the relevant fiscal year as included in notes 15 & 16 of the 2023 Annual Financial Report). (For 2022, the total acquisition values for tangible and intangible non-current assets amounted to EUR 23.379 thousand and for 2023 they amounted to EUR 24.770)
The above topics are not part of our revenue generating core business, therefore our OpEx ratio is immaterial for both 2022 and 2023. (OpEx includes operating costs eligible under the taxonomy as a percentage of total operating costs for maintenance, repair, transportation and energy). We only had some minor lease costs related to electric bikes in 2023. The total OpEx eligible under the taxonomy was EUR 28,201 thousand in 2022 and EUR 31,296 thousand in 2023.
Where various activities could overlap in terms of revenue, CapEx or OpEx for reporting the EU taxonomy data, we only include the figure in the numerator where it is most relevant, to avoid double counting. In 2022, this was not applicable given the nature of the CapEx projects included.
Climate Change mitigation
Climate change mitigation means the process of keeping the global average temperature increase to below 2°C and making efforts to limit it to 1.5°C as defined in the ‘Paris Agreement’. Below we describe further details about our ‘Taxonomy eligible & aligned’ economic activities.
To assess whether the activities below are “aligned,” 3 alignment criteria were applied:
Substantial contribution to climate change mitigation
Not significantly impeding climate change adaptation or the transition to a circular economy and/or pollution prevention & control Meet ‘minimum safeguards’
Cogeneration of heat/cool and power from solar energy (# 4.17 above)
The group has solar energy installations at several sites. It uses this solar energy in its production facilities. These are either owned by the group or leased or are part of a ground lease granted to a third party that sells the energy from the installation to the group.
Given that no CapEx amounts were spent on new solar installations in 2022 / 2023 nor OpEx costs incurred that qualify, the group has no reportable qualifying amounts for this activity even though it has such solar installations in operation. The group only had costs for the purchase of the solar energy and further paid for CapEx which in previous years was recognized as an acquisition under the guidance of IFRS 16.
Consequently, no testing is to be performed based on the “screening criteria” for this activity.
86 What’s Cooking? Annual report 2023
Sustainability Report Environmental
Cogeneration of heat/cool and power from renewable non-fossil gaseous and liquid fuels (# 4.19 above)
The group has such installations at various sites. It uses cogeneration of heat / cool in its own production process.
The majority of Capex and Opex spending happened already in previous years. There was only a minor expansion of the Capex related to the cogeneration installations in 2023.
1st check : substantial contribution to climate change mitigation
Thanks to the cogeneration installation, fewer energy is required to run the operations. The installation therefore contributes substantially to lower CO2e emissions.
2nd check: Do not significantly harm climate change adaptation or the transition to a circular economy and/or prevention of & control of pollution
The recovery of heat does not significantly harm climate change adaptation or the transition to a circular economy. It helps this transition. There is no incremental pollution related to this technique.
3rd check : Complies with the minimum safeguards.
The installation complies with the minimum safeguards.
Renewal of water collection, treatment and supply systems (# 5.2 above)
The group has such installations at various sites. It uses this water (after treatment) in its production process. Investments in 2023 were minor but they are expected to increase further in the future.
The water supply system net average energy consumption for abstraction and treatment equals to or is lower than 0,5 kWh per cubic meter produced water supply. Net energy consumption may take into account measures decreasing energy consumption, such as source control (pollutant load inputs), and, as appropriate, energy generation (such as hydraulic, solar and wind energy);
1st check : substantial contribution to climate change mitigation
The renewal of the water supply system leads to improved energy efficiency by decreasing the net average energy consumption of the system by at least 20% compared to own baseline performance averaged for three years, including abstraction and treatment, measured in kWh per cubic meter produced water supply;
2nd check: Do not significantly harm climate change adaptation or the transition to a circular economy and/or prevention of & control of pollution
The installation does not significantly harm climate change adaptation or the transition to a circular economy and/or prevention of & control of pollution.
3rd check : Complies with the minimum safeguards.
The installation complies with the minimum safeguards.
The group considers it highly likely that further investments will be made in the future to optimize water consumption / re-use.
Renewal of waste water collection and treatment (# 5.4 above)
The group has such installations in various sites. The systems aim to correctly collect and treat wastewater generated during the production process.
The group only invested immaterial amounts in 2023 but expects to make further investments in the coming years to optimize water (re) consumption.
Electric cars (# 6.5 above)
The group began leasing electric cars in 2021. In 2022, further electric cars were purchased for a CapEx amount of EUR 276 thousand. The amount increased further to EUR 1.131 thousand in 2023. Through a change in its “car policy,” the group made entering into a lease for electric cars more attractive to employees compared to fossil-fueled cars. The group therefore expects a further increase in the number of electric cars in the future.
1st check : substantial contribution to climate change mitigation
The group’s electric vehicles meet this requirement as electric cars have lower emissions than the limit in the technical screening criteria. The group’s lease contracts include maintenance and also repair.
The activity meets the following criteria: for M1 and N1 category vehicles, both of which fall under the scope of Regulation (EC) No. 715/2007: until December 31, 2025, the specific CO2 emissions, as defined in Article 3(1)(h) of Regulation (EU) 2019/631, are lower than 50gCO2/km (low- or zero-emission light commercial vehicles);from January 1, 2026, the specific CO2 emissions, as defined in Article 3(1)(h) of Regulation (EU) 2019/631, are zero. for L category vehicles, the tailpipe CO2 emissions are equal to 0g CO2e/km, calculated in accordance with the emissions test of Regulation (EU) 168/2013.
2nd check: Do not significantly harm climate change adaptation or the transition to a circular economy and/or prevention of & control of pollution
At the end of the lease, the cars are returned to the leasing company and sold by the latter on the second-hand market. This shows that the activity does not violate the above criterion and a circular economy. Pollution control and prevention: electric cars have lower emissions versus other cars.
Circular Economy: M1 and N1 category vehicles are both: reusable or recyclable to a minimum of 85% by weight; reusable or recoverable to a minimum of 95% by weight. Measures have been taken to manage waste both in the use (maintenance) and end-of-life phases of the vehicle fleet, including through reuse and recycling of batteries and electronics (especially critical raw materials therein), in accordance with the waste hierarchy.
Pollution Prevention and Control: The vehicles meet the requirements of the latest applicable stage of Euro 6 type-approval for light vehicles(246), as established in accordance with Regulation (EC) No 715/2007. The vehicles comply with the emission thresholds for clean light vehicles in Table 2 of the Annex to Directive 2009/33/EC of the European Parliament and of the Council(247). However, for road vehicles of categories M and N, the tires do not all meet the rolling noise requirements in the highest class and the rolling resistance
87 What’s Cooking? Annual report 2023
Sustainability Report Environmental
coefficient (which affects the energy efficiency of the vehicle) in the two highest classes, as set in Regulation (EU) 2020/740 and as can be verified in the European Product Register for Energy Labeling (EPREL). The vehicles comply with Regulation (EU) No 540/2014 of the European Parliament and of the Council(248).
3rd check : Complies with the minimum safeguards.
According to our analysis, this activity meets the minimum safeguard requirements.
The group considers it likely that further investments will be made in the future to further electrify the commercial vehicles and light commercial vehicles fleet.
Renovation of existing buildings (# 7.2 above)
As a fresh food producer, we mainly use chilled rooms and freezers. Investing in the renovation of roofs - walls & partitions and the general insulation of buildings not only provides increased energy efficiency that is significant in the areas where they are applied but also reduces costs. There were EUR 916 thousand of CapEx investments in 2022 and EUR 1.753 thousand in 2023 relating to renovations of existing buildings covered by the scope.
1st check : substantial contribution to climate change mitigation
The renovations included meet the applicable requirements for major renovations or the renovations result in at least a 30% reduction in primary energy demand.
2nd check : Do not significantly harm climate change adaptation or the transition to a circular economy and/or prevention of & control of pollution
The activity meets the criteria set forth in Appendix A of the Annex to the relevant regulation.
3rd check : Meets minimum safeguard standards
Water: If installed as part of renovation work, excluding renovation work in residential buildings, the specified water consumption for the following water appliances shall be demonstrated by product data sheets, a building certificate or an existing product label in the Union, in accordance with the technical specifications in Appendix E of the relevant Appendix to the Regulation: sink taps and kitchen faucets have a maximum water flow of 6 liters/min; showers have a maximum water flow of 8 liters/min; toilets, including suites, wash bowls and flush cisterns, have a full flush volume of no more than 6 liters and a maximum average flush volume of 3.5 liters; urinals use no more than 2 liters/bowl/hour. Flush urinals have a maximum full flush volume of 1 liter.
Circular Economy: At least 70% (by weight) of non-hazardous construction and demolition waste (excluding naturally occurring materials referred to in category 17 05 04 of the European List of Waste established by Decision 2000/532/EC) generated at the construction site shall be prepared for reuse, recycling and other forms of material recovery, including backfilling operations where waste is used to replace other materials, in accordance with the waste hier-
archy and the EU Protocol on Construction and Demolition Waste Management. Operators shall reduce waste generation in processes related to construction and demolition, in accordance with the EU Protocol on Construction and Demolition Waste Management, taking into account best available techniques and by selective demolition to enable the removal and safe handling of hazardous substances and facilitate reuse and high-quality recycling through selective disposal of materials, using available sorting systems for construction and demolition waste. Building designs and construction techniques support circularity and, in particular, demonstrate, with reference to ISO 20887 or other standards for assessing the disassembly or adaptability of buildings, how they are designed to be more resource-efficient and to be adaptable, flexible and dismantleable to enable reuse and recycling.
Given the strict criteria around circularity, the group cannot guarantee compliance in all its projects during 2022 and 2023. Consequently, for this component, we cannot confirm compliance with this requirement.
Pollution Prevention & Control: Building components and materials used in construction comply with the criteria of Appendix C of the Annex to the Appendix to the Regulation. Building components and materials used in the renovation of buildings that may come into contact with occupants emit less than 0.06 mg of formaldehyde per m3 of material or component and less than 0.001 mg of other category 1A and 1B carcinogenic volatile organic compounds per m3 of material or component, when tested in accordance with CEN/EN 16516 or ISO 16000-3:2011 or other equivalent standardized test conditions and determination methods. Measures are taken to reduce noise, dust and pollutant emissions during construction or maintenance activities and also to reduce the impact on food safety to zero.
Installation, maintenance and repair of charging stations for electric vehicles in buildings (and parking spaces attached to buildings) (# 7.4 above)
The group began leasing electric cars and gradually installing charging infrastructure at its buildings in Belgium and the Netherlands in 2021. Further charging points were purchased in 2022 for a CapEx amount of EUR 8 thousand and 2023 for a CapEx amount of EUR 177 thousand.
1st check : substantial contribution to climate change mitigation
The installation of electric vehicle charging stations is consistent with the above contribution as explained under #6.5 above.
2nd check : Do not significantly harm climate change adaptation or the transition to a circular economy and/or prevention of & control of pollution
The activity meets the criteria set forth in Appendix A of the Annex to the relevant regulation.
3rd check : Complies with the minimum safeguards.
The group deems it likely that further investments will be made in the future given the fairly sharp rise in the number of electric cars.
88 What’s Cooking? Annual report 2023
Sustainability Report Environmental
Appendices: Schematic overviews Turnover, CapEx and OpEx: see appendix at the end of this chapter (Pages 89 to 91).
Other
The group has performed an initial analysis around the applicability of IAS 36 in the context of assets that may be subject to the effects of climate change and changing legislation in the context of the broader sustainability initiatives from the EU. The group has no indications that impairment indications are present for the group in 2022 or 2023.
To be continued…
As the EU taxonomy will soon expand to include “food and beverage production,” we expect an increase in monitored KPIs in the future. We anticipated this as best we could so that we can already report to you in this annual report on progress both for sector agnostic (sector-independent) KPIs and what we believe are relevant sector-specific KPIs as well as our company-specific KPIs. Meanwhile, we remain committed to sustainability as a core element of our strategy. We set concrete targets as described earlier in this report and systematically monitor all indicators related to ESG. As What’s Cooking? we are convinced that we can have a real impact within our industry in the future and have the ambition to remain a leader in sustainability.
Proportion of turnover from products or services associated with Taxonomy-aligned economic activitiesdisclosure covering year 2023
Substantial contribution criteria
DNSH criteria (‘does not significantly harm’) Economic activities
89
2023
What’s Cooking? Annual report
Codes Absolute Turnover EUR'000 Proportion of turnover % Climate change mitigation % Climate change adaptation % Water and marine resources % Circular Economy % Pollution % Biodiversit and ecosystems % Climate change mitigation Y/N Climate change adaptation Y/N Water and marine resources Y/N Circular Economy Y/N Pollution Y/N Biodiversit and ecosystems Y/N Minimum safeguards Y/N Taxonomy aligned proportion of turnover, year 2023 % Taxonomy aligned proportion of turnover, year 2022 % Category (enabling activity) Category (transitional activity) A/ TAXONOMY ELIGIBLE ACTIVITIES A1 Environmentally sustainable activities (taxonomy aligned) None N/A - 0% 0% 0% 0% 0% 0% 0% 0% 0% Turnover of environmentally sustainable activities (Taxonomy aligned) (A1) N/A - 0% 0% 0% 0% 0% 0% 0% 0% 0% A2 Taxonomy-eligible but not environmentally sustainable activities (not Taxonomy-aligned activities) None N/A - 0% Turnover of Taxonomy -eligible but not environmentally sustainable activities (not Taxonomy aligned) (A2) N/A - 0% 0% 0% Total (A1+A2) - 0% 0% 0% B/ TAXONOMY-NON-ELIGIBLE ACTIVITIES Turnover of Taxonomy-non-eligible activities (B) 832,326 100% Total (A+B) 832,326 100% Sustainability Report Environmental
Proportion of CapEx from products or services associated with Taxonomy-aligned economic activitiesdisclosure covering year 2023
Substantial contribution criteria DNSH criteria (‘does not significantly harm’)
Economic activities
A/ TAXONOMY ELIGIBLE ACTIVITIES
A1 Environmentally sustainable activities (taxonomy aligned)
90
Cooking? Annual report 2023
What’s
Codes Absolute CapEx EUR'000 Proportion of CapEx % Climate change mitigation % Climate change adaptation % Water and marine resources % Circular Economy % Pollution % Biodiversit and ecosystems % Climate change mitigation Y/N Climate change adaptation Y/N Water and marine resources Y/N Circular Economy Y/N Pollution Y/N Biodiversit and ecosystems Y/N Minimum safeguards Y/N Taxonomy aligned proportion of capex, year 2023 % Taxonomy aligned proportion of capex, year 2022 % Category (enabling activity) Category (transitional activity)
Cogeneration of heat/cool and power from renewable non-fossil
and liquid fuels 4.19 113 0.46% 100% Y Y Y Y Y 0.46% 0.00% Y Renewal of water collection, treatment and supply systems 5.2 7 0.03% 100% Y Y Y Y Y Y Y 0.03% 0.00% Y Installation, maintenance and repair of charging stations for electric vehicles in buildings (and parking spaces attached to buildings) 7.4 177 0.72% 100% Y Y Y Y Y 0.72% 0.03% Y CapEx of environmentally sustainable activities (Taxonomy aligned) (A1) N/A 297 1.20% 100% 1.20% 0.03% A2 Taxonomy-eligible but not environmentally sustainable activities (not Taxonomy-aligned activities) Transport by motorbikes, passenger cars and light commercial vehicles 6.5 1,131 4.57% 100% 0% Y Y N Y 4.57% 1.18% Y Renovation of existing buildings 7.2 1,753 7.08% 100% 0% Y Y N Y Y 7.08% 3.92% Y CapEx of Taxonomy -eligible but not environmentally sustainable activities (not Taxonomy aligned) (A2) 2,884 11.64% 100% 0% 11.64% 5.10% Total (A1+A2) 3,181 12.84% 12.84% 5.13% B/ TAXONOMY-NON-ELIGIBLE ACTIVITIES CapEx of Taxonomy-non-eligible activities (B) 21,589 87.16% Total (A+B) 24,770 100.00%
Report Environmental
gaseous
Sustainability
Proportion of OpEx from products or services associated with Taxonomy-aligned economic activitiesdisclosure covering year 2023
Substantial contribution criteria DNSH criteria (‘does not significantly harm’) Economic
91 What’s Cooking? Annual report 2023
activities Codes Absolute OpEx EUR'000 Proportion of OpEx % Climate change mitigation % Climate change adaptation % Water and marine resources % Circular Economy % Pollution % Biodiversit and ecosystems % Climate change mitigation Y/N Climate change adaptation Y/N Water and marine resources Y/N Circular Economy Y/N Pollution Y/N Biodiversit and ecosystems Y/N Minimum safeguards Y/N Taxonomy aligned proportion of OpEx, year 2023 % Taxonomy aligned proportion of OpEx, year 2022 % Category (enabling activity) Category (transitional activity) A/ TAXONOMY ELIGIBLE ACTIVITIES A1 Environmentally sustainable activities (taxonomy aligned) Operation of personal mobility devices, cycle logistics 6.4 12 0.04% 100% 0% 0% 0% 0% 0% Y Y Y 0.04% 0% OpEx of environmentally sustainable activities (Taxonomy aligned) (A1) N/A 12 0.04% 0% 0% 0% 0% 0% 0% 0.04% 0% A2 Taxonomy-eligible but not environmentally sustainable activities (not Taxonomy-aligned activities) None N/A - 0% OpEx of Taxonomy -eligible but not environmentally sustainable activities (not Taxonomy aligned) (A2) N/A - 0% 0% 0% Total (A1+A2) 12 0% 0% 0% B/ TAXONOMY-NON-ELIGIBLE ACTIVITIES OpEx of Taxonomy-non-eligible activities (B) 31,284 100% Total (A+B) 31,296 100% Sustainability Report Environmental
Climate
1. Material IRO (Impacts, Risks, Opportunities)
Material negative impacts
Our current corporate carbon footprint is 954 656 ton CO2e for the year 2023. Notably, our products contain ingredients with a significant CO2 footprints, such as meat and dairy. The total associated GHG emissions of our purchased meat and ingredients amount to 748 890 ton CO2e in 2023. Most of these emissions originate from our upstream value chain, particularly from our business relations with second, third or fourth-tier suppliers, including farmers and feed companies.
Carbon emissions are a primary driver of global warming, exacerbating extreme weather phenomena like hurricanes, cyclones, heatwaves, floods, droughts, and heavy rainfall. The resultant increase in atmospheric CO2 levels accelerates the melting of polar ice caps and glaciers, leading to rising sea levels. Such changes disrupt ecosystems and habitats, resulting in biodiversity loss. Moreover, rising sea levels and extreme weather patterns can displace communities, necessitating migration to safer regions. Ocean acidification, caused by CO2 absorption, poses additional threats to marine life. We already see the consequences of carbon emissions and climate change today.
We are acutely aware of the consequences of carbon emissions and climate change. Thus, we are committed to mitigating our climate impact and reducing carbon emissions in alignment with the Science Based Targets initiative. This initiative aligns with the Paris climate agreement’s goal of limiting global warming to 1.5 degrees Celsius above pre-industrial levels. Detailed information about our action plan to combat climate change can be found under “Protect our Planet – Fight Climate Change – Driving Change: Transition Plan for Climate Change Mitigation” on page 60
Reducing carbon emissions is a cornerstone of our company strategy, and we systematically calculate the carbon footprint of all our products to identify opportunities for emission reductions.
Material risks and opportunities
We make a distinction between climate-related transition risks and opportunities and climate-related physical risks and opportunities. (The definitions of financial impact categories are the same as under Sustainability Annex- General Information – Materiality Assessment – on page 83)
The identification and assessment of climate-related material risks is based on the Task Force on Climate-related Financial Disclosures.
Climate-related transition risks and opportunities
Policy risks and opportunities
Climate change may result in increased operating costs due to compliance or higher insurance premiums. Policy shifts could also necessitate the early retirement of existing assets, potentially resulting in significant financial impacts within the next 5 years.
Conversely, there is an opportunity for the development of new products with lower greenhouse gas emissions. With the carbon footprint of all our products calculated, we are equipped to collaborate with our customers to optimize products. Additionally, leveraging this knowledge and our R&I teams positions us to innovate new products with reduced carbon footprints. This could be realized on a medium time horizon with high financial effects.
• Legal risks
Fines and judgments could diminish demand for our products and escalate costs. Reputational damage may further impede revenue generation. Elevated operating costs to ensure compliance could jeopardize contracts. However, the likelihood of these events occurring by 2030 is not high, and the potential associated financial impact is low.
• Technology and products risks and opportunities
Existing products may face substitution with lower emissions alternatives, potentially leading to the loss of contracts and bottom-line profit reduction. Additionally, significant R&D expenditures on new technologies and high capital investments in technology development could be required. Obsolescence of existing assets may necessitate early retirement, while adapting to new practices and processes could significantly impact costs. These events are likely to occur within a medium time horizon, resulting in a medium financial impact.
However, these challenges can be transformed into positive financial impacts. There may be increased demand for re-formulated products with lower emissions and new packaging types developed by our R&I team. This could lead to an expanded market share, particularly if competitors struggle to adapt to technological advancements. Furthermore, the potential for Intellectual Property on newer technologies, packaging, and processes exists, along with increased revenues through better competitive positioning to meet shifting consumer preferences. These positive impacts are highly likely to occur within the next 5 years, resulting in a medium financial gain.
• Market risks and opportunities
Changing consumer behaviour and market signals’ uncertainty may reduce demand for our products and result in revenue loss through the loss of existing contracts. Moreover, increased raw material costs could escalate production expenses due to fluctuating input prices (e.g., energy, water) and output requirements (e.g., waste treatment). These events are highly likely to occur within the next 5 years, resulting in high financial impacts.
Conversely, these challenges present opportunities for increased demand for new products and packaging, potentially leading to a higher market share if we can adapt to evolving market demands. Furthermore, diversifying financial assets, such as through investments in green bonds and infrastructure, could be beneficial. It is probable that these opportunities will arise within the next 5 years, carrying high potential financial effects.
• Reputation risks and opportunities
Stigmatization of the sector and heightened stakeholder concerns may restrict capital availability, while disruptions in our supply chain could lead to reputation and profit losses. Additionally, the potential loss of contracts due to perception and reputation risks could result in revenue decline. These risks are anticipated to manifest over a long time horizon, with potential financial effects of less than 1 million turnover.
However, we are actively enhancing our image as a blended producer of meat-based and plant-based products, demonstrating our commitment to vegetarian and plant-based options through company rebranding with sustainability at the forefront. This strategic shift can
What’s Cooking? Annual report 2023 92
Sustainability Report Environmental
enhance our reputation and generate more positive stakeholder feedback. There is a high possibility this will further evolve within the next 5 years, resulting in a medium financial impact.
• Energy source risks and opportunities
Abrupt and unforeseen shifts in energy costs, particularly in the purchase of green electricity, could significantly increase our expenses. This scenario is highly likely to occur within the next 5 years, resulting in a medium financial impact.
However, as we transition to a higher percentage of green energy, we anticipate reduced exposure to future fossil fuel price increases, lower operational costs, and decreased sensitivity to changes in the cost of carbon emissions. Moreover, this shift can enhance our capital availability, as more investors favour lower-emission producers. There is a high possibility that these opportunities will materialize within the next 5 years, resulting in a medium financial impact.
Resource efficiency opportunity
Implementing more efficient production and distribution processes can lead to an expanded production capacity, resulting in increased revenues. Efficiency gains and cost reductions, such as through decreased water consumption, can lower operating costs. Additionally, benefits to workforce management and planning, such as improved health and safety and enhanced employee satisfaction, can further reduce costs. This might only happen on a longer term time horizon, having a medium financial impact.
Climate-related physical risks and opportunities
• Acute risk/Resilience opportunity
Reduced revenue may arise from decreased production capacity due to transport difficulties or supply chain interruptions. Negative effects on the workforce, such as health issues and absenteeism, could further impair revenue. Additionally, lower sales/output and exceptional writeoffs of assets could lead to significant financial losses. Higher operating and capital costs, including damage to facilities, are also conceivable outcomes. Moreover, increased insurance premiums and limited coverage for assets in “high-risk” areas may exacerbate financial strain. Ultimately, failure to meet customer requirements or lead times could result in contract losses, heightening financial vulnerability. There is a high possibility this will happen within the next 5 years, having a medium financial impact. We are planning to perform a more scientific climate scenario analysis in the coming years.
The advantages of multi-plant operability emerge as a key benefit, enabling us to mitigate the impact of regional weather events and maintain operational continuity. Additionally, diversifying our product and service offerings to enhance resilience can contribute to increased revenue streams. Furthermore, proactive resilience planning, including investments in infrastructure, land, and buildings, can enhance market valuation and strengthen our competitive position. By capitalizing on these opportunities, we can bolster our resilience to acute climate-related risks and position ourselves for sustained success in an increasingly volatile environment. It’s highly possible this will happen on a medium time horizon, resulting in medium positive financial impacts.
• Chronic risk/Resilience opportunity
It’s crucial to recognize the potential impacts of changes in precipitation patterns, extreme weather variability, rising mean temperatures, and sea-level rise. These factors can lead to reduced revenue due to transport difficulties, supply chain interruptions, and ingredient availability constraints, further compounded by negative effects on workforce health and safety. Additionally, lower sales/output and the writeoffs of existing assets, especially those in high-risk locations, pose significant financial risks. Furthermore, increased costs associated with workforce impacts, operational expenses, and damage to facilities from rising sea levels must be carefully considered. Heightened insurance premiums and potential limitations on coverage for high-risk assets may exacerbate financial pressure. Certain chronic risks are already happening, so there is a high possibility this will happen within the next year, having a high financial impact.
It’s essential to recognize the potential benefits of leveraging our capabilities and adapting to changing climate conditions. For instance, increased sales of “summer” products during heatwaves present an opportunity to capitalize on shifting consumer preferences. Additionally, our scale, geographically spread manufacturing footprint, and international sourcing teams provide us with a competitive advantage. By improving product availability compared to our competitors, we can potentially realize volume gains and bolster revenue. Furthermore, investing in new products and services related to ensuring resilience can diversify revenue streams and enhance market competitiveness. Moreover, proactive resilience planning, including investments in infrastructure, land, and buildings, can enhance our market valuation and strengthen our long-term sustainability. It’s highly possible this will happen within the next year, having medium financial effects.
2. Policies
Our policies can be found under Protect our Planet – Fight Climate – Our Policies and systems on page 60.
3. Actions
The action plan for climate change mitigation can be found under Protect our Planet – Fight Climate Change -Driving Change: Transition Plan for Climate Change Mitigation on page 63 (and following)
Significant Opex and Capex required for the implementation of action plan:
Purchasing Green Energy Certificates is a significant Opex expense. The pricing of the Certificates will depend on the market value at the time of purchase. The group does ‘layer’ these purchases during the year and can buy forward some of the certificates. The Opex related to these certificates is expected to be between EUR 0.5 and EUR 1.5 Mio per annum for the years 2024-2025.
Cooling investments require significant Capex investments. The Group has completed a substantial part of these investments and future cooling upgrades are included in the Group’s long term Capex plan to allow the Capex % on sales to remain relatively stable with respect to these investments.
Potential locked-in GHG emissions from key assets and products: The Group currently still relies on gas for certain of its steam generation / grilling. The group will explore transitioning these to electric going forward but has no final plan yet in this respect. With respect to scope 3 emissions, the group is heavily dependent on its purchases from suppliers. For Pri-
What’s Cooking? Annual report 2023 93
Sustainability Report Environmental
vate Label products it also depends on the approval of customers for the implementation of improvement actions.
Explanation of any objective or plans (CapEx, CapEx plans, OpEx) for aligning economic activities (revenues, CapEx, OpEx) with criteria established in Commission Delegated Regulation 2021/2139:
Being a food group, the company currently has no activities that are ‘aligned’. There are no plans in this respect at present.
In line with the requirements of ESRS 2 MDR-A, the Group confirms it has the resources to implement the specific actions included above. Thanks to its refinancing in 2024, ongoing access to finance at an affordable cost of capital. With respect to the implementation of mainly Scope 3 improve-
ments – the Group will need to pass-thru the cost increases where they occur to customers. As customers have the same objectives as the Group with respect to sustainability – we assume a transparent pass-thru in our models.
4. Metrics & Targets
The targets for climate change mitigation and energy consumption can be found under Protect our Planet – Fight Climate Change - Our Sustainability Targets on page 62 and following
Energy consumption & mix
We report on the following metrics in line with the CSRD:
*This includes 3rd party electricity from renewable sources located on our owned or leased properties.
**The entire revenue of the Group is derived from the sale of food products, which is considered a high climate impact sector.
For the calculation of the electricity part of energy consumption from fossil sources, nuclear sources and renewable sources, we consulted the Energy Information Administration (https://www.eia.gov/ ) and made use of the energy mix %’es per country we could find there.
What’s Cooking? Annual report 2023 94
KPI UoM 2022 2023 Fuel consumption from coal and coal products MWh 0 0 Fuel consumption from crude oil and petroleum products MWh 4,399 4,277 Fuel consumption from natural gas MWh 116,585 112,167 Fuel consumption from other fossil sources MWh 0 0 Consumption of purchased or acquired electricity, heat, steam, or cooling from fossil sources MWh 27,574 13,121 Total fossil energy consumption MWh 148,558 129,685 Percentage of fossil sources in total energy consumption % 72.1% 65% Total energy consumption from nuclear sources MWh 28,503 13,121 Percentage of energy consumption from nuclear sources in total energy consumption MWh 13.8% 6.6% Fuel consumption from renewable sources (part biofuel in company cars) MWh 237 204 Consumption of purchased or acquired electricity, heat, steam, and cooling from renewable sources MWh 22,989 50,998 Consumption of purchased or acquired electricity, heat, steam and cooling from renewable sources on-site* MWh 2,091 1,817 Consumption of self-generated non-fuel renewable energy MWh 3,672 3,695 Total renewable energy consumption MWh 28,988 56,714 Share of renewable sources in total energy consumption % 14.1% 28.4% Total energy consumption MWh 206,049 199,520 Energy intensity from activities in high climate impact sectors (total energy consumption per net revenue**) MWh/1000 euro 0.264 0.255
Sustainability Report Environmental
Greenhouse gas emissions
We report on the following metrics in line with the CSRD and GHG protocol:
*Under market based, we are yet to obtain the exact mix of our electricity supply - so we use the grid factor (=location based) as conservative value while we try to collect this information from our electricity supplier. The emission factors used do not provide us details on biogenic sources and only cover CO2 (not CH4 and N2O) as they come from IEA (https://www.iea.org/data-and-statistics).
What’s Cooking? Annual report 2023 95
Emission sources 2021 2022 2023 Share of Total ton CO2e Total ton Total ton emissions in CO2e CO2e 2023 Direct emissions from stationary combustion sources 24,084 29,047 26,770 2.4% Direct emissions from mobile sources with combustion engine 645 1,013 978 0.1% Direct emissions from processes 0 0 0 0.0% Direct fugitive emissions 4,514 3,620 4,638 0.3% Total Scope 1 emissions 29,242 33,681 32,386 3.4% Indirect emissions from electricity consumption (market-based*) 21,326 20,474 9,848 1.7% Indirect emissions from steam, heat or cooling consumption 0 0 0 0.0% Total Scope 2 emissions (market-based*) 21,326 20,474 9,848 1.0% Total Scope 2 emissions (location-based) 21,326 20,474 20,389 / Total Scope 1 & 2 emissions (market-based*) 50,569 54,155 42,234 4.4% Total Scope 1 & 2 emissions (location-based) 50,569 54,155 52,775 / Purchased goods or services 839,465 1,002,561 786,465 83.8% Capital goods 12,935 11,673 9,849 1.0% Emissions related to fuels and energy (not included in scope 1 and scope 2) 12,653 13,314 9,304 1.1% Upstream freight and distribution 43,797 50,878 46,054 4.3% Waste generated 3,640 3,350 2,928 0.3% Business travels 58 80 140 0.0% Employees commuting, incl telework 1,569 2,004 2,111 0.2% Upstream leased assets 0 0 0 0.0% Other indirect emissions upstream 0 0 0 0.0% Scope 3 emissions Upstream MWh 28.988 56.714 Dowstream freight and distribution 18,589 18,497 15,235 1.5% Processing of sold products 0 0 0 0.0% Use of sold products 19,531 26,559 23,473 2.2%
Sustainability Report Environmental
*Under market based, we are yet to obtain the exact mix of our electricity supply - so we use the grid factor (=location based) as conservative value while we try to collect this information from our electricity supplier. The emission factors used do not provide us details on biogenic sources and only cover CO2 (not CH4 and N2O) as they come from IEA (https://www.iea.org/data-and-statistics ).
For calculations of scope 3 emissions, we used company specific data, except for the calculation of emissions from purchased goods and emissions from upstream transport, there we made use of generic data of recognized databases. In the coming years, we will collect supplier specific information to reduce uncertainty.
The group’s targeted GHG emission reduction targets are science- based but still subject to review. The aim is to limit global warming to 1.5°C. The Group is currently building its reduction plan and will seek to validate this using acceptable scientific standards. The impact of growing volumes
which are expected will require to be offset by efficiency gains whilst consumer preferences are expected to be favourable for the GHG emissions as blended (hybrid), plant-based and vegetarian products typically have a lower footprint compared to pure meat products. Any incremental environmental government taxes imposed will require to be passed-thru to customer prices in full in order to keep margins (and investments in Opex and Capex) viable.
For further details on our scope 3 emissions included, see also earlier in this report.
What’s Cooking? Annual report 2023 96
Emission sources 2021 2022 2023 Share of Total ton CO2e Total ton Total ton emissions in CO2e CO2e 2023 End-of-life of sold products 13,022 13,225 16,863 1.1% Downstream leased assets 0 0 0 0.0% Franchises 0 0 0 0.0% Investments 0 0 0 0.0% Other indirect emissions downstream 0 0 0 0.0% Scope 3 emissions Downstream 51,142 58,281 55,571 5.8% Total Scope 3 emissions 965,259 1,142,141 912,422 95.6% TOTAL EMISSIONS SCOPE 1, 2 and 3 (market-based*) 1,015,828 1,196,295 954,656 100.0% TOTAL EMISSIONS SCOPE 1, 2 and 3 (location-based*) 1,015,828 1,196,295 985,586 /
Report Environmental
Sustainability
Water
1. Material IRO
Material negative impacts
In 2023, water consumption at What’s Cooking facilities amounted to 217 126 m3/year, primarily for sanitation purposes and in production (including use in products and cleaning processes).
In regions facing water scarcity, the excessive water consumption by What’s Cooking? could contribute to the depletion of freshwater resources such as rivers, lakes, and groundwater aquifers. Over-extraction of water may lead to the drying up of these vital sources, impacting both the environment and human populations reliant on them.
Furthermore, the water discharge from What’s Cooking? facilities in 2023 totalled 757 241 m3/year. If not adequately managed or treated, water discharge can result in significant adverse effects on aquatic ecosystems, human health, and overall environmental quality. Nutrient discharge, such as nitrogen and phosphorus, can stimulate the excessive growth of algae in water bodies, triggering harmful algae blooms. These blooms can release toxins and cause eutrophication, leading to oxygen depletion and habitat degradation.
To address these concerns, What’s Cooking? has established an ambitious target to reduce water withdrawal and therefore the number of litres used per kg of product sold. Moreover, the company ensures that the quality of water discharged aligns with regulatory standards through the operation of water treatment plants at all of its large facilities.
Material risks and opportunities
In the future, fluctuations in water prices may drive up production costs, while higher compliance costs may lead to an increase in operating expenses. The potential investments in Water re-use systems may have an impact on Capex spending or on Opex in case a ‘water as a service’ solution would be chosen. Should water become completely unavailable
(during e.g. periods of drought), the company would have to stop operations as water is key in production and cleaning of the factories. There is also a risk that ground-water can no longer be used due to contamination, which would mean that the water would need to be replaced by tap water, increasing operational expenses. It is highly likely that these potential shifts will occur within the next five years, which can have a high financial impact on our company.
Nevertheless, these market and policy risks present an opportunity for resource efficiency enhancement. We could significantly reduce water usage by investment via Capex or Opex (see above), reducing operating expenses related to the purchase of water. There could be an opportunity to allow farmers to take treated water for use during periods of extreme drought where this is legally allowed. The company has not yet done this in the past but this may be an opportunity going forward. This opportunity is expected to unfold gradually over the long term, potentially yielding medium financial benefits.
2. Policies
Our policies can be found under Protect our Planet – Fight Climate Change - Water Management – Our Policies and Systems on page 68
3. Actions
The action plan for water management can be found under Protect our Planet – Fight Climate Change - Water Management – Driving Change: Our Sustainability Actions on page 68
4. Metrics & Targets
The targets for water management can be found under Protect our Planet – Fight Climate Change - Water Management – Our Sustainability Targets on page 68
We report on the following metrics in line with the CSRD:
*Water discharge from our facilities may include rainwater and surface water, alongside process wastewater. Despite our best efforts to manage and treat water discharge, it’s important to note that we cannot exert full control over environmental factors such as rainfall and surface water flow.
**Water storage figures are not yet available. We have 3 main water storage points:
1/ Water storage for sprinkler installations (at certain sites)
2/ Water storage to recover heated water in our process in order to not lose energetic value of heated water.
3/ Water temporarily stored in water treatment plants, awaiting treatment in order to thereafter be discharged.
What’s Cooking? Annual report 2023 97
Water KPI’s Unit of Measure Data 2022 Data 2023 Total water withdrawal m3 1,035,276 974,367 %Ground water % 25.65 25.63 Water reuse m^3 0 0 Water consumption m^3 185,538 126,965 Water discharges* (m3) m^3 849,738 847,402 Water withdrawal/ton products sold m3/t 6.45 6.73 Water intensity ratio (water consumption/net sales) m3/1000 euro 0.24 0.15 Total water stored m^3 Not measured yet** Not measured yet** Changes in water storage m^3 Not measured yet** Not measured yet**
Sustainability Report Environmental
Circular Economy
1. Material IRO
Material topics within the circular economy section are Sustainable Packaging and Waste Management (incl. food waste). Concerning the resource inflows of ingredients and meat and the resource outflows of our food products, we discuss this under Climate-Material IRO. In our Savoury business unit the resource inflow is mostly meat, as for our Ready Meals business unit these are ingredients and meat. The resource inflow of water is discussed under Water-Material IRO, with a higher water consumption in our Ready Meals plants.
Sustainable Packaging
Material negative impacts
Our annual consumption of primary packaging materials amounts to approximately 12 000 metric tons. The production of packaging materials often necessitates the extraction of natural resources, leading to habitat destruction, deforestation, and the depletion of finite resources. Additionally, it significantly contributes to municipal solid waste streams. When improperly disposed of or recycled, packaging materials may end up incinerated, in landfills, or as litter. Moreover, the production of packaging materials requires substantial energy inputs.
However, packaging plays a crucial role in ensuring food safety and preventing food waste. Recognizing the necessity of packaging for these reasons, we are dedicated to enhancing the sustainability and circularity of our packaging practices. Sustainable packaging initiatives frequently entail reducing material usage and optimizing packaging designs, thereby diminishing overall waste throughout the production and disposal stages. By incorporating recycled or renewable materials into packaging, we can conserve natural resources such as raw materials, water, and energy. Furthermore, sustainable packaging advocates for the reduction of single-use packaging. We have a sustainable packaging strategy for both our Savoury and Ready Meals business unit, with a higher packaging intensity in our Savoury division.
Material risks and opportunities
There exists the potential for a reduction in demand for goods due to shifts in customer requirements and consumer preferences. Additionally, costs may escalate due to higher compliance expenses or increased costs associated with packaging materials containing recycled content or recyclable materials. These developments are likely to unfold within the next five years, potentially resulting in high financial implications.
However, we have already committed to enhancing the sustainability of our packaging, with specific targets set for recycled content, recyclability, packaging intensity, and the requirement that 100% of purchased paper and cardboard must be FSC or PFC certified. Through packaging innovations, we can access new and emerging markets, thereby boosting our revenues. Moreover, a more competitive position reflecting changing customer demands and preferences regarding sustainable packaging could also lead to increased revenues. We anticipate these opportunities to materialize within the next year, with the potential for high positive financial impacts.
Waste Management
Material negative impacts
In 2023, our operations generated approximately 12 600 metric tons of food waste, 117 metric tons of hazardous materials waste, 0 metric tons of landfilled materials waste, 1400 metric tons of burnt materials waste, and 3400 metric tons of recycled materials waste. Exposure to hazardous waste poses significant risks to human health, while mismanagement of hazardous waste can lead to detrimental effects on the environment. The generation of leachate from landfilled waste can contaminate groundwater, and the production of methane, a greenhouse gas, is a by-product of landfilling. Furthermore, when recyclable waste is landfilled or incinerated, valuable materials are needlessly lost. Food waste also has profound negative environmental impacts, as the production, processing, transportation, and disposal of wasted food consume significant resources such as water, energy, and land. When food is wasted, these resources are effectively squandered, exacerbating issues related to resource scarcity and inefficiency.
To address these challenges, we are actively combatting food waste with ambitious targets. We are committed to maximizing the recycling of materials waste by ensuring all our end products are recyclable, aiming for a 30% recycled content, and educating consumers. Additionally, we aim to reduce the amount of packaging used, while ensuring food safety and shelf life are not compromised.
Material risks and opportunities
There is a risk of escalating operating costs, potentially driven by higher compliance expenses, within the next five years, resulting in medium financial effects.
However, our “War on Waste” program presents an opportunity for reduced operating costs through efficiency gains and cost reductions. It is highly probable that these benefits could materialize within the next five years, resulting in medium positive financial effects.
2. Our Policies and Systems
Our policy on food waste can be found under Protect our Planet – Win the War on Waste - Fighting Food Waste – Our Policies and Systems on page 69
Our policy on Sustainable packaging can be found under Protect our Planet – Win the War on Waste - Sustainable Packaging – Our Policies and Systems on page70
Our policy on resource inflows of meat and ingredients can be found under Protect our Planet – Source Responsibly – Our Policies and Systems on page71
What’s Cooking? Annual report 2023 98
Sustainability Report Environmental
3. Actions
Our actions on food waste can be found under Protect our Planet – Win the War on Waste - Fighting Food Waste – Driving Change: Our Sustainability Actions on page 69
Our policy on Sustainable packaging can be found under Protect our Planet – Win the War on Waste - Sustainable Packaging – Driving Change: Our Sustainability Actions on page 70
4. Metrics & Targets
The targets for circular economy can be found under Protect our Planet –Win the War on Waste - Fighting Food Waste – Our Sustainability Targets on page 69, under Protect our Planet – Win the War on Waste - Sustainable Packaging– Our Sustainability Targets on page 70 and under Protect our Planet – Source Responsibly – Our Sustainability Targets on page 71,
Targets fighting food waste:
20% reduction of our operational food waste by 2024 (compared to 2022)
50% reduction of our operational food waste by 2030 (compared to 2022)
This target will minimize the use of primary raw materials and relates to ‘Prevention’ and ‘Reuse’ on Lansink’s Ladder (waste hierarchy). Next to this target we also have the internal target to recycle as much as possible and if that is not possible, to use incineration with energy production. Incineration is really the least desirable option (next to landfill, but we already have zero waste to landfill).
The target on recycle-ready packaging relates to increase of circular design and circular material use rate. This does not only depend on our company, but also on the waste collecting streams and sorting infrastructure.
The target on recycled content relates to the increase of circular design and circular material use rate and the minimisation of primary raw materials. The two targets relate to ‘Recycling’ in Lansink’s ladder.
The target on packaging intensity relates to the minimisation of primary raw material and can be put into the ‘Prevention’ layer of Lansink’s ladder.
We report on the following metrics in line with the CSRD:
Resource inflows
What’s Cooking? Annual report 2023 99 Targets sustainable packaging: 100% recycle-ready packaging by 2025 30% recycled content in the packaging of our products by 2030 20% reduction of packaging intensity by 2030 (compared to
2022)
Water KPI’s Unit of Measure Data 2023 Overall total weight of meat, ingredients and packaging materials used during the reporting period ton 136,440 Percentage of meat and ingredients % 89 The absolute weight of recycled packaging components, used for primary packaging. ton 1,245 The absolute weight of reused ingredients (through rework) used to produce new products ton 388
Re-use Recycling Incineration with energy production Incineration Landfill
Prevention
Sustainability Report Environmental
Frozen food which is more often used in foodservice has a longer shelf life and allows for a lower food waste in the downstream value chain but requires higher energy consumption during both production and downstream. Sustainability Report
With respect to the durability of our products, shelf life is the most determining factor within our sector. Given the variety of products that we offer, the shelf life will vary between a few days and approximately one year depending on whether the goods are sold as ‘fresh’ or ‘frozen’. Our fresh products’ shelf life will depend on the period where quality and food safety as well as taste can be guaranteed, always maintaining a balance between quality and food waste. We equally strive to minimize the use of artificial preservatives. Resource outflows
What’s Cooking? Annual report 2023 100
Water KPI’s Unit of Measure Data 2022 Data 2023 The rates of recyclable content in products packaging (calculation same as Overview of Strategic Metrics & Targets - %Recyclable content of primary packaging) % 14.5 10.35 Food waste recovered as animal feed ton 492 941 Food waste digested anaerobically for production of biogas ton 10,004 8,895 Food waste composted ton 1,072 1,793 Food waste that contains meat recovered in the rendering industry ton 0 0 Food waste recovered as biodiesel ton 1,232 749 Total amount of other organic waste incinerated ton 377 88 Total amount of food waste generated ton 13,273 12,566 Residual waste for incineration ton 1,551 1,413 Other non-hazardous materials waste (recycled) ton 3,589 3,390 Total amount of non-hazardous materials waste generated ton 5,140 4,803 Total amount of hazardous materials waste recycled ton 11,149 20 Total amount of hazardous materials waste incinerated ton 28 97 Total amount of hazardous materials waste with other end-of-life treatment ton 0.03 0.1 Total amount of hazardous materials waste generated ton 11,177 117 Total amount of non-hazardous waste reused (rework) ton 412 388 Total amount of non-hazardous waste recycled ton 5 153 6,124 Total amount of non-hazardous waste recovered through other recovery operations ton 11,236 9,644 Total amount of non-hazardous waste incinerated ton 1,928 1,501 % of recovered non-hazardous waste % 90 91 Total amount of waste going to landfill ton 0 0
Environmental
Own Workforce
1. Material IRO
Material topics within the own workforce section are Safe Working Environment, Employee Health and Wellbeing and Employee Engagement.
Safe Working Environment
Material negative impacts
In 2023, What’s Cooking? facilities reported a Recordable Injury Frequency Rate (RIFR) of 3.3, indicating that for every 200,000 working hours, there were 3.3 injuries. The presence of safety hazards within our operations poses a direct risk of injuries and, tragically, even fatalities. Such incidents can have profound and devastating repercussions not only for our employees but also for their families.
Ensuring safety remains our utmost priority, evident from its consistent discussion at the forefront of every Executive Committee meeting. While we have already achieved a 20% reduction in RIFR compared to 2022, our ultimate goal is to attain zero accidents. For detailed insights into our proactive measures, please refer to our initiatives outlined under “Help People Flourish – Guard Employee Safety – Driving Change: Our Sustainability Actions.
Recordable work-related accidents for 2022 and 2023 in this report are excluding the number of accidents without lost time, we will start to measure these from 2024 onwards. They do include the number of accidents with lost time and number of fatalities for both own employees and temp agency workers.
Material risks
Safety hazards in the workplace can result in reduced revenue due to negative impacts on the workforce, such as health issues and absenteeism. They can also incur increased operating costs, including compliance expenses and higher insurance premiums. Moreover, there are additional costs associated with absenteeism and healthcare expenses for injured workers. It’s worth noting that safety hazards can affect both white-collar and blue-collar workers, with the latter facing a higher likelihood due to their work in production environments. The likelihood of occurrence is low with low potential negative financial effects.
Employee Health and Wellbeing
Material positive impacts
Promoting the mental and physical well-being of all employees can yield significant positive impacts. By enhancing their physical health, it lowers the risk of chronic diseases, obesity, and related health concerns. Additionally, it leads to reduced stress levels and fosters improved mental resilience among employees.
Material risks and opportunities
Neglecting employee health and wellbeing can lead to several adverse outcomes. This includes reduced revenue stemming from negative impacts on workforce management and planning, such as difficulties in attracting and retaining employees. Additionally, it can result in increased operating costs due to inefficiencies and cost escalations within the organization. We think there is a low probability for this risk to happen, with low financial impacts.
Prioritizing employee health and wellbeing presents various opportunities for organizations. These include lower costs attributed to benefits in
workforce management and planning, such as enhanced health and safety measures, increased employee satisfaction, and the ability to attract top talent. We believe these opportunities will come in the longer term, having positive financial effects of less than 1 million turnover.
Employee Engagement
Material positive impacts
Employee engagement yields significant positive impacts, notably on overall well-being. Engaged employees typically encounter reduced levels of stress, anxiety, and burnout, contributing to their overall mental and emotional wellness.
Material opportunities
Employee engagement presents numerous opportunities for organizations. This includes increased revenue resulting from positive impacts on workforce management and planning, such as improved employee attraction and retention rates. Additionally, there are lower costs associated with benefits in workforce management and planning, such as enhanced health and safety measures, elevated employee satisfaction, and the ability to attract top talent. It’s highly possible this will happen with the next five years, with a medium positive financial impact.
2. Policies
Our policy on safety can be found under Help People Flourish – Guard Employee Safety – Our Policies and Systems on page 74
Our policies and systems on employee health, wellbeing and engagement can be found under Help People Flourish – Guard Employee Safety – Our Policies and Systems on page 75
Business Code of Conduct (https://whatscooking.group/en-GB/ethics-line)
Our Business Code of Conduct (including the section on human trafficking, forced labour or compulsory labour and child labour) are generally aligned with the international standards and guidelines as outlined below.
Supplier Policy (https://whatscooking.group/en-GB/general-terms-andconditions-purchase-goods-andor-services)
Our Business Code of Conduct & Supplier Policy are aligned with: The OECD Guidelines for Multinational Enterprises
The UN Guiding Principles on Business and Human Rights
The International Labor Organization’s (ILO) Declaration on Fundamental Principles and Rights at Work and the ILO eight fundamental labor conventions
The Universal Declaration of Human Rights
These policy address trafficking in human beings, forced labour or compulsory labour and child labour.
Whistleblowing policy and tool (https://whatscooking.group/en-GB/ ethics-line)
What’s Cooking has implemented a comprehensive Whistleblower policy and tool that is closely aligned with local laws. This framework covers every aspect, from initial reporting to subsequent follow-up and resolution. The main goal of this policy is to promote a culture of transparency
What’s Cooking? Annual report 2023 101
Sustainability Report Social
and compliance within the organization by encouraging employees and third parties to report suspected violations immediately. Safe channels for reporting are in place so that people can raise concerns without fear of retaliation.
Reports received under this policy will be treated with the utmost confidentiality in accordance with current privacy and data protection laws, including Regulation (EU) 2016/679 (GDPR) and relevant national regulations. The identity of the reporter will remain confidential and will be disclosed only to authorized staff involved in the investigation process, or as required by law.
Upon receipt of a report, the local reporting manager conducts a preliminary assessment and determines the appropriate course of action. Investigations are conducted thoroughly and locally whenever possible, if necessary with the assistance of the group’s investigation team. Outside counsel may be used to ensure the integrity and confidentiality of the process.
During the investigation, the reporter is kept informed of progress and results. Within three months of confirming the report, feedback is provided on actions taken to address the reported violation. All actions are documented to ensure transparency and accountability in resolving issues.
At What’s Cooking, we are committed to maintaining the highest standards of ethical behaviour. Our Whistleblower policy underscores this commitment and provides a mechanism for individuals to raise concerns and contribute to a culture of integrity and accountability within the organization. Our whistleblowing policy ensures discrimination prevention, swift action upon detection, and the advancement of diversity and inclusion.
The most senior role within What’s Cooking? that has operational responsibility for ensuring that engagement with workers is discussed and monitored is the Chief People Officer.
Processes for engaging with own workforce and workers’ representatives about impacts
Our approach to engaging with our workforce and workers’ representatives involves multiple steps aimed at fostering a culture of engagement and inclusivity.
Annually, employees receive an engagement questionnaire to measure the level of engagement within What’s Cooking?. This allows us to assess engagement levels at every location and gather valuable feedback. Employees are also encouraged to provide suggestions at the end of the questionnaire to further enhance the workplace’s engagement.
Based on the inputs gathered from the engagement questionnaires, we tailor actions specific to each site to address identified needs and preferences. This localized approach ensures that we are closely aligned with the needs of our employees. Examples of actions implemented include language classes and instructions with pictograms instead of text to increase inclusivity among different minority groups.
By implementing these measures, we strive to create a work environment where every employee feels valued, included, and engaged in the company’s objectives and initiatives.
We also engage with our workers’ representatives (works councils and similar) on a regular basis and hold an annual information meeting for representatives from all our locations to ensure information sharing and
dialogue in order to improve staff engagement and wellbeing further. Next to this, regular town hall sessions or online update calls are also in place.
3. Actions
Our actions regarding a safe working environment can be found under Help People Flourish – Guard Employee Safety – Driving Change: Our Sustainability Actions on page 74.
Our actions regarding employee health, wellbeing and engagement can be found under Help People Flourish – Guard Employee Safety – Driving Change: Our Sustainability Actions on page 74.
Our Human Resources (HR) and Environment, Health, and Safety (EHS) teams play a pivotal role in implementing measures to ensure a safe work environment and enhance employee health, wellbeing, and engagement. These teams work collaboratively to develop and implement strategies aimed at promoting safety, improving overall employee health, and fostering a culture of wellbeing and engagement across the organization.
In addition to the HR and EHS teams, we have established various working groups, such as Engagement Teams and Ambassadors, dedicated to managing health, wellbeing, safety, and engagement initiatives. These groups are given the time and resources necessary to actively participate in developing and implementing programs and initiatives that address the diverse needs of our workforce.
We actively encourage all employees to contribute ideas and suggestions for actions through our open culture and the values introduced during our company rebranding last year: “be confident and courageous” and “craft with care and care by crafting”. In 2024, we plan to organize training sessions focused on reinforcing these values.
Through the collaborative efforts of our teams, working groups, and all our confident and courageous employees, we are dedicated to continually enhancing the safety, health, and wellbeing of our workforce. Additionally, we aim to cultivate a positive and engaging work environment for all, reflecting our commitment to our values and the collective efforts of our entire organization.
By creating an open communication with our whistleblowing tool and a safety and wellbeing culture through training and awareness creation, we want to ensure our business activities do not cause or contribute to material negative impacts.
4. Metrics & Targets
Our targets regarding a safe working environment can be found under Help People Flourish – Guard Employee Safety –Our Sustainability Targets on page 74
Our targets regarding employee health, wellbeing and engagement can be found under Help People Flourish – Guard Employee Safety – Our Sustainability Targets on page 74.
To establish these targets, we analysed historical data, enabling us to set ambitious yet achievable goals. These targets are communicated transparently to our employees and relevant stakeholders each year, along with our progress towards achieving them. This ensures alignment throughout the organization and accountability for our commitments to continuous improvement in safety, health, and wellbeing.
What’s Cooking? Annual report 2023 102
Sustainability Report Social
What’s Cooking? Annual report 2023 103
Activities Number of employees by Number of employees by headcount (31/12/2022) headcount (31/12/2023) Group 54 61 België Group functions 54 61 Ready meals 1,318 1,354 Belgium 488 509 Marche-en-famenne Production 311 323 Wanze Production 140 145 Sales units Sales & Marketing 37 41 France 239 234 Mezidon Production, Sales & Marketing 237 232 Sales units Sales & Marketing 2 2 The Netherlands 3 0 Sales units Sales & Marketing 3 0 Poland 146 199 Opole Production, Sales & Marketing 146 199 Spain 6 6 Sales units Sales & Marketing 6 6 United Kingdom 436 406 Deeside Production, Sales & Marketing 436 406 Savoury 1,182 1,116 Belgium 672 610 Lievegem Production, Slicing & Packaging 159 155 Veurne Slicing & Packaging 115 108 Wommelgem Production, Slicing & Packaging 360 347 Sales units Sales & Marketing 38 0 The Netherlands 509 506 Aalsmeer Slicing & Packaging 52 49 Borculo Production 94 98 Ridderkerk Slicing & Packaging 122 118 Wijchen Slicing & Packaging 168 182 Sales units Sales & Marketing 73 59 United Kingdom 0 Sales units Sales & Marketing 1 0 GRAND TOTAL 2,554 2,531 Sustainability Report Social
Characteristics of the undertaking’s employees
*We have not requested all workforce to disclose their gender. Information in the above table is generated based on the identification at the start of employment of the employee.
Diversity Metrics
Within the group, diversity - equity & inclusion are important, as we have sites employing people with different backgrounds, nationalities, religions etc. We work as one family – and we are proud of the diversity in the
various teams. A testament to the diversity are the nationalities working at the different plants within the group – as outlined in the table below. The table includes own staff only and excludes temp agency staff.
What’s Cooking? Annual report 2023 104 Gender Number of employees by headcount (end of year 2023) Male 1,604 Female 927 Other* 0 Total Employees 2,531 Data 2023 (End of Year) Female Male Other gender Total Number of permanent employees by headcount 876 1,511 0 2,387 Number of temporary employees by headcount 51 93 0 144 Number of full-time employees by headcount 712 1,461 0 2,174 Number of part-time employees by headcount 215 143 0 357 Total Number of employees by headcount 927 1,604 0 2,531
KPI Unit Data 2023 Number of employees and service providers (headcount) at top management level (definition top management level = Executive Committee plus General Counsel, service providers include representatives of management companies) # 8 Percentage of female employees at top management level % 25 Number of employees (head count) under 30 years old (total Group) # 362 Percentage of employees under 30 years old % 14.3 Number of employees (head count) between 30 and 50 years old (total Group) # 1,322 Percentage of employees between 30 and 50 years old % 52.2 Number of employees (head count) over 50 years old (total Group) # 847 Percentage of employees over 50 years old % 33.5 KPI Unit Data 2023 Total number of employee turnover # 304 Employee turnover rate % 12,01
Number of nationalities at the end of the calendar year per production location Marche-en-Famenne (Belgium) 20 Veurne (Belgium) 7 Wanze (Belgium) 15 Wommelgem (Belgium) 46 Mezidon (France) 4 Aalsmeer (The Netherlands) 7 Opole (Poland) 2 Borculo (The Netherlands) 8 Deeside (UK) 11 Ridderkerk (The Netherlands) 27 Lievegem (Belgium) 21 Wijchen (The Netherlands) 22
Report Social
Sustainability
Adequate Wages
All our employees are paid adequate wages.
Health & Safety Metrics
*Recordable work-related accidents for 2022 and 2023 are excluding the number of accidents without lost time, we will start to measure these from 2024 onwards. They do include the number of accidents with lost time and number of fatalities for both own employees and temp agency workers.
Remuneration metrics
See the Corporate Governance section of this report for detailed reporting on the remuneration ratio and the calculation method thereof.
Incidents
What’s Cooking? Annual report 2023 105
KPI Data 2022 Data 2023 Number of fatalities in own workforce as result of work-related injuries and work-related ill health 0 0 Number of fatalities as result of work-related injuries and work-related ill health of other workers working on undertaking's sites 0 0 Number of recordable* work-related accidents and ill health for own workforce 101 69 Rate of recordable* work-related accidents and ill health for own workforce 20.2 15.6 Number of work days lost to work-related injuries and fatalities from work-related accidents, work-related ill health and fatalities from ill health related to employees 1,595 789 Percentage of people in its own workforce who are covered by health and safety management system based on legal requirements and (or) recognised standards or guidelines 100% 100%
KPI Data 2022 Data 2023 The total number of incidents of discrimination, including harassment 0 1 For the remaining social and human rights matters (i.e. excluding discrimination or harassment), the number of complaints filed through channels for own workers to raise concerns (including grievance mechanisms) and, where applicable, to the National Contact Points for OECD Multinational Enterprises 3 5 The total amount of material fines, penalties, and compensation for damages as a result of violations regarding social and human rights factors 0 0 The number of severe human rights issues and incidents connected to the undertaking’s workforce in the reporting period, including an indication of how many of these are violations of the UN Global Compact Principles and OECD Guidelines for Multinational Enterprises 0 0 The total amount of fines, penalties and compensation for damages for the issues and incidents related to severe human rights issues and incidents 0 0 Number of confirmed incidents of corruption or bribery 0 0 Number of convictions for violation of anti-corruption and anti-bribery laws 0 0 Amount of fines for violation of anti-corruption and anti-bribery laws 0 0 Number of confirmed incidents in which own workers were dismissed or disciplined for corruption or bribery-related incidents 0 0 Number of confirmed incidents relating to contracts with business partners that were terminated or not renewed due to violations related to corruption or bribery 0 0 Sustainability Report Social
Workers in the Value Chain
1. Material IRO
The material topic that is part of workers in the value chain, is sustainable procurement. It contains many environmental topics, but also social topics.
Material positive impacts
Embracing sustainable sourcing practices can contribute to ensuring that workers throughout the value chain receive fair wages, enjoy improved working conditions, and have opportunities for economic advancement. This not only enhances their quality of life and financial stability but also fosters community development.
We set up a Supplier Engagement Program to ensure the protection of human rights throughout the value chain, you can read all about it under Help People Flourish – Protect Human Rights – Driving Change: Our Sustainability Actions on page 76.
Material risks and opportunities
Human rights violations within the supply chain pose significant risks to businesses. These risks include reduced demand for goods and services due to a shift in customer preferences towards ethical sourcing, as well as reputational damage that can lead to decreased demand. Additionally, companies may face increased operating costs due to the implementation of stringent compliance measures and due diligence processes. Moreover, there’s a risk of reduced capital availability as investors and lenders may shy away from supporting companies associated with human rights violations, impacting the company’s financial stability and growth potential. This is probable to happen within the next five years, resulting in a medium financial impact.
In our effort to mitigate risks, we’ve established a comprehensive supplier engagement program. This strategy presents several opportunities for our business. Firstly, it enables us to access new and emerging markets, potentially leading to increased revenues. Moreover, by aligning with shifting customer requirements and preferences—such as the demand for responsibly sourced ingredients, low-carbon products, and improved animal welfare standards—we can enhance our competitive position and further drive revenue growth. This is probable to happen within the next five years, having a medium positive impact on our financial results.
2. Policies
Our policies and systems for workers in the value chain can be found under Help People Flourish – Protect Human Rights – Our Policies and Systems on page 76. Here you will find amongst others our Supplier Code of Conduct, which contains many policy aspects about human rights.
Whistleblowing policy is already explained under Own Workforce – Policies on page 76.
Processes for engaging with value chain workers about impacts
Value chain workers are involved in our impact materiality process. You can find more information in the section Crafting our Strategy on page 53 and Value Chain & Stakeholder Engagement on page 54. In 2024 we will do a reassessment of our impact materiality, with also more in depth interviews with value chain workers to really discover actual and potential impacts in more detail. Through EcoVadis we also engage our suppliers to focus on sustainability and with the improvement plan they get, we can ask them to improve certain aspects going forward. EcoVadis also uses a
360 degree watch tool – which scans for potential human rights and ethics issues related to workers in the value chain.
We also actively engage in dialogue with suppliers who were known to use a significant amount of subcontractors in the past. Although we have not yet performed supplier audits to focus on the more vulnerable in the value chain, we have reviewed the changes in legislation (restricting the use of subcontractors) with our key meat suppliers.
The most senior role within What’s Cooking? that has operational responsibility for ensuring that engagement in the value chain is discussed and monitored is the Chief Operating Officer. The responsible for the whistleblowing at What’s Cooking? is the internal auditor.
3. Actions
Our actions regarding workers in the value chain can be found under Help People Flourish – Protect Human Rights – Driving Change: Our Sustainability Actions on page 75
4. Metrics & Targets
Our targets with respect to workers in the value chain can be found under Help People Flourish – Protect Human Rights – Our Sustainability Targets on page 75.
What’s Cooking? Annual report 2023 106
Sustainability Report Social
Consumers and End Users
1. Material IRO
Material topics for consumers are Food Safety and Quality, Nutritious Products and Product Innovation.
Food Safety and Quality
Material negative impacts
Negligence in food safety practices can result in outbreaks of foodborne illnesses, posing significant risks to consumers’ health. Such incidents have the potential to cause severe complications or even fatalities, leading to detrimental consequences for public health and the reputation of the organization.
Material risks
Poor adherence to food safety and quality standards can pose significant risks, including reduced revenue due to decreased demand for goods/services and compromised production capacity. Additionally, increased costs may arise from recalls and the loss of customer contracts, leading to financial losses. This can have a high financial impact, but the likelihood is rather low.
Ensuring food safety remains the top priority across all What’s Cooking locations. Further details about our proactive measures and initiatives can be found in the “Good Food for All – Ensure Consumer Wellbeing – Driving Change: Our Sustainability Actions” section.
Nutritious Products
Material negative impacts
The World Health Organization (WHO) names childhood obesity as one of the most serious public health issues of the 21st century. Obesity is an important risk factor for heart diseases and diabetes. At the other hand, malnutrition (such as micronutrient deficiencies) is also still an important human health issue.
When the nutritional value of products is improved, it will generate significant positive impacts on consumer health. So we set up a nutritional policy and program to really improve the nutritional profile of our products.
Material risks and opportunities
The absence of nutritious products carries significant material risks for businesses. Firstly, there’s a potential reduction in demand for goods and services as consumer preferences shift towards healthier options. Failure to adapt to this shift can lead to decreased sales and market competitiveness. Moreover, not offering nutritious products can result in increased operating costs, primarily due to higher compliance costs. As regulations and consumer expectations evolve to prioritize health and nutrition, businesses may face added expenses to ensure compliance with standards and regulations. This can include reformulating products, investing in labelling and marketing strategies, etc. This is likely to happen within the next five years and can have a high financial impact.
On the other hand, the focus on improving the nutritional profile of products offers attractive material opportunities for our company. By embracing this initiative, we can tap into new and emerging markets, expanding our customer base and revenue streams. With a growing global awareness of health and wellness, there is a growing demand for nutritious options, which is a mature market to capitalize on. Moreover,
investing in offering more nutritious products can improve our competitive position by responding to changing customer demands and preferences. This strategic move not only attracts health-conscious consumers, but also strengthens brand loyalty and brand trust. As a result, we could gain more revenue and market share by adapting to the growing demand for healthier choices. This is likely to happen within the next five years and can have a high financial impact.
Product Innovation
Material positive impacts
At What’s Cooking, we believe in the transformative power of product innovation to create positive impacts on the environment and people. Through our savoury and ready meals food products, we are committed to sourcing ingredients sustainably, and minimizing our carbon footprint. Our innovations also prioritize nutritional excellence, making healthy meals more accessible and affordable while respecting cultural diversity. And at the heart of it all, our product innovation aims to deliver exceptional taste, making our offerings as enjoyable as they are sustainable.
Material risks and opportunities
Pursuing new and emerging markets can entail challenges such as regulatory hurdles and unfamiliar consumer dynamics. Similarly, aligning with shifting consumer preferences, such as plant-based, healthy, or low-carbon options, may require substantial investment in research and development, potentially impacting short-term profitability. Additionally, failure to adapt swiftly to evolving trends could erode our competitive position and result in missed revenue opportunities. It is likely to happen within 5 years and can have high financial impacts.
Despite the material risks, product innovation offers significant opportunities for What’s Cooking. Embracing consumer preferences for plantbased, healthy, and low-carbon options allows us to tap into growing market segments and stay ahead of industry trends. By strategically investing in innovation, we can enhance our competitive advantage and capture new revenue streams. Additionally, addressing sustainability concerns can strengthen brand loyalty and reputation, fostering longterm customer relationships. While challenges such as increased operating costs and compliance requirements may arise, we view them as investments in our future resilience and continued success. Through proactive risk management and strategic decision-making, we are ready to seize the material opportunities presented by product innovation and drive sustainable growth for our company. It is likely to happen within 5 years and can have high financial impacts.
2. Policies
Good Food for All – Promote Enhanced Nutrition – Our Policies and Systems on page 58
Good Food for All – Grow portfolio plant-based products – Our Policies and Systems on page 59.
Whistleblowing policy is already explained under Own Workforce – Policies on pages 101-102
3. Actions
Our actions regarding consumers and end users can be found under:
Good Food for All – Promote Enhanced Nutrition – Driving Change: Our Sustainability Actions on page 58
What’s Cooking? Annual report 2023 107
Sustainability Report Social
Good Food for All – Grow portfolio plant-based products – Driving Change: Our Sustainability Actions on page 59.
Protect our Planet – Fight Climate Change – Driving Change: Transition Plan for Climate Change Mitigation on page 63.
Protect our Planet – Source Responsibly – Driving Change: Our Sustainability Actions on page 71.
Help People Flourish – Respect Human Rights – Driving Change: Our Sustainability Actions on page 76.
Processes for engaging with consumers
At What’s Cooking?, we are committed to engaging with our consumers and end-users in a transparent and meaningful manner. To ensure we meet their expectations and preferences, we organize taste panels in collaboration with independent third parties. These panels not only provide valuable feedback on the taste and quality of our products but also allow us to incorporate diverse perspectives into our decision-making process.
Additionally, we actively seek insights into consumer behaviour and market trends by acquiring general data from reputable sources such as Nielsen, IRI, and others. This data enables us to better understand the evolving needs and preferences of our target audience, empowering us to develop products and initiatives that align with sustainability goals while meeting consumer demand. By engaging with consumers and utilizing data-driven insights, we strive to promote a culture of sustainability and innovation that positively impacts both our business and the environment.
4. Metrics & Targets
Our entity-specific metrics & targets can be found under:
Good Food for All – Promote Enhanced Nutrition – Our Sustainability Targets on page 58.
Good Food for All – Grow portfolio plant-based products – Our Sustainability Targets on page 59.
Protect our Planet – Fight Climate Change – Our Sustainability Targets on page 63.
Protect our Planet – Source Responsibly – Our Sustainability Targets on page 71.
Help People Flourish – Respect Human Rights – Our Sustainability Targets on page 76.

What’s Cooking? Annual report 2023 108
Sustainability Report Social
Business Conduct
1. Material IRO
Material negative impacts
Corruption and bribery undermine the pillars of a fair and just society, stifle competition and disrupt market dynamics. Such unethical practices not only hinder economic growth and innovation but also hinder societal progress, leading to slower development and reduced prosperity for all. At What’s Cooking?, we are steadfast in our commitment to conducting business with integrity, transparency, and accountability, ensuring a level playing field that fosters sustainable growth and shared prosperity.
Material risks
The material risks associated with unethical business conduct pose significant threats to What’s Cooking?. Fines and judgments stemming from such behaviour can lead to reduced demand for our products and services, while negative impacts on workforce management, including employee attraction and retention, can further impact our revenue. Additionally, the financial burden of fines and judgments can escalate costs, undermining profitability and long-term sustainability. To mitigate these risks, we prioritize ethical conduct, fostering a culture of integrity and accountability throughout our organization, ensuring compliance with laws and regulations, and safeguarding our reputation and financial stability. There is a low likelihood for this to happen, which could have a medium financial impact.
2. Policies
Our policies and systems regarding business conduct are our Business Code of Conduct, Our Supplier Policy and our Business Code of Conduct for Suppliers, which can all be consulted on our website: https://whatscooking.group/en-GB/our-engagement
Whistleblowing policy is already explained under Own Workforce – Policies on pages 101-102.
3. Actions
We focus our efforts both on compliance in relationships with suppliers via the Supplier Code of Conduct and internal policies applicable to all staff with respect to business ethics. (See earlier)
We also have an internal audit function which - amongst others - reviews internal controls and business conduct.
4. Metrics & Targets
Total
The
The
*The company applies weekly payment cycles so payments usually happen either just before or just after the standard terms.
Disclosures incorporated by references
The following information is incorporated by reference to other parts of the management report: GOV1, GOV2, GOV3, GOV5 (+ 1st part IRO1) in the Corporate Governance section of this Annual Report.
What’s Cooking? Annual report 2023 109
KPI Unit Data 2023 % functions-at-risk covered by anticorruption/ anti-bribery training programs % 100 Total monetary value of financial and in-kind political contributions made directly and indirectly euros 0
monetary amount of lobbying expenses euros 0
Total
amount paid for membership to lobbying associations euros 177,000 (only food associations)
average time to pay an invoice days 47 % payments to suppliers aligned with the standard contractual payment terms of 60 days % 61.7% % payments to suppliers aligned with the standard contractual payment terms of 66 days* % 82.4%
number of
proceedings for late
# 0
legal
payments
Sustainability Report Governance
Governance
ESRS Standards Reference Table
ESRS 2
BP -1 General basis for preparation of sustainability statements
3 Disclosure of general basis for preparation of sustainability statement
5 a Basis for preparation of sustainability statement
5 b i Scope of consolidation of consolidated sustainability statement is same as for financial statements
5 b ii Indication of subsidiary undertakings included in consolidation that are exempted from individual or consolidated sustainability reporting
5 c Disclosure of extent to which sustainability statement covers upstream and downstream value chain
5 d Option to omit specific piece of information corresponding to intellectual property, know-how or results of innovation has been used
5 e Option allowed by Member State to omit disclosure of impending developments or matters in course of negotiation has been used
Sustainability Annex, p 83
General information, p 51, 83
General information, p 83
Sustainability Annex, p 83
Value Chain & Stakeholder Engagement, p 71, 83, 106
Not applicable
Not applicable
9 Medium- or long-term time horizons defined by ESRS 1 have been deviated from Not applicable
10 Metrics include value chain data estimated using indirect sources
10 a Disclosure of metrics that include value chain data estimated using indirect sources
10 b Description of basis for preparation of metrics that include value chain data estimated using indirect sources
10 c Description of resulting level of accuracy of metrics that include value chain data estimated using indirect sources
10 d Description of planned actions to improve accuracy in future of metrics that include value chain data estimated using indirect sources
11 a Disclosure of quantitative metrics and monetary amounts disclosed that are subject to high level of measurement uncertainty
11 b i Disclosure of sources of measurement uncertainty
11 b ii 12
Disclosure of assumptions, approximations and judgements made in measurement
13 a Explanation of changes in preparation and presentation of sustainability information and reasons for them
13 b Disclosure of revised comparative figures
13 c Disclosure of difference between figures disclosed in preceding period and revised comparative figures
14 a Disclosure of nature of prior period material errors
14 b Disclosure of corrections for prior periods included in sustainability statement
14 c Disclosure of why correction of prior period errors is not practicable
15 Disclosure of other legislation or generally accepted sustainability reporting standards and frameworks based on which information has been included in sustainability statement
Sustainability Annex – Climate – Metrics & Targets, p 94
Sustainability Annex, p 80, 83
Sustainability Annex, p 80, 83
Sustainability Annex, p 80, 83
Source Responsibly – Sustainability Actions –Carbon Reduction , p 71
Sustainability Annex, p 80-82
Sustainability Annex – Climate – Metrics & Targets - p 94-96
Sustainability Annex – Climate – Metrics & Targets - p 94-96
Not applicable
Not applicable
Not applicable
Not applicable.
Not applicable.
Not applicable.
EU Taxonomy – See p 86-91
What’s Cooking? Annual report 2023 110
Sustainability Report
What’s Cooking? Annual report 2023 111 15 Disclosure of reference to paragraphs of standard or framework applied Sustainability Annex – Climate – Metrics & Targets - p 93 16 List of DRs or DPs mandated by a Disclosure Requirement Disclosures Incorporated by Reference GOV-1 The role of the administrative, management and supervisory bodies 21 Information about composition and diversity of members of administrative, management and supervisory bodies Corporate Governance – 140-163 21 a Number of executive members Corporate Governance – 140-163 21 a Number of non-executive members Corporate Governance – 140-163 21 b Information about representation of employees and other workers Corporate Governance – 140-163 21 c Information about member's experience relevant to sectors, products and geographic locations of undertaking Corporate Governance – 140-163 21 d Board's gender diversity ratio Corporate Governance – 140-163 21 e Percentage of independent board members Corporate Governance – 140-163 22 Information about roles and responsibilities of administrative, management and supervisory bodies Corporate Governance – 140-163 22 a Information about identity of administrative, management and supervisory bodies or individual(s) within body responsible for oversight of impacts, risks and opportunities Corporate Governance – 140-163 22 b Disclosure of how body's or individuals within body responsibilities for impacts, risks and opportunities are reflected in undertaking's terms of reference, board mandates and other related policies Corporate Governance – 140-163 22 c Description of managements role in governance processes, controls and procedures used to monitor, manage and oversee impacts, risks and opportunities Corporate Governance – 140-163 22 c i Description of how oversight is exercised over management-level position or committee to which management's role is delegated to Corporate Governance – 140-163 22 c ii Information about reporting lines to administrative, management and supervisory bodies Corporate Governance – 140-163 22 c iii Disclosure of how dedicated controls and procedures are integrated with other internal functions Corporate Governance – 140-163 22 d Disclosure of how administrative, management and supervisory bodies and senior executive management oversee setting of targets related to material impacts, risks and opportunities and how progress towards them is monitored Corporate Governance – 140-163 23 Disclosure of how administrative, management and supervisory bodies determine whether appropriate skills and expertise are available or will be developed to oversee sustainability matters Corporate Governance – 140-163 23 a Information about sustainability-related expertise that bodies either directly possess or can leverage Corporate Governance – 140-163 23 b Disclosure of how sustainability-related skills and expertise relate to material impacts, risks and opportunities Corporate Governance – 140-163 GOV-2 Information provided to and sustainability matters addressed by the undertaking’s administrative, management and supervisory bodies 26 a Disclosure of whether, by whom and how frequently administrative, management and supervisory bodies are informed about material impacts, risks and opportunities, implementation of due diligence, and results and effectiveness of policies, actions, metrics and targets adopted to address them Corporate Governance – 140-163 Sustainability Report Governance
What’s Cooking? Annual report 2023 112 26 b Disclosure of how administrative, management and supervisory bodies consider impacts, risks and opportunities when overseeing strategy, decisions on major transactions and risk management process Corporate Governance – 140-163 26 c Disclosure of list of material impacts, risks and opportunities addressed by administrative, management and supervisory bodies or their relevant committees Corporate Governance – 140-163 GOV-3 Integration of sustainability-related performance in incentive schemes 29 Incentive schemes and remuneration policies linked to sustainability matters for members of administrative, management and supervisory bodies exist Corporate Governance – 140-163 29 a Description of key characteristics of incentive schemes Corporate Governance – 140-163 29 b Description of specific sustainability-related targets and (or) impacts used to assess performance of members of administrative, management and supervisory bodies Corporate Governance – 140-163 29 c Disclosure of how sustainability-related performance metrics are considered as performance benchmarks or included in remuneration policies Corporate Governance – 140-163 29 d Percentage of variable remuneration dependent on sustainability-related targets and (or) impacts Corporate Governance – 140-163 29 e Description of level in undertaking at which terms of incentive schemes are approved and updated Corporate Governance – 140-163 GOV-4 Statement on due diligence 30; 32 Disclosure of mapping of information provided in sustainability statement about due diligence process Source Responsibly – Our Sustainability Actions –Due Diligence, p 71 Respect Human Rights – Our Sustainability Actions, p 71 GOV-5 Risk management and internal controls over sustainability reporting 36 a Description of scope, main features and components of risk management and internal control processes and systems in relation to sustainability reporting Corporate Governance – 140-163 36 b Description of risk assessment approach followed Corporate Governance – 140-163 36 c Description of main risks identified and their mitigation strategies Corporate Governance – 140-163 36 d Description of how findings of risk assessment and internal controls as regards sustainability reporting process have been integrated into relevant internal functions and processes Corporate Governance – 140-163 36 e Description of periodic reporting of findings of risk assessment and internal controls to administrative, management and supervisory bodies Corporate Governance – 140-163 SBM-1 Strategy, business model and value chain 40 Disclosure of information about key elements of general strategy that relate to or affect sustainability matters Strategic objectives – p 4-47 40 a i Description of significant groups of products and (or) services offered Strategic objectives – p 4-5 40 a ii Description of significant markets and (or) customer groups served Strategic objectives – p 4-5 Value Chain & Stakeholder Engagement, p 54-57 40 a iii ESRS G1 AR 8 G1-3 Total number of employees (head count) Sustainability Annex – Social, p 103 40 a iii ESRS G1 AR 8 G1-3 Number of employees (head count) Sustainability Annex – Social, p 103
Sustainability Report Governance
What’s Cooking? Annual report 2023 113 40 a iv Description of products and services that are banned in certain markets n.a. 40 b Total revenue Financial Statement p 170 40 d i Undertaking is active in fossil fuel (coal, oil and gas) sector n.a. 40 d i Revenue from fossil fuel (coal, oil and gas) sector n.a. 40 d i Revenue from coal n.a. 40 d i Revenue from oil n.a. 40 d i Revenue from gas n.a. 40 d i Revenue from Taxonomy-aligned economic activities related to fossil gas n.a. 40 d ii Undertaking is active in chemicals production n.a. 40 d ii Revenue from chemicals production n.a. 40 d iii Undertaking is active in controversial weapons n.a. 40 d iii Revenue from controversial weapons n.a. 40 d iv Undertaking is active in cultivation and production of tobacco n.a. 40 d iv Revenue from cultivation and production of tobacco n.a. 40 e Description of sustainability-related goals in terms of significant groups of products and services, customer categories, geographical areas and relationships with stakeholders Interview with CFO - p 24-25 40 f Disclosure of assessment of current significant products and (or) services, and significant markets and customer groups, in relation to sustainability-related goals Value Chain & Stakeholder Engagement – p 54 40 g Disclosure of elements of strategy that relate to or impact sustainability matters The 3 pillars of our Sustainability Statement – p 52 41 List of ESRS sectors that are significant for undertaking n.a. 42 Description of business model and value chain Value Chain & Stakeholder Engagement – p 54 42 a Description of inputs and approach to gathering, developing and securing inputs Value Chain & Stakeholder Engagement – p 54 Protect our Planet – Source Responsibly – Driving Change: Our Sustainability actions – p 71 (EcoVadis) 42 b Description of outputs and outcomes in terms of current and expected benefits for customers, investors and other stakeholders Business overview P 4-47 Value Chain & Stakeholder Engagement – p 54-57 42 c Description of main features of upstream and downstream value chain and undertakings position in value chain Value Chain & Stakeholder Engagement –p 54-57 SBM-2 Interests and views of stakeholders 45 a Description of stakeholder engagement Value Chain & Stakeholder Engagement – p 54-57 45 a i Description of key stakeholders Value Chain & Stakeholder Engagement – p 54-57 45 a ii Description of categories of stakeholders for which engagement occurs Value Chain & Stakeholder Engagement – p 54-57 45 a iii Description of how stakeholder engagement is organised Value Chain & Stakeholder Engagement – p 54-57 45 a iv Description of purpose of stakeholder engagement Value Chain & Stakeholder Engagement – p 54-57 45 a v Description of how outcome of stakeholder engagement is taken into account Value Chain & Stakeholder Engagement – p 54-57 Sustainability Report Governance
45 b Description of understanding of interests and views of key stakeholders as they relate to undertaking's strategy and business model
45 c Description of amendments to strategy and (or) business model
45 c i Description of how strategy and (or) business model have been amended or are expected to be amended to address interests and views of stakeholders
General information - Materiality Assessment, p 53
Climate Change Mitigation – Menu card – p 67
Business overview P 4-47
Climate Change Mitigation – Menu card – p 67
Business overview P 4-47
45 c ii Description of any further steps that are being planned and in what timeline Group will adhere to CSRD from 2024 FY onwards
45 c iii Further steps that are being planned are likely to modify relationship with and views of stakeholders
45 d Description of how administrative, management and supervisory bodies are informed about views and interests of affected stakeholders with regard to sustainability-related impacts
48 a Description of material impacts resulting from materiality assessment
48 a Description of material risks and opportunities resulting from materiality assessment
48 b Disclosure of current and anticipated effects of material impacts, risks and opportunities on business model, value chain, strategy and decision-making, and how undertaking has responded or plans to respond to these effects
48 c i Disclosure of how material negative and positive impacts affect (or are likely to affect) people or environment
48 c ii Disclosure of how impacts originate from or are connected to strategy and business model
48 c iii Disclosure of reasonably expected time horizons of impacts
48 c iv Description of nature of activities or business relationships through which undertaking is involved with material impacts
48 d Disclosure of current financial effects of material risks and opportunities on financial position, financial performance and cash flows and material risks and opportunities for which there is significant risk of material adjustment within next annual reporting period to carrying amounts of assets and liabilities reported in related financial statements
48 f Information about resilience of strategy and business model regarding capacity to address material impacts and risks and to take advantage of material opportunities
Value Chain & Stakeholder Engagement – p 54
Corporate Governance, p 140-163
Sustainability Committee is updated on regular basis, see governance.
General information – Materiality Assessment, p 53
Material IRO for every material topic in Sustainability Annex – pages 83-109
Material IRO for every material topic in Sustainability Annex – pages 83-109
Material IRO for every material topic in Sustainability Annex – pages 83-109
Material IRO for every material topic in Sustainability Annex – pages 83-109
Material IRO for every material topic in Sustainability Annex – pages 83-109
Material IRO for every material topic in Sustainability Annex – pages 83-109
Material IRO for every material topic in Sustainability Annex – pages 83-109
Material IRO for every material topic in Sustainability Annex – pages 83-109
Material IRO for every material topic in Sustainability Annex – pages 83-109
48 g Disclosure of changes to material impacts, risks and opportunities compared to previous reporting period n.a.
48 h Disclosure of specification of impacts, risks and opportunities that are covered by ESRS Disclosure Requirements as opposed to those covered by additional entityspecific disclosures
IRO-1 Description of the process to identify and assess material impacts, risks and opportunities
53 a Description of methodologies and assumptions applied in process to identify impacts, risks and opportunities
Material IRO for every material topic in Sustainability Annex – pages 83-109
General information – Materiality Assessment, p 53
What’s Cooking? Annual report 2023 114
Material impacts, risks and opportunities and their interaction with strategy and business model
SBM-3
Sustainability Report Governance
53 b Description of process to identify, assess, prioritise and monitor potential and actual impacts on people and environment, informed by due diligence process
53 b i Description of how process focuses on specific activities, business relationships, geographies or other factors that give rise to heightened risk of adverse impacts
53 b ii Description of how process considers impacts with which undertaking is involved through own operations or as result of business relationships
53 b iii Description of how process includes consultation with affected stakeholders to understand how they may be impacted and with external experts
53 b iv Description of how process prioritises negative impacts based on their relative severity and likelihood and positive impacts based on their relative scale, scope and likelihood and determines which sustainability matters are material for reporting purposes
53 c Description of process used to identify, assess, prioritise and monitor risks and opportunities that have or may have financial effects
53 c i Description of how connections of impacts and dependencies with risks and opportunities that may arise from those impacts and dependencies have been considered
53 c ii Description of how likelihood, magnitude, and nature of effects of identified risks and opportunities have been assessed
53 c iii Description of how sustainability-related risks relative to other types of risks have been prioritised
53 d Description of decision-making process and related internal control procedures
53 e Description of extent to which and how process to identify, assess and manage impacts and risks is integrated into overall risk management process and used to evaluate overall risk profile and risk management processes
53 f Description of extent to which and how process to identify, assess and manage opportunities is integrated into overall management process
53 g Description of input parameters used in process to identify, assess and manage material impacts, risks and opportunities
53 h Description of how process to identify, assess and manage impacts, risks and opportunities has changed compared to prior reporting period
General information – Materiality Assessment, p 53
Material IRO for every material topic in Sustainability Annex – pages 83-109
Material IRO for every material topic in Sustainability Annex – pages 83-109For the current impact materiality exercise, there was more focus on our own operations, we will measure impact materiality again in financial year 2024 and include more business relationships in the materiality assessment.
General information – Materiality Assessment, p 53
General information – Materiality Assessment, p 53
General information – Materiality Assessment, p 53
General information – Materiality Assessment, p 53
General information – Materiality Assessment, p 53
Corporate governance / Risk assessment
Corporate governance / Risk assessment
The same process as the risk management exercise was applied for the financial materiality exercise. However opportunities were also assessed, which is not the case for the overall risk management process.
Identifying and assessing opportunities is integrated into the overall management process, but no internal audit took place yet, unlike for the overall management process.
General information – Materiality Assessment, p 53
57
What’s Cooking? Annual report 2023 115
IRO-2 Disclosure Requirements in ESRS covered by the undertaking’s sustainability statement 56 Disclosure of list of data points that derive from other EU legislation and information on their location in sustainability statement ESRS Standards Reference Table, p 110-139
Disclosure of list of ESRS Disclosure Requirements complied with in preparing sustainability statement following outcome of materiality assessment ESRS Standards Reference Table, p 110-139
n.a.
56
Explanation of negative materiality
for ESRS E1 Climate change n.a. Sustainability Report Governance
assessment
59 Explanation of how material information to be disclosed in relation to material impacts, risks and opportunities has been determined
ESRS E1 – Climate Change
E1-1 Transition plan for climate change mitigation
14 Disclosure of transition plan for climate change mitigation
16a Explanation of how targets are compatible with limiting of global warming to one and half degrees Celsius in line with Paris Agreement
16b Disclosure of decarbonisation levers and key action
16c Disclosure of significant operational expenditures (Opex) and (or) capital expenditures (Capex) required for implementation of action plan
16c Financial resources allocated to action plan (OpEx)
16c Financial resources allocated to action plan (CapEx)
16d Explanation of potential locked-in GHG emissions from key assets and products and of how locked-in GHG emissions may jeopardise achievement of GHG emission reduction targets and drive transition risk
16e Explanation of any objective or plans (CapEx, CapEx plans, OpEx) for aligning economic activities (revenues, CapEx, OpEx) with criteria established in Commission Delegated Regulation 2021/2139
16f Significant CapEx for coal-related economic activities
16f Significant CapEx for oil-related economic activities
16f Significant CapEx for gas-related economic activities
16g Undertaking is excluded from EU Paris-aligned Benchmarks
16h Explanation of how transition plan is embedded in and aligned with overall business strategy and financial planning
16i Transition plan is approved by administrative, management and supervisory bodies
16j Explanation of progress in implementing transition plan
17 Date of adoption of transition plan for undertakings not having adopted transition plan yet
E1-2 Policies related to climate change mitigation and adaptation
24 Policies in place to manage its material impacts, risks and opportunities related to climate change mitigation and adaptation [see ESRS 2 MDR-P]
25 Sustainability matters addressed by policy for climate change
General information – Materiality Assessment, p 53
Climate Change Mitigation – Transition Plan for Climate Change Mitigation, p 60-73
Climate Change Mitigation – Our Policies and Systems – Science-based targets initiative, p 62
Climate Change Mitigation – Transition Plan for Climate Change Mitigation, p 63-66
Sustainability Annex – Climate – Policies – p 92-96
Sustainability Annex – Climate – Policies – p 92-96
Sustainability Annex – Climate – Policies – p 92-96
Sustainability Annex – Climate – Policies – p 92-96
Sustainability Annex – Climate – Policies – p 92-96
n.a.
n.a.
n.a.
n.a.
Climate Change Mitigation – Transition Plan for Climate Change Mitigation, p 60-73
Our commitment to the Science Based Targets initiative was approved by the Board of Directors.
Overview of Strategic Metrics & Target – p 79
Climate Change Mitigation & Energy
Consumption and Mix – Our Policies and Systems, p 60-73
No policy in place yet for Climate Change adaptation
Climate Change Mitigation & Energy Consumption and Mix – Our Policies and Systems, p 60-73
What’s Cooking? Annual report 2023 116
n.a.
Sustainability Report Governance
AR21
of extent to which ability to implement action depends on availability and allocation of resources Sustainability Annex – Environment – Taxonomy – p 86-91
29ci Explanation of relationship of significant CapEx and OpEx required to implement actions taken or planned to relevant line items or notes in financial statements
29cii,16c Explanation of relationship of significant CapEx and OpEx required to implement actions taken or planned to key performance indicators required under Commission Delegated Regulation (EU) 2021/2178
19ciii,16c Explanation of relationship of significant CapEx and OpEx required to implement actions taken or planned to CapEx plan required by Commission Delegated Regulation (EU) 2021/2178
AR22 Explanation of any potential differences between significant OpEx and CapEx disclosed under ESRS E1 and key performance indicators disclosed under Commission Delegated Regulation (EU) 2021/2178
E1-4 Targets related to climate change mitigation and adaptation
Sustainability Annex – Environment – Taxonomy – p 86-91
Sustainability Annex – Environment – Taxonomy – p 86-91
Sustainability Annex – Environment – Taxonomy – p 86-91
Sustainability Annex – Environment – Taxonomy – p 86-91
32 Tracking effectiveness of policies and actions through targets [see ESRS 2 MDR-T ] Climate Change Mitigation & Energy Consumption and Mix – Our Sustainability Targets, p 60-73
33 Disclosure of how GHG emissions reduction targets and (or) any other targets have been set to manage material climate-related impacts, risks and opportunities
34a + 34 b Tables: Multiple Dimensions (baseline year and targets; GHG Types, Scope 3 Categories, Decarbonisation levers, entity-specific denominators for intensity value)
34a + 34 b Absolute value of total Greenhouse gas emissions reduction
34a + 34 b Percentage of total Greenhouse gas emissions reduction (as of emissions of base year)
34a + 34 b Intensity value of total Greenhouse gas emissions reduction
34a + 34 b Absolute value of Scope 1 Greenhouse gas emissions reduction
34a + 34 b Percentage of Scope 1 Greenhouse gas emissions reduction (as of emissions of base year)
34a + 34 b Intensity value of Scope 1 Greenhouse gas emissions reduction
34a + 34 b Absolute value of location-based Scope 2 Greenhouse gas emissions reduction
34a + 34 b Percentage of location-based Scope 2 Greenhouse gas emissions reduction (as of emissions of base year)
34a + 34 b Intensity value of location-based Scope 2 Greenhouse gas emissions reduction
Climate Change Mitigation & Energy Consumption and Mix – Our Sustainability Targets, p 60-73
Sustainability Annex – Environmental – Climate Change – Metrics & Targets – p 92-96
Sustainability Annex – Environmental – Climate Change – Metrics & Targets – p 92-96
Not disclosed, we work with absolute value
Sustainability Annex – Environmental – Climate Change – Metrics & Targets – p 92-96
Sustainability Annex – Environmental – Climate Change – Metrics & Targets – p 92-96
Not disclosed, we work with absolute value
We will disclose this from 2024 onwards
We will disclose this from 2024 onwards
Not disclosed, we work with absolute value
What’s Cooking? Annual report 2023 117 E1-3 Actions and resources in relation to climate change policies 28 Actions and Resources related to climate change mitigation and adaptation [see ESRS 2 MDR-A] Climate Change Mitigation – Transition Plan for Climate Change Mitigation, p 60-73 29a Decarbonisation lever type Climate Change Mitigation – Transition Plan for Climate Change Mitigation, p 60-73
Achieved GHG emission reductions Overview of Strategic Metrics &
–
79
Expected GHG emission
Climate
Mitigation – Transition Plan for Climate Change Mitigation,
29b
Target
p
29b
reductions
Change
p 60-73
Explanation
Sustainability Report Governance
34a + 34 b Absolute value of market-based Scope 2 Greenhouse gas emissions reduction
34a + 34 b Percentage of market-based Scope 2 Greenhouse gas emissions reduction (as of emissions of base year)
34a + 34 b Intensity value of market-based Scope 2 Greenhouse gas emissions reduction
34a + 34 b Absolute value of Scope 3 Greenhouse gas emissions reduction
34a + 34 b Percentage of Scope 3 Greenhouse gas emissions reduction (as of emissions of base year)
34a + 34 b Intensity value of Scope 3 Greenhouse gas emissions reduction
34b Explanation of how consistency of GHG emission reduction targets with GHG inventory boundaries has been ensured
AR 25 a Description of how it has been ensured that baseline value is representative in terms of activities covered and influences from external factors
AR 25 b Description of how new baseline value affects new target, its achievement and presentation of progress over time
34e,16a GHG emission reduction target is science based and compatible with limiting global warming to one and half degrees Celsius
34f,16b Description of expected decarbonisation levers and their overall quantitative contributions to achieve GHG emission reduction target
AR 30c Diverse range of climate scenarios have been considered to detect relevant environmental, societal, technology, market and policy-related developments and determine decarbonisation levers
E1-5 Energy consumption and mix
37 Total energy consumption related to own operations
37a Total energy consumption from fossil sources
37b Total energy consumption from nuclear sources
AR 34 Percentage of energy consumption from nuclear sources in total energy consumption
37c Total energy consumption from renewable sources
37ci Fuel consumption from renewable sources (biomass, biofuels, biogas)
37cii Consumption of purchased or acquired electricity, heat, steam, and cooling from renewable sources
37ciii Consumption of self-generated non-fuel renewable energy
AR 34, AR 71
Percentage of renewable sources in total energy consumption
Sustainability Annex – Environmental – Climate Change – Metrics & Targets – p 92-96
Sustainability Annex – Environmental – Climate Change – Metrics & Targets – p 92-96
Not disclosed, we work with absolute value
Sustainability Annex – Environmental – Climate Change – Metrics & Targets – p 92-96
Sustainability Annex – Environmental – Climate Change – Metrics & Targets – p 92-96
Not disclosed, we work with absolute value
Sustainability Annex – Environmental – Climate Change – Metrics & Targets – p 92-96
Not yet audited, but an external carbon consultant helped with the calculations in line with the Greenhouse Gas Protocol. This will be audited in 2024.
n.a.
Climate Change Mitigation & Energy Consumption and Mix – Our Policies and Systems, p 60-73
Climate Change Mitigation – Transition Plan for Climate Change Mitigation, p 60-73
No scenario analysis has been performed yet
Sustainability Annex – Environmental – Climate Change – Energy consumption and mix – p 92-96
Sustainability Annex – Environmental – Climate Change – Energy consumption and mix – p 92-96
Sustainability Annex – Environmental – Climate Change – Energy consumption and mix – p 92-96
Sustainability Annex – Environmental – Climate Change – Energy consumption and mix – p 92-96
Sustainability Annex – Environmental – Climate Change – Energy consumption and mix – p 92-96
Sustainability Annex – Environmental – Climate Change – Energy consumption and mix – p 92-96
Sustainability Annex – Environmental – Climate Change – Energy consumption and mix – p 92-96
Sustainability Annex – Environmental – Climate Change – Energy consumption and mix – p 92-96
Sustainability Annex – Environmental – Climate Change – Energy consumption and mix – p 92-96
What’s Cooking? Annual report 2023 118
Report Governance
Sustainability
AR 46 d Gross Scopes 1, 2, 3 and Total GHG emissions - Scope 3 GHG emissions (GHG Protocol) [table]
DAVAI (in which the group holds 50%) is not included in the financial report and greenhouse gas emissions were not yet calculated.
Sustainability Annex –
What’s Cooking? Annual report 2023 119 38a Fuel consumption from coal and coal products n.a. 38b Fuel consumption from crude oil and petroleum products Sustainability Annex – Environmental – Climate Change – Energy consumption and mix – p 92-96 38c Fuel consumption from natural gas Sustainability Annex – Environmental – Climate Change – Energy consumption and mix – p 92-96 38d Fuel consumption from other fossil sources n.a. 38e Consumption of purchased or acquired electricity, heat, steam, or cooling from fossil sources Sustainability Annex – Environmental – Climate Change – Energy consumption and mix – p 92-96 AR 34 Percentage of fossil sources in total energy consumption Sustainability Annex – Environmental – Climate Change – Energy consumption and mix – p 92-96 39 Sustainability Annex – Environmental – Climate Change – Energy consumption and mix – p 92-96 39 Non-renewable energy production Sustainability Annex – Environmental – Climate Change – Energy consumption and mix – p 92-96 40 Energy intensity from activities in high climate impact sectors (total energy consumption per net revenue) Sustainability Annex – Environmental – Climate Change – Energy consumption and mix – p 92-96
Total energy consumption from activities in high climate impact sectors Same as total energy consumption, food is seen as high climate impact sector.
High climate impact sectors used to determine energy intensity Same as total energy consumption, food is seen as high climate impact sector. 43 Disclosure of reconciliation to relevant line item or notes in financial statements of net revenue from activities in high climate impact sectors Sustainability annex Climate change – Energy data table – p 92-96 E1-6 Gross Scopes 1,2,3 and Total GHG emissions 44 Gross Scopes 1, 2, 3 and Total GHG emissions - GHG emissions per scope [table] Sustainability Annex – Environmental – Climate Change – Metrics & Targets – p 92-96 50 Gross Scopes 1, 2, 3 and Total GHG emissions - financial and operational control [table]
41
42
Environmental – Climate Change – Metrics & Targets – p 92-96 48 a Gross Scope 1 greenhouse gas emissions Sustainability Annex – Environmental – Climate Change – Metrics & Targets – p 92-96 48 b Percentage of Scope 1 GHG emissions from regulated emission trading schemes Sustainability Annex – Environmental – Climate Change – Metrics & Targets – p 92-96 49 a Gross location-based Scope 2 greenhouse gas emissions We will disclose this from 2024 onwards 49 b Gross market-based Scope 2 greenhouse gas emissions Sustainability Annex – Environmental – Climate Change – Metrics & Targets – p 92-96 51 Gross Scope 3 greenhouse gas emissions Sustainability Annex – Environmental – Climate Change – Metrics & Targets – p 92-96 44+52 Total GHG emissions Sustainability Annex – Environmental – Climate Change – Metrics & Targets – p 92-96 44+52a Total GHG emissions location based We will disclose this from 2024 onwards 44+52b Total GHG emissions market based Sustainability Annex – Environmental – Climate Change – Metrics & Targets – p 92-96 Sustainability Report Governance
52 a) Scope 2 location-based We will disclose this from 2024 onwards
52 b) Scope 2 market-based
47 Disclosure of significant changes in definition of what constitutes reporting undertaking and its value chain and explanation of their effect on year-to-year comparability of reported GHG emissions
AR 39 b Disclosure of methodologies, significant assumptions and emissions factors used to calculate or measure GHG emissions
AR 42 c Disclosure of the effects of significant events and changes in circumstances (relevant to its GHG emissions) that occur between the reporting dates of the entities in its value chain and the date of the undertaking’s general purpose financial statements
AR 45d
Percentage of contractual instruments, Scope 2 GHG emissions
AR 45d Disclosure of types of contractual instruments, Scope 2 GHG emissions
AR 45d
AR 45d
AR 45d
Percentage of market-based Scope 2 GHG emissions linked to purchased electricity bundled with instruments
Percentage of contractual instruments used for sale and purchase of energy bundled with attributes about energy generation in relation to Scope 2 GHG emissions
Percentage of contractual instruments used for sale and purchase of unbundled energy attribute claims in relation to Scope 2 GHG emissions
AR 45d Disclosure of types of contractual instruments used for sale and purchase of energy bundled with attributes about energy generation or for unbundled energy attribute claims
AR 45e Biogenic emissions of CO2 from combustion or bio-degradation of biomass not included in Scope 2 GHG emissions
AR 45e Biogenic emissions of CO2 from combustion or bio-degradation of biomass that occur in value chain not included in Scope 3 GHG emissions
AR 46 g Percentage of GHG Scope 3 calculated using primary data
AR 46 i Disclosure of why Scope 3 GHG emissions category has been excluded
AR 46 i List of Scope 3 GHG emissions categories included in inventory
AR 46 h Disclosure of reporting boundaries considered and calculation methods for estimating Scope 3 GHG emissions
53 GHG emissions intensity, location-based (total GHG emissions per net revenue)
53 GHG emissions intensity, market-based (total GHG emissions per net revenue)
Sustainability Annex – Environmental – Climate Change – Metrics & Targets – p 92-96
n.a.
Sustainability Annex – Environmental – Climate Change – Metrics & Targets – p 92-96
n.a.
Purchased approx 50.9% green energy via guarantees of origin which are purchased separately (so not via the energy provider). The 50.9% excludes the component green energy included in the normal country mix purchased from the energy provider.
Sustainability Annex – Environmental – Climate –Metrics & Targets – p 92-96
Sustainability Annex – Environmental – Climate –Metrics & Targets – p 92-96
Sustainability Annex – Environmental – Climate Change – p 92-96
Sustainability Annex – Environmental – Climate Change – p 92-96
Sustainability Annex – Environmental – Climate Change – p 92-96
Sustainability Annex – Environmental – Climate Change – p 92-96
Sustainability Annex – Environmental – Climate Change – p 92-96
Sustainability Annex – Environmental – Climate Change – p 92-96
What’s Cooking? Annual report 2023 120
Report
Sustainability
Governance
What’s Cooking? Annual report 2023 121 55 Disclosure of reconciliation to financial statements of net revenue used for calculation of GHG emissions intensity Disclosure of reconciliation to relevant line item or notes in financial statements of net revenue amounts Consolidated Accounts – p 170 – line revenue E1-7 GHG removals and GHG mitigation projects financed through carbon credits We do not make use of carbon credits. E1-8 Internal carbon pricing
did not yet assess an internal carbon price, but we regularly compare with current carbon price to show importance. E1-9 Anticipated financial effects from material physical and transition risks and potential climate-related opportunities 66 c Disclosure of location of significant assets at material physical risk Not yet disclosed AR 69a Disclosure of how anticipated financial effects for assets and business activities at material physical risk have been assessed Not yet disclosed AR 69b Disclosure of how assessment of assets and business activities considered to be at material physical risk relies on or is part of process to determine material physical risk and to determine climate scenarios
yet disclosed AR 72a, AR 73a Disclosure of how potential effects on future financial performance and position for assets and business activities at material transition risk have been assessed Sustainability Annex – Environmental – Climate Change – Material IRO - p 92-96 AR 72b Disclosure of how assessment of assets and business activities considered to be at material transition risk relies on or is part of process to determine material transition risks and to determine scenarios
68a Disclosure of reconciliations with financial statements of significant amounts of assets and net revenue at material physical risk Not conducted yet 68b Disclosure of reconciliations with financial statements of significant amounts of assets, liabilities and net revenue at material transition risk Not conducted yet ESRS 2 General Disclosures linked with climate change 13 Disclosure of how climate-related considerations are factored into remuneration of members of administrative, management and supervisory bodies Corporate Governance, p 140-163 13 Percentage of remuneration recognised that is linked to climate related considerations Corporate Governance, p 140-163 13 Explanation of climate-related considerations that are factored into remuneration of members of administrative, management and supervisory bodies Corporate Governance, p 140-163 18 Type of climate-related risk Sustainability Annex – Environmental – Climate Change – Material IRO, p 92-96 19a Description of scope of resilience analysis Did not conduct a detailed resilience analysis yet. 19b Disclosure of how resilience analysis has been conducted Did not conduct a detailed resilience analysis yet. 19b Date of resilience analysis Did not conduct a detailed resilience analysis yet. AR 7b Time horizons applied for resilience analysis Did not conduct a detailed resilience analysis yet. 19c Description of results of resilience analysis Did not conduct a detailed resilience analysis yet. AR 8b Description of ability to adjust or adapt strategy and business model to climate change Climate Change Mitigation – Transition Plan for Climate Change Mitigation, p 60-73 20a, AR 9 Description of process in relation to impacts on climate change Sustainability Annex – Environmental – Climate Change – Material IRO, p 92-96 Sustainability Report Governance
We
Not
No climate scenario analysis conducted yet
20b Description of process in relation to climate-related physical risks in own operations and along value chain
AR 11a Climate-related hazards have been identified over short-, medium- and long-term time horizons
AR 11a Undertaking has screened whether assets and business activities may be exposed to climate-related hazards
AR 11b Short-, medium- and long-term time horizons have been defined
AR 11c Extent to which assets and business activities may be exposed and are sensitive to identified climate-related hazards has been assessed
AR 11d Identification of climate-related hazards and assessment of exposure and sensitivity are informed by high emissions climate scenarios
21 Explanation of how climate-related scenario analysis has been used to inform identification and assessment of physical risks over short, medium and long-term
20c Description of process in relation to climate-related transition risks and opportunities in own operations and along value chain
AR 12a Transition events have been identified over short-, medium- and long-term time horizons
AR 12a Undertaking has screened whether assets and business activities may be exposed to transition events
AR 12b Extent to which assets and business activities may be exposed and are sensitive to identified transition events has been assessed
AR 12c Identification of transition events and assessment of exposure has been informed by climate-related scenario analysis
AR 12d Assets and business activities that are incompatible with or need significant efforts to be compatible with transition to climate-neutral economy have been identified
21 Explanation of how climate-related scenario analysis has been used to inform identification and assessment of transition risks and opportunities over short, medium and long-term
AR 15
Explanation of how climate scenarios used are compatible with critical climaterelated assumptions made in financial statements
ESRS E3 – Water and Marine Resources
E3-1 Policies related to water and marine resources
Sustainability Annex – Environmental – Climate Change – Material IRO, p 92-96
Sustainability Annex – Environmental – Climate Change – Material IRO, p 92-96
Sustainability Annex – Environmental – Climate Change – Material IRO, p 92-96
Sustainability Annex – Environmental – Climate Change – Material IRO, p 92-96
Sustainability Annex – Environmental – Climate Change – Material IRO, p 92-96
Did not conduct a detailed climate scenario analysis yet.
Did not conduct a detailed climate scenario analysis yet.
Sustainability Annex – Environmental – Climate Change – Material IRO, p 92-96
Sustainability Annex – Environmental – Climate Change – Material IRO, p 92-96
Sustainability Annex – Environmental – Climate Change – Material IRO, p 92-96
Sustainability Annex – Environmental – Climate Change – Material IRO, p 92-96
Did not conduct a detailed climate scenario analysis yet.
Climate Change Mitigation – Transition Plan for Climate Change Mitigation, p 92-96
Did not conduct a detailed climate scenario analysis yet.
Did not conduct a detailed climate scenario analysis yet.
11 Policies to manage its material impacts, risks and opportunities related to water and marine resources [see ESRS 2 MDR-P] Fight Climate Change
12a
12a iii Disclosure of whether and how policy addresses prevention and abatement of water pollution
What’s Cooking? Annual report 2023 122
–Our
– Water Management
Policies and Systems – p 68
–Our
– p 68
12a Disclosure of whether and how policy addresses water management Fight Climate Change – Water Management
Policies and Systems
–Our
i Disclosure of whether and how policy addresses the use and sourcing of water and marine resources in own operations Fight Climate Change – Water Management
Policies and Systems – p 68
12a ii Disclosure of whether and how policy addresses water treatment Fight Climate Change – Water Management –Our Policies and Systems – p 68
Report Governance
Fight Climate Change – Water Management –Our Policies and Systems – p 68 Sustainability
What’s Cooking? Annual report 2023 123 12 b Disclosure of whether and how policy addresses product and service design in view of addressing water-related issues and preservation of marine resources Fight Climate Change – Water Management –Our Policies and Systems – p 68 12 c Disclosure of whether and how policy addresses commitment to reduce material water consumption in areas at water risk Fight Climate Change – Water Management –Our Policies and Systems – p 68 13 Disclosure of reasons for not having adopted policies in areas of high-water stress n.a. 14 Policies or practices related to sustainable oceans and seas have been adopted Fight Climate Change – Source Responsibly – Our Policies and Systems– Only ASC/MSC/Global GAP fish – p 71-73 E3-2 Actions and resources related to water and marine resources 17 Actions and resources in relation to water and marine resources [see ESRS 2 MDR-A] Fight Climate Change - Water Management –Driving Change: Our Sustainability Actions 19 Disclosure of actions and resources in relation to areas at water risk Water risk analysis not conducted yet, is scheduled in 2024. E3-3 Targets related to water and marine resources 22 Tracking effectiveness of policies and actions through targets [see ESRS 2 MDR-T ] Fight Climate Change - Water Management – Our Sustainability Targets 23 a Disclosure of whether and how target relates to management of material impacts, risks and opportunities related to areas at water risk Water risk analysis not conducted yet, is scheduled in 2024. 23 b Disclosure of whether and how target relates to responsible management of marine resources impacts, risks and opportunities Fight Climate Change – Source Responsibly – Our Policies and Systems– 100% ASC/MSC/Global GAP fish – p 71-73 23 c Disclosure of whether and how target relates to reduction of water consumption Fight Climate Change - Water Management –Driving Change: Our Sustainability Actions 25 Adopted and presented water and marine resources-related target is mandatory (based on legislation) Not mandatory E3-4 Water consumption 28 a Total water consumption Sustainability Annex – Environmental – Water –Metrics & Targets – p 97 28 b Total water consumption in areas at water risk, including areas of high-water stress Water risk analysis not conducted yet, is scheduled in 2024. 28 c Total water recycled and reused Sustainability Annex – Environmental – Water –Metrics & Targets – p 97 28 d Total water stored Sustainability Annex – Environmental – Water –Metrics & Targets – p 97 28 d Changes in water storage Sustainability Annex – Environmental – Water –Metrics & Targets – p 97 28 e Disclosure of contextual information regarding water consumption Water consumption numbers are collected for every location and then consolidated. 29 Water intensity ratio Sustainability Annex – Environmental – Water –Metrics & Targets – p 97 E3-5 Anticipated financial effects from material water and marine resources-related risks and opportunities 33 a Disclosure of qualitative information of potential financial effects of material risks and opportunities arising from water and marine resources-related impacts Sustainability Annex – Environmental – Water –Material IRO – p 97 Sustainability Report Governance
General disclosures
8 a) Disclosure of whether and how assets and activities have been screened in order to identify actual and potential water and marine resources-related impacts, risks and opportunities in own operations and upstream and downstream value chain and methodologies, assumptions and tools used in screening
8 b Disclosure of how consultations have been conducted (water and marine resources)
AR 1 Disclosure of results of materiality assessment (water and marine resources)
ESRS E5 – Resource use and circular economy
E5-1 Policies related to resource use and circular economy
14 Policies to manage its material impacts, risks and opportunities related to resource use and circular economy [see ESRS 2 MDR-P]
15a Disclosure of whether and how policy addresses transitioning away from extraction of virgin resources, including relative increases in use of secondary (recycled) resources
15b Disclosure of whether and how policy addresses sustainable sourcing and use of renewable resources
E5-2 Actions and resources related to resource use and circular economy
19 Actions and resources in relation to resource use and circular economy [see ESRS 2 MDR-A]
E5-3 Targets related to resource use and circular economy
23 Tracking effectiveness of policies and actions through targets [see ESRS 2 MDR-T ]
24 Disclosure of how target relates to resources (resource use and circular economy)
24 a Disclosure of how target relates to increase of circular design
24 b Disclosure of how target relates to increase of circular material use rate
24 c Disclosure of how target relates to minimisation of primary raw material
24 d Disclosure of how target relates to reversal of depletion of stock of renewable resources
24 e Target relates to waste management
Not yet included
Sustainability Annex – General information –Materiality Assessment – p 83-85
Sustainability Annex – Environmental – Water –Material IRO – p 97
Win the war on waste – Fighting food waste – Our Policies and Systems – p 69-70
Win the war on waste – Sustainable Packaging –Our Policies and Systems – p 70
Source responsibly – Our Policies and Systems – p 71
Win the war on waste – Sustainable Packaging –Our Policies and Systems – p 70
Source responsibly – Our Policies and Systems – p 71
Win the war on waste – Sustainable Packaging –Our Policies and Systems – p 70
Source responsibly – Our Policies and Systems – p 71
Win the war on waste – Fighting food waste – Our Sustainability Actions - p 69-70
Win the war on waste – Sustainable Packaging –Our Sustainability Actions – p 70
Win the war on waste – Fighting food waste –Our Sustainability Targets – p 69-70
Win the war on waste – Sustainable Packaging – Our Sustainability Targets – p 70
Sustainability Annex – Circular Economy – Metrics & Targets- p 98-100
Sustainability Annex – Circular Economy – Metrics & Targets- p 98-100
Sustainability Annex – Circular Economy – Metrics & Targets- p 98-100
Sustainability Annex – Circular Economy – Metrics & Targets- p 98-100
Sustainability Annex – Circular Economy – Metrics & Targets- p 98-100
Sustainability Annex – Circular Economy – Metrics & Targets- p 98-100
What’s Cooking? Annual report 2023 124
Report
Sustainability
Governance
What’s Cooking? Annual report 2023 125 24 f Disclosure of how target relates to other matters related to resource use or circular economy Sustainability Annex – Circular Economy – Metrics & Targets- p 98-100 25 Layer in waste hierarchy to which target relates Sustainability Annex – Circular Economy – Metrics & Targets- p 98-100 27 The targets being set and presented are mandatory (required by legislation) No, with the exception of packaging, which is derived from EU Directives, not all converted into national legislation E5-4 Resource inflows 30 Disclosure of information on material resource inflows 31a Overall total weight of products and technical and biological materials used during the reporting period Sustainability Annex – Circular Economy – Metrics & Targets- p 98-100 31b Percentage of biological materials (and biofuels used for non-energy purposes) Sustainability Annex – Circular Economy – Metrics & Targets- p 98-100 31c The absolute weight of secondary reused or recycled components, secondary intermediary products and secondary materials used to manufacture the undertaking’s products and services (including packaging) Sustainability Annex – Circular Economy – Metrics & Targets- p 98-100 31c Percentage of secondary reused or recycled components, secondary intermediary products and secondary materials Sustainability Annex – Circular Economy – Metrics & Targets- p 98-100 32 Description of methodologies used to calculate data and key assumptions used Company measurement system and invoice data AR 25 Description of how double counting was avoided and of choices made Company measurement system E5-5 Resource outflows 35 Description of the key products and materials that come out of the undertaking’s production process Value Chain 36a Disclosure of the expected durability of the products placed on the market, in relation to the industry average for each product group Sustainability Annex – Circular Economy – Metrics & Targets- p 98-100 36b Disclosure of the reparability of products n.a. for food company 36c The rates of recyclable content in products n.a. for food company 36c The rates of recyclable content in products packaging Sustainability Annex – Circular Economy – Metrics & Targets- p 98-100 40 Description of methodologies used to calculate data (resource outflows) Sustainability Annex – Circular Economy – Metrics & Targets- p 98-100 37 a Total Waste generated Sustainability Annex – Circular Economy – Metrics & Targets- p 98-100 37 b Hazardous waste diverted from disposal Sustainability Annex – Circular Economy – Metrics & Targets- p 98-100 37b(i) Hazardous waste diverted from disposal due to preparation for reuse Sustainability Annex – Circular Economy – Metrics & Targets- p 98-100 37b(ii) Hazardous waste diverted from disposal due to recycling Sustainability Annex – Circular Economy – Metrics & Targets- p 98-100 37b(ii) Hazardous waste diverted from disposal due to other recovery operations Sustainability Annex – Circular Economy – Metrics & Targets- p 98-100 37b Non-hazardous waste diverted from disposal Sustainability Annex – Circular Economy – Metrics & Targets- p 98-100 Sustainability Report Governance
What’s Cooking? Annual report 2023 126 37b(i) Non-hazardous waste diverted from disposal due to preparation for reuse Sustainability Annex – Circular Economy – Metrics & Targets- p 98-100 37b(ii) Non-hazardous waste diverted from disposal due to recycling Sustainability Annex – Circular Economy – Metrics & Targets- p 98-100 37b(ii) Non-hazardous waste diverted from disposal due to other recovery operations Sustainability Annex – Circular Economy – Metrics & Targets- p 98-100 37 c Hazardous waste directed to disposal 37 c(i) Hazardous waste directed to disposal by incineration Sustainability Annex – Circular Economy – Metrics & Targets- p 98-100 37 c(ii) Hazardous waste directed to disposal by landfilling Sustainability Annex – Circular Economy – Metrics & Targets- p 98-100 37 c(ii) Hazardous waste directed to disposal by other disposal operations Sustainability Annex – Circular Economy – Metrics & Targets- p 98-100 37 c Non-hazardous waste directed to disposal Sustainability Annex – Circular Economy – Metrics & Targets- p 98-100 37 c(i) Non-hazardous waste directed to disposal by incineration Sustainability Annex – Circular Economy – Metrics & Targets- p 98-100 37 c(ii) Non-hazardous waste directed to disposal by landfilling Sustainability Annex – Circular Economy – Metrics & Targets- p 98-100 37 c(ii) Non-hazardous waste directed to disposal by other disposal operations Sustainability Annex – Circular Economy – Metrics & Targets- p 98-100 37 d Non-recycled waste Sustainability Annex – Circular Economy – Metrics & Targets- p 98-100 37 d Percentage of non-recycled waste Sustainability Annex – Circular Economy – Metrics & Targets- p 98-100 38 Disclosure of composition of waste Sustainability Annex – Circular Economy – Metrics & Targets- p 98-100 38 a Disclosure of waste streams relevant to undertaking's sector or activities Sustainability Annex – Circular Economy – Metrics & Targets- p 98-100 38 b Disclosure of materials that are present in waste Sustainability Annex – Circular Economy – Metrics & Targets- p 98-100 39 Total amount of hazardous waste Sustainability Annex – Circular Economy – Metrics & Targets- p 98-100 39 Total amount of radioactive waste Sustainability Annex – Circular Economy – Metrics & Targets- p 98-100 40 Description of methodologies used to calculate data (waste generated) Sustainability Annex – Circular Economy – Metrics & Targets- p 98-100 E5-6 Anticipated financial effects from material resource use and circular economy-related risks and opportunities 43 a Disclosure of qualitative information of potential financial effects of material risks and opportunities arising from resource use and circular economy-related impacts Sustainability Annex – Circular Economy – Metrics & Material IRO- p 98-100 General disclosures 11a Disclosure of methodologies, assumptions and tools used in the screening in order to identify actual and potential impacts, risks and opportunities in own operations and upstream and downstream value chain Sustainability Annex – General information –Materiality Assessment – p 83-85 Sustainability Report
Governance
of whether and how policies are implemented through specific procedures to ensure discrimination is prevented, mitigated and acted upon once detected, as well as to advance diversity and inclusion
What’s Cooking? Annual report 2023 127 11 b Information about process for conducting consultations (resource and circular economy) Sustainability Annex – General information –Materiality Assessment – p 83-85 AR 7 a Disclosure of business units associated to resource use and circular economy material impacts, risks and opportunities Sustainability Annex – Circular Economy –Material IRO- p 98-100 AR 7 b Disclosure of material resources used Sustainability Annex – Circular Economy –Material IRO- p 98-100 AR 7 c Disclosure of material impacts and risks of staying in business as usual Sustainability Annex – Circular Economy –Material IRO- p 98-100 AR 7 d Disclosure of material opportunities related to circular economy Sustainability Annex – Circular Economy –Material IRO- p 98-100 AR 7 e Disclosure of material impacts and risks of transition to circular economy Sustainability Annex – Circular Economy –Material IRO- p 98-100 AR 7 f Disclosure of stages of value chain where resource use, risks and negative impacts are concentrated Sustainability Annex – Circular Economy –Material IRO- p 98-100 Value Chain & Stakeholder Engagement – p 54-57 ESRS S1 – Own workforce S1-1 Policies related to own workforce 19 Policies to manage material impacts, risks and opportunities related to own workforce, including for specific groups within workforce or all own workforce Boost Employee Engagement – Our Policies and Systems – Business Code of Conduct – p 75 Guard Employee Safety - Our Policies and Systems – Safety policy – p 74 20 Description of relevant human rights policy commitments relevant to own workforce Boost Employee Engagement – Our Policies and Systems – Business Code of Conduct – p 75 20a Disclosure of general approach in relation to respect for human rights including labour rights, of people in its own workforce General approach for the whole group is work in progress. 20b Disclosure of general approach in relation to engagement with people in its own workforce Sustainability Annex – Own Workforce – Policies – p 75 20c Disclosure of general approach in relation to measures to provide and (or) enable remedy for human rights impacts Sustainability Annex – Own Workforce – Policies –Whistleblowing policy - p 75 21 Disclosure of whether and how policies are aligned with relevant internationally recognised instruments Sustainability Annex – Own Workforce – Policies - p 75 22 Policies explicitly address trafficking in human beings, forced labour or compulsory labour and child labour Sustainability Annex – Own Workforce – Policies - p 75 23 Workplace accident prevention policy or management system is in place Guard Employee Safety - Our Policies and Systems – Safety policy – p 74 24a Specific policies aimed at elimination of discrimination are in place Boost Employee Engagement – Our Policies and Systems – Business Code of Conduct – p 75 24b Grounds for discrimination are specifically covered in policy Boost Employee Engagement – Our Policies and Systems – Business Code of Conduct – p 75 24c
Employee Engagement
– Business Code
24d
Annex – Own
-
75 Sustainability Report Governance
Disclosure of specific policy commitments related to inclusion and (or) positive action for people from groups at particular risk of vulnerability in own workforce Boost
– Our Policies and Systems
of Conduct – p 75
Disclosure
Sustainability
Workforce – Policies –Whistleblowing policy
p
S1-2 Processes for engaging with own workforce and workers’ representatives about impacts
27
Disclosure of whether and how perspectives of own workforce inform decisions or activities aimed at managing actual and potential impacts
27a Engagement occurs with own workforce or their representatives
27b
27c
27d
27e
28
Disclosure of stage at which engagement occurs, type of engagement and frequency of engagement
Disclosure of function and most senior role within undertaking that has operational responsibility for ensuring that engagement happens and that results inform undertakings approach
Disclosure of Global Framework Agreement or other agreements related to respect of human rights of workers
Disclosure of how effectiveness of engagement with its own workforce is assessed
Disclosure of steps taken to gain insight into perspectives of people in its own workforce that may be particularly vulnerable to impacts and (or) marginalised
S1-3 Processes to remediate negative impacts and channels for own workforce to raise concerns
32a Disclosure of general approach to and processes for providing or contributing to remedy where undertaking has caused or contributed to a material negative impact on people in its own workforce
32b Disclosure of specific channels in place for its own workforce to raise concerns or needs directly with undertaking and have them addressed
32c Grievance or complaints handling mechanisms related to employee matters exist
32d
32e
Disclosure of processes through which undertaking supports or requires availability of channels
Disclosure of how issues raised and addressed are tracked and monitored and how effectiveness of channels is ensured
33 Disclosure of whether and how it is assessed that its own workforce is aware of and trust structures or processes as way to raise their concerns or needs and have them addressed
Sustainability Annex – Own Workforce – Policies – p 101-105
Sustainability Annex – Own Workforce – Policies – p 101-105
Sustainability Annex – Own Workforce – Policies – p 101-105
Sustainability Annex – Own Workforce – Policies - p 101-105
Sustainability Annex – Own Workforce – Policies - p 101-105
Sustainability Annex – Own Workforce – Policies – p 101-105
Sustainability Annex – Own Workforce – Policies – p 101-105
Sustainability Annex – Own Workforce – Policies –Whistleblowing policy - p 101-105
Sustainability Annex – Own Workforce – Policies –Whistleblowing policy - p 101-105
Sustainability Annex – Own Workforce – Policies –Whistleblowing policy - p 101-105
Sustainability Annex – Own Workforce – Policies –Whistleblowing policy - p 101-105
Sustainability Annex – Own Workforce – Policies –Whistleblowing policy - p 101-105
The Whistleblowing tool is easily available on the website, employees were also informed during the Code of Conduct trainings
S1-4 Taking action on material impacts on own workforce, and approaches to managing material risks and pursuing material opportunities related to own workforce, and effectiveness of those actions
38a Description of actions taken, planned or underway to prevent or mitigate negative impacts on own workforce
38b Disclosure on whether and how action has been taken to provide or enable remedy in relation to actual material impact
38c Description of additional initiatives or actions with primary purpose of delivering positive impacts for own workforce
38d Description of how effectiveness of actions and initiatives in delivering outcomes for own workforce is tracked and assessed
Boost Employee Engagement – Driving Change:
Our Sustainability Actions – p 75
Guard Employee Safety - Driving Change: Our Sustainability Actions – p 74
Sustainability Annex – Own Workforce – Policies –Whistleblowing policy - p 101-105
Boost Employee Engagement – Driving Change: Our Sustainability Actions – p 75
Guard Employee Safety - Driving Change: Our Sustainability Actions – p 74
Boost Employee Engagement – Our Policies and Systems – Engagement Index – p 75
What’s Cooking? Annual report 2023 128
Report Governance
Sustainability
39 Description of process through which it identifies what action is needed and appropriate in response to particular actual or potential negative impact on own workforce
40a Description of what action is planned or underway to mitigate material risks arising from impacts and dependencies on own workforce and how effectiveness is tracked
40b Description of what action is planned or underway to pursue material opportunities in relation to own workforce
41 Disclosure of whether and how it is ensured that own practices do not cause or contribute to material negative impacts on own workforce
43 Disclosure of resources that are allocated to the management of material impacts
Sustainability Annex – Own Workforce – Policies –Whistleblowing policy - p 101-105
Sustainability Annex – Own Workforce – Material IRO – p 101-105
Boost Employee Engagement – Our Sustainability Actions
Sustainability Annex – Own Workforce – Actions – p 101-105
Sustainability Annex – Own Workforce – Actions – p 101-105
S1-5 Targets related to managing material negative impacts, advancing positive impacts, and managing material risks and opportunitiesto own workforce, and effectiveness of those actions
46 Targets set to manage material impacts, risks and opportunities related to own workforce [see ESRS 2 - MDR-T]
47a Disclosure of whether and how
47c Disclosure of whether and how own workforce or workforce' representatives were engaged directly in identifying lessons or improvements as result of undertakings performance
S1-6 Characteristics of the undertaking’s
50a Characteristics of undertaking's employees - number of employees in countries with 50 or more employees [table]
50a Number of employees in countries with 50 or more employees
50b Characteristics of undertaking's employees - information on employees by contract type, gender and region [table]
50b Number of employees (head count or full-time equivalent)
50b Average number of employees (head count or full-time equivalent)
50c Number of employee turnover
50c Percentage of employee turnover
50d Description of methodologies and assumptions used to compile data (employees)
Guard Employee Safety – Our Sustainability Targets
Boost Employee Engagement – Our Sustainability Targets
& Targets – p 101-105
Sustainability Annex – Own Workforce – Actions – p 101-105
– Own workforce –Metrics & Targets - p 101-105
Sustainability Annex – Social – Own workforce –Metrics & Targets - p 101-105
Sustainability Annex – Social – Own workforce –Metrics & Targets - p 101-105
Sustainability Annex – Social – Own workforce –Metrics & Targets - p 101-105
Sustainability Annex – Social – Own workforce –Metrics & Targets - p 101-105
Sustainability Annex – Social – Own workforce –Metrics & Targets - p 101-105
Sustainability Annex – Social – Own workforce –Metrics & Targets - p 101-105
Sustainability Annex – Social – Own workforce –Metrics & Targets - p 101-105
Sustainability Annex – Social – Own workforce –Metrics & Targets - p 101-105
What’s Cooking? Annual report 2023 129
or workforce' representatives were
Sustainability Annex – Own Workforce – Metrics & Targets – p 101-105 47b Disclosure of
and how own workforce or workforce' representatives were
targets Sustainability Annex – Own Workforce – Metrics
own workforce
engaged directly in setting targets
whether
engaged directly in tracking performance against
employeesworkforce, and effectiveness of those actions 50a Characteristics of undertaking's employees - number of employees by gender [table] Sustainability Annex – Social – Own workforce –Metrics & Targets - p 101-105 50a Number of employees (head count) Sustainability Annex – Social
Sustainability Report Governance
50 d (i) Employees numbers are reported in head count or full-time equivalent
Annex – Social – Own workforce –Metrics & Targets - p 101-105 50 d (ii) Employees numbers are reported at end of reporting period/average/other methodology
Annex – Social – Own workforce –Metrics & Targets - p 101-105 50e Disclosure of contextual information necessary to understand data (employees) n.a.?
69 All employees are paid adequate wage, in line with applicable benchmarks Sustainability Annex – Social – Own workforceMetrics & Targets - p 101-105
70 Percentage of employees paid below the applicable adequate wage benchmark Sustainability Annex – Social – Own workforceMetrics & Targets - p 101-105
S1-14 Health and safety metrics
88 a Percentage of people in its own workforce who are covered by health and safety management system based on legal requirements and (or) recognised standards or guidelines
88b Number of fatalities in own workforce as result of work-related injuries and workrelated ill health
88b Number of fatalities as result of work-related injuries and work-related ill health of other workers working on undertaking's sites
88c Number of recordable work-related accidents for own workforce
88c Rate of recordable work-related accidents for own workforce
88d Number of cases of recordable work-related ill health of employees
Sustainability Annex – Social – Own workforceMetrics & Targets - p 101-105
Sustainability Annex – Social – Own workforceMetrics & Targets - p 101-105
Sustainability Annex – Social – Own workforceMetrics & Targets - p 101-105
Sustainability Annex – Social – Own workforceMetrics & Targets - p 101-105
Sustainability Annex – Social – Own workforceMetrics & Targets - p 101-105
Sustainability Annex – Social – Own workforceMetrics & Targets - p 101-105
What’s Cooking? Annual report 2023 130
S1-9 Diversity metrics 66a Number of employees (head count) at top management level Sustainability Annex – Social – Own workforceMetrics & Targets - p 101-105 66a Percentage of employees at top management level Sustainability Annex – Social – Own workforceMetrics & Targets - p 101-105 66b Number of employees (head count) under 30 years old Sustainability Annex – Social – Own workforceMetrics & Targets - p 101-105 66b Percentage of employees under 30 years old Sustainability Annex – Social – Own workforceMetrics & Targets - p 101-105 66b Number of employees (head count) between 30 and 50 years old Sustainability Annex – Social – Own workforceMetrics & Targets - p 101-105 66b Percentage of employees between 30 and 50 years old Sustainability Annex – Social – Own workforceMetrics & Targets - p 101-105 66b Number of employees (head count) over 50 years old Sustainability Annex – Social – Own workforceMetrics & Targets - p 101-105 66b Percentage of employees over 50 years old Sustainability Annex – Social – Own workforceMetrics & Targets - p 101-105 AR 71 Disclosure of own definition of top management used Sustainability Annex – Social – Own workforceMetrics & Targets - p 101-105
Sustainability
Sustainability
S1-10 Adequate wages
Report
Sustainability
Governance
103 d Disclosure of contextual information necessary to understand data and how data has been compiled (work-related grievances, incidents and complaints related to social and human rights matters)
What’s Cooking? Annual report 2023 131 88e Number of days lost to work-related injuries and fatalities from work-related accidents, work-related ill health and fatalities from ill health related to employees Sustainability Annex – Social – Own workforceMetrics & Targets - p 101-105 89 Number of cases of recordable work-related ill health of non-employees Sustainability Annex – Social – Own workforceMetrics & Targets - p 101-105 S1-16 Remuneration metrics (pay gap and total remuneration) 97 a Gender pay gap We cannot disclose this yet. 97 b Annual total remuneration ratio Sustainability Annex – Social – Own workforceMetrics & Targets - p 101-105 97 c Disclosure of contextual information necessary to understand data, how data has been compiled and other changes to underlying data that are to be considered Sustainability Annex – Social – Own workforceMetrics & Targets - p 101-105 S1-17 Incidents, complaints and severe human rights impacts 103 a Number of incidents of discrimination [table] Sustainability Annex – Social – Own workforceMetrics & Targets - p 101-105 103 a Number of incidents of discrimination Sustainability Annex – Social – Own workforceMetrics & Targets - p 101-105 103 b Number of complaints filed through channels for people in own workforce to raise concerns Sustainability Annex – Social – Own workforceMetrics & Targets - p 101-105 103 b Number of complaints filed to National Contact Points for OECD Multinational Enterprises Sustainability Annex – Social – Own workforceMetrics & Targets - p 101-105 103 c Amount of material fines, penalties, and compensation for damages as result of violations regarding social and human rights factors Sustainability Annex – Social – Own workforceMetrics & Targets - p 101-105 103 c Information about reconciliation of material fines, penalties, and compensation for damages as result of violations regarding social and human rights
factors with most relevant amount presented in financial statements Sustainability Annex – Social – Own workforceMetrics & Targets - p 101-105
Sustainability Annex – Social – Own workforceMetrics & Targets - p 101-105 104 a Number of severe human rights issues and incidents connected to own workforce Sustainability Annex – Social – Own workforceMetrics & Targets - p 101-105 104 a Number of severe human rights issues and incidents connected to own workforce that are cases of non respect of UN Guiding Principles and OECD Guidelines for Multinational Enterprises Sustainability Annex – Social – Own workforceMetrics & Targets - p 101-105 104 a No severe human rights issues and incidents connected to own workforce have occurred n.a. 104 b Amount of material fines, penalties, and compensation for severe human rights issues and incidents connected to own workforce Sustainability Annex – Social – Own workforceMetrics & Targets - p 101-105 104 b Information about reconciliation of amount of material fines, penalties, and compensation for severe human rights issues and incidents connected to own workforce with most relevant amount presented in financial statements Sustainability Annex – Social – Own workforceMetrics & Targets - p 101-105 General disclosures 14 a Description of types of employees and non-employees in its own workforce subject to material impacts All employees can be impacted. Sustainability Report Governance
14 b Material negative impacts occurrence (own workforce)
14 c Description of activities that result in positive impacts and types of employees and non-employees in its own workforce that are positively affected or could be positively affected
14 d Description of material risks and opportunities arising from impacts and dependencies on own workforce
14 e Description of material impacts on workers that may arise from transition plans for reducing negative impacts on environment and achieving greener and climateneutral operations
14 f (i) Information about type of operations at significant risk of incidents of forced labour or compulsory labour
14 f (ii) Information about countries or geographic areas with operations considered at significant risk of incidents of forced labour or compulsory labour
14 g (i) Information about type of operations at significant risk of incidents of child labour
14 g (ii) Information about countries or geographic areas with operations considered at significant risk of incidents of child labour
15 Disclosure of how understanding of people in its own workforce / value chain workers with particular characteristics, working in particular contexts, or undertaking particular activities may be at greater risk of harm has been developed
16 Disclosure of which of material risks and opportunities arising from impacts and dependencies on people in its own workforce relate to specific groups of people
Sustainability Annex – Social – Own workforceMetrics & Targets (Number of complaints filed through channels for people in own workforce to raise concerns + Recordable work-related injuries and ill health)
Sustainability Annex – Social – Own Workforce –Material IRO – p 101-105
Sustainability Annex – Social – Own Workforce –Material IRO – p 101-105
None expected at this point in time.
There is no significant risk of incidents of forced labour or compulsory labour in any of our sites.
There is no significant risk of incidents of forced labour or compulsory labour in any country where we operate in.
There is no significant risk of incidents of child labour in any of our sites
There is no significant risk of incidents of child labour in any country where we operate in.
Sustainability Annex – Social – Own Workforce –Material IRO – p 101-105
Sustainability Annex – Social – Own Workforce –Material IRO – p 101-105
17a Disclosure of general approach in relation to respect for human rights relevant to value chain workers
Annex – Social – Workers in the Value Chain – Policies – p 106
17b Disclosure of general approach in relation to engagement with value chain workers Sustainability Annex – Social – Workers in the Value Chain – Policies – p 106
17 c Disclosure of general approach in relation to measures to provide and (or) enable remedy for human rights impacts Sustainability Annex – Social – Workers in the Value Chain – Policies – p 106
18 Sustainability matters addressed by policy Sustainability Annex – Social – Workers in the Value Chain – Policies – p 106
19 Description of how policies are aligned with relevant internationally recognised instruments
What’s Cooking? Annual report 2023 132
–
in
S2-1
related to value chain workers
106 Sustainability
ESRS S2
Workers
the value chain
Policies
16 Policies to manage material impacts, risks and opportunities related to value chain workers [see ESRS 2 MDR-P] Help People Flourish – Protect Human Rights – Our Policies and Systems – p
Annex – Social – Workers in the Value Chain – Policies – p 106
17 Description of relevant human rights policy commitments relevant to value chain workers Sustainability Annex – Social – Workers in the Value Chain – Policies – p 106
Sustainability
Sustainability Report Governance
32
32 d Description of how effectiveness of actions or initiatives in delivering outcomes for value chain workers is tracked and assessed
Cannot disclose yet, work in progress
33 a Description of approach to identifying what action is needed and appropriate in response to particular actual or potential material negative impact on value chain workers Sustainability Annex – Social – Workers in the Value Chain – Policies – p 107-108
What’s Cooking? Annual report 2023 133 S2-2 Processes for engaging with value chain workers about impacts 22 Disclosure of how perspectives of value chain workers inform decisions or activities aimed at managing actual and potential impacts Procurement policy + action plan responsible sourcing 22 a Engagement occurs with value chain workers or their legitimate representatives directly, or with credible proxies Sustainability Annex – Social – Workers in the Value Chain – Policies – p 106 22 b Disclosure of stage at which engagement occurs, type of engagement and frequency of engagement Sustainability Annex – Social – Workers in the Value Chain – Policies – p 106 22 c Disclosure of function and most senior role within undertaking that has operational responsibility for ensuring that engagement happens and that results inform undertakings approach Sustainability Annex – Social – Workers in the Value Chain – Policies – p 106 22 d Disclosure of Global Framework Agreement or other agreements related to respect of human rights of workers Sustainability Annex – Social – Workers in the Value Chain – Policies – p 106 22 e Disclosure of how effectiveness of engagement with value chain workers is assessed Sustainability Annex – Social – Workers in the Value Chain – Policies – p 106 23 Disclosure of steps taken to gain insight into perspectives of value chain workers / consumers and end-users that may be particularly vulnerable to impacts and (or) marginalised Sustainability Annex – Social – Workers in the Value Chain – Policies – p 106 S2-3 Processes to remediate negative impacts and channels for value chain workers to raise concerns 27 a Disclosure of general approach to and processes for providing or contributing to remedy where undertaking has identified that it connected with a material negative impact on value chain workers Sustainability Annex – Social – Workers in the Value Chain – Policies – p 106 27 b Disclosure of specific channels in place for value chain workers to raise concerns or needs directly with undertaking and have them addressed Sustainability Annex – Social – Workers in the Value Chain – Policies – p 106 27 c Disclosure of processes through which undertaking supports or requires availability of channels Sustainability Annex – Social – Workers in the Value Chain – Policies – p 106 27 d Disclosure of how issues raised and addressed are tracked and monitored and how effectiveness of channels is ensured Sustainability Annex – Social – Workers in the Value Chain – Policies – p 106 28 Disclosure of how it is assessed that value chain workers are aware of and trust structures or processes as way to raise their concerns or needs and have them addressed Sustainability Annex – Social – Workers in the Value Chain – Policies – p 106
to value chain workers, and effectiveness of those actions
and
to manage its material impacts,
and
to value chain workers
People Flourish
human
–
change: Our sustainability
–
76
S2-4 Taking action on material impacts on value chain workers, and approaches to managing material risks and pursuing material opportunities related
MDR-A Action plans
resources
risks,
opportunities related
[see ESRS 2 - MDR-A] Help
- Respect
rights
Driving
actions
p
on value chain workers
human
–Driving change: Our sustainability
–
76
32 a Description of action planned or underway to prevent, mitigate or remediate material negative impacts
Help People Flourish - Respect
rights
actions
p
32 b Description of whether and how action to provide or enable remedy in relation to an actual material impact Sustainability Annex – Social – Workers in the Value Chain – Policies – p 107-108
n.a.
c Description of additional initiatives or processes with primary purpose of delivering positive impacts for value chain workers
Sustainability Report Governance
33 b Description of approach to taking action in relation to specific material impacts on value chain workers
33 c Description of approach to ensuring that processes to provide or enable remedy in event of material negative impacts on value chain workers are available and effective in their implementation and outcomes
34 a Description of what action is planned or underway to mitigate material risks arising from impacts and dependencies on value chain workers and how effectiveness is tracked
34 b Description of what action is planned or underway to pursue material opportunities in relation to value chain workers
35 Disclosure of how it is ensured that own practices do not cause or contribute to material negative impacts on value chain workers
36
Disclosure of severe human rights issues and incidents connected to upstream and downstream value chain
38 Disclosure of resources allocated to management of material impacts
AR 28 a Disclosure of general and specific approaches to addressing material negative impacts
AR 28 b Disclosure of initiatives aimed at contributing to additional material positive impacts
AR 28 c Disclosure of how far undertaking has progressed in efforts during reporting period
AR 28 d
AR 43
AR 44
Disclosure of aims for continued improvement
Information about measures taken to mitigate negative impacts on workers that arise from transition to greener, climate-neutral economy
Description of internal functions that are involved in managing impacts and types of action taken by internal functions to address negative and advance positive impacts
62 Disclosures to be reported if the undertaking has not adopted actions
Sustainability Annex – Social – Workers in the Value Chain – Policies – p 106
Sustainability Annex – Social – Workers in the Value Chain – Policies – p 106
Help People Flourish – Protect Human Rights
– Driving Change: Our Sustainability actions –EcoVadis p 76
Help People Flourish – Protect Human Rights
– Driving Change: Our Sustainability actions –EcoVadis p 76
Code of Conduct
EcoVadis 360 degrees watch tool + whistleblower alerts
Trusted people team (23), part of the whistleblower platform
Sustainability Annex – Social – Workers in the Value Chain – Policies – p 106
Help People Flourish – Protect Human Rights – Driving Change: Our Sustainability actions –EcoVadis p 76
Significant improvement, we introduced the tool in 2023
Zero complaints ambition
Not yet assessed.
Supplier engagement program (procurement department, sustainability manager) + Supplier CoC (General counsel)
n.a.
S2-5 Targets related to managing material negative impacts, advancing positive impacts, and managing material risks and opportunities
41 Targets set to manage material impacts, risks and opportunities related to value chain workers [see ESRS 2 - MDR-T]
42 a Disclosure of how value chain workers , their legitimate representatives or credible proxies were engaged directly in setting targets
42 b Disclosure of how value chain workers , their legitimate representatives or credible proxies were engaged directly in tracking performance against targets
42 c Disclosure of how value chain workers , their legitimate representatives or credible proxies were engaged directly in identifying lessons or improvements as result of undertaking’s performance
11 All value chain workers who can be materially impacted by undertaking are included in scope of disclosure under ESRS 2
Help People Flourish - Respect human rights – Our sustainability targets – p 76
They were not engaged in setting targets, but we did a peer review and streamlined with value chain partners + chose for an engagement tool that was already used by highest % of suppliers
They can see this in our annual report
Help People Flourish - Respect human rights –Driving Change : Our sustainability actions – p 76
To begin with, we focus on our direct meat, ingredient and packaging suppliers, because they are most material.
What’s Cooking? Annual report 2023 134
Sustainability Report Governance
What’s Cooking? Annual report 2023 135 11 a) Description of types of value chain workers subject to material impacts To begin with, we focus on our direct meat, ingredient and packaging suppliers, because they are most material. 11 a i)-v) Type of value chain workers subject to material impacts by own operations or through value chain To begin with, we focus on our direct meat, ingredient and packaging suppliers, because they are most material. 11 b Disclosure of geographies or commodities for which there is significant risk of child labour, or of forced or compulsory labour, among workers in undertaking’s value chain Work in progress to map this 11 c Material negative impacts occurrence (value chain workers ) No alerts 11 d Description of activities that result in positive impacts and types of value chain workers that are positively affected or could be positively affected Sustainability Annex – Social – Workers in the Value Chain – Material IRO – p 106 11 e Description of material risks and opportunities arising from impacts and dependencies on value chain workers Sustainability Annex – Social – Workers in the Value Chain – Material IRO – p 106 12 Disclosure of whether and how the undertaking has developed an understanding of how workers with particular characteristics, those working in particular contexts, or those undertaking particular activities may be at greater risk of harm. Help People Flourish – Protect Human Rights – Driving Change: Our Sustainability Actions –Ecovadis assessment – p 76 13 Disclosure of which of material risks and opportunities arising from impacts and dependencies on value chain workers are impacts on specific groups Cannot disclose this yet ESRS S4 – Consumers and End-users S4-1 Policies related to consumers and end-users 15 Policies to manage material impacts, risks and opportunities related to consumers and end-users [see ESRS 2 MDR-P] Good Food for All – Promote Enhanced Nutrition –Our Policies and Systems on p 58-89 Good Food for All – Grow portfolio plant-based products – Our Policies and Systems on p 59 16 Description of relevant human rights policy commitments relevant to consumers and/or end-users None at this point in time. 16 a Disclosure of general approach in relation to respect for human rights of consumers and end-users None at this point in time. 16 b Disclosure of general approach in relation to engagement with consumers and/or end-users Sustainability Annex – Social – Consumers and End-users – Actions – p 107-108 16 c Disclosure of general approach in relation to measures to provide and (or) enable remedy for human rights impacts Sustainability Annex – Social – Consumers and end-users – Policies – Whistleblowing policy –p 107-108 17 Description of how policies are aligned with relevant internationally recognised instruments GFSI 62 Disclosures to be reported in case the undertaking has not adopted policies n.a. S4-2 Processes for engaging with consumers and end-users about impacts 20 Disclosure of how perspectives of consumers and end-users inform decisions or activities aimed at managing actual and potential impacts Sustainability Annex – Social – Consumers and End-users – Actions – p 107-108 20 a Engagement occurs with consumers and end-users or their legitimate representatives directly, or with credible proxies 20 b Disclosure of stage at which engagement occurs, type of engagement and frequency of engagement Sustainability Report Governance
20 c Disclosure of function and most senior role within undertaking that has operational responsibility for ensuring that engagement happens and that results inform undertakings approach
20 d Disclosure of how effectiveness of engagement with consumers and end-users is assessed
21 Disclosure of steps taken to gain insight into perspectives of consumers and endusers / consumers and end-users that may be particularly vulnerable to impacts and (or) marginalised
Food Safety – Chief Operating Officer
Nutritious products and product innovation –Chief Research & Innovation Officer
Repeat purchase of our products
Panels by independent consultants
S4-3 Processes to remediate negative impacts and channels for consumers and end-users to raise concerns
25 a Disclosure of general approach to and processes for providing or contributing to remedy where undertaking has identified that it connected with a material negative impact on consumers and end-users
25 b Disclosure of specific channels in place for consumers and end-users to raise concerns or needs directly with undertaking and have them addressed
25 c Disclosure of processes through which undertaking supports or requires availability of channels
25 d Disclosure of how issues raised and addressed are tracked and monitored and how effectiveness of channels is ensured
26 Disclosure of how it is assessed that consumers and end-users are aware of and trust structures or processes as way to raise their concerns or needs and have them addressed
Sustainability Annex – Social – Consumers and endusers – Policies – Whistleblowing policy – p 107-108
Sustainability Annex – Social – Consumers and endusers – Policies – Whistleblowing policy – p 107-108
Sustainability Annex – Social – Consumers and endusers – Policies – Whistleblowing policy – p 107-108
Sustainability Annex – Social – Consumers and endusers – Policies – Whistleblowing policy – p 107-108
Publicly available on easy to access page on website
S4-4 Taking action on material impacts on consumers and end-users, and approaches to managing material risks and pursuing material opportunities related to consumers and end-users, and effectiveness of those actions
Action plans and resources to manage its material impacts, risks, and opportunities related to consumers and end-users [see ESRS 2 - MDR-A]
Good Food for All – Ensure Consumer Wellbeing –Driving Change: Our Sustainability Actions – p 98
Good Food for All – Promote Enhanced Nutrition–
Driving Change: Our Sustainability Actions – p 58-59
31 a Description of action planned or underway to prevent, mitigate or remediate material negative impacts on consumers and end-users
31 b description of action to provide or enable remedy in relation to an actual material impact
31 c Description of additional initiatives or processes with primary purpose of delivering positive impacts for consumers and end-users
31 d Description of how effectiveness of actions or initiatives in delivering outcomes for consumers and end-users is tracked and assessed
32 a Description of approach to identifying what action is needed and appropriate in response to particular actual or potential material negative impact on consumers and end-users
32 b Description of approach to taking action in relation to specific material impacts on consumers and end-users
32 c Description of approach to ensuring that processes to provide or enable remedy in event of material negative impacts on consumers and end-users are available and effective in their implementation and outcomes
33 a Description of what action is planned or underway to mitigate material risks arising from impacts and dependencies on consumers and end-users and how effectiveness is tracked
Good Food for All – Ensure Consumer Wellbeing –Driving Change: Our Sustainability Actions – p 58
Good Food for All – Promote Enhanced Nutrition–
Driving Change: Our Sustainability Actions – p 58-59
Sustainability Annex – Social – Consumers and endusers – Policies – Whistleblowing policy – p 107-108
n.a.
n.a.
Good Food for All – Ensure Consumer Wellbeing –Our Policies and systems – p 58
Driven by national legislation on food safety
Sustainability Annex – Social – Consumers and end-users – Policies – Whistleblowing policy –p 107-108
Sustainability Annex – Consumers and end users – Material IRO – p 107-108
What’s Cooking? Annual report 2023 136
Report Governance
Sustainability
What’s Cooking? Annual report 2023 137 33 b Description of what action is planned or underway to pursue material opportunities in relation to consumers and end-users Sustainability Annex – Consumers and end users – Actions – p 107-108 34 Disclosure of how it is ensured that own practices do not cause or contribute to material negative impacts on consumers and end-users Food Safety Standards (GFSI) 35 Disclosure of severe human rights issues and incidents connected to upstream and downstream value chain Sustainability Annex – Social – Consumers and endusers – Policies – Whistleblowing policy – p 107-108 37 Disclosure of resources allocated to management of material impacts Quality department (food safety) R&I dept (nutritious products) AR 25 a Disclosure of general and specific approaches to addressing material negative impacts Aligned with national regulatory bodies AR 25 b Disclosure of initiatives aimed at contributing to additional material positive impacts Good Food for All – Promote Enhanced Nutrition–Driving Change: Our Sustainability Actions – p 58-59 AR 25 c Disclosure of how far undertaking has progressed in efforts during reporting period Overview of strategic metrics & targets – p 79 AR 25 d Disclosure of aims for continued improvement Good Food for All – Promote Enhanced Nutrition–Driving Change: Our Sustainability Actions – p 58-59 Good Food for All – Ensure Consumer Wellbeing –Driving Change: Our Sustainability Actions – p 58 S4-5 Targets related to managing material negative impacts, advancing positive impacts, and managing material risks and opportunities 41 Targets set to manage material impacts, risks and opportunities related to consumers and end-users [see ESRS 2 - MDR-T] Good Food for All – Ensure Consumer Wellbeing –: Our Sustainability Targets – p 107-108 Good Food for All – Promote Enhanced Nutrition–Our Sustainability Targets – p 58-59 41 Disclosure of process for setting time-bound and outcome-oriented targets Good Food for All – Ensure Consumer Wellbeing –: Our Sustainability Targets – p 107-108 Good Food for All – Promote Enhanced Nutrition–Our Sustainability Targets – p 58-59 41 a Disclosure of how consumers and end-users were engaged directly in setting targets Not engaged 41 b Disclosure of how consumers and end-users were engaged directly in tracking performance against targets [text block] Not engaged 41 c Disclosure of how consumers and end-users were engaged directly in identifying lessons or improvements as result of undertaking’s performance Not engaged
42
Ensure
Not
applicable ESRS 2 – General disclosures 10 All consumers and end-users who can be materially impacted by undertaking are included in scope of disclosure under ESRS 2 Yes 10 a i)-v) Type of consumers and end-users subject to material impacts by own operations or through value chain Value Chain & Stakeholder Engagement – p 54-57 10 b Material negative impacts occurrence (consumers and end-users ) No direct to consumer sales yet Sustainability Report Governance
AR
a Disclosure of intended outcomes to be achieved in lives of consumers and end-users
consumer wellbeing – Why is this important to us? Promote enhanced nutrition- Why is this important to us? AR 42 b Information about stability over time of target in terms of definitions and methodologies to enable comparability Not yet applicable AR 42 c Disclosure of references to standards or commitments on which target is based
yet
Governance
10 c Description of activities that result in positive impacts and types of consumers and end-users that are positively affected or could be positively affected
10 d Description of material risks and opportunities arising from impacts and dependencies on consumers and end-users
11 Disclosure of how understanding of how own workers / consumers and end-users with particular characteristics, working in particular contexts, or undertaking particular activities may be at greater risk of harm has been developed
12 Disclosure of which of material risks and opportunities arising from impacts and dependencies on consumers and end-users are impacts on specific groups
ESRS G1 – Business Conduct
G1-1 Business conduct policies and corporate culture
10a Description of the mechanisms for identifying, reporting and investigating concerns about unlawful behaviour or behaviour in contradiction of its code of conduct or similar internal rules
10 b No policies on anti-corruption or anti-bribery consistent with United Nations Convention against Corruption are in place
10 c Disclosure of safeguards for reporting irregularities including whistleblowing protection
10 d No policies on protection of whistle-blowers are in place
10 d Timetable for implementation of policies on protection of whistle-blowers
10 e Undertaking is committed to investigate business conduct incidents promptly, independently and objectively
10 f Policies with respect to animal welfare are in place
10 g Information about policy for training within organisation on business conduct
10 h Disclosure of the functions that are most at risk in respect of corruption and bribery
G1-2 Management of relationships with suppliers
14 Description of policy to prevent late payments, especially to SMEs
15 a Description of approaches in regard to relationships with suppliers, taking account risks related to supply chain and impacts on sustainability matters
15 b Disclosure of how social and environmental criteria are taken into account for selection of supply-side contractual partners
G1-3 Prevention and detection of corruption and bribery
18 a Information about procedures in place to prevent, detect, and address allegations or incidents of corruption or bribery
18 b Investigators or investigating committee are separate from chain of management involved in prevention and detection of corruption or bribery
18 c Information about process to report outcomes to administrative, management and supervisory bodies
Good Food for All – Promote Enhanced Nutrition–Driving Change: Our Sustainability Actions – p 58-59
Good Food for All – Ensure Consumer Wellbeing –Driving Change: Our Sustainability Actions – p 58
Sustainability Annex – Consumers and end users
– Material IRO - p 107-108
n.a.
n.a.
Sustainability Annex – Governance – Business Conduct – Policies – Whistleblowing policy - p 109
n.a., because consistent
Sustainability Annex – Governance – Business Conduct – Policies – Whistleblowing policy - p 109
n.a.
n.a.
Sustainability Annex – Governance – Business Conduct – Policies – Whistleblowing policy - p 109
Source Responsibly – Our Policies and Systems –Part of our Supplier CoC and Procurement Policy
Sustainability Annex – Business Conduct – Our Sustainability Targets – p 109
White collar workers
System-embedded payment terms/AP automation system
Sustainability Annex – Business Conduct –Actions – p 109
Sustainability Annex – Business Conduct –Actions – p 109
Sustainability Annex – Governance – Business Conduct – Policies – Whistleblowing policy - p 109
Yes, internal audit function and general legal counsel or outside counsel
Audit committee
What’s Cooking? Annual report 2023 138
Sustainability Report
What’s Cooking? Annual report 2023 139 20 Information about how policies are communicated to those for whom they are relevant (prevention and detection of corruption or bribery) Training 21 a Information about nature, scope and depth of anti-corruption or anti-bribery training programmes offered or required Nature: Face to face and online training Scope: all employees Depth: video recording, training materials, posters 21 b Percentage of functions-at-risk covered by training programmes Sustainability Annex – Governance -Business Conduct – Metrics & Targets – p 109 21 c Information about members of administrative, supervisory and management bodies relating to anti-corruption or anti-bribery training Training received G1-4 Incidents of corruption or bribery 24 a Number of convictions for violation of anti-corruption and anti- bribery laws Sustainability Annex – Governance -Business Conduct – Metrics & Targets – p 109 24 a Amount of fines for violation of anti-corruption and anti- bribery laws Sustainability Annex – Governance -Business Conduct – Metrics & Targets – p 109 25 a Number of confirmed incidents of corruption or bribery Sustainability Annex – Governance -Business Conduct – Metrics & Targets – p 109 29 a Information about representative(s) responsible in administrative, management and supervisory bodies for oversight of political influence and lobbying activities General counsel and CEO 29 b Information about financial or in-kind political contributions Sustainability Annex – Governance -Business Conduct – Metrics & Targets – p 109 29 b i Financial and In-kind political contributions made Sustainability Annex – Governance -Business Conduct – Metrics & Targets – p 109 29 b (ii) Disclosure of how monetary value of in-kind contributions is estimated n.a. 29 c Disclosure of main topics covered by lobbying activities and undertaking's main positions on these topics Only through associations in general interest of the industry 29 d Undertaking is registered in EU Transparency Register or in equivalent transparency register in Member State Not applicable 30 Information about appointment of any members of administrative, management and supervisory bodies who held comparable position in public administration in two years preceding such appointment Not the case G1-6 Payment practices 33 a Average number of days to pay invoice from date when contractual or statutory term of payment starts to be calculated Sustainability Annex – Governance -Business Conduct – Metrics & Targets – p 109 33 b Description of undertakings standard payment terms in number of days by main category of suppliers Standard 60 days for all, except where national standards deviate 33 b Percentage of payments aligned with standard payment terms Sustainability Annex – Governance -Business Conduct – Metrics & Targets – p 109 33 c Number of outstanding legal proceedings for late payments Sustainability Annex – Governance -Business Conduct – Metrics & Targets – p 109 33 d Disclosure of contextual information regarding payment practices Sustainability Annex – Governance -Business Conduct – Metrics & Targets – p 109 5a Disclosure of role of administrative, management and supervisory bodies related to business conduct Excom and board members 5 b Disclosure of expertise of administrative, management and supervisory bodies on business conduct matters Trained on CoC Sustainability Report Governance
corporate governance
What’s Cooking? Annual report 2023 140
Declaration on corporate governance over 2023
The corporate governance statement has been prepared in accordance with Article 3:6, §2 and Article 3:32 of the WVV and the Belgian Corporate Governance Code 2020. It contains information on the corporate governance policy of What’s Cooking Group NV in 2023, including:
a description of the main features of the internal control and risk management systems in the financial reporting process;
• the required information based on special legislation;
• the composition and functioning of the board of directors and its committees;
a description of the diversity policy with regard to the members of the board of directors, the persons in charge of the management and the persons in charge of the daily management of the company;
• the remuneration report; a statement of non-financial information.
The reference code used is the Belgian Corporate Governance Code 2020. This code is publicly available at www.corporategovernancecommittee.be.
Our Corporate Governance Charter is published at www.whatscooking. group. In the charter, we clarify our position towards the provisions of the Belgian Corporate Governance Code 2020. We also describe there the other Corporate Governance practices we apply, in addition to the Belgian Corporate Governance Code 2020. The charter did not undergo any material changes in 2023 with the exception of the installation of a sustainability committee. The statutes of What’s Cooking Group NV were, however, amended in 2023 to reflect the name change.
What’s Cooking Group NV follows the 10 principles of the Belgian Corporate Governance Code 2020, with the exception of the following recommendations (which have not yet been implemented in 2023):
• Recommendation 7.6: For the time being, the board of directors has decided not to pay share-related remuneration to its non-executive members.
• Recommendation 7.9: As no share-related compensation is granted to executive management members, no minimum threshold of shares to be held by executive management members was also determined.
What’s Cooking Group NV does not provide remuneration in the form of shares. This applies to both non-executive directors and members of the executive management. Given the limited nature of the remuneration and the limited liquidity of the share, the board of directors does not consider it opportune at this time to incur the cost of setting up a share plan. Should a share plan be considered in the future, the board of directors will also consider a lock-up of the shares for a sufficiently long period.
Recommendation 7.12: The recovery of paid variable remuneration or the withholding of variable remuneration.
Given the limited remuneration as well as the fact that payment of variable remuneration is only made after the full completion of the audit of the financial figures and internal controls, the board of directors decided not to introduce a claw-back clause to date.
Corporate governance What’s Cooking? Annual report 2023 141
Board of Directors
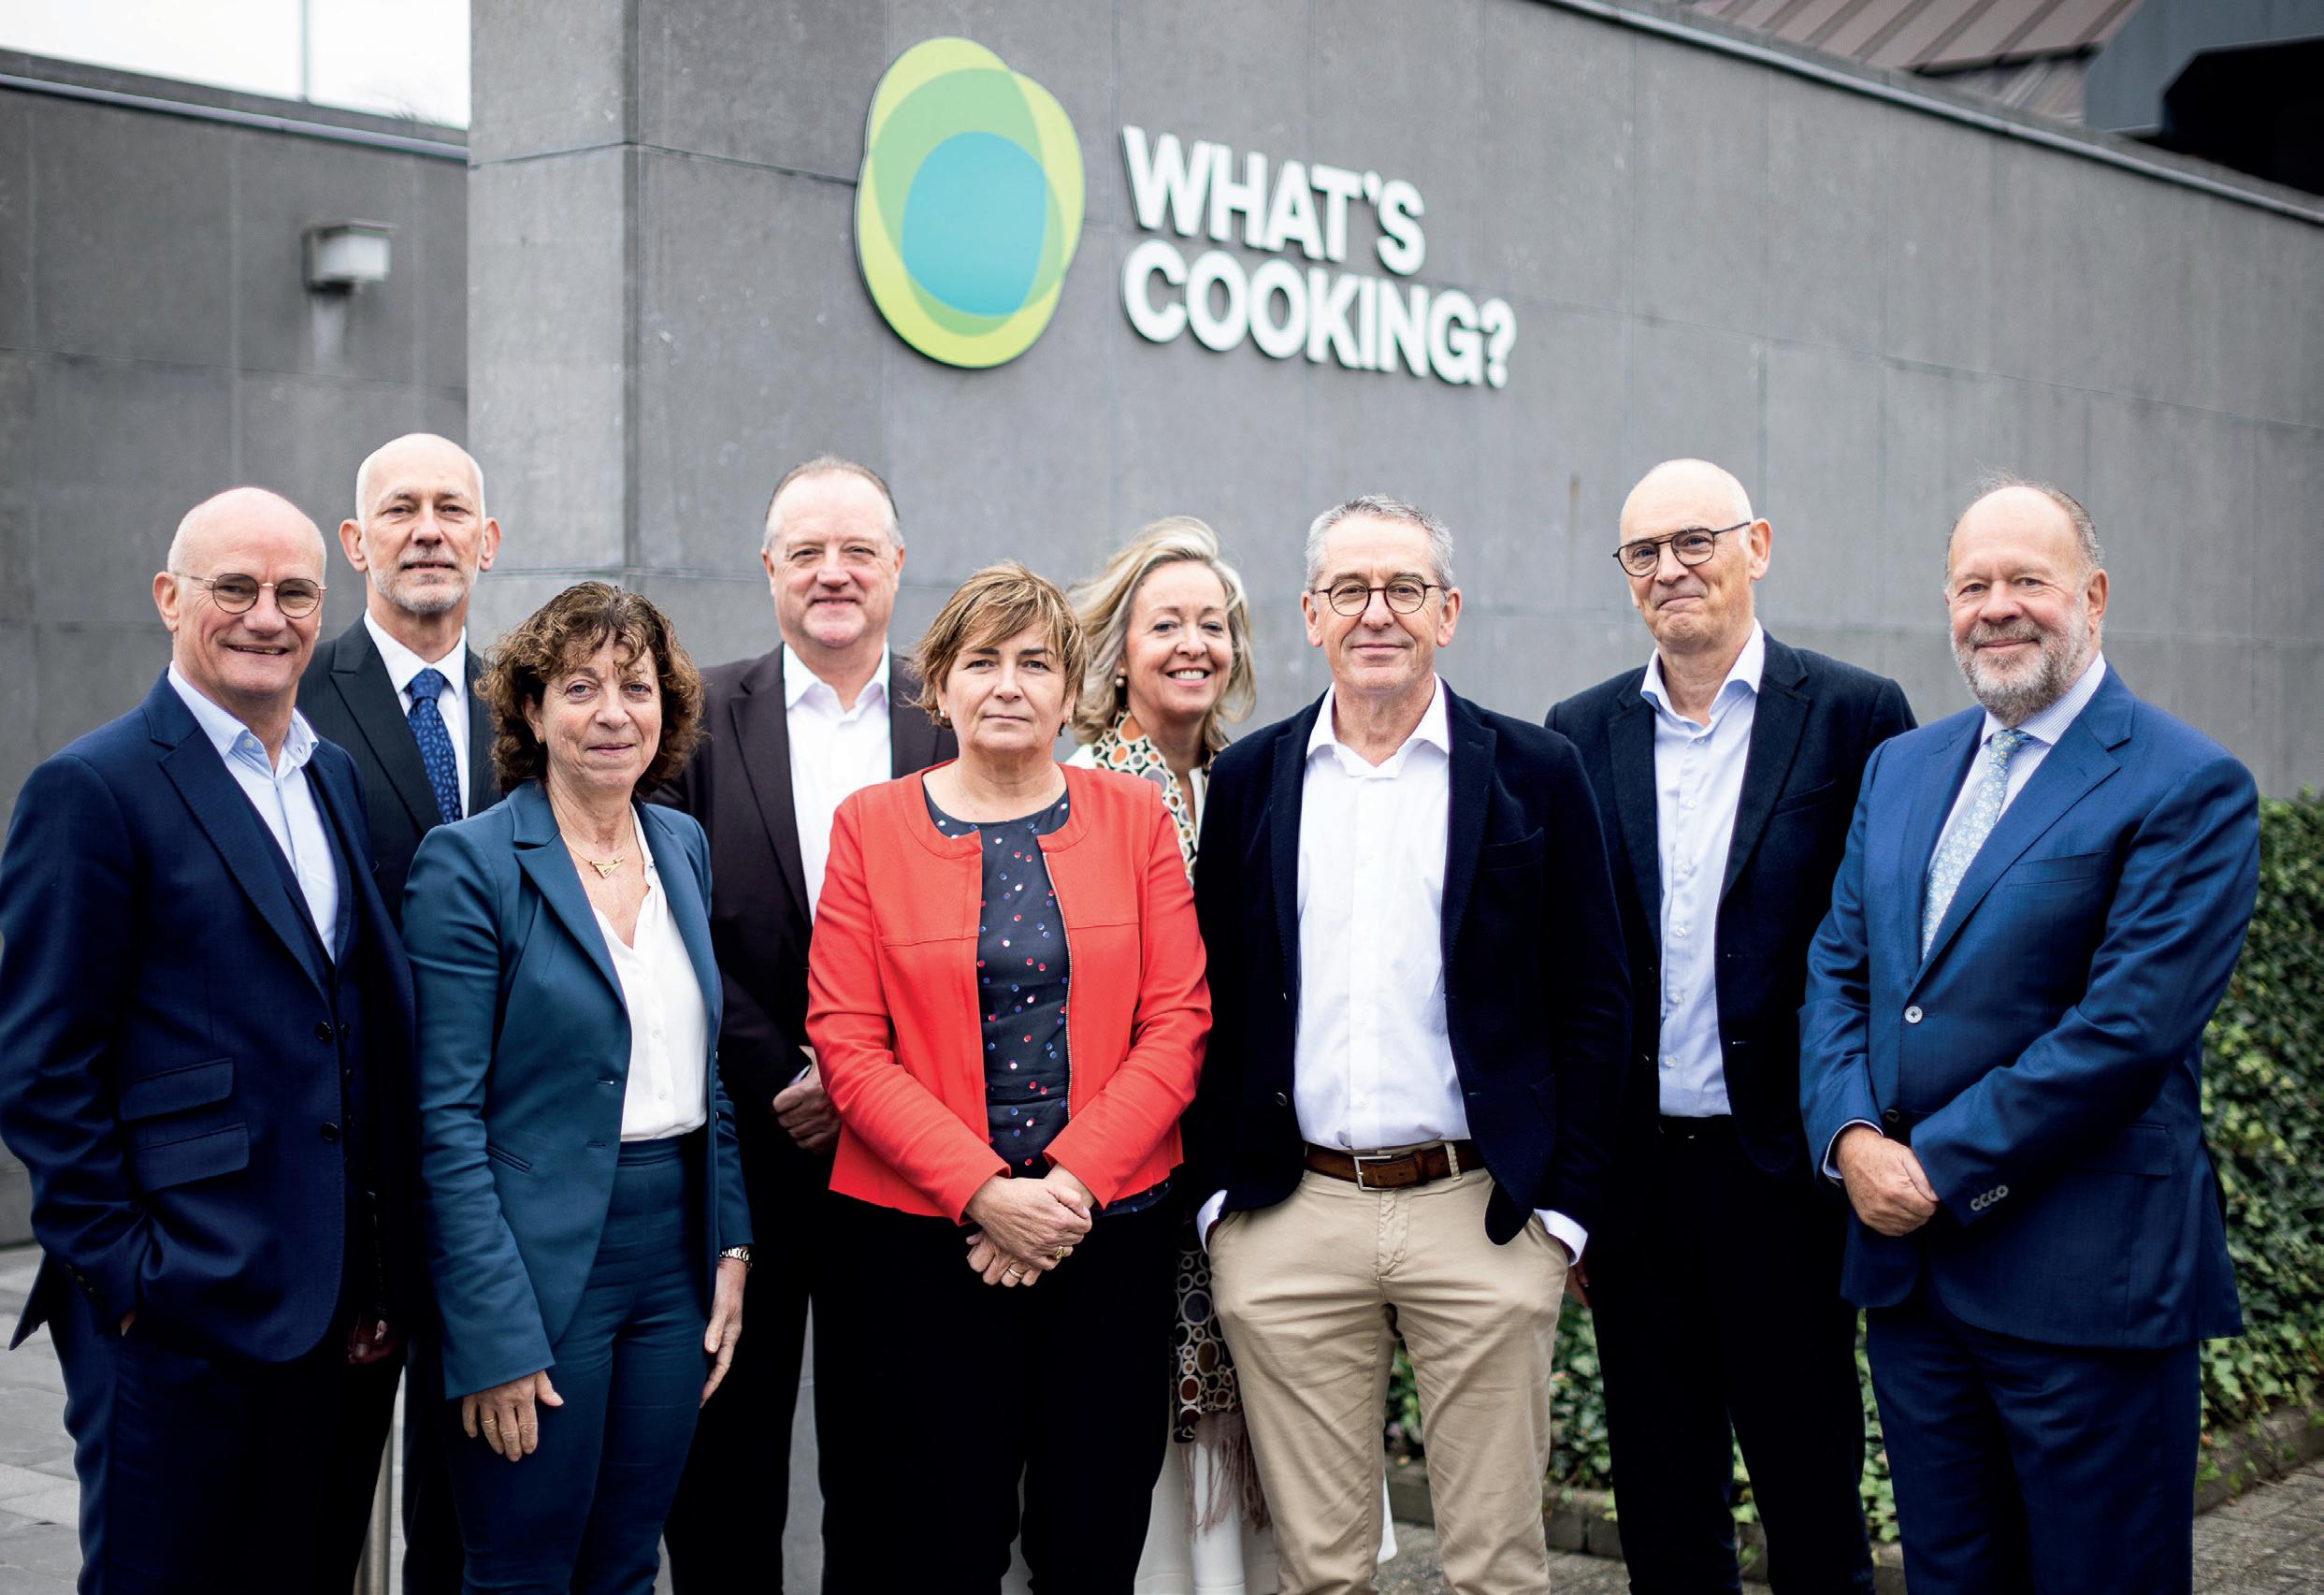

PAUL VAN OYEN (°1961)
PVO Advisory bv
Paul Van Oyen obtained a master’s degree in geology and mineralogy and then took a management course at KU Leuven. After a period as a lecturer and several years of fieldwork in Morocco, he worked as a researcher on a European study on strategic raw materials. Paul started his industrial career at what is now Steinzeug Keramo. In 1990, he moved to Etex Group, where he held various positions for 31 years. After seven years as CEO of the company, Paul decided to share his experience as an independent board member. In 2022, he was appointed director and chairman of the board of directors of What’s Cooking Group nv for four years. He is also a member of our renumeration and nomination committee and has chaired the sustainability committee since 2023.

FRANK COOPMAN (°1965)
Holbigenetics nv
Frank Coopman graduated as a veterinarian in 1990. He obtained additional masters in veterinary supervision of edibles of animal origin and in molecular medical biotechnology. He obtained a PhD in veterinary sciences and was a long-term lecturer in animal production and genetics at HoGent and Ugent. Frank is co-founder and managing director of Biomics and Chemics Consultancy BV, where he is rolling out the biological and genetic part. In 2020, he was appointed director of What’s Cooking Group nv for four years. Since 2023, he has been a member of our remuneration and nomination committee.
What’s Cooking? Annual report 2023 142
Corporate governance

DOMINIQUE COOPMAN (°1967)
Famcoo Invest nv
Dominique Coopman graduated as an agricultural and business engineer. She also holds a degree in environmental remediation and a master’s degree in food culture. Dominique works as a freelance consultant in Italy and has been a director at What’s Cooking Group nv since 2008. Her last reappointment dates from 2022, when she renewed her mandate for four years. In addition, Dominique has been a member of our sustainability committee since 2023.


EDDY VAN DER PLUYM (°1957)
Eddy Van Der Pluym studied economic sciences and an MBA at INSEAD. After a short period at Deloitte, Haskins & Sells, he joined the family company Pluma nv, which merged with What’s Cooking Group nv in 2006. In 2019, Eddy was appointed as a director for four years, renewing his mandate in May 2023. In 2023, he also became a member of our audit committee.
PIET SANDERS (°1966)
CEO - Leading for Growth bv
Piet Sanders holds a master’s degree in law and management. Almost 30 years of his career were spent in the food sector. Between 1999 and 2002, Piet was Global Sales Director Food at Amylum / Tate & Lyle, a leading producer of starches, cereal-based sweeteners, and wheat proteins. After two years as Chief Sales & Marketing Officer at Reynaers Aluminium, he returned to the food sector in 2004. He joined Puratos, an international group providing innovative ingredients and services to the bakery, patisserie and chocolate sectors. He started there as Managing Director for Central and Eastern Europe, and subsequently became Managing Director for Asia & for Northern and Eastern Europe, and Global Sales & Channels Director, among others. In 2021, Piet became CEO of What’s Cooking Group nv. A year later, he was appointed director for a four-year term. Piet has also been a supervisory director of Cefetra B.V. , a Dutch feed & food ingredients company, since 2022.

ANN VEREECKE (°1963)
Ann Vereecke bv
Ann Vereecke is a civil engineer and PhD in management. She is professor of operations & supply chain management at Vlerick Business School and Ghent University. She was also a board member and president of EurOMA (European Operations Management Association) and board member of POMS (Production and Operations Management Society in the US) for a time. Currently, Ann sits on the boards of Tessenderlo Group, North Sea Port and BPost. In 2014, she joined the board of What’s Cooking Group nv as an independent director. Ann also chairs the remuneration and nomination committee and she became a member of our sustainability committee in 2023. At the general meeting in May 2022, her mandate as an independent director was extended for another four years.

AART DUIJZER (°1963)
IJzer Beheer bv
Aart Duijzer studied at Erasmus University. After studying Business Economics, he completed the Chartered Accountant course there. During the first years of his career, Aart worked at KPMG. He acquired the knowledge and experience in various positions at home and abroad, in particular managerial and financial-economic knowledge and has experience from 2000 to 2022 as CFO at the Dutch Group Refresco which was listed on th,e stock exchange until 2018. Mr Duijzer is a member of the Supervisory Boards of Koninklijke Sanders, Koninklijke Barenbrug and Sligro Food Group. Aart has been a director of What’s Cooking Group nv and chairman of our audit committee since April 2023.

KURT COFFYN (°1968)
C:Solutio bv
Kurt Coffyn graduated as an industrial engineer with specialisation in automation and electronics. He has 30 years of experience in operations and supply chain: first in various operational positions by General Electric in Belgium and Germany, then as COO at firms such as Stanley Black&Decker, Ontex, Provimi, Cargill and Unilabs Switzerland. Since 2019, Kurt has been COO of Belgium’s Lineas, European leader in private rail freight transport. Kurt has been an independent director at What’s Cooking Group nv since 2017 and is also a member of our audit committee.

INGE PLOCHAET (°1968)
Tower Consulting bv
Inge Plochaet holds a master’s degree in industrial sciences (chemistry), studied innovation management at IMD, and obtained an in-company MBA at INSEAD & Wharton. Inge started her career at Procter & Gamble as a packaging engineer and today has 26 years of operational experience. Until 2015, she held various positions at AB InBevfrom Innovation Director Western Europe to President of AB Inbev UK & Ireland. Today, she helps companies with strategic and operational advice. She is also chairman of the board of directors of B-Steel bv and VBSC nv and a director of Groven+ nv, CSM nv, Colmar nv, Sligro Food Group nv and the Faber Group nv. Inge has held a four-year term as an independent director of What’s Cooking Group nv since 2020 and she became a member of the sustainability committee in 2023.

JOHAN PAUWELS (°1959)
Hico nv
Johan Pauwels trained as an Industrial Engineer complemented by business administration (Vlerick, INSEAD, IMD).
He has a long career at ABB where he was active in various global and local functions, regions and divisions. The common thread of his career is on increasing productivity through industrial automation and sustainably improving energy efficiency through electrification. From 2017 tem 2023, he was managing director of ABB’s Benelux companies. From 2023, he was active, ad interim, as General Manager of the ‘Global Solution Centre for Autonomous Mobile Robots’, ABB Robotics in Burgos, Spain.
Johan is a director of What’s Cooking Group nv and a member of our audit committee since May 2023.
What’s Cooking? Annual report 2023 143
Corporate governance

What’s Cooking? Annual report 2023 144
Composition and functioning of the board of directors and its committees
Board of directors
The table below shows the composition of the board of directors on 31 December 2023, listing meetings and attendance in 2023.
As permanent representative for:
(1) BV Ann Vereecke, (2) BV Deemanco (end of mandate 20 April 2023), (3) NV Holbigenetics, (4) BV C:Solutio, (5) BV Tower Consulting, (6) BV Leading for Growth, (7) NV Famcoo Invest, (8) BV PVO Advisory, (9) BV IJzer Beheer (as of 20 april 2023), (10) NV Hico (as of 25 May 2023)
E = Executive
NE = Non-executive
I = Independent
AC = Audit Committee
RNC = Remuneration and Nomination Committee
SC = Sustainability Committee
To the extent necessary, What’s Cooking Group NV confirms its compliance with recommendation 5.5 of the Belgian Corporate Governance Code 2020, which stipulates that non-executive directors should not hold more than five directorships in listed companies.
The Board of Directors’ internal regulations describe the detailed functioning of the Board of Directors. The terms of reference are an integral part of the group’s Corporate Governance Charter.
Among other things, the board of directors decided on the group’s half-year results, annual results, budget and strategy.
Corporate governance What’s Cooking? Annual report 2023 145
Name Type* End of mandate Committees** Meetings 2023 (x = present) 16/02 20/04 25/05 24/08 2/10 23/11 12/12 Dominique Coopman (7) NE 2026 SC X X X X X X X Frank Coopman (3) NE 2024 RNC X X X X X X X Eddy Van Der Pluym NE 2027 AC X X X X X X X Paul Van Oyen (8) I 2026 RNC/SC X X X X X X X Ann Vereecke (1) I 2026 RNC/SC X X X X X X X Dominique Eeman (2) I 2023 AC -Kurt Coffyn (4) I 2024 AC X X X X X X X Inge Plochaet (5) I 2024 SC X X X X X X X Piet Sanders (6) E 2026 X X X X X X X Aart Duijzer (9) I 2027 AC X X X X X Johan Pauwels (10) NE 2027 AC X X X X X
* **
Diversity
Overall, we continue to build a diverse and inclusive environment across the organisation, encouraging non-discriminatory working practices. We have taken clear steps to engage our leadership teams on what it takes to be sustainable leaders, including recognising the important role equality and wellbeing plays in our organisation. We have taken a number of concrete steps both internally and externally towards corporate responsibility and continuous positive change in that regard.
As regards persons in charge of management viz. the members of the ExCom, and persons in charge of the daily management of the company we take into account the necessary complementarity of skills, experience, knowledge and diversity.
In the composition of the board of directors, following advice from the remuneration committee, we take into account the necessary complementarity of skills, experience, knowledge and diversity - including on the basis of gender in accordance with the provisions for listed companies. The Board of Directors complies with these gender provisions i.e. at least onethird of the members of the Board of Directors are of a different gender than the other members (whereby the required minimum number is rounded off to the nearest whole number). See also Article 1.2 of the internal regulations (see Annex 1 to the Corporate Governance Charter). The review of board members shows that we was met as of 31 December 2023.
Evaluation
The chairman of the board regularly organises a formal evaluation of the board and its functioning, including its interaction with executive management. The results of this evaluation are discussed in the board and, if necessary, improvement actions are prepared. A formal evaluation was completed (with the help of a consultant) in 2022 and will be carried out again in early 2024, based on a previous similar exercise for 2023.
Appointments/reappointments in 2024
The board plans to ask the general meeting on 30 May 2024:
• To reappoint NV Holbigenetics as a director for a period of 4 years, expiring immediately after the 2028 annual general meeting. NV Holbigenetics will appoint Frank Coopman as its permanent representative.
• To BV C:Solutio, to be reappointed as an independent director for a period of 4 years, expiring immediately after the ordinary general meeting in 2028. BV C:Solutio will appoint Kurt Coffyn as permanent representative.
To reappoint BV Tower Consulting as an independent director for a period of 4 years, expiring immediately after the ordinary general meeting of 2028. BV Tower Consulting will appoint Inge Plochaet as permanent representative.
Committees within the board of directors
The board of directors had three active committees in 2023: the audit committee, the remuneration and nomination committee and the sustainability committee. The committees are composed in accordance with legislation and the requirements of the Belgian Corporate Governance Code 2020.
The committees work within a mandate from the board of directors. A description of that mandate can be found in the detailed regulations annexed to the Corporate Governance Charter.
Audit committee
The table below shows the composition of the audit committee as at 31 December 2023, with a summary of meetings and attendance in 2023.
BV Deemanco (Dominique Eeman)
Paul Van Oyen (2) X
BV C:Solutio (Kurt Coffyn) (3) X
Eddy Van der Pluym X
IJzer Beheer BV (Aart Duijzer) (4)
Hico NV (Johan Pauwels) (5)
(1) Chair (end of mandate 20 April 2023)
(2) Chair ad interim on 13 February 2023
(3) Chair ad interim on 20 April 2023
(4) Chair (start of mandate 20 april 2023)
(5) Start of mandate 25 May 2023
All members of the audit committee are non-executive directors and have in-depth knowledge of financial management. The majority of the committee members are independent. The committee has the necessary collective expertise relating to the company’s activities.
The committee met regularly in the presence of the auditor and always in the presence of the internal auditor.
The audit committee advised the board on, among other things:
• the 2022 annual results
• the 2023 half-year results internal control
the group’s risk management
• the internal and external audit
• the independence and remuneration of the auditor and companies associated with the auditor
The audit committee monitors the internal audit function it has established. It regularly reviews its own regulations and operation.
Corporate governance 146 What’s Cooking? Annual report 2023
Name Meetings 2023 (x = present) 13/02 20/04 25/05 24/08 23/11
(1) - -
X X X X
X X X X
X X X
X X X
Remuneration and appointments committee
The table below shows the composition of the remuneration and nomination committee on 31 December 2023, with a summary of meetings and attendance in 2023.
Sustainability Committee
The table below shows the composition of the sustainability committee on 31 December 2023, with a summary of meetings and attendance in 2023.
BV Ann Vereecke (Ann Vereecke)*
BV PVO Advisory (Paul Van Oyen)
NV Holbigenetics (Frank Coopman)
* Chair
X X X
All members are non-executive directors and have in-depth knowledge of human resources management. The majority of the committee members are independent. The remuneration and appointments committee advises the board of directors on, among other things:
• the remuneration of the executive committee, the CEO and specifically designated persons
• remuneration of the chairman and directors the general remuneration policy for the directors and executive management, as well as the remuneration report
• the principles of the variable remuneration system
• appointment and reappointment of directors
• the composition of committees within the board of directors the members and chairman of the executive committee
• the managing director
The committee prepares the remuneration report, submits it to the board of directors and explains it at the general meeting. The committee regularly evaluates its own regulations and operation.
* Chair
All members are non-executive directors and have in-depth relevant knowledge of sustainability management. In addition, the sustainability committee invites ad hoc experts in the field to support the committee members and also in view of the rapid changes regarding the legislative framework in the field. The majority of the committee members are independent. The sustainability committee advises the board of directors on, among other things:
strategy and policy
• reputation and risk management
• Qualitative and quantitative ESG performance
• reporting and disclosure
The sustainability committee prepares the sustainability report, submits it to the board of directors and explains it at the general meeting. The committee regularly evaluates its own regulations and operation.
Corporate governance
What’s Cooking? Annual report 2023
Name Meetings 2023 (x = present) 16/2 24/8 22/11 BV PVO Advisory (Paul Van Oyen) * X X X NV Famcoo Invest (Dominique Coopman) X X X BV Ann Vereecke (Ann Vereecke) X X X BV Tower Consulting (Inge Plochaet) X X X
147
Name Meetings 2023 (x = present) 16/2 20/4 23/11
X X X
X X X
Executive committee
Secretary
Ms Ann De Jaeger is the secretary to the board of directors as General Secretary - General Counsel & Corporate Affairs Director.
Executive committee and executive board
Following the introduction of the Companies and Associations Code, What’s Cooking? opted for a one tier governance model in 2020, with a monistic board of directors, a managing director in charge of day-to-day management and an executive committee.
Composition executive committee
Leading For Growth BV, permanently represented by Piet Sanders, Group Chief Executive Officer, Chairman of the Executive Committee and Managing Director
• Sagau Consulting BV, permanently represented by Christophe Bolsius, Group SBU Director Ready Meals Eric Kamp, Group chief operations officer
• Esroh BV, permanently represented by Yves Regniers, Group Chief Financial Officer
• Leading Edge HR BV, permanently represented by Else Verstraete, Group Chief People Officer
• Creating Digital Value SRL, permanently represented by Peter Bal, Group Chief Information Officer
• Broersbank Advies & Management BV, permanently represented by Brecht Vanlerberghe, Group Chief Research & Development Officer
From 2024, Teun Haegens joined the executive committee as SBU Director Savoury.
Ms Ann De Jaeger (General Secretary - General Counsel & Corporate Affairs Director) is attached to the executive committee and is secretary general of the company.
Operation
The executive committee met twice a month in 2023 and whenever necessary for operational reasons. The executive committee is responsible for management reporting to the board of directors. The detailed operation of the executive committee is described in the executive committee’s internal regulations, which are an integral part of the group’s Corporate Governance Charter.
Evaluation
The board of directors evaluates once a year the functioning of the CEO (without the CEO being present) and once a year the other members of the executive committee (in the presence of the CEO). The board does so on the proposal of the remuneration and appointments committee. This evaluation also took place in 2023. The board uses both quantitative and qualitative parameters for this purpose. There is no direct link between this evaluation and the annual variable remuneration.
Piet SANDERS (°1966) – Leading for Growth BV
CEO What’s Cooking Group NV
Piet Sanders holds a master’s degree in law and management. Almost 30 years of his career were spent in the food sector. Between 1999 and 2002, Piet was Global Sales Director Food at Amylum / Tate & Lyle, a leading producer of starches, cereal-based sweeteners, and wheat proteins. After two years as Chief Sales & Marketing Officer at Reynaers Aluminium, he returned to the food sector in 2004. He joined Puratos, an international group providing innovative ingredients and services to the bakery, patisserie and chocolate sectors. He started there as Managing Director for Central and Eastern Europe, and subsequently became Managing Director in Asia & for Northern and Eastern Europe, and Global Sales & Channels Director, among others. In 2021, Piet became CEO of What’s Cooking Group NV. A year later, he was appointed director for a four-year term. Piet has also been a Supervisory Director of Cefetra B.V. , a Dutch feed & food ingredients company, since 2022.
Yves REGNIERS (°1978) – ESROH BV
CFO What’s Cooking Group NV
Yves Regniers studied law at Ghent University and obtained an MBA from Warwick Business School. After a stint at PwC, he worked for thirteen years at what is now WestRock. There he held various financial positions in Belgium and abroad. In early 2017, he came on board at What’s Cooking Group NV. Yves has been a member of the executive committee since January 2019 and was appointed CFO of the group in March 2020. Since 2023, he has also been responsible for sustainability within What’s Cooking?
Eric KAMP (°1963)
COO What’s Cooking Group NV
Eric Kamp studied public administration at the University of Twente. He then built an international career with Mars, United Biscuits and Provimi, among others, and lived and worked in Germany, Hungary and South Africa. Before joining What’s Cooking?, Eric was Operations and Supply Chain Director of the Aquafeed division at Cargill. Since 2020, he has been COO of our group and a member of the executive committee.
Christophe BOLSIUS (°1969) – Sagau Consulting BV
Director of ready meals What’s Cooking Group NV
Christophe Bolsius graduated in applied economics and international business administration from the University of Antwerp. He has worked in the food sector all his career, including in sales and marketing at Dr Oetker, Sara Lee Deli and Campina - both in Belgium and abroad - and as a member of the management of FrieslandCampina and Douwe Egberts. In December 2014, Christophe joined our commercial management team and a year later he started as head of the ready-made meals business unit.
Corporate governance What’s Cooking? Annual report 2023 148
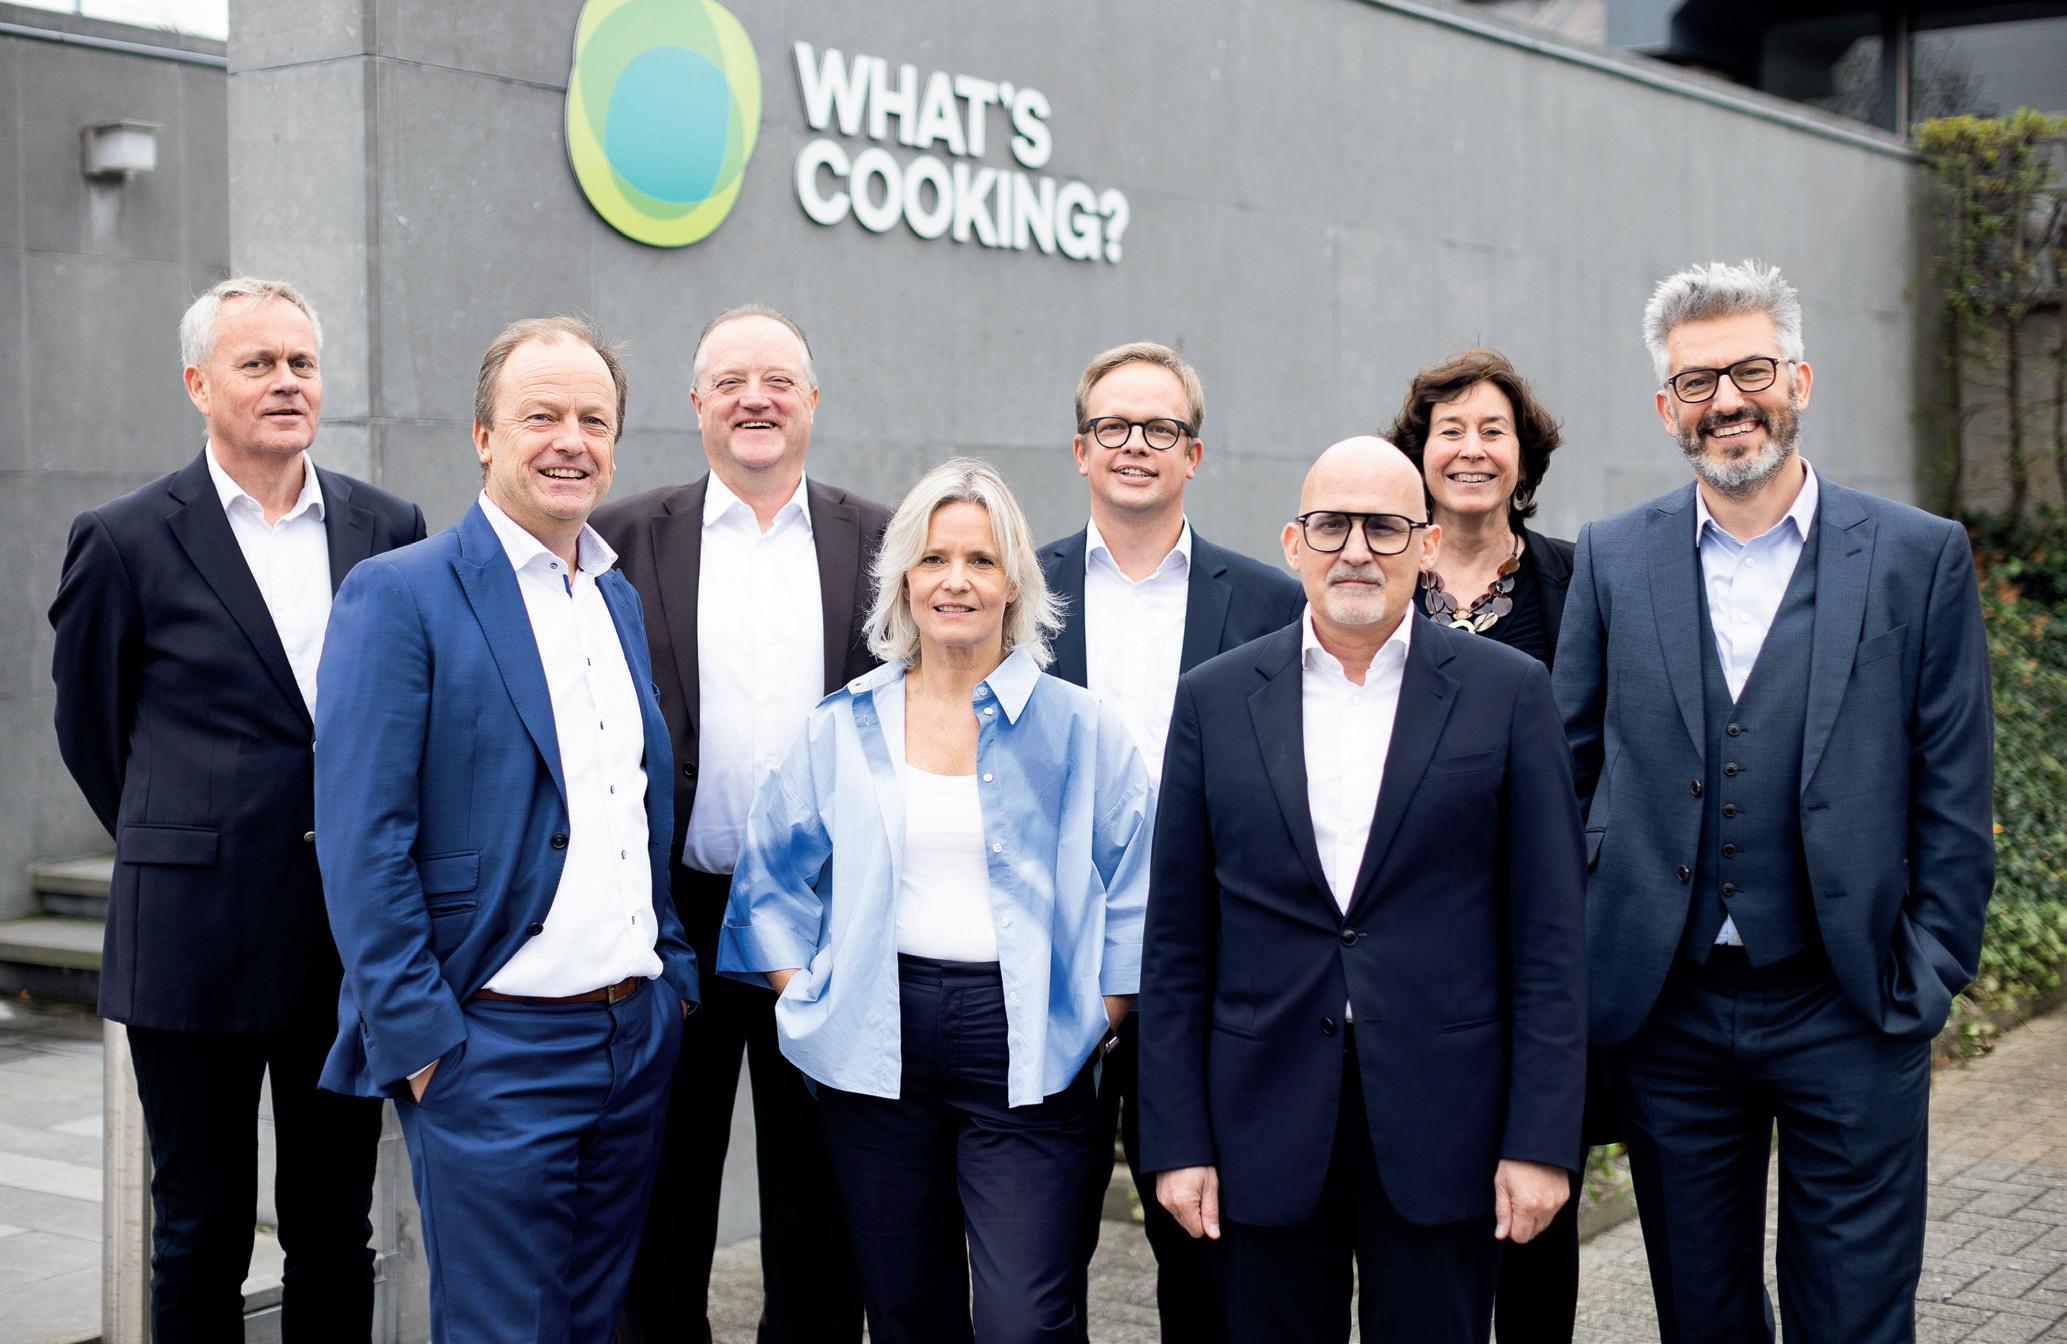
Else VERS,TRAETE (°1967) – Leading Edge HR BV
CPO What’s Cooking Group NV
Else Verstraete obtained her master’s degree in political and social sciences from the University of Antwerp. At Imtech Marine (Radio Holland) in Rotterdam and Aleris in Duffel, she gained experience in HR leadership roles. She then spent six years within 3M as HR Director for Benelux and HR Director EMEA for various business units. In May 2022, she started as our Chief People Officer and became a member of the executive committee of What’s Cooking Group NV.
Brecht VANLERBERGHE (°1973) – Broersbank Advies & Management BV
Chief R&D Officer What’s Cooking Group
Brecht Vanlerberghe obtained his master’s degree in bioengineering and industrial management from Ghent University. At several international agri-food companies, including AVEVE, Campina, FrieslandCampina and Tereos Syral, he was responsible for research, development and innovation. After seven years as Chief R&D Officer at Bio Base Europe Pilot Plant, Brecht went to work as Business Development & Relation Manager of VITO’s Sustainable Chemistry Unit. Since December 2022, he has been our Chief Research and Development Officer and member of the executive committee.
Peter BAL (°1964) – Creating Digital Value BV
CIO What’s Cooking Group
Peter Bal holds a master’s degree in industrial engineering, a postgraduate degree in public administration and a Digital Transformation Certificate from Massachusetts Institute of Technology. He gained considerable experience in several international listed companies, including Nokia,
Proximus and Swift. He then spent 15 years at what is now ZF - first as Chief Information Officer and Vice President Process Optimisation, and later as Managing Director of Transics, a digital services provider he founded within ZF. Peter started as Group Chief Information Officer at What’s Cooking? in November 2022 and is now also a member of the executive committee.
Teun Haegens (°1979)
SBU director Savoury What’s Cooking Group NV (from 2024).
Teun Haegens studied Business Economics with a post-master’s degree in Accountancy at Tilburg University. He worked at Wienerberger as CFO Netherlands between 2015 and 2020. Since 2021, he worked as Commercial Controller within the Savoury Business Unit of What’s Cooking? to take up the role of SBU Director from 2024 and join the executive committee.
Ann DE JAEGER (°1971) (associated with the executive committee)
General Counsel & Corporate Affairs Director / General Secretary
What’s Cooking Group NV
Ann De Jaeger obtained a master’s degree in commercial and corporate law from the University of Ghent and a master’s degree in corporate law from the University of Antwerp. She also became a certified director. Ann started her career in a law firm and rose to General Counsel & Head of Corporate Affairs in international B2B and FMCG food companies such as Tate & Lyle, Tereos Syral, Alpro and Danone. Since April 2022, she has been our General Counsel & Corporate Affairs Director. She is also General Secretary of the listed family-owned company and works closely with the board of directors in this role.
What’s Cooking? Annual report 2023 149
Corporate governance
Conflicts of interest
Board of Directors
In 2023, the board of directors did not receive any reports of a conflict of interest in terms of asset law within the meaning of the CGC. There were also no reports of related party transactions, as described in Annex 2 to the group’s Corporate Governance Charter.
External audit
The general meeting of 27 May 2021 appointed KPMG Bedrijfsrevisoren BV as auditor of What’s Cooking Group NV. KPMG Bedrijfsrevisoren BV appointed Filip De Bock as permanent representative. The appointment was for three years. We consulted regularly with the auditor. For the half-yearly and annual reporting, we invited him to the meeting of the audit committee. The auditor is also invited to discuss the internal audit plan and internal controls. The auditor does not maintain any relationships with What’s Cooking? influence his judgement. Moreover, he confirmed his independence from the group. In 2023, we paid EUR 290,000 for audit services to KPMG Bedrijfsrevisoren BV and to the persons with
Executive Committee
No related party transactions within the meaning of Annex 2 of the group’s Corporate Governance Charter were reported in 2023.
whom KPMG Bedrijfsrevisoren BV is associated (for comparison in 2022: EUR 283,000). Non-audit services of EUR 20,000 were provided in 2023 (for comparison in 2022: EUR 10,000). The companies with which the auditor has a partnership did not invoice additional fees to the group in 2022 and 2023.
The general meeting of 30 May 2024 will be asked to reappoint KPMG Bedrijfsrevisoren BV as auditor, for a period of three years, expiring immediately after the general meeting of 2027. KPMG Bedrijfsrevisoren BV will appoint Filip De Bock as its permanent representative.
Dealing Code to prevent abuse of inside information of What’s Cooking Group NV
The Dealing Code of What’s Cooking Group NV contains rules to prevent market abuse and insider trading (e.g. in transactions in securities of What’s Cooking Group NV). The Dealing Code forms Annex 3 of the group’s Corporate Governance Charter.
Directors, executives and insiders submit transactions to the compliance officer. In case of a negative opinion, the person concerned may not carry out the transaction, or must submit it to the board of directors.
The Dealing Code provides, inter alia, that:
• The Dealing Code contains guidelines to preserve the confidentiality of inside information. For example, the Dealing Code stipulates closed and blackout periods. Directors and other relevant persons of What’s Cooking? may not conduct transactions in securities of Whats’ Cooking Group NV at such times.
We always inform new members of the board of directors, the executive committee and other persons who regularly have access to inside information about the Dealing Code.
• The company also keeps a list of those with access to inside information.
Corporate governance What’s Cooking? Annual report 2023 150
Remuneration report
Remuneration procedure
The current remuneration policy 2023-2026 is available on the group’s website. The remuneration report for 2023, prepared by the remuneration and nomination committee, will be explained and submitted for (advisory) vote at the general meeting of 30 May 2024, after prior communication to the works council.
The remuneration and appointments committee monitors the application of the policy and advises the board of directors in this respect.
The general meeting on 25 May 2023 approved the overall remuneration level for members of the board of directors in the 2023 financial year.
On the advice of the remuneration and nomination committee, the board of directors confirmed the remuneration for the CEO and members of the executive committee in the 2023 financial year.
Remuneration
The members of the board of directors and its committees were entitled to the following annual fixed remuneration (in EUR) in 2023:
Chairman of the Board of Directors
Member of the Board of Directors
Chairman of the Audit Committee
Member of the Audit Committee
Chairman of the Remuneration and Nomination Committee
Member of the Remuneration and Nomination Committee
Chairman of the Sustainability Committee
Member of the Sustainability Committee
€ 100,000.00
€ 30,000.00
€ 10,000.00
€ 6,000.00
€ 7,000.00
€ 5,000.00
€ 7,000.00
€ 5,000.00
The members of the board of directors (with the exception of the managing director) are not entitled to any variable, performance-related or share-related remuneration, or to any other remuneration, other than fixed remuneration, for exercising their directorship.
The remuneration of the CEO and other members of the executive committee consists, in principle and in function of their social status, of a basic remuneration, an annual variable remuneration and a long-term variable remuneration (long-term incentive). These remunerations are supplemented, only for those with employee status, by a company car and fuel card and other remuneration components, such as pensions and insurance, all in line with the company’s applicable policies.
Basic fee
The basic allowance aims to compensate the manager for performing his or her duties in accordance with his or her specific competences and experience in the position.
Base remuneration is set on the basis of relevant benchmark exercises, with the company aiming for a level of remuneration in line with the median of the relevant market. The same policy is incidentally applied to all employees of the company.
As is the case for the (other) employees, the basic remuneration for the members of the executive committee with employee status is adjusted annually in line with life expectancy, in line with legally required indexations or indexations following individual or collective agreements.
Annual variable remuneration
The CEO and other members of the executive committee are granted an annual variable remuneration in cash, depending on the achievement of annually set targets, relating to the financial year for which the variable remuneration is due, according to the modalities below.
Approximately 75% of the annual targets set are linked to company performance (including financial performance). The remaining ca. 25% are targets linked to individual performance (including some ESG-related performance).
Financial targets are based on objective parameters and are closely linked to the group’s results and the role played by the CEO and other members of the executive committee in achieving those results. The main parameters that can be used for this purpose are volume, revenue, FCF, (U)EBITDA, EBIT, EAT, (U)EBITDA/Net debt and ROCE.
Which of these parameters are used in a given year and what are the objectives to be achieved in relation to these parameters are evaluated annually by the remuneration and nomination committee and submitted to the board of directors for approval.
The recognition of both collective success and individual performance contribute to the long-term importance and sustainability of the company and the successful achievement of its strategy. The collective and individual performance targets establish a close link between the interests of the CEO and the members of the executive committee, on the one hand, and the interests of the company, and its shareholders.
The potential annual variable remuneration at 100% payout (at target) concerns an amount equal to 30% or less of the total remuneration, depending on the position and the classification of the position compared to the relevant benchmark. This share is contractually determined individually and aims at a market-based annual variable remuneration.
If less than the minimum target to be achieved is achieved in a given year, the right to the variable remuneration linked to that target for that year lapses. If the target to be achieved is exceeded, a maximum of up to 150% of the associated variable remuneration may be awarded.
What’s Cooking? Annual report 2023 151 Corporate governance
In addition to the system of annual variable remuneration, the Board of Directors retains the prerogative, at the proposal of the Remuneration and Nomination Committee, to grant the CEO and/or the other members of the Executive Committee, or some of them, an (additional) bonus for specific performance or merit, without however exceeding the total budget for annual variable remuneration for the CEO and the other members of executive management for the financial year concerned. These modalities generally also apply to other employees of the group to whom an annual variable remuneration is granted. Such (additional) bonus shall not exceed 30% of the executive committee member’s annual fixed remuneration
Additional provisions were made for 2023 in the framework of these LTI plans, in accordance with the overview enclosed in the figures on the remuneration of the CEO and the other members of the executive committee.
The amounts granted in 2021 in connection with a possible acquisition were finally not granted given the non-occurrence of the transaction.
Long-term variable remuneration (long-term incentive)
The CEO and other members of the executive committee, as well as a limited number of other employees of the group, are granted long-term variable remuneration (a so-called long-term incentive) (“LTI”) in cash, according to the modalities below.
The LTI aims at value creation - with a clear focus on making the company stronger for the future and executing the strategic plan - and retention.
The LTI is awarded according to financial targets (growth in equity value) (approx. 80%) and individual and measurable ESG targets (approx. 20%) over a reference period of at least three years in each case.
If less than the minimum target to be achieved is achieved in a given year, the right to the variable remuneration linked to that target for that year lapses. If the target to be achieved is exceeded, a maximum of up to 150% of the associated variable remuneration may be awarded.
The board of directors decides annually, on the proposal of the CEO and the remuneration and nomination committee, who is eligible to participate in an LTI plan. The board of directors may decide, on the proposal of the CEO, to make an LTI plan also applicable to other employees of the group.
At 100% payout (at target), the potential LTI amounts to an amount of at least 15% and at most 25% of the total remuneration, depending on the position and the ranking of the position compared to the relevant benchmark. This share is contractually determined individually and aims at a market-based LTI.
The LTI aims to align the interests of the CEO and other members of the executive committee with those of shareholders and stakeholders.
A first LTI payout (for some of the executive committee members) can only be obtained after the close of the 2024 financial year.
Corporate governance What’s Cooking? Annual report 2023 152
Remuneration of directors (in their capacity as members of the board of directors) (in EUR)
We summarise the remuneration of board members (both executive, non-executive and independent directors - overview see below) for their directorship in 2023 as follows:
Corporate governance What’s Cooking? Annual report 2023 153
Mandate of director Mandate Remuneration and Nomination Committee Mandate Audit Committee Mandate Sustainability Committee Total BV PVO Advisory (Paul Van Oyen) 100,000.00 5,000.00 7,000.00 112,000.00 BV Leading for Growth (Piet Sanders) 30,000.00 30,000.00 NV Holbigenetics (Frank Coopman) 30,000.00 5,000.00 35,000.00 NV Famcoo Invest (Dominique Coopman) 30,000.00 5,000.00 35,000.00 Eddy Van der Pluym 30,000.00 6,000.00 36,000.00 NV Hico (Johan Pauwels) 17,500.00 3,500.00 21,000.00 BV Ann Vereecke 30,000.00 7,000.00 5,000.00 42,000.00 BV Deemanco (Dominique Eeman) 10,000.00 3,333.33 13,333.33 BV IJzer Beheer (Aart Duijzer) 20,000.00 6,666.67 26,666.67 BV C:Solutio (Kurt Coffyn) 30,000.00 6,000.00 36,000.00 BV Tower Consulting (Inge Plochaet) 30,000.00 5,000.00 36,000.00 Total mandates 422,000.00
All amounts concern fixed remuneration and are in line with the remuneration policy, which contributes to the long-term performance of the group.
Remuneration of the CEO and other members of the executive management (in EUR)
The individual gross remuneration of the managing director / chairman of the executive committee / CEO (ie, Leading For Growth BV, permanently represented by Piet Sanders) and the joint gross remuneration of the other members of the executive committee: Esroh BV (permanently represented by Yves Regniers), Sagau Consulting BV (permanently represented by Christophe Bolsius), Eric Kamp, Leading Edge HR BV (permanently represented by Else Verstraete), Creating Digital Value SRL (permanently represented by Peter Bal), Broersbank Advies & Management BV (permanently represented by Brecht Vanlerberghe), are included in the table below:
°including recharge of expenses
*The pension plan concerns defined contribution contracts
**NA = not applicable
*** Mandate of director What’s Cooking Group NV excluded All amounts are in line with the remuneration policy, which contributes to the long-term performance of the group.
Share-related fees
Members of the board of directors and executive committee do not have stock options, subscription rights or any other rights to acquire shares. The company did not grant any shares, stock options or other rights to acquire What’s Cooking Group shares in 2023. Not to members of the group’s board of directors and not to members of the executive committee.
Historical information and ratio
Board and CEO remuneration and key performance indicators evolved as follows during the period 2019-2023:
Corporate governance What’s Cooking? Annual report 2023 154
CEO*** Other members of the executive management Base pay ° 589,535.14 2,013,405.62 Variable pay (cash - on a yearly basis) 75,000.00 138,612.99 Pensions* NA** 23,093.76 Other insurance (hospitalisation insurance) NA** 1,809.79 Other benefits (company car) NA** 18,070.32 Long Term Incentive provision 2023 133,333.33 241,666.36
2019 2020 2021 2022 2023 Former Chairman of the Board of Directors € 75,000 € 75,000 € 75,000 € 89,583 € 100,000 Member of the Board of Directors € 20,000 € 20,000 € 20,000 € 20,000 € 30,000 Chairman of the Audit Committee € 10,000 € 10,000 € 10,000 € 10,000 € 10,000 Member of the Audit Committee € 6,000 € 6,000 € 6,000 € 6,000 € 6,000 Chairman of the Remuneration and Nomination Committee € 7,000 € 7,000 € 7,000 € 7,000 € 7,000 Member of the Remuneration and Nomination Committee € 5,000 € 5,000 € 5,000 € 5,000 € 5,000 Chairman of the Sustainability Committee € 7,000 Member of the Sustainability Committee € 5,000
The ratio between the CEO’s fixed remuneration (excluding his remuneration as a member of the board of directors) and the lowest gross remuneration of a group employee in Belgium (in full-time equivalent) is 16 for the month of December 2023.
Contractual provisions concerning recruitment or severance payments
The group did not agree any recruitment arrangements with members of the executive committee or with executive directors that entitle them to severance pay of more than 12 months. The group also did not enter into any arrangements contrary to legal provisions, the Belgian Corporate Governance Code 2020 or market practice. The contractual notice periods for Sagau Consulting BV (Christophe Bolsius), Esroh BV (Yves Regniers) and Leading For Growth BV (Piet Sanders) are 12 months each. Eric Kamp’s notice period is in principle calculated in accordance with the statutory provisions applicable to his employment contract. The contractual notice period for Leading Edge HR BV (Else Verstraete), Creating Digital Value SRL (Peter Bal) and Broersbank Advies & Management BV (Brecht Vanlerberghe) is six months each.
Shareholder voting information
The general meeting 25 May 2023 approved the 2022 remuneration report with a majority of 99.53%.
The company encourages an open and constructive dialogue with its shareholders to discuss its approach to governance, including remuneration.
Information as referred to in article 74, §7 of the Law of 1 April 2007 on takeover bids
Stichting Coopman reported on 21 August 2023 that on 21 August 2023 it (still) holds, through Famcoo Invest NV and Stichting Administratiekantoor Coovan, more than 30% of the voting securities in What’s Cooking Group NV.
More specifically, Stichting Coopman reported that Stichting Administratiekantoor Coovan, as of 22 August 2022, had acquired 28,207 voting securities in What’s Cooking Group NV, and as of 21 August 2023, held 1,230,022 (66.27%) voting securities in What’s Cooking Group NV.
Stichting Administratiekantoor Coovan1 is controlled by Famcoo Invest NV2, which in turn is controlled by Stichting Coopman3. Stichting Coopman is no longer controlled.
1 Basisweg 10, 1043 AP Amsterdam (The Netherlands), with enterprise number KvK Amsterdam 34248201.
2 Kere 103, 9950 Lievegem (Belgium), with enterprise number 0439.850.161 (RPR Gent, Ghent division).
3 Hoogoorddreef 15, 1101 BA Amsterdam (The Netherlands), with enterprise number KvK Amsterdam 41193935.
Corporate governance What’s Cooking? Annual report 2023 155 2019 2020 2021 2022 2023 CEO - fixed remuneration - excl, board mandate remuneration € 484,725 €466,194 €500,000* €529,692 € 589,535 Sales (in million EUR) 728.1 717.4 696.9 781.4 832.3 EBITDA (in million EUR) 37.2 37.1 45.9 35.9 45.5 Result after taxes (in million EUR) 4.4 -2.5 7.3 4.5 7.7 The evolution of the average remuneration of employees in the group can be presented as follows: 2019 2020 2021 2022 2022 Average gross salary for a full time equivalent in the group 100.00 102.44 106.08 107.91 123.26
Key features of internal control and risk management systems
We attach great importance to high-performance internal control and risk management. We integrate these into our structure and operations as much as possible. To this end, we have implemented numerous internal controls according to the integrated COSO II or Enterprise Risk Management Framework®. The most important elements are summarized here.
On the proposal of the executive committee, the board of directors annually determines or confirms our mission, values and strategy, and thus the group’s risk profile. We actively and repeatedly promote our values to all our employees. We do this at least at every semi-annual information meeting. Integrity is the most important value in risk management. We communicate to all our employees at the same time the outlines of the strategy and objectives for the Group and the segments / SBUs (Strategic Business Units Ready Meals and Savoury).
We describe the governance structure of our Group in detail in our Articles of Association, our Corporate Governance Charter and in the Corporate Governance Statement. This structure defines the distinct roles and responsibilities of each of our governing bodies. These are the board of directors, the audit committee, the remuneration and nomination committee, the executive committee and the managing director/CEO. The duties and responsibilities of these bodies are in line with the legal provisions and the provisions of the Corporate Governance Code 2020. We drew up coherent regulations for each of them. We evaluate them regularly. If necessary, we adapt it. In this way, powers and responsibilities are always clearly defined and verifiable.
We organize (and monitor) our human resources through a job classification system in which all group employees are classified. Detailed job descriptions have been drawn up for each position. These describe not only the study and skill requirements, but also the tasks, responsibilities and reporting lines. We adapt these job descriptions as the content of certain positions changes due to internal or external circumstances.
We ensure that we can evaluate all of our non-production employees annually through an elaborated evaluation tool. In this regard, we attach particular importance to values-compliant behavior. We also try to set concrete objectives together for our production employees and organize feedback interviews. We also measure our employees’ commitment at regular intervals at all sites in order to respond even better to the needs of our people.
We have established clear policies for training and compensating our employees. We rigorously apply the legal provisions on conflicts of interest (see above). We introduced regulations for transactions with related parties that do not constitute a legal conflict of interest (Annex 2 to the Corporate Governance Charter). The internal auditor periodically conducts risk audits and audits of internal controls in all Group departments. The audit committee receives a report on these. Based on the findings of the internal auditor, and in consultation with the audit committee, we adjust the internal control environment.
The audit committee devotes two meetings a year to evaluating the risks we face (see above). Internal controls and risk management are also discussed. The discussion is based on a formal and detailed risk assessment prepared by executive management. This reflects how we deal with identified risks. The audit committee reports on its work at the next board meeting.
We have a dealing code to prevent market abuse (Annex 3 to the Corporate Governance Charter). We have also appointed a compliance officer. He oversees proper compliance with the rules on market abuse (see above). We take out adequate insurance contracts for our main risks.
We apply a hedging policy to manage foreign exchange risks.
In describing the main risks, we mention a number of other risk management practices. These include our sustainability risks in terms of both impact materiality (our impact on the environment) and financial mate- riality (the impact of the changing environment on our business). See also the chapter ‘non-financial information’ for more information on this.
For the process of financial reporting, we have set up the following control and risk management systems:
The internal regulations of the board of directors, audit committee and executive committee clearly describe who is responsible for what in preparing and approving our group’s financial statements.
The finance department reports monthly the financial results of the group and divisions to the executive committee. The committee discusses these results and makes them available to the members of the board of directors.
Quarterly, the executive committee reports the results of the group and divisions to the board of directors. The executive committee first explains the first-half and annual results to the audit committee, which discusses them with the internal and external auditor. Then these results go to the board of directors for approval. They are published in the form required by law. We publish internally and externally a schedule of our periodic reporting obligations to the financial market.
Quarterly, the executive committee also reports the results around the ESG initiatives (Environment, Social, Governance) to the board of directors (and the sustainability committee from 2023 onwards). In order to ensure the auditability of the sustainability information in the future, a software package was purchased that allows both KPIs (Key Performance Indicators) to be consulted per site and per period, as well as a good follow-up of the objectives and the inclusion of the audit information, in order to have a complete and traceable system for the entire company, both internally and externally.
We introduce clear timetables for financial and non-financial reporting at all levels in the company. This enables us to meet all legal obligations in a timely and correct manner. We have a clear policy for securing and providing access to financial data. There is also a high-performance system for backup and preservation of this data.
The finance department uses a comprehensive manual. This describes applicable accounting principles and procedures. The riskiest internal controls from the COSO II framework for financial matters apply. These controls and systems must help ensure that the published financial results give a true and fair view of the group’s financial position.
Corporate governance What’s Cooking? Annual report 2023 156
Other Legal Information
Shareholder structure on 31 December 2023
We received no transparency declarations in 2023.
Entries under Article 34 of the Royal Decree of 14 November 2007
There are no security holders with special control rights. The voting rights of the group’s own shares are suspended following the applicable legal provisions.
The extraordinary general meeting can amend the company’s articles of association. This requires a majority of three-quarters of the votes present. Those present must represent at least half of the share capital, as provided for in the Companies and Associations Code. An amendment to the company’s object requires a majority of four-fifths of the votes present. On 31 December 2023, What’s Cooking Group NV did not own any of its own shares (nor did it on 31 December 2022).
The procedure for the appointment/reappointment of directors (see reappointments above) is set out in Article 4 of the rules of the remuneration and appointments committee (Annex 5 to the group’s Corporate Governance Charter - 2023 version).
The extraordinary general meeting of shareholders of 21 April 2023 authorised the board of directors of What’s Cooking Group NV to increase the company’s share capital within the authorised capital. This must be done under the terms of the Companies and Associations Code. This authorisation is valid for a period of three years.
The extraordinary general meeting of shareholders held on 21 April 2023 authorised the board of directors, in accordance with the Companies and Associations Code, to purchase shares in the company for the account of the company. Such a purchase of shares is authorised only to prevent an imminent serious detriment to the company. This authorisation is valid for three years.
We received in 2017 a transparency declaration from STAK Coovan on their participation in the capital of What’s Cooking Group NV. We included this declaration in the company’s website. We disclosed the content according to the applicable rules. See also above.
To the best of the group’s knowledge, there are no other significant elements that could have an effect in the event of a public takeover bid, nor any legal or statutory restrictions on share transfers.
Corporate governance What’s Cooking? Annual report 2023 157
Free float STAK COOVAN 34% 66% Transparency
Main risks to our operating activities
Operational risks
Food safety and product liability
Every day, thousands of people eat our processed meats and ready meals. These products must be fresh and safe. The end consumer is also entitled to clear information about the composition of the product and its nutritional value.
Competitive environment
The processed meats market is extremely mature and is dominated by the private labels of large discount and retail customers. The ready meals market is growing, but here competition is very fierce.
Technological developments
Product and production technologies evolve rapidly.
What can happen if we don’t make the right decisions?
How do we limit the risks in general and in 2023 in particular?
The safety and the confidence of consumers are vitally important to us. Anything that can damage this confidence - either concerning our own products or the sector - will have a negative impact on our sales, our prospects and our reputation.
The competition enables customers to increase pressure on our margins. This may have an impact on our profits.
We have constant high demands for product safety and quality. All our raw materials are traceable. Our packaging clearly states product composition and nutritional values per 100 grammes and per serving. We go further than the statutory requirements with regards to the safety of our packaging. We have insurance to cover our product liability.
We distinguish ourselves from our competitors in terms of concepts and products. We work continuously on improving efficiency and cost control.
Not being abreast with the latest production technologies can have a negative impact on efficiency and cost control. Competitors may have access to alternative product technology that at some point may win over consumers.
Electronics and information systems
For efficient business operations we are becoming increasingly dependent on information systems and integrated control systems which are managed by a complex set of software applications.
War for talent
An organisation is only as strong as its employees. The knowledge and expertise is to be found in a group of employees who contribute to building the company and its brands.
If these systems do not work well, or if they were to become unavailable, this would have a negative impact on the production volume and on our reputation.
Each year we invest considerable sums in tangible non-current assets to maintain and improve our level of technology. We maintain good contact with our suppliers so that we are always well informed of the most recent developments. We sound out consumer preferences. We work together with research institutes such as Flanders’ FOOD.
All systems are maintained appropriately. All systems are upgraded when necessary. Regular back-ups are made of all information. A new ERP system has been implemented to structure and simplify our business processes.
If too many good employees are lured away by the competition and there is too little influx of young people, we run the risk that we will be unable to achieve our growth scenario.
In 2015, we established a Young Potential programme: newly graduated young people receive an attractive training programme. They experience four different positions within the company during two years.
We meanwhile have a number of in-house recruitment experts to attract new staff & started an employer branding program.
We continue to focus on employee engagement and the retention of existing staff
Corporate governance What’s Cooking? Annual report 2023 158
Main risks to our operating activities
Marktrisico’s
What can happen if we don’t make the right decisions?
Price fluctuations for raw materials and packaging
We work with natural raw materials. We must therefore take into account possible fluctuations in the quality and the price of our raw materials and packaging materials.
Relationships with suppliers
For specific raw materials we are obliged to work with a limited number of suppliers.
Price increases for raw materials and packaging can have a negative influence on the margins.
How do we limit the risks in general and in 2023 in particular?
We enter into long-term contracts whenever possible. We work with volume arrangements on an annual basis.
Relationships with customers
We market our products via a network of discount and retail customers throughout Europe. The number of large customer groups is limited.
Customer and consumer behaviour
Our sales are related to the eating habits and trends of the ultimate consumers, just as their spending habits.
If one or more of these suppliers cannot fulfil its contractual commitments and we are unable to secure alternative supplies in time, this could have a negative impact on our business operations.
The number or larger retail customers is small. If one of them terminates a contract, this may have a significant negative impact on our turnover and profit.
If consumers no longer selected our products or their eating habits were to change, this would have a significant impact on our business activities. General economic conditions such as cyclical fluctuations, unemployment and interest rates can also affect the consumer spending patterns.
We enter into long-term contracts whenever possible. We work with volume arrangements on an annual basis. We offer our suppliers fair payment for their added value. We work with preferential suppliers for sustainability.
We diversify turnover in different products and contracts with other lead times; both with respect to our own brands as well as private labels of customers and in different countries.
We regulary perform consumer & market research, to review eating habits of consumers in the various markets we operate. We surveyed the satisfaction of our consumers to anticipate and minimise this risk.
We ensure that our prices are in line with those of the market.
Corporate governance What’s Cooking? Annual report 2023 159
Main risks to our operating activities
What can happen if we don’t make the right decisions?
Financial risks (see also explanatory note 26 in the annual accounts)
Credit risks
We have receivables outstanding from our clients and retail customers.
Receivables not collected on time have a negative impact on the cash flow.
How do we limit the risks in general and in 2023 in particular?
We monitor customers and outstanding receivables in order to limit these potential risks. Most receivables relate to large European customers which limits the risk.
Exchange rate risks
As Ter Beke operates in an international environment, we are exposed to an exchange rate risk on the sales, purchases and interest-bearing loans expressed in a currency other than the company’s local currency.
Interest risk
The forms of financing with variable interest rates mainly arise from Ter Beke’s Revolving Credit Facility Agreement.
Liquidity and cash flow risks
As with any business, Ter Beke monitors liquidities and cash flow.
Fluctuations in exchange rates can cause fluctuations in the value of financial instruments.
We adhere to a consistent hedging policy. We do not use financial instruments for trading and we do not speculate.
The fair value or future cash flows of a financial instrument will fluctuate as a result of changes in the market interest rates.
A shortage of cash and cash equivalents could put pressure on the relationships with certain parties.
Legal risks (see also explanatory note 28 in the annual accounts)
Changes to legislation
Now and then the government changes and tightens legislation on the production and sale of foods.
Legal disputes
Occasionally we are involved in legal proceedings or disputes with customers, suppliers, consumers or the government.
Not meeting these conditions can expose us to the risk of fines or sanctions.
We adhere to a consistent hedging policy. We do not use financial instruments for trading and we do not speculate.
Such litigation could have a negative impact on our financial situation.
We have a significant net cash flow with respect to the net financial debt position. We have centralised our treasury policy and we hedge against interest rate risks.
We invest significant amounts annually to satisfy new legislation, likewise relating to sustainability and the environment. Each year we organise training programmes to keep our employees up-to-date on new legislation and its impact.
We anticipate the potential impact of these disputes in our accounts as soon as a risk is judged as realistic under the applicable accounting rules.
Our ESG risks and opportunities have been included in the sustainability report. We’ve based our review on the double materiality matrix as explained in the sustainability report.
Corporate governance What’s Cooking? Annual report 2023 160
Corporate governance 161 What’s Cooking? Annual report 2023 GOV-1 The role of the administrative, management and supervisory bodies 21 Information about composition and diversity of members of administrative, management and supervisory bodies Corporate Governance – p 141-150 21 a Number of executive members Corporate Governance – p 141-150 21 a Number of non-executive members Corporate Governance – p 141-150 21 b Information about representation of employees and other workers Sustainability Annex – Own Workforce – p 101-105 21 c Information about member's experience relevant to sectors, products and geographic locations of undertaking Corporate Governance – p 141-150 21 d Board's gender diversity ratio Corporate Governance – p 141-150 21 e Percentage of independent board members Corporate Governance – p 141-150 22 Information about roles and responsibilities of administrative, management and supervisory bodies Corporate Governance – p 141-150 22 a Information about identity of administrative, management and supervisory bodies or individual(s) within body responsible for oversight of impacts, risks and opportunities Corporate Governance – p 141-150 22 b Disclosure of how body's or individuals within body responsibilities for impacts, risks and opportunities are reflected in undertaking's terms of reference, board mandates and other related policies Corporate Governance – p 141-150 22 c Description of managements role in governance processes, controls and procedures used to monitor, manage and oversee impacts, risks and opportunities Corporate Governance – p 141-150 22 c i Description of how oversight is exercised over management-level position or committee to which management's role is delegated to Corporate Governance – p 141-150 22 c ii Information about reporting lines to administrative, management and supervisory bodies Corporate Governance – p 141-150 22 c iii Disclosure of how dedicated controls and procedures are integrated with other internal functions Corporate Governance – p 141-150 22 d Disclosure of how administrative, management and supervisory bodies and senior executive management oversee setting of targets related to material impacts, risks and opportunities and how progress towards them is monitored See sustainability report - p 51 and following Corporate Governance – p 141-150 23 Disclosure of how administrative, management and supervisory bodies determine whether appropriate skills and expertise are available or will be developed to oversee sustainability matters Corporate Governance – p 141-150 23 a Information about sustainability-related expertise that bodies either directly possess or can leverage Corporate Governance – p 141-150 23 b Disclosure of how sustainability-related skills and expertise relate to material impacts, risks and opportunities Corporate Governance – p 141-150 GOV-2 Information provided to and sustainability matters addressed by the undertaking’s administrative, management and supervisory bodies 26 a Disclosure of whether, by whom and how frequently administrative, management and supervisory bodies are informed about material impacts, risks and opportunities, implementation of due diligence, and results and effectiveness of policies, actions, metrics and targets adopted to address them Executive committee members typically start with safety, Food safety and ESG. For Board level: Corporate Governance – p 141-150 26 b Disclosure of how administrative, management and supervisory bodies consider impacts, risks and opportunities when overseeing strategy, decisions on major transactions and risk management process
sustainability statement – double materiality review - p 83-85 26 c Disclosure of list of material impacts, risks and opportunities addressed by administrative, management and supervisory bodies or their relevant committees Corporate Governance – p 141-150
See
29 Incentive schemes and remuneration policies linked to sustainability matters for members of administrative, management and supervisory bodies exist
29 a Description of key characteristics of incentive schemes
29 b Description of specific sustainability-related targets and (or) impacts used to assess performance of members of administrative, management and supervisory bodies
29 c Disclosure of how sustainability-related performance metrics are considered as performance benchmarks or included in remuneration policies
29 d Percentage of variable remuneration dependent on sustainability-related targets and (or) impacts
29 e Description of level in undertaking at which terms of incentive schemes are approved and updated
Corporate Governance – Remuneration Report p 151-155
Corporate Governance – Remuneration Report p 151-155
Corporate Governance – Remuneration Report p 151-155
Corporate Governance – Remuneration Report p 151-155
Corporate Governance – Remuneration Report p 151-155
Corporate Governance – Remuneration Report p 151-155
Corporate governance What’s Cooking? Annual report 2023 162 GOV-3
of sustainability-related performance in incentive schemes
Integration
GOV-5 Risk management and internal controls over sustainability reporting
a Description of
main features and components of risk management and internal control processes and systems in relation to sustainability reporting Corporate Governance – p 141-150 36 b Description of risk assessment approach followed Corporate Governance – p 141-150 36 c Description of main risks identified and their mitigation strategies Corporate Governance – p 141-150 36 d Description of how findings of risk assessment and internal controls as regards sustainability reporting process have been integrated into relevant internal functions and processes Corporate Governance – p 141-150 36 e Description of periodic reporting of findings of risk assessment and internal controls to administrative, management and supervisory bodies Corporate Governance – p 141-150 Other topics 13 Disclosure of how climate-related considerations are factored into remuneration of members of administrative, management and supervisory bodies Corporate Governance – Remuneration Report p 151-155 13 Percentage of remuneration recognised that is linked to climate related considerations Corporate Governance – Remuneration Report p 151-155 13 Explanation of climate-related considerations that are factored into remuneration of members of administrative, management and supervisory bodies Corporate Governance – Remuneration Report p 151-155
36
scope,
163 What’s Cooking? Annual report 2023 Corporate governance
stock and shareholder information
What’s Cooking? Annual report 2023 164
Share listing
On 31 December 2023, 1,856,180 shares represented the share capital of What’s Cooking Group NV. The shares are listed on the cash market (continuous market) of Euronext Brussels. Following the optional dividend granted for the 2022 financial year, on 6 July 2023, 35,174 new shares were issued and listed.
To promote the liquidity of the share, we entered into a liquidity provider agreement with Bank Degroof Petercam NV in 2020. Under this agreement, the bank acts as a counterparty should there be too few buyers or sellers.
The liquidity provider also ensures that the gap narrows between bid and offer prices - the prices at which one can buy and sell.
The shareholder structure is described in the Corporate Governance Statement (see earlier).
Equity-related instruments
At 31 December 2023, there are no share-related instruments in circulation, such as stock options or warrants.
Dividend
By declaring an annual dividend payable, What’s Cooking Group NV intends to offer its shareholders a market-competitive return. To the general meeting of 30 May 2024, the board of directors will propose, over 2023, to increase the dividend by 7%, i.e. to approve a gross dividend of 4.28 euros per share. The board of directors will propose to the general meeting not to offer the dividend as an optional dividend this year.
Price evolution
You can check the What’s Cooking? share price at any time on the websites www.whatscooking.group and www.euronext.com
What’s Cooking? Annual report 2023 165
Stock and shareholder information
price evolution in € 0 20 40 60 80 100 120 140 160 180 200 2020 2021 2022 2023 2024
Stock
Follow-up by financial analysts
Analysts at Degroof Petercam and KBC Securities tracked shares of What’s Cooking? in 2023.
Proposals to the ordinary general meeting
To approve the financial statements as at 31 December 2023 and agree with the result appropriation. The unconsolidated result for the financial year is a profit of €14,495,671.90.
• To pay a gross dividend of 4.28 euros per share.
• Discharge the members of the board of directors and the auditor from their duties in 2023.
• To confirm approval of the group’s RCF (Revolving Credit Facility) refinancing.
• To decide on the remuneration report by separate vote. To decide on the remuneration policy by separate vote.
To reappoint Frank Coopman, as permanent representative of Holbigenetics NV, as a director for a period of four years, expiring at the 2028 annual general meeting.
• To reappoint Kurt Coffyn, as permanent representative of C:Solutio BV, as an independent director for a period of four years, expiring at the general meeting in 2028.
• To reappoint Inge Plochaet, as permanent representative of Tower Consulting BV, as an independent director for a period of four years expiring at the 2028 annual general meeting.
Director’s fees:
The Board of Directors proposes to the General Meeting to approve and grant the following fixed annual fees, in accordance with the remuneration policy, to the directors, according to their directorship, their possible membership of board committees and their possible chairmanship:
• To reappoint Filip De Bock, as permanent representative of KPMG Bedrijfsrevisoren, as auditor for a period of three years, expiring at the general meeting in 2027.
For the actual agenda and proposed resolutions, please refer to the notice of general meeting.
What’s Cooking? Annual report 2023 166 Stock and shareholder information
Chairman of the Executive Board 100,000 euro Member of the Executive Board 30,000 euro Chairman of the Audit Committee 10,000 euro Member of the Audit Committee 6,000 euro Chairman of the Remuneration and Nomination Committee 7,000 euro Member of the Remuneration and Nomination Committee 5,000 euro Chairman of the Sustainability Committee 7,000 euro Member of the Sustainability Committee 5,000 euro
consolidated financial statements
What’s Cooking? Annual report 2023 167

What’s Cooking? Annual report 2023 168

Consolidated income statement 170 Consolidated statement of comprehensive income 171 Consolidated balance sheet 172 Consolidated statement of changes in equity 173 Consolidated cash flow statement 174 Accounting policies and disclosures 175 Abbreviated financial statements of What’s Cooking Group NV 206 Consolidated key figures 2019-2023 208 Declaration by the responsible persons 209 Report from the Statutory Auditor on the consolidated annual accounts 210 All amounts in EUR x 1000, unless stated otherwise. 169 Index What’s Cooking? Annual report 2023
Consolidated income statement
as at December 31, 2023 and 2022
What’s Cooking? Annual report 2023 170
financial statements
Consolidated
Note 2023 2022 Revenue 4 832,326 781,385 Trade goods, raw and auxiliary items 5 -511,941 -495,220 Services and miscellaneous goods 6 -132,717 -120,664 Employee expenses 7 -143,532 -130,826 Depreciation costs 15 +16 -28,510 -27,833 Impairments, write-downs, and provisions 8 -398 -381 Other operating income 9 4,243 3,617 Other operating expenses 9 -2,911 -2,431 Result of operating activities 10 16,560 7,647 Financial income 11 1,550 1,305 Financial expenses 12 -6,524 -2,754 Results of operating activities after net financing expenses 11,586 6,198 Taxes 13 -3,831 -1,589 Result for the financial year before result from businesses accounted for using the equity method 7,755 4,609 Share in the result of enterprises accounted for using the equity method -98 -89 Result in the financial year 7,657 4,520 Result in the financial year: share third parties 0 299 Result in the financial year: share group 7,657 4,221 Basic earnings per share 31 4.17 2,33 Diluted earnings per share 31 4.17 2,33
Consolidated statement of comprehensive income
*
171 What’s Cooking? Annual report 2023 Consolidated financial statements as at December 31, 2023 and 2022 2023 2022 Profit in the financial year 7,657 4,520 Other elements of the result (recognised in the shareholders’ equity) Other elements of the result that may subsequently be reclassified to the results Translation differences * 2,916 -1,768 Cash flow hedge -476 597 Other elements of the result that may not subsequently be reclassified to the results Revaluation of the net liabilities regarding defined benefit pension schemes -349 442 Related deferred taxes 87 -111 Comprehensive income 9,835 3,680
See the foreign currency section under ‘Accounting policies for financial reporting and explanatory notes’
Consolidated balance sheet
What’s Cooking? Annual report 2023 172
financial statements
Consolidated
Note 2023 2022 ASSETS Non-current assets 224,711 225,726 Goodwill 14 78,041 77,871 Intangible non-current assets 15 15,951 17,306 Tangible non-current assets 16 120,511 121,650 Participations using equity method 17 333 431 Deferred tax assets 18 9,808 8,392 Other long-term receivables 19 67 76 Current assets 174,526 178,733 Inventories 20 47,264 46,889 Trade and other receivables 21 106,949 112,491 Cash and cash equivalents 22 20,313 19,353 TOTAL ASSETS 399,237 404,459 LIABILITIES Shareholders’ equity 23 125,783 120,573 Capital and share premiums 64,856 62,197 Reserves 60,927 56,494 Non-controlling interest 0 1,882 Deferred tax liabilities 4,929 5,615 Long-term liabilities 82,290 87,759 Provisions 24 3,695 3,442 Long-term interest-bearing liabilities 25 78,595 84,317 Other long-term liabilities 0 0 Current liabilities 186,235 190,512 Current interest-bearing liabilities 25 2,615 2,792 Trade liabilities and other payables 26 155,853 162,156 Social liabilities 24,962 22,567 Tax liabilities 2,805 2,997 TOTAL LIABILITIES 399,237 404,459
as at December 31, 2023 and 2022
Consolidated statement of changes in equity
as at December 31, 2023 and 2022
What’s Cooking? Annual report 2023 173
financial statements
Consolidated
Capital Share premiums Reserved profits Cash flow hedge Pensions and taxes Call/put option on mintority intrests Translation differences Attributable to the shareholders Minority intrests Total Number of shares Balance on 1 January 2022 5,077 54,495 62,430 -121 234 -2,944 597 119,768 1,677 121,445 1,794,217 Capital increase 76 2,549 2,625 2,625 26,789 Treasury shares reserve 0 0 Minority intrests as result of business combination 0 0 Dividend -7,177 -7,177 -7,177 Decrease of minority intrests as result of call/put option 0 0 Results in the financial year 4,221 4,221 299 4,520 Other elements of the comprehensive income for the period 597 331 -1,674 -746 -94 -840 Comprehensive income for the period 4,221 597 331 0 -1,674 3,475 205 3,680 Movements via reserves Result from treasury shares Balance on 31 December 2022 5,153 57,044 59,474 476 565 -2,944 -1,077 118,691 1,882 120,573 1,821,006 Capital increase 99 2,560 2,659 2,659 35,174 Treasury shares reserve 0 0 Minority intrests as result of business combination 0 0 Dividend -7,284 -7,284 -7,284 Decrease of minority intrests as result of call/put option -914 2,944 -148 1,882 -1,882 0 Results in the financial year 7,657 7,657 0 7,657 Other elements of the comprehensive income for the period -476 -262 2,916 2,178 2,178 Comprehensive income for the period 7,657 -476 -262 0 2,916 9,835 0 9,835 Movements via reserves Result from treasury shares Balance on 31 December 2023 5,252 59,604 58,933 0 303 0 1,691 125,783 0 125,783 1,856,180
Consolidated cash flow statement
(*) Also includes adjustments that are part of the financial result. This was -52 KEUR in 2023 and -337 KEUR in 2022
(**) Share Capital increase following Scrip Dividend: shareholders choosing for shares rather than cash
(***) Dividend paid in cash by the parent company
See also further details in note 23.
What’s Cooking? Annual report 2023 174 Consolidated financial statements
December 31,
2023 2022 OPERATING ACTIVITIES Result before taxes 11,586 6,198 Interest 4,943 1,322 Depreciation costs and impairments 28,510 27,833 Write-downs (*) 101 102 Provisions 245 -58 Gains & losses on disposal of fixed assets 287 -64 Cash flow from operating activities 45,672 35,333 Decrease/(increase) in receivables more than 1 year Decrease/(increase) in inventory -285 -8,888 Decrease/(increase) in receivables less than 1 year 5,662 -12,662 Decrease/(increase) in operational assets 5,377 -21,550 Increase/(decrease) in trade liabilities -4,236 22,759 Increase/(decrease) in debts relating to remuneration 3,163 2,247 Increase/(decrease) in other liabilities, accruals and deferred income 13 -426 Increase/(decrease) in operational debts -1,060 24,580 (Increase)/decrease in the operating capital 4,317 3,030 Taxes paid -6,220 -1,750 NET CASH FLOW FROM OPERATING ACTIVITIES 43,769 36,613 INVESTMENT ACTIVITIES Acquisition of intangible and tangible non-current assets -23,746 -25,082 Acquisition of shares in participations 0 -520 Total increase in investments -23,746 -25,602 Sale of intangible and tangible non-current assets 114 818 Sale of shares in associated companies Total decrease in investments 114 818 CASH FLOW FROM INVESTMENT ACTIVITIES -23,632 -24,784 FINANCING ACTIVITIES Increase/(decrease) in short-term financial debts 0 -1,367 Increase in long-term debts 1,730 8,996 Repayment of long-term debts -7,651 -5,632 Interest paid interest (via income statement) -4,943 -1,322 Acquisition of non-controlling interest -3,953 0 Capital increase (decrease) (**) 2,659 2,625 Dividend paid by parent company (***) -7,284 -7,177 CASH FLOW FROM FINANCING ACTIVITIES -19,442 -3,877 NET CHANGE IN CASH AND CASH EQUIVALENTS 695 7,952 Cash funds at the beginning of the financial year 19,353 11,544 Translation differences 265 -143 CASH FUNDS AT THE END OF THE FINANCIAL YEAR 20,313 19,353
as at
2023 and 2022
Accounting policies for financial reporting and explanatory notes
1. Summary of the key accounting principles
Declaration of conformity
What’s Cooking Group NV (“the Entity”) is an entity domiciled in Belgium.
The consolidated financial statements of the Entity include the entity
What’s Cooking Group NV and its subsidiaries (together referred to as “the group”). The consolidated financial statements were issued for publication by the Board of Directors on April 18th 2024. The consolidated financial statements were drawn up in accordance with the International Financial Reporting Standards (IFRS) as accepted within the European Union.
The consolidated statements are set out in EUR x 1000. The accounting principles are applied uniformly to the entire group and are consistent with the previous financial year.
Standards and interpretations applicable to the annual period beginning on january 1st 2023
Amendments to IAS 1 Presentation of Financial Statements and IFRS
Practice Statement 2: Disclosures about Accounting Policies
• Amendments to IAS 8 Accounting policies, changes in estimates and errors: definition of estimates
Adjustments to IAS 12 Income taxes: deferred taxes related to assets and liabilities arising from a single transaction
• Amendments to IAS 12 Income taxes: international tax reform - Pillar Two Model Rules
The above mentioned standards do not have a material impact on the balance sheet.
Standards and interpretations published, but not yet applicable to the annual period beginning on january 1st 2023
• Amendments to IAS 1 Presentation of Financial Statements :
Classification of liabilities as current and non-current (issued January 23, 2020) ;
Classification of debt as current and non-current - deferral of effective date (issued July 15, 2020) ; and Long-term debt with covenants (issued on October 31, 2022)
Amendments to IAS 1 Presentation of financial statements: classification of liabilities as current or non-current, issued January 23, 2020, clarifies a criteria in IAS 1 for classifying a liability as non-current: it requires that an entity has the right to defer settlement of the liability for at least 12 months after the reporting period.
The modifications:
specify that an entity’s right to defer settlement must exist at the end of the reporting period;
clarify that the classification is not affected by management’s intentions or expectations about whether the entity will exercise its right to defer settlement;
Clarify how loan terms affect classification; and include a clarification of the requirements for classifying debt that an entity will or may settle by issuing its own equity instruments.
On July 15, 2020, the IASB issued Classification of Liabilities as Current or Non-current - Deferral of Effective Date (Amendments to IAS 1), delaying the effective date of the above amendments by one year.
On October 31, 2022, the IASB issued Long-Term Debt with Covenants, which further amends IAS 1 to specify that covenants (i.e., terms specified in a loan agreement) that must be met after the reporting period do not affect the classification of a debt as current or non-current at the end of the reporting period. Instead, an entity is required to include information about these covenants in the notes to the financial statements.
All adjustments are effective for financial years beginning on or after January 1, 2024, with early application permitted. These adjustments have not yet been adopted by the EU.
Amendments to IAS 7 Cash Flow Statement and IFRS 7 Financial Instruments: Disclosures: Financing Arrangements with Suppliers, issued May 25, 2023, introduce additional disclosures for entities entering into financing arrangements with suppliers. The amendments are effective for financial years beginning on or after January 1, 2024, with early application permitted. However, in the year of initial application, an exemption is provided for certain disclosures. These adjustments have not yet been approved by the EU.
Amendments to IAS 21 The Effects of Changes in Foreign Exchange Rates: Lack of Exchangeability, issued August 15, 2023, clarify when a currency is exchangeable into another currency (or not). When a currency is not exchangeable, the entity estimates a spot exchange rate. This estimate aims to reflect the rate that would have been applicable on the date of the transaction in a regular exchange transaction between market participants given prevailing economic conditions. The adjustments contain no specific requirements for estimating a spot rate. As a result of the adjustments, entities will need to provide new disclosures to assess the impact of using an estimated exchange rate on the financial statements. The adjustments are effective for financial years beginning on or after January 1, 2025, with early adoption permitted. These adjustments have not yet been adopted by the EU.
Amendments to IFRS 16 Leases: Lease Obligation in a Sale-and-Leaseback, issued September 22, 2022, introduce a new model that will affect how a seller-lessee accounts for variable lease payments in a Saleand-leaseback transaction.
Under this new model, a seller-lessee:
recognize estimated variable lease payments when initially valuing a lease liability in a “Sale-and-Leaseback transaction”; and then apply the general rules for subsequent treatment of the lease liability, so that no gain or loss is recognized with respect to the right of use it retains.
These changes will not alter the processing of other leases.
The amendments apply retroactively to financial years beginning on or after January 1, 2024, with early application permitted. These amendments have not yet been adopted by the EU.
The group does not expect these new amendments to the standards to have a material impact.
What’s Cooking? Annual report 2023 175 Consolidated financial statements
Consolidated financial statements
Consolidation principles
The consolidated financial statements include the financial data of What’s Cooking Group NV and its subsidiaries, joint venture and associate. A list of these entities is included in note 33.
Subsidiaries included in the consolidation in accordance with the integral method
The following factors are also considered in determining control:
The purpose and design of the investee;
What the relevant activities are and how decisions on those activities are made;
• Whether the investor’s rights allow him to direct the relevant activities on an ongoing basis;
Whether the investor is exposed to, or has rights to, variable returns from its involvement in the investee; and
• Whether the investor has the ability to use its power over the investee to influence the extent of the investor’s returns.
The financial statements of subsidiaries are included in the consolidated financial statements from the date control begins to the date control ends. A list of the Group’s subsidiaries is included in Note 33.
Joint ventures
A joint venture is a joint arrangement whereby What’s Cooking Group NV and other parties that jointly control the arrangement have rights to the net assets of the arrangement. Joint ventures are accounted for using the equity method. The company eliminates the net results between the joint venture and the What’s Cooking Group.
On June 1, 2022, What’s Cooking became the owner of 50% of the start-up Davai BV. This joint venture, named Davai BV produces plant-based dumpling snacks under the “Davai” brand and currently sells them in Belgium and the Netherlands. As Davai BV is accounted for using the equity method, only the 50% of the equity in the balance sheet and the 50% of the net result are presented in the consolidated figures of the What’s Cooking group.
Joint ventures (under joint control) are accounted for using the equity method and are measured at cost on initial recognition. That cost of the investment includes transaction costs. Subsequent to initial recognition, the consolidated financial statements include the Group’s share of profit or loss and other comprehensive income of equity accounted investees until the date that significant influence or joint control commences.
Unrealized gains arising from transactions with equity accounted investees are eliminated to the extent of the Group’s interest in the investee. Unrealized losses are eliminated in the same way as unrealized gains, but only to the extent that there is no indication of impairment.
Foreign currencies
Foreign currency transactions
In the individual entities of the group, foreign currency transactions are recorded at the exchange rate applicable on the transaction date. Monetary assets and liabilities denominated in foreign currencies are translated at the closing rate applicable at the balance sheet date. Gains and losses resulting from foreign currency transactions and from the translation of monetary assets and liabilities denominated in foreign currencies are recognized in the income statement. Gains or losses on a non-monetary item are recognized in equity. For non-monetary items for which the gain or loss was recognized directly in equity, any foreign exchange component of that gain or loss is also recognized in equity.
Exchange differences arising from a monetary item included in the net investment in a foreign operation are recognized in other comprehensive income in the Group’s consolidated financial statements and are reclassified to profit or loss upon disposal of the net investment.
From 1/1/2022, the Group designated as part of its net investment its receivable from its foreign operation in Poland (in the amount of EUR 10 million) for which no repayment is planned in the near future. From this date, the related translation differences are recognized in other comprehensive income on the line ‘’Translation differences’’. (IAS 21.15)
Financial statements of foreign operations
All foreign operations of the Group are located in the Euro zone, with the exception of What’s Cooking Deeside UK Ltd and What’s Cooking Savoury UK Ltd in British pounds and What’s Cooking Polska Sp. Z.o.o. in Polish zloty. The assets and liabilities of these foreign entities, are converted to euro at the exchange rate applicable at the balance sheet date. The income statement of these entities is converted monthly into euro at average rates approximating the exchange rate of the transaction date. Any resulting translation differences are recognized directly through equity. For the financial statements, we used the following exchange rate:
What’s Cooking? Annual report 2023 176
1 euro
2023 2022 British pound Closing rate 0.8691 0.8869 Average rate 0.869552 0.87128 Polish zloty Closing rate 4.348 4.6899 Average rate 4.5445 4.686723
equals:
Segment information
IFRS 8 defines an operating segment as a component of an entity whose operating results are regularly reviewed by the entity’s chief operating decision maker to make decisions about resources to be allocated to the segment and assess its financial performance, and for which discrete financial information is available.
In view of its mission, its strategic lines of force and its management structure, What’s Cooking has opted as its operational segmentation basis to split up the group’s activities into the two business activities (business segments): ‘Savoury’ and ‘Ready meals’.
In addition, it provides information for the geographic regions in which the group operates.
Segment profit or loss includes revenue and expenses directly generated by a segment, including the portion of attributable revenue and expenses that can reasonably be allocated to the segment.
Segment assets and liabilities include those assets and liabilities that belong directly to a segment, including the assets and liabilities that are reasonably allocable to the segment.
Davai BV, the startup in which What’s Cooking took a 50% stake, is not included in the segment information but included as “unallocated” since it occupies a separate position within the group.
Intangible assets
Intangible assets are initially measured at cost. Intangible assets are recognized if it is probable that the Entity will enjoy the future economic benefits associated with them and if their cost can be measured reliably. After their initial recognition, intangible assets are measured at cost less accumulated amortization and any accumulated impairment losses. Intangible assets are amortized on a straight-line basis over their best estimated useful lives. The amortization period and the amortization method used are reassessed each year at the close of the reporting period.
Research and development
Expenditure on research activities, undertaken with the prospect of gaining new scientific or technological knowledge, is recognized in the income statement as an expense as incurred. Expenditure on development activities, in which research findings are applied to a plan or design for the production of new or substantially improved products and processes, is capitalized if the product or process is technically and commercially feasible and the group has sufficient resources available for its completion. The capitalized expense includes the cost of raw materials, direct labor costs and a proportionate share of overhead costs. Capitalized development expenditure is measured at cost less accumulated amortization and impairment losses.
All other development expenses are expensed as incurred. As the development expenses of What’s Cooking in 2023 and 2022 did not meet the IFRS criteria for capitalization, these expenses were recognized as an expense in the income statement.
Other intangible assets
Other expenses for internally generated intangible assets, e.g. trademarks, are expensed as incurred. Other intangible assets such as trademark patents, computer software, acquired by the group, are measured at cost less accumulated amortization and impairment losses. In 2022 and 2023, the consolidated other intangible assets of What’s Cooking consisted mainly of computer software and the capitalized customer portfolios acquired from the acquisitions.
Depreciation
Intangible assets are amortized using the straight-line method over their expected useful lives from the date they are placed in service.
The depreciation percentages applied are:
Goodwill
We speak of goodwill when the cost of a business combination at the acquisition date exceeds the group’s interest in the net fair value of the acquiree’s identifiable assets, liabilities and contingent liabilities. Goodwill is initially recognized as an asset at cost and is subsequently measured at cost less any accumulated impairment losses.
The cash-generating unit to which goodwill has been allocated is tested for impairment annually. This is also done whenever there is an indication that the unit may be impaired by comparing the carrying amount of the unit with its recoverable amount. If the recoverable amount of the unit is less than the carrying amount, the impairment loss is allocated first to the carrying amount of goodwill allocated to the unit and then to the other assets of the unit in proportion to the carrying amount of each asset in the unit. An impairment loss recognized for goodwill cannot be reversed in a subsequent period. On the sale of a subsidiary or joint venture, allocated goodwill is included in the determination of gain or loss on sale.
Tangible non-current assets
Tangible non-current assets are recognized if it is probable that future economic benefits associated with the asset will flow to the Entity and the cost of the asset can be measured reliably.
Owned tangible non-current assets are stated at cost or manufacturing cost less accumulated depreciation and any accumulated impairment losses. Cost includes, in addition to the purchase price, non-refundable taxes, if applicable, and any directly attributable costs to make the asset ready for use. The manufacturing cost of self-produced property, plant and equipment includes the direct cost of materials, direct manufacturing costs, a proportionate share of the fixed costs of materials and manufacturing, and a proportionate share of the depreciation and write-downs of assets used in manufacture.
What’s Cooking? Annual report 2023 177 Consolidated financial statements
Research and development 33.30% Computer software 20% Brand patents 10% Brand names 10%, 20% Client relationships 7%
Subsequent costs are recognized in the balance sheet in the carrying amount of an asset, or as a separate asset, only when it is probable that future economic benefits associated with it will flow to the group and the cost can be measured reliably. Improvement works are capitalized and depreciated over 4 years. Other repair and maintenance costs are recognized in the income statement in the period in which they are incurred.
Tangible non-current assets are depreciated using the straight-line method from the date of commissioning over their expected useful lives.
The
Land is not depreciated as it is assumed to have an indefinite useful life.
Impairment losses on intangible and tangible assets (other than goodwill): at each reporting date, the Group reviews its carrying amounts of tangible and intangible assets to determine whether there is any indication that an asset may be impaired. If any such indication exists, the recoverable amount of the asset is estimated in order to determine the impairment loss (if any). However, if it is not possible to determine the recoverable amount of an individual asset, the group estimates the recoverable amount for the cash-generating unit to which the asset belongs.
Recoverable amount is the higher of fair value less costs to sell and its value in use. Value in use is determined by discounting expected future cash flows using a pre-tax discount rate. This discount rate reflects the present time value of money and the specific risks associated with the asset.
If the recoverable amount of an asset (or cash-generating unit) is estimated to be less than its carrying amount, the carrying amount is reduced to its recoverable amount. An impairment loss is recognized immediately as an expense in the income statement. A previously recognized impairment loss is reversed if there has been a change in the estimates used to determine the recoverable amount, but not to an amount greater than the net carrying amount that would have been determined had no impairment loss been recognized in prior years.
Government subsidies
Government grants should be recognized only when it can be stated with reasonable certainty that:
• the group will fulfill the conditions attached to the grants; and
• grant monies will be received.
Government subsidies are systematically recognized as revenues over the periods necessary to attribute these subsidies to the related costs which they are intended to compensate. A government subsidy that is received in compensation for expenses or losses already incurred or for the purpose of providing immediate financial support to the Group without future related costs, is recognized as income in the period in which it is received. Investment subsidies are deducted from the book value of the asset concerned. Operating subsidies are recognized if they are received and reported under ‘Other Operating Government subsidies are systematically recognized as revenues over the periods necessary to attribute these subsidies to the related costs which they are intended to compensate. A government subsidy that is received in compensation for expenses or losses already incurred or for the purpose of providing immediate financial support to the Group without future related costs, is recognized as income in the period in which it is received.
Investment subsidies are deducted from the book value of the asset concerned.
Operating subsidies are recognized if they are received and reported under ‘Other Operating Income’.
Leasing
IFRS 16 requires lessees since January 1st 2019 to capitalize all lease and rental obligations on the balance sheet. The liability reflects all future lease payments associated with the lease agreement valued at current value. The asset reflects the right to use the asset during the agreed lease term.
The user rights (consisting mainly of the amount of the initial valuation of the lease debt) are valued at cost price and depreciated linearly over their estimated useful life. The user rights are shown on the balance sheet together with the tangible non-current assets under own management and the lease liabilities are shown as short and long term lease liabilities.
Each lease payment is allocated to the lease liability and the financial expenses on the other hand.
We use the following practical exemptions, as permitted by IFRS 16:
• Use of one ‘incremental borrowing rate’ for a group of leases with the same characteristics.
Use of previous estimates of loss-making lease contracts, rather than testing for impairments.
• All leases with a total term of less than 12 months are recognized in the income statement as rental expense for the financial year
• Processing all low value operating leases as short-term leases.
What’s Cooking? Annual report 2023 178 Consolidated financial statements
main depreciation rates currently
Buildings 2; 3.33; 4 & 5% Installations 5 & 10 % Machines and equipment 14.3; 20 & 33.3 % Furniture and rolling equipment 14.3; 20 & 33.3 % Other tangible non-current assets 10 & 20 %
applied:
Lease payables are measured as the discounted value of future lease payments over a specified lease term. This calculation takes into account our ‘weighted average incremental borrowing rate’ if the implicit interest rate in the contract cannot be determined. For 2022, our weighted average ‘marginal interest rate’ was 3.35%. In 2023, we had no new leases for which we did not have a contractually negotiated interest rate available.
Inventories
Inventories are valued at the lowest value of the cost or the net realizable value. The cost is calculated based on the average inventory valuation method and the FIFO method. The cost for work in progress and finished products encompasses all conversion costs and other costs incurred to get the inventories to their current location and in their current state. The conversion costs include the production costs and the attributed fixed and variable production over-head costs (including depreciation). The net realizable value is the estimated sales price that the Group believes it will realize when selling inventory in normal business, less the estimated costs of finishing the product and the estimated costs of sales.
Financial assets at amortized cost
Financial assets are classified at amortized cost when the contract has the characteristics of a basic lending arrangement and they are held with the intention of collecting the contractual cash flows until their maturity. What’s Cooking’s financial assets at amortized cost comprise trade and other receivables, short-term deposits and cash and cash equivalents in the balance sheet. They are valued at amortized cost using the effective interest method, less any impairments.
Financial assets at fair value
What’s Cooking had a call option and the former shareholder of What’s Cooking Deeside UK Ltd had a put option on the remaining 9% of the shares of What’s Cooking Deeside UK Ltd. The option was valued at fair value through finance costs in the income statement. In 2023, the put option was exercised and What’s Cooking became the owner of 100% of the shares of What’s Cooking Deeside UK Ltd.
Impairment of financial assets
At each reporting date, for the financial assets valued at amortized cost (such as trade receivables), What’s Cooking Group assesses whether there are indications for impairment at individual and/or collective level. Receivables deemed uncollectible are written off at each balance sheet date against the corresponding provision. When assessing a collective impairment, the Group uses historical information regarding the loss incurred and adjusts the results if the economic and credit conditions are such that it is probable that the actual losses will be higher or lower than historical trends suggest. Additions to and reversals of the provision for bad debts relating to trade receivables are recognized in the income statement under ‘Write-downs and provisions’.
Bank loans
Interest-bearing bank borrowings and credit excesses are initially valued at fair value and are then valued at the amortized cost price calculated on the basis of the effective interest method. Any difference between the receipts (after transaction costs) and the repayment of a loan is recognized over the loan period, in accordance with the policies for financial reporting regarding financing costs, which are applied by the Group.
Trade payables
Trade payables are initially booked at fair value and are then valued at the amortized cost price calculated based on the effective interest method. Considering the short-term nature of the trade liabilities in the Group, the trade liabilities are in fact booked at fair value.
Derivatives
The group uses derivatives to mitigate risks related to adverse fluctuations in exchange rates and interest rates arising from operating, financial and investment activities.
The group does not use these instruments for speculative purposes, does not hold derivatives and does not issue derivatives for trading purposes (trading). Derivatives are initially valued at cost price and after initial recognition are valued at fair value.
There are three types of hedging relationships:
1. Cash flow hedges: changes in the fair value of derivatives indicated as cash flow hedges are recognized in the shareholders’ equity. The non-effective part is recognized in the income statement. If the cash flow hedges of a firm commitment or an expected future transaction leads to the recognition of a non-financial asset or a non-financial liability at the time the asset or liability is booked, the profits or losses on the derivative financial instrument previously incorporated in the shareholders’ equity are recognized in the initial valuation of the asset or liability when it is booked. If the hedge of an expected future transaction leads to the inclusion of a financial asset or a financial liability, the related profits or losses on the derivative financial instrument recognized directly in the shareholders’ equity are transferred to the income statement in the same period or periods in which the acquired asset or the commitment affects the income statement. If it is expected that (part of) the loss incorporated directly into the shareholders’ equity will not be realizable in one or more future periods, the expected non-realizable part is transferred to the income statement. For hedges that do not lead to the recognition of an asset or a liability, the amounts directly included in the shareholders’ equity are transferred to the income statement in the same period or periods in which the hedged expected future transaction affects the profit or loss.
2. Fair value hedge: changes in the fair value of derivatives which were indicated and qualify as fair value hedges are recognized in the income statement, together with any change in the fair value of the hedged asset or the hedged liability which is to be attributed to the hedged risk.
What’s Cooking? Annual report 2023 179 Consolidated financial statements
3. Hedges net investments in foreign entities: are processed in a similar manner as cash flow hedges. The part of the profit or loss on the hedging instrument, which is deter-mined to be an effective hedging instrument, is recognized immediately in the shareholders’ equity; the profit or loss on the non-effective part is recognized immediately in the income statement. The profit or loss on the hedging instrument regarding the effective part of the hedge, which is directly recognized in the shareholders’ equity, is recognized in the income statement when the foreign entity is divested. The changes in the fair value of derivatives that are not classified can be recognized immediately in the income statement as cash flow hedging.
Dividends
Dividends are recognized as a liability in the period in which they are formally declared.
Provisions
A provision is recognized if:
a. The group has an existing obligation (legally enforceable or effective) as the result of an event in the past;
b. It is likely that an outflow of funds embodying economic benefits will be required to settle the obligation; and
c. The amount of the obligation can be reliably estimated.
The amount recognized as a provision must be the best estimate of the expenses required to settle the existing obligation on the balance sheet date.
If the impact is important, provisions are determined by discounting the expected future cash flows, using a discount rate ‘before tax’.
This discount rate reflects the present time value of the money and the specific risks pertaining to the obligation.
A provision for restructuring is made when the Group has approved a detailed and formalized plan for the restructuring and when the restructuring has either commenced or has been announced publicly. No provisions are made for costs relating to the Group’s normal activities. A provision for loss-making contracts will be made when the receivable economic benefits for the Group are lower than the unavoidable cost related to the obligatory quid pro quo.
Employee benefits
Employee benefits are all forms of remuneration granted by the Entity in exchange for the services provided by employees.
Employee benefits include
short-term employee benefits, such as wages, salaries and social security contributions, holiday pay, paid sick leave, profit-sharing and bonuses, and benefits in kind for the current employees;
• post-employment benefits, such as pensions and life insurance, among others;
Other long-term employee benefits including “long-term incentives” (LTI);
• Termination benefits
Retirement benefit plans
The Group provides retirement benefit plans for its employees mainly via defined contribution schemes and has a limited number of defined benefit pension schemes.
Defined contribution schemes
Contributions paid to these defined contribution schemes are recognized immediately in the income statement.
Contributions paid to these defined contribution schemes are recognized immediately in the income statement. By law, defined contribution pension plans in Belgium are subject to minimum guaranteed rates of return. Hence, strictly speaking, those plans classify as defined benefit plans which would require that the ‘projected unit credit’ (PUC) method is applied in measuring the liabilities. However, the IASB recognizes that the accounting for such so-called ‘contribution-based plans’ in accordance with the currently applicable defined benefit methodology is problematic (see also the IFRS Staff Paper ‘Research project: Post-employment benefits’ dated September 2014). Also considering the uncertainty with respect to the future evolution of the mini-mum guaranteed rates of return in Belgium, the Company adopted a retrospective approach whereby the net liability recognized in the statement of financial position is based on the sum of the positive differences, determined by individual plan participant, between the minimum guaranteed reserves and the accumulated contributions based on the actual rates of return at the closing date (i.e. the net liability is based on the deficit measured at intrinsic value, if any). The main difference between this retrospective approach and the prospective PUC method, is that benefit obligations are calculated as the discounted value of the projected benefits, assuming the minimum guaranteed rates of return currently applicable continue to apply.
What’s Cooking? Annual report 2023 180 Consolidated financial statements
Defined benefit pension schemes
The book value of the defined benefit pension scheme is determined by the present value of the pension payment liabilities, less the past service pension costs not yet recognized and with the fair value of the investments in investment funds. All actuarial gains and losses are recognized in the comprehensive income, so that the full value of the deficit or surplus of the plan is recognized in the consolidated statements. The interest costs and projected revenue of the assets in the plan are shown as net interest. The present value of the liabilities of the defined benefit plan and the related pension costs are calculated by a qualified actuary in accordance with the PUC method. The discount rate used is equal to the yield on the balance sheet date from corporate bonds of high creditworthiness with a remaining term that is comparable to the term of the Group’s liabilities. The amount recognized in the income statement consists of the pension costs allocated to the year of service, the financing cost, the expected yield from the pension fund investments and the actuarial gains and losses .
Termination benefits
Termination benefits are recognized as a liability and a cost if a group entity is demonstrably commits itself to either:
• terminate the employment of an employee or group of employees before the normal retirement date;
• or the allocation of termination benefits as a result of an offer to encourage voluntary retirement (early retirement scheme).
If termination benefits are due after twelve months following the balance sheet date, then they are discounted at a discount rate equal to the yield on balance sheet date from corporate bonds of high credit- worthiness with a remaining term that is comparable to the term of the Group’s liabilities.
Variable pay
The variable pay of clerical staff and management is calculated based on key financial figures and the balanced scorecards. The expected amount of the variable pay is recognized as a cost in the reporting period concerned.
Tax on profits
The tax on profits includes the tax on profits and deferred taxes. Both taxes are recognized in the income statement, except in those cases where it concerns components that are part of the shareholders’ equity. In this latter case, this is recognized via the shareholders’ equity. The term ‘tax on profits’ is taken to mean that which is levied on the taxable income for the reporting period, calculated at the tax assessment rates applicable at the balance sheet date, as well as the adjustments to the tax due over previous reporting periods. Deferred taxes are calculated according to the balance sheet method and arise mainly from the differences between the book value of assets and liabilities in the balance sheet and the tax basis of those assets and liabilities. The amount of deferred tax is based on the expectations regarding the realization of the book value of the assets and liabilities, whereby use is made of the tax assessment rates known on the balance sheet date. A deferred tax liability is only recognized if it is sufficiently certain that the tax credit and the unused fiscal losses can be set off against taxable profits in the future. Deferred tax assets are reduced as and when it is no longer likely that the tax saving can be realized. Deferred taxes are also calculated on temporary differences arising from participations in subsidiaries, unless the Group can decide on the time when the temporary difference is reversed and it is unlikely that the temporary difference will be reversed in the near future.
As the group’s sales have exceeded 750 million euros since 2022, reporting formalities will become applicable on a country-by-country basis from fiscal year 2023. Further GloBE rules (Pilar 2) will also become applicable, from fiscal year 2024 at the earliest.
Global minimum income tax
The Group has entities in 7 countries, with the parent company based in Belgium, which has enacted new legislation to introduce the general minimum tax.
The Group has applied a temporary mandatory deferred tax exemption for the effects of the top-up tax and records it as a current tax when due.
A new law implemented in Belgium for accounting years after 31 December 2023 introduced a Globe top up tax.
The group made an assessment and concluded that if the top-up tax had been applicable in 2023, no significant top-up tax would have been applicable as the effective tax rate was above 15% in all countries involved.
Revenue
Revenue is recognized if it is likely that the future economic benefits relating to the transaction will accrue to the Entity and the amount of the income can be determined reliably.
Turnover is reported after deduction of turnover taxes and discounts.
What’s Cooking? Annual report 2023 181 Consolidated financial statements
Sale of goods
What’s Cooking recognizes revenue from the following sources: the supply of products and services. What’s Cooking considers the supply of products to be its most important performance obligation. Revenue is recognized at the point in time when control of a product is transferred to a customer. Customers acquire control when the products are supplied (in accordance with the applicable Incoterms). The revenue amount recognized is adjusted for volume discounts. No adjustment is made for returns or for guarantees of any kind, as, based on historical information, their effect is considered immaterial. Breaking down revenue according to the timing of recognition, i.e. at a point in time or over a period, provides little added value as service contracts are immaterial compared to total product sales.
In order to encourage clients to pay immediately, the Group grants discounts for payments in cash. Such discounts are recognized as a reduction in the revenue.
Financial income
Financial income includes interest received, dividends received, foreign exchange income and the revenues from hedging instruments that are recognized in the income statement.
Interest income
Interest is recognized on a proportional basis that takes into account the effective duration of the asset to which it relates (the effective interest method).
Dividends
Dividends are recognized when the shareholder has obtained the right to receive payment. Exchange rate differences from non-operating activities and gains from hedging instruments for non-operating activities are also presented under financial income.
Expenses
Expenses per type of cost are shown in the income statement. Expenses that relate to the reporting period or to previous reporting periods are recognized in the income statement, regardless of when the expenses are paid. Expenses can only be transferred to a subsequent period if they comply with the definition of an asset.
Purchases
Purchases of trade goods, raw and auxiliary items, and purchased services are recognized at cost price, after deduction of the permitted trading discounts.
Research and development, advertising and promotional costs and system development costs
Research, advertising and promotional costs are recognized in profit or loss in the period in which these expenses are incurred. Development and system development costs are recognized in profit or loss in the period in which these expenses are incurred if they do not meet the criteria for capitalization.
Financing expenses
Financing expenses include such things as the interest on loans, exchange rate losses and losses on hedging instruments that are recognized in the income statement. Exchange rate differences from non-operating activities and losses from hedging instruments for non-operating activities are also presented under financing costs.
Financial terminology
EBIT Operating result (earnings before interest and taxation)
EBITDA Operating cash flow
Operating result (EBIT) + depreciation, write-downs and impairments of assets and negative goodwill
UEBIT Operating result (EBIT) before non-underlying expenses and revenues
UEBITDA Operating cash flow before non-underlying expenses and revenues
Operating result before non-underlying costs and revenues (UEBIT) + depreciation, write-downs and impairments of assets and negative goodwill
Non-underlying income and expenses
Operating revenues and expenses related to restructuring, impairments, discontinued operations and other activities, and transactions with a one-off impact
Management assessments and estimates
By applying the Group’s accounting policies, management must make assessments, estimates and assumptions regarding the book value of assets and liabilities that are not readily apparent from other sources. These assessments, estimates and assumptions are continually reviewed:
Critical accounting assessments when applying the entity’s accounting policies:
• What’s Cooking is involved in a number of pending claims and disputes for which management is assessing the likelihood of risk.
Key sources of estimation uncertainties: below are the key assumptions concerning the future and other key sources of estimation uncertainties at the end of the reporting period that carry a risk of a significant adjustment to the book value of assets and liabilities within the next financial year:
Management performed an annual goodwill impairment test relating to “Savoury” and “ready meals” based on the budget for the group. The budget for the group is prepared for the coming year. A number of assumptions are applied to determine the next 6 years in the overall “plan 2030”. Sensitivity analyses for reasonable changes in assumptions such as growth ratio, EBITDA margin and discount rate are set out in Note 14 - Goodwill.
• Deferred tax assets are recognized for the carry-forward of unused tax losses and temporary differences to the extent that it is probable that taxable profit will be available in the foreseeable future. In its assessment, management considers such elements as budget and tax planning opportunities (see notes 13 and 18).
What’s Cooking? Annual report 2023 182 Consolidated financial statements
• Provisions for employee benefits: defined benefit obligations are based on actuarial assumptions such as the discount rate and the expected return on plan assets. We refer to note 24 - Employee benefits.
• On April 23, 2021, What’s Cooking received a request for information from FSMA regarding the timely notification of the market in the Listeria case. On September 23, 2021, the Group received an additional request for information. February 25, 2022, the Group received a further request for information. The Group submitted responses to all requests. On July 18, 2023, What’s Cooking? agreed on a settlement with the FSMA in the amount of EUR 200,000 regarding the previous requests for information dated April 23, 2021, September 23, 2021 and February 25, 2022. There is no impact on the income statement in the current financial year since an adequate provision was made in financial year 2021.
On October 13, 2023, What’s Cooking announced the relocation of its factory in Aalsmeer. The lease agreement expires on June 30, 2024. The relocation of the company should be completed on or around March 31, 2024. All assets that are not moved were valued at estimated realization value. The restructuring has implications for 47 employees, for whom a social provision has been established.
2. Group consolidation
The group’s 2023 consolidated financial statements include What’s Cooking Group NV and consolidated subsidiaries wholly controlled by What’s Cooking? (Note 33). In 2023, What’s Cooking acquired the shares of the minority shareholder of What’s Cooking Deeside UK Ltd.
Since June 1, 2022, the group has a participation in a joint venture, namely Davai BV for 50%.
3. Reporting per segment and geographical region
What’s Cooking is a food group. We are a specialist in Europe for the development, production and sale of savoury products and freshly ready meals. The What’s Cooking? group employed about 3,000 employees, including interims, at the end of 2023 the same as the end of 2022. For details around own employees - see details by cluster in our sustainability report.
The group’s management structure corresponds to its business activities. We also align the internal and external reporting systems with the two existing business segments:
The SBU (strategic business unit) Savoury develops, produces and markets a range of fine meats (salami, cooked ham, poultry, cooked meats, pâté, salted meats, tongue and liver charcuterie) as well as vegetarian, plant-based and “blended” (hybrid) products.
The Ready meals SBU develops, produces and sells freshly ready meals: lasagna, pizza, pasta dishes and various other dishes, sauces and meal components. Consolidated
Segment results include revenues and expenses directly generated by the segment. This includes revenues and expenses that we can allocate to the segment. We do not allocate finance costs and taxes to segments.
Segment assets and liabilities include those assets and liabilities that belong directly to a segment, including assets and liabilities that are reasonably allocable to the segment. Segment assets and liabilities are presented net of income taxes.
Non-current assets by segment are intangible assets, goodwill, property, plant and equipment and financial assets. Segment liabilities are trade, personnel, tax and other liabilities that we can directly allocate to the business segment. We have not allocated all other assets and liabilities to the business segments. They are listed as “unallocated. Assets and liabilities by segment are presented before elimination of inter-segment positions. Market conditions are the basis for ‘inter-segment transfer pricing’. Segment capital expenditure is equal to the cost of assets acquired with an expected useful life of more than one year. In segment reporting, we use the same accounting policies as in the consolidated financial statements.
In both of our SBUs, savoury and ready meals, we sell our products to a broad customer base. This includes most major European discount and retail customers. The ten largest customer groups represent 67.16% of sales (2022: 67.5%). We realize sales to these customers through various contracts and products with various maturities. We do this in several countries, both for our own brands and for the customers’ own brands. The group’s customer portfolio is diversified. Nevertheless, it could have an impact on our operations if the relationship with a large customer group came to an end. In 2022 and 2023, three external customers each reached more than 10% (in 2022: 11.5% each; in 2023: 13.2% , 11.9% and 10.5% respectively) of consolidated sales. We realized the sales of these customers in both segments.
Revenue between the two segments is immaterial. Therefore, we chose to report only external group sales.
The What’s Cooking? group operates in seven geographic regions: Belgium, the Netherlands, Great Britain, Germany, France, Poland and the rest of Europe. The rest of Europe mainly includes Luxembourg, Denmark, Ireland, Portugal, Romania, Spain, Sweden and Switzerland.
The breakdown of net sales by region is based on the geographic location of external customers. The breakdown of total assets and capital expenditures by region is related to the geographical location of the assets. The investment cost by region is the cost of assets acquired with an expected useful life of more than one year. The customer’s place of residence determines the geographic region.
What’s Cooking? Annual report 2023 183
statements
financial
Consolidated financial statements
(*) Investments including new capital grants
What’s Cooking? Annual report 2023 184
Key data per business segment 2023 2022 Savoury Ready Meals Total Savoury Ready Meals Total SEGMENT INCOME STATEMENT Segment net turnover 463,593 368,733 832,326 442,518 338,867 781,385 Segment results 338 19,468 19,806 2,325 11,456 13,781 Non-allocated results -3,246 -6,134 Net financing cost -4,974 -1,449 Taxes -3,831 -1,589 Share in businesses accounted for using the equity method -98 -89 Consolidated result 7,657 4,520 SEGMENT BALANCE SHEET Segment non-current assets 107,294 109,789 217,083 110,575 109,985 220,560 Non-allocated non-current assets 7,628 5,166 Total consolidated non-current assets 224,711 225,726 Segment liabilities 113,967 72,133 186,100 112,785 73,122 185,907 Non-allocated liabilities 213,137 218,552 Total consolidated liabilities 399,237 404,459 OTHER SEGMENT INFORMATION Segment investments (*) 13,698 8,419 22,117 13,732 8,756 22,488 Non-allocated investments 2,653 886 Total investments 24,770 23,374 Segment depreciation and non-cash costs 16,620 10,870 27,490 16,281 10,539 26,820 Non-allocated depreciation and non-cash costs 1,418 1,394 Total depreciation and non-cash costs 28,908 28,214
(*) Investments including new capital grants
4. Revenue from sale of goods
Despite difficult market conditions with high inflation putting pressure on purchasing power and the sometimes problematic availability of raw materials, the group realized sales of 832.3 million euros in 2023 compared to 781.4 million in 2022. The sales increase overall of 6.5% was the result of a 5% increase in Savoury and 9% in Ready Meals. In the second half of the year, the group saw volumes pick up again in Ready Meals after a weaker first half of the year. However, pressure on volumes remains high.
The group is committed to vegetarian, plant-based and “blended” (hybrid) products and sustainability. For further details, please refer to our sustainability report.
5. Trade goods, raw and auxiliary materials
2023 2022
increase in 2023. The group is committed to being cost-conscious and sustainable through, among other things, innovation in products and packaging.
6. Services and miscellaneous goods
The cost of purchasing raw materials, consumables and trade goods increased by 3% in 2023 from EUR 495.2 million to EUR 511.9 million due to sharply higher raw material prices and general inflation.
In both 2023 and 2022, the impact of inflation was very significant and we also faced problematic availability of raw materials. The changing climate impacts harvests of, for example, durum wheat or tomatoes, essential ingredients in our products. To reduce dependency, the group has a multi-sourcing strategy, but we will not be able to exclude temporary shortages of certain raw materials in the future.
The purchase prices of meat as well as other raw materials such as cheese, milk, durum wheat and vegetables, among others, continued to
Costs rose 10% from EUR 121 million to EUR 133 million. This increase is mainly due to sharply increased costs for gas and electricity. In 2022, the cost increase was limited by the partial hedging of 2021. In 2023, the group is confronted with the sharp increase in energy prices. All 2022 hedges related to 2023 were at much less favorable rates than before. Moreover, the group had opted to purchase 50% of green energy at higher cost in 2023. Transportation costs experienced a slight decrease due to the reduced volumes. Maintenance and repair costs increased by 13.5% mainly due to inflation. Marketing and sales costs rose from EUR 3.1 million to EUR 5 million due, among other things, to the launch of new products and the continued rollout of our Come a casa® brand in Eastern Europe.
The “Other” account increases by 36.9% in 2023. This item includes office expenses, insurance and compensation to directors and management.
What’s Cooking? Annual report 2023 185 Key data per geographic region Third party turnover 2023 2022 Belgium 213,109 199,972 Netherlands 351,620 330,566 UK 90,332 87,282 France 71,783 65,729 Poland 31,920 26,686 Other 73,562 71,150 Total 832,326 781,385 Liabilities per region 2023 2022 Belgium 135,206 146,111 Netherlands 105,843 106,821 France 74,969 74,296 UK 43,195 41,022 Other 40,024 36,209 Total 399,237 404,459 Investments per region (*) 2023 2022 Belgium 16,001 12,912 Netherlands 6,165 6,479 France 1,626 2,149 UK 409 588 Other 569 1,246 Total 24,770 23,374 Non-current assets 2023 2022 Belgium 87,180 82,994 Netherlands 50,289 53,175 France 36,279 36,527 UK 21,811 23,195 Other 29,152 29,835 Total 224,711 225,726
Purchases 512,225 504,110 Change in inventory -284 -8,890 Total 511,941 495,220
Interim staff and consultants to the organisation 23,605 24,414 Maintenance and repairs 26,679 23,516 Cost of marketing and sales 4,979 3,102 Transport costs 29,278 30,439 Gas and electricity 22,893 14,620 Rent 4,617 4,685 Advisory expenses and consultants 12,241 13,735 Other 8,425 6,153 Total 132,717 120,664
2023 2022
Consolidated financial statements
7. Employee expenses
In 2023, personnel costs amounted to EUR 143,532 thousand. The employee expenses also included the expenses related to the social plan in Aalsmeer in 2023 for an amount of EUR 2,272 thousand. In 2022, they were EUR 130,826 thousand. Personnel costs show an increase in 2023 due to indexation in 2023. The number of own personnel employed decreased slightly in 2023. The number of employed personnel at year-end was 2,531 in 2023, compared to 2,554 in 2022. Also this year, the group continued to focus on employee retention, recruitment and selection.
For further details around employee benefits, please refer to note 24.
Personnel expenses can be broken down as follows:
9. Other operating income and expenses
Other operating expenses increase from EUR 2.4 million in 2022 to EUR 2.9 million in 2023 due to increased environmental taxes for wastewater, among other things.
Other operating income increases from EUR 3.6 million to EUR 4.2 million. This EUR 4.2 million (in 2023) is mainly composed of non-recurring income including claims received following quality complaints and an insurance claim to offset costs incurred during the financial year.
8. Write-downs and provisions
What’s Cooking? Annual report 2023 186
financial statements
Consolidated
2023 2022 Wages and salaries 102,392 94,986 Social security contributions 23,084 21,725 Other employee expenses 18,056 14,115 Total 143,532 130,826 Number of employees expressed in FTEs (excl. temporary employees) at year end 2,441 2,454
2023 2022 Write-downs 153 439 on inventories 189 309 on trade receivables -36 130 Provisions 245 -58 Total 398 381
2023 2022 OTHER OPERATING INCOME Recovery of wage-related costs 726 587 Recovery of logistics costs 91 81 Grants 257 548 Profits from the disposal of assets 17 166 Insurance recoveries 1,949 130 Claims 301 927 Rent 5 5 Recovery local taxes 62 Others 897 1,111 Total 4,243 3,617 OTHER OPERATING EXPENSES Local taxes 2,412 1,977 Realised loss on disposal of assets 303 102 Claims 36 29 Others 160 323 Total 2,911 2,431 Other operating income and expenses 1,332 1,186
EBITDA increases from EUR 36 million in 2022 to EUR 46 million in 2023. Underlying EBITDA increases 31% from EUR 38 million in 2022 to EUR 50 million in 2023. This despite pressure on volumes, as expected. Transparent pass-through of cost increases, in addition to continuous control of cost increases throughout the year, was a crucial factor in improving results.
Non-underlying EBITDA costs (EUR 4 million in total in 2023) in the current financial year consist mainly of costs related to the transfer of production in Aalsmeer to other Dutch sites (EUR 3 million). The other costs relate to operational costs related to the rebranding of Ter Beke into “What’s Cooking?” at the beginning of 2023 and costs for the development of new vegetable products to be marketed in 2024. Last year, non-underlying costs were mainly linked to the Imperial-Stegeman acquisition file. The impact on costs in 2023 of striking off the deal with Imperial-Stegeman was negligible.
In the Ready Meals SBU, sales increased by 9% from EUR 339 million to EUR 369 million mainly due to transparent pass-through of cost increases. We also succeeded in introducing a large number of innovative products both in the UK and on the European continent. We note that our focus on quality in a broad sense is paying off despite the volume decline compared to last year. In the second half of the year we saw volumes increase again compared to the first half. The successful introduction of a number of plant-based and vegetarian products also gives us optimism for further growth of our product portfolio. The ready meals industry in Europe continues to offer good prospects. Our strategy of continuing to supply quality products is bearing fruit, as a number of customers have returned to What’s Cooking?. The right price-quality mix is crucial for consumer loyalty.
This portfolio offers a range of internationally known and regionally adapted quality and mostly nutritional products for every budget. Our emphasis on quality and unburdening customers has led to the winning back of a number of contracts, resulting in a nice growth in volumes in the second half of the year.
Modified sales contracts that better address purchase price volatility, as well as a number of investments in our plants that support production efficiency, drove a 41% improvement in the segment’s underlying EBITDA, from EUR 22 million in 2022 to EUR 31 million in 2023.
Savoury SBU sales increased 5% from EUR 443 million to EUR 464 million, mainly due to the transparent pass-through of increased labor and raw material costs. Volume in the business unit declined as expected and in line with the market. Furthermore, the business unit launched a number of new plant-based products and there are concrete plans to develop this further in the coming months.
The evolving product portfolio also includes “blended” (hybrid), vegetarian and plant-based products, whose importance in the segment will gradually increase. We also reintroduced a number of innovative packaging concepts for our customers in 2023. The Group carries “sustainability” as a high priority.
Underlying segment EBITDA remained stable compared to 2022: EUR 21 million in 2023, up from EUR 21 million in 2022.
The announced restructuring in Aalsmeer, Netherlands is on schedule and will allow the group to produce in an even more sustainable way and respond to customer demands. Thanks to the investments made in Ridderkerk and Wijchen, we can deliver our products even fresher, tastier and with improved service, packaged in very attractive packaging. During the restructuring, the group put maximum effort into guiding the employees involved from job to job.
11. Financial income
Finance income consists mainly of foreign exchange differences and is in line with last year.
12. Financing costs
What’s Cooking? Annual report 2023 187
2023 2022 EBITDA 45,468 35,861 Depreciations costs and impairments -28,510 -27,833 Impairments, write offs and provisions -398 -381 Result of operating activities (EBIT) 16,560 7,647 Costs of acquisitions 2,259 Rebranding expenses 882 Restructuring costs 3,444 Innovation costs plant based products 600 Underlying operating result (UEBIT) 21,486 9,906 EBITDA 45,468 35,861 Costs of acquisitions 0 2,259 Rebranding expenses 882 0 Restructuring costs 2,922 0 Innovation costs plant based products 600 0 Underlying EBITDA 49,872 38,120
10. Result of operating activities
2023 2022 Interest income 40 12 Positive exchange rate differences 981 908 Other 529 385 Total 1,550 1,305
2023 2022 Interest cost on loans 4,728 1,099 Interest cost on leasing 215 223 Negative exchange rate differences 856 584 Bank charges 591 726 Revaluation of financial instruments 0 0 Other 134 122 Total 6,524 2,754 Consolidated financial statements
Financial costs have more than tripled. They increase from EUR 2.8 million in 2022 to EUR 6.5 million in 2023. This increase is due to the increased Euribor on the financial market.
Our financial debt has fallen even further, which translates into a decrease in the leverage ratio (net debt to UEBITDA). A better leverage ratio normally results in a lower interest rate, but this advantage is completely cancelled out by the increased Euribor in 2023.
Moreover, we recorded a small net positive exchange rate result on both the pound and the Polish Zloty. 13.
Taxes in the current financial year are 33.1% compared to 25.6% in 2022.
As of 1/4/2023, the tax rate in the UK is also now 25%. In 2022, it was 19%. Now all the group’s companies except What’s Cooking Polska Sp.z.o.o. have a tax rate of 25% or higher.
As of January 2022, the transfer pricing model was also applied to What’s Cooking France SAS and What’s Cooking Polska Sp.z.o.o. With the exception of What’s Cooking Deeside UK Ltd (and, of course, Davai BV), the new transfer pricing model is now applied to all companies within the group.
Goodwill arises when the cost of a business combination at the acquisition date exceeds the group’s interest in the net fair value of the acquiree’s contingent liabilities, identifiable assets and liabilities.
The group chose to allocate goodwill to segments. The risk profile of the business combinations acquired so far was almost identical to the existing business, and/or the cash flows were fully connected. What’s more: these business combinations went from the acquisition entirely into the segment. This makes it impossible for us to recognize, let alone track, any separate cash flows at a lower level. Management reporting is therefore done at the segment level.
The group performs an annual “impairment analysis” on goodwill. This is done using the discounted cash flow method. When the recoverable amount of the segment is less than the carrying amount, we first allocate the impairment loss to the carrying amount of goodwill. Next come the other assets of the unit, in proportion to the carrying value of each asset in the segment.
In 2023, goodwill is EUR 33,714 thousand (2022: EUR 33,714 thousand) for Savoury. For ready meals, it is EUR 44,327 thousand (2022: EUR 44,157 thousand). The decrease in SBU ready meals is a translation difference.
The basis for the above “impairment analysis” consists of:
The budget estimate for the following year of its own operating cash flows. For each segment separately. This budget estimate is the result of a detailed analysis of all known and estimated changes in sales, margins and costs. With adaptation to the commercial environment of each segment. We strive for a balance between challenge and realism. Cash flows for the 4 subsequent years were applied as follows:
• An estimated growth in sales of between +0.8% and 9.2% for SBU Savoury and 3.6% and 10.7% for SBU Ready Meals. The negative evolution short-term arises from a decrease in expected volumes for the coming years given a decline in consumption of traditional savoury products. The group is confident of a recovery in the following years in both segments due to the new strategic emphases that should bring volume growth.
Inflation expectations were kept low and stable in the simulations because the group assumes it will pass on inflation or deflation of costs to customers. The same is valid for energy prices. For 2024 and
What’s Cooking? Annual report 2023 188
Consolidated financial statements
Taxes
booked in income statement 2023 2022 Tax on profits Financial year 4,925 3,176 Previous financial years 541 265 Deferred tax liabilities Effect of temporary differences -1,635 -1,852 Total tax in the income statement 3,831 1,589
Taxes
Relationship between tax burden and the accounting profit 2023 2022 Accounting profit before tax 11,586 6,198 Tax at Belgian tax rate (2022: 25% and 2023: 25%) 2,897 1,550 Effect of the different tax rates of the foreign companies -385 -510 Effect of not recognising DTA during the financial year 437 529 Effect timing differences -485 Effect of the expenses not deductible for tax purposes 853 524 Other effects: minimum tax 29 -19 Actual tax burden 3,831 1,589 Effective tax percentage 33.1% 25.6% 14. Goodwill 2023 2022 GOODWILL Start of the financial year 79,611 80,072 Acquisitions 0 0 Transfers and decommissioning 0 0 Translation differences 170 -461 End of the financial year 79,781 79,611 IMPAIRMENTS Start of the financial year 1,740 1,740 Impairment losses 0 0 Transfers and decommissioning 0 0 End of the financial year 1,740 1,740 Net book value 78,041 77,871
partly for 2025, energy prices are already fixed at admittedly higher prices compared to the past but this was also factored into the expected sales prices and margins. Except for salary and interest rate expectations, no public indices for the future are available for most cost drivers. The estimates involve a “management best estimate” in this regard.
Estimated EBITDA margin. This margin corresponds to the projections for the coming year and to the long-term targets of each segment.
• We adjust the calculated cash flows for each year with the replacement investments we think we will need to keep the existing production equipment operational. And with the movements in working capital. These differ for each segment.
• To calculate residual values, a growth rate of 3% is applied - a value also equal to the ‘risk free rate’ used in determining the average weighted cost of capital after taxes (WACC).
• We discount these cash flows at an estimated average (WACC) of 9.64% (2022: 8.35%). The basis for this calculation is based on the average between the short- and long-term WACC after tax. The basis for this takes into account a capital cost for equity on the one hand and a cost for debt on the other.
• The capital cost of equity considers the following elements:
• The ‘risk free rate’
• The Equity Risk Premium based on various market studies.
• A risk premium calculated based on the “Guide to Cost of Capital
The cost of debt capital considers the following elements:
• A basic interest cost
• A “Corporate spread” based on the 5-year Euro AAA and BB consumer staples interest. A tax rate of 27%.
The recoverable amount exceeds the carrying value in both SBUs.
Therefore, the impairment analysis does not result in impairment losses in any segment. Overall, we may say that the risk of impairment is higher in the Savoury SBU than in the Ready meals SBU.
Even when the parameters are estimated more conservatively, the recoverable amount exceeds the carrying amount, so no impairment applies in these scenarios either. Following sensitivity analyses were performed:
• Increasing the WACC by 30 basis points and reducing the long-term growth rate by 100 basis points;
Increasing WACC by 30 basis points and reducing EBITDA residual values by 50 basis points;
In 2023, the group invested EUR 1.3 million in intangible assets, including an advanced supply chain planning system. An optimized supply chain planning system should allow us to streamline and improve our logistics processes.
In 2022, investments in intangible assets were limited to EUR 0.3 million.
What’s Cooking? Annual report 2023 189 Consolidated financial statements
2023 2022 Software Brands, licences and patents Customer relationships R&D Total Software Brands, licences and patents Customer relationships R&D Total ACQUISITION VALUE Start of the financial year 25,517 2,179 24,014 251 51,961 25,555 2,236 24,620 193 52,604 Group consolidation extension 0 0 Acquisitions 1,272 1,272 261 58 319 Transfers and decommissioning -111 -111 -278 -278 Transfer from / to other entries -65 -65 -6 -6 Translation differences 162 -80 224 306 -15 -57 -606 -678 End of the financial year 26,775 2,099 24,238 251 53,363 25,517 2,179 24,014 251 51,961 DEPRECIATION Start of the financial year 23,491 2,074 8,915 175 34,655 22,621 1,975 7,387 157 32,140 Group consolidation extension 0 0 Depreciation* 867 105 1,731 19 2,722 1,158 151 1,729 18 3,056 Transfers and decommissioning -111 -111 -278 -278 Transfer from / to other entries 0 0 Translation differences 140 -80 86 146 -10 -52 -201 -263 End of the financial year 24,387 2,099 10,732 194 37,412 23,491 2,074 8,915 175 34,655 Net book value 2,388 0 13,506 57 15,951 2,026 105 15,099 76 17,306
15. Intangible non-current assets
Consolidated financial statements
What’s Cooking? Annual report 2023 190
16. Tangible non-current assets 2023 Land and buildings Installations, machines, and equipment Furniture and rolling equipment Leasing Other Assets under construction Total ACQUISITION VALUE Start of the financial year 128.838 365.508 6.049 14.918 115 2.194 517.622 Group consolidation extension 0 Acquisitions 3.263 13.366 583 2.261 4.025 23.498 Transfers and decommissioning -1.003 -16.941 -526 -1.193 -78 -33 -19.774 Transfer from / to other entries 57 863 68 -923 65 Translation differences 1.046 1.858 36 11 11 2.962 End of the financial year 132.201 364.654 6.210 15.997 37 5.274 524.373 DEPRECIATION Start of the financial year 86.733 293.368 4.672 8.647 110 44 393.574 Group consolidation extension 0 Depreciation * 4.021 18.240 522 2.754 5 0 25.542 Transfers and decommissioning -986 -16.590 -522 -1.200 -78 -19.376 Translation differences 401 1.048 22 4 3 1.478 End of the financial year 90.169 296.066 4.694 10.205 37 47 401.218 IMPAIRMENT Start of the financial year 547 0 0 0 0 0 547 Group consolidation extension 0 Addition* 655 414 1.069 Reduction* -547 -547 Transfers and decommissioning 0 End of the financial year 655 414 0 0 0 0 1.069 NET CAPITAL GRANTS Start of the financial year 159 1.688 4 0 0 0 1.851 Group consolidation extension 0 New allocations 0 Other 0 Depreciation * -3 -261 -12 -276 End of the financial year 156 1.427 -8 0 0 0 1.575 Net book value as per 31 December 2023 41.221 66.747 1.524 5.792 0 5.227 120.511
Consolidated financial statements
We include the lines marked * in notes 15 and 16 in the income statement, in the amount of depreciation and impairments on fixed assets.
In 2023, the group invested EUR 24.8 million (2022: EUR 23.4 million), of which EUR 23.5 million in property, plant and equipment and EUR 1.3 million in intangible assets. This mainly concerns the continuation of effi-
ciency investments, adjustments in infrastructure and refrigeration and other investments to improve the sustainability of our sites and production
What’s Cooking? Annual report 2023 191 2022 Land and buildings Installations, machines, and equipment Furniture and rolling equipment Leasing Other Assets under construction Total ACQUISITION VALUE Start of the financial year 126,117 355,520 5,556 17,055 115 163 504,526 Group consolidation extension 0 Acquisitions 3,328 15,639 577 1,387 2,129 23,060 Transfers and decommissioning -48 -4,497 -25 -3,521 -8,091 Transfer from / to other entries 93 7 -94 6 Translation differences -559 -1,247 -66 -3 -4 -1,879 End of the financial year 128,838 365,508 6,049 14,918 115 2,194 517,622 DEPRECIATION Start of the financial year 83,107 280,190 4,283 9,068 103 44 376,795 Group consolidation extension 0 Depreciation * 3,890 18,054 456 2,730 7 0 25,137 Transfers and decommissioning -48 -4,116 -25 -3,149 -7,338 Translation differences -216 -760 -42 -2 -1,020 End of the financial year 86,733 293,368 4,672 8,647 110 44 393,574 IMPAIRMENT Start of the financial year 600 0 0 0 0 0 600 Group consolidation extension 0 Addition* 0 Reduction* -53 -53 Transfers and decommissioning 0 End of the financial year 547 0 0 0 0 0 547 NET CAPITAL GRANTS Start of the financial year 201 1,944 8 0 0 0 2,153 Group consolidation extension 0 New allocations 5 5 Other 0 Depreciation * -47 -256 -4 -307 End of the financial year 159 1,688 4 0 0 0 1,851 Net book value as per 31 December 2022 41,399 70,452 1,373 6,271 5 2,150 121,650
The group is also committed to further greening its car fleet. 47% of newly commissioned leased cars in 2023 will be fully electric cars compared to 15% in 2022.
In 2023, EUR 13.7 million was invested in SBU Savoury. Mainly concerns investments in new cooling systems (master cooling plan) to meet the new ecological and legal requirements and reduce our carbon footprint, new slicers, new packaging machines and an expansion of the grill capacity. Adjustments were also made in Ridderkerk and Wijchen to facilitate the transfer of volumes from Aalsmeer.
In the Ready Meals SBU, 8.4 million was invested by 2023. The investment program is mainly focused on product, packaging and process improvements. These include replacement investments and sustainability projects at the various production sites.
17. Equity method participations
On June 1, 2022, the Group became a 50% owner of the start-up Davai BV.
Davai makes plant-based dumpling snacks under the “Davai” brand and currently sells them in Belgium and the Netherlands. As expected, the value of the participation has further decreased compared to 2022 due to the negative result of Davai BV on December 31, 2023.
18. Deferred tax assets and liabilities
We can assign deferred tax assets and liabilities to the following headings:
Reconciliation of the above mentioned financial information regarding the net book value of the net book value of the participating interest.
In 2023, the group did not recognize EUR 11,415 thousand deferred tax assets on tax loss carryforwards (2022: EUR 10,949 thousand). The group is not sufficiently certain that these will be realized soon. The tax loss carryforwards are indefinitely transferable over time.
From 2019, a deferred tax benefit was expressed with respect to Poland for EUR 5 million because What’s Cooking Polska is located in a reconversion zone. From 2020, a portion of the expressed tax benefit is reversed annually because What’s Cooking Polska closed its financial year with a profit since 2020. This benefit is limited until 2026.
What’s Cooking? Annual report 2023 192
financial statements
Consolidated
2023 2022 Joint venture 333 431 Associates Total 333 431 1/6/2022 31/12/2022 31/12/2023 Summary financial information Non-current assets 10,665 Current assets 30,827 Debts -63,901 Operating income 32,415 Operating expenses -61,815 Financial result -60 Result before taxes -29,460 Net result -29,460
Net assets of the joint venture -22,409 Capital increase 440,000 Group participation percentage in the joint venture 50.00% 208,796 Acquisition price 520,000 520,000 520,000 Goodwill 311,204 Share in the result after the acquisition -89,397 -187.436 Value joint venture 430,603 332.564
2023 2022 Tangible non-current assets 5,004 4,917 Receivables Provisions -75 -92 Debts 790 Transferred losses 0 Deferred tax liabilities 4,929 5,615 2023 2022 Tangible non-current assets 2,974 2,331 Receivables 0 Provisions 486 484 Debts -6 -157 Tax losses carried forward 6,354 5,734 Deferred tax assets 9,808 8,392
19. Other long-term receivables
For inventory write-downs, see Note 8.
Inventories are in line with last year. They increased from EUR 46.9 million to EUR 47.3 million. Stocks of raw materials and consumables decreased slightly but stocks of finished goods increased. The supply of certain raw materials, and more specifically certain vegetables, led us to maintain higher safety stocks while we were able to reduce packaging stocks.
21. Trade and other receivables
Our trade receivables are non-interest bearing.
The average number of days of customer credit for the group is 41 days (2022: 46 days).
In 2023, we record a positive release of EUR 35 thousand on write-downs on trade receivables in the income statement (EUR 130 thousand cost in 2022).
The percentage of trade receivables that have been due for more than 60 days is 0.1% in 2023 and 2022 (see also note 27).
To cope with future inflation (deflation) of costs, most new contracts were concluded for a limited period of time or included automatic indexation for the cost of key commodities.
22. Cash and cash equivalents
Cash is held with reputable banks.
The cash investments involved an overnight deposit with a reputable bank.
23. Shareholders’ equity
Dividends
The General Meeting of May 25, 2023 approved the Board of Directors’ proposal of a scrip dividend (gross EUR 4.00/share). The shareholders of the group opted for the contribution of their dividend rights in exchange for new shares instead of the payment in cash for 52.15% of their shares entitled to a dividend.
This results for What’s Cooking in a strengthening of the equity of 2.659.154,40 EUR (capital and share premium) through the creation of 35.174 new shares. As a result, the total number of What’s Cooking shares as of July 6, 2023 will be: 1,856,180. The creation of new shares will also increase the denominator in the calculation of earnings per share for the entire financial year. The remaining dividends were paid out in cash on July 7, 2023. Including total withholding tax, this represents a total cash distribution of EUR 4,624,869.60. This capital increase reduces the debt ratio by approximately 0.8% compared to a 100% cash dividend payout.
The scrip dividend avoids (in proportion to the contribution of dividend rights to the capital of What’s Cooking?) a cash-out to the company.
193 What’s Cooking? Annual report 2023 Consolidated financial statements
2023 2022 Receivables and securities in cash 67 76 Total 67 76 20. Inventories 2023 2022 Raw and auxiliary items 28,774 29,510 Work in process 6,412 6,341 Finished products 11,457 10,619 Goods for resale 621 419 Total 47,264 46,889
2023 2022 Trade receivables 94,362 99,350 VAT to be reclaimed 3,954 3,474 Taxes to be reclaimed 548 556 Adjustment accounts 2,666 3,287 Empties 4,354 4,960 Other 1,065 864 Total 106,949 112,491
2023 2022 Cash investments 2,305 2,733 Current accounts 18,004 16,609 Cash 4 11 Total 20,313 19,353
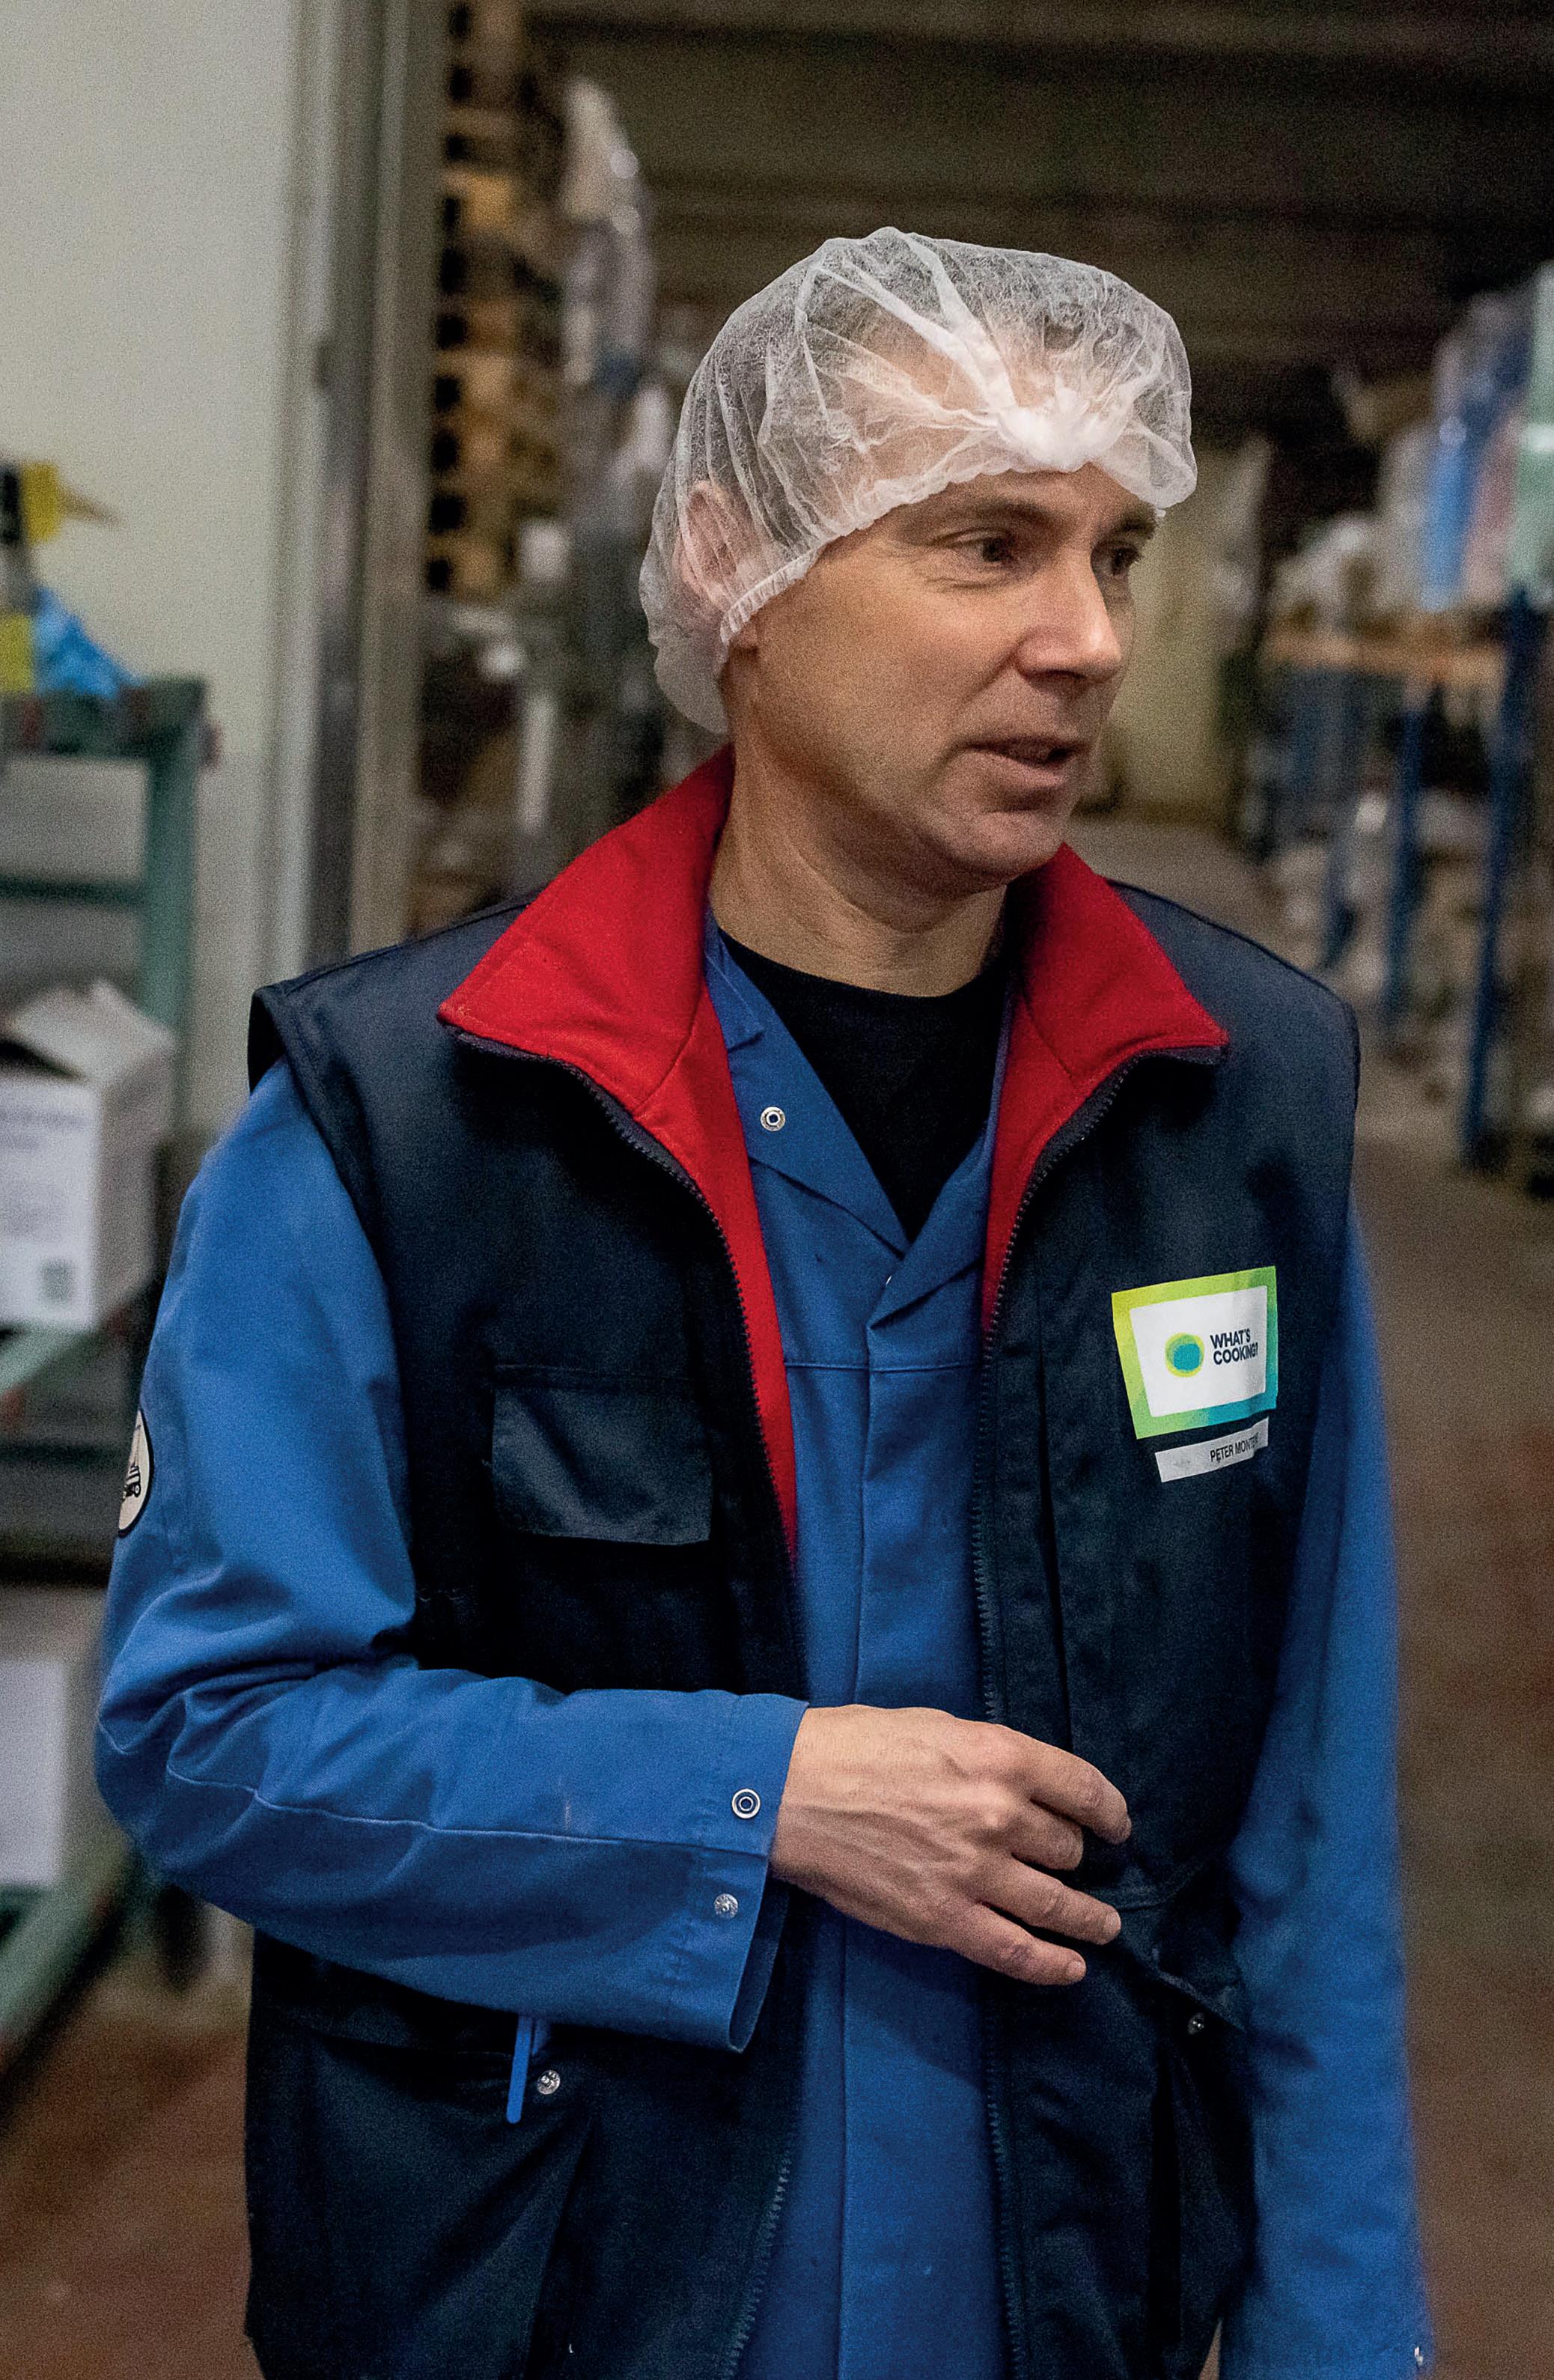
24. Employee benefits
Provisions for pensions and similar liabilities
The group and its subsidiaries provide for pension plans and other employee benefits. At December 31, 2023, the total net liability for pension plans and similar obligations was €3,695 thousand for the group’s Belgian and French companies. At December 31, 2022, it was €3,442 thousand.
obligations under IAS 19 Defined benefit plan Other provisions Total provisions 1 January 2022 3,027 851 3,878 Group consolidation extension Service costs 1,178 1,178 Interest costs and income 8 8 Actuarial effect by OCI -441 -441 Payments 0 Allocations and redemptions -22 -22 Other -1,159 -1,159 31 December 2022 2,613 829 3,442 Group consolidation extension 0 Service costs 856 856 Interest costs and income 61 61 Actuarial effect by OCI 349 349 Payments 0 Allocations and redemptions 240 240 Other -1,253 -1,253 31 December 2023 2,626 1,069 3,695 What’s Cooking? Annual report 2023 195
What’s Cooking? Annual report 2023 196
Employee benefits and provisions for pension and similar obligations 2023 2022 Defined benefit pension schemes Net liability / (asset) 2,626 2,613 Of which liabilities 17,548 17,814 Of which investments in investment funds -14,922 -15,201 Amounts recognised in the income statement: Pension costs allocated to the year of employment 856 1,178 Interest cost 61 8 Expected return on investments in investment funds Recognised actuarial (profits)/losses Past service pension costs Losses/ (profits) from curtailments or settlements 3 -10 Administrative expenses 28 26 Cost recognised in the income statement regarding defined benefit pension schemes 948 1,202 Amounts allocated to the shareholders' equity via the comprehensive result (OCI) -431 -780 Recognised actuarial (profits)/losses 349 -441 Cumulative of via OCI recognised actuarial results at the beginning of the period -780 -339 Present value of the gross liability at the beginning of the year 17,814 24,164 Impact of PUC method on the Belgian fixed contribution plans Employer's contributions Interest cost 609 144 Pension costs allocated to the year of employment 802 1,057 DBO( profit) loss for the period -35 -5,983 Other -1,642 -1,568 Present value of the gross liability at the end of the year 17,548 17,814 Fair value of the investments in investment funds at the beginning of the year -15,201 -21,145 Expected employer's contributions -1,246 -1,104 Expected employee's contributions -47 -39 Expected benefits paid (excl. interest) 2,057 1,989 Expected return on investments in investment funds Expected taxes on contributions paid 133 119 Expected administrative expenses 27 24 Expected value of the investments in investment funds at the end of the year -14,277 -20,156 Fair value of the investments in investment funds to the beginning of the year -15,201 -21,145 Impact of PUC method on the Belgian fixed contribution plans Actual employer's contributions -1,282 -1,157 Actual employees contributions -41 -37 Actual benefits paid 1,595 1,589 Interest revenue -553 -135 Actual taxes on contributions paid 141 127 Actual administrative expenses 28 26 Actuarial profit (losses) on the investments in investment funds 392 5,533 Fair value of the investments in investment funds at the end of the year -14,921 -15,199 Plan assets gain (loss) due to experience adjustments -1 -2 Fair value of the investments in investment funds at the end of the year -14,922 -15,201
Consolidated financial statements
The primary actuarial assumptions are:
Defined contribution schemes
The companies of What’s Cooking? pay contributions to publicly or privately managed pension or insurance funds. Subject to the application of the law of December 18, 2015, the companies of the group have no further payment obligations once the contribution has been paid. Indeed, the minimum guaranteed reserves are covered by the value of plan assets.
The minimum guaranteed returns obtained (cf. Law Dec. 18, 2015):
• For contributions paid after Jan. 1, 2016: here the OLO interest rate determines the variable minimum yield. This ranges from 1.75% to 3.75%.
• For contributions paid up to the end of 2015: here the statutory rate of return continues to apply until employees retire, namely 3.25%, and 3.75%.
These pension plans guarantee a minimum rate of return. We therefore consider them defined benefit plans.
Every year, What’s Cooking? has a full actuarial calculation performed. This is done according to the PUC method. The analysis of the pension plans shows a limited difference between the legally guaranteed minimum return and the interest guaranteed by the insurance institution. At the end of 2023, this net liability is EUR 60 thousand (2022: EUR 36 thousand).
The periodic contributions represent a cost of the year in which the related rights are acquired. In 2023, this expense amounts to EUR 5,567 thousand (2022: EUR 4,075 thousand).
We recognize costs for IAS 19 under personnel expenses. We include the interest component in the financial result.
Other provisions
Other provisions in 2023 and 2022 consisted mainly of a provision in favor of employees in the Netherlands to meet additional costs due to changes in place of employment and the provision for additional remuneration of the CEO, other members of the executive committee and other managers.
What’s Cooking? Annual report 2023 197 Consolidated financial statements
2023 2022 Belgium France Belgium France Discount rate 3.75% 3.80% 3.60% 3.60% Future salary increases including inflation 2.50% 3.35% 2.60% 3.35% Inflation 2.10% 2.95% 2.20% 2.95%
Interest-bearing liabilities 2023 Maturity period Within the year Between 1 and 5 years After 5 years Total Interest-bearing liabilities Credit institutions 0 75,000 0 75,000 Lease liabilities 2,615 3,595 6,210 Total 2,615 78,595 0 81,210 2023 Maturity period Within the year Between 1 and 5 years After 5 years Total Other liabilities 0 0 0 2022 Maturity period Within the year Between 1 and 5 years After 5 years Total Interest-bearing liabilities Credit institutions 340 80,086 0 80,426 Lease liabilities 2,452 4,231 6,683 Total 2,792 84,317 0 87,109 2022 Maturity period Within the year Between 1 and 5 years After 5 years Total Other liabilities 0 0 0
25.
25.1. Loans from credit institutions
The loans from credit institutions in 2023 include:
• EUR 75 million of long-term loans, where the interest rate is regularly revised for agreed periods of less than one year.
The loans from credit institutions in 2022 include:
• Today, the group has no current loans with fixed interest rates. EUR 80.4 million long-term loans, with interest rates regularly revised for agreed periods of less than one year
Interest on loans from credit institutions - level at year-end:
Minimum payments to credit institutions (including interest) are:
• The costs of setting up the RCF (Revolving Credit Facility) amounted to EUR 0.7 million, were amortized over the original term of the RCF (5 years).
• The Revolving Credit Facility with a consortium of three banks was extended during 2022 for a period of 2 years, until June 30, 2025. The limited interest rate hedges on the RCF expired in mid-2023. As of the end of 2023, there are no interest rate hedges outstanding.
At the end of 2023, the group has leasing debts of EUR 6.2 million compared to EUR 6.7 million at the end of 2022. The group aims to purchase rather than lease all its production-related machinery and rolling stock (such as forklifts). The main open lease payables are related to the fleet of lease cars and the rent of the building in Wijchen, the Netherlands.
The group has sufficient short-term credit lines to meet its short-term needs. The group has not pledged any assets to meet its obligations to credit institutions. Nor has it received any guarantees from third parties.
On June 26, 2018, What’s Cooking entered into long-term financing with a consortium of 3 banks in the form of a Revolving Credit Facility (RCF) with a term of 5 years and the option to extend for 2 years. This extension option was lifted in 2022. As a result, the group has EUR 175 million in guaranteed credit lines. The RCF is conditional to respecting a net financial debt/adjusted EBITDA ratio of 3. In case of new acquisitions, a temporary excess up to 3.5 is accepted.
The group fulfilled its covenants in both 2022 and 2023.
On Feb. 22, 2024, What’s Cooking signed a new 5-year financing agreement for a Revolving Credit Facility (RCF) of EUR 175 million with a consortium of existing and new banks. The agreement can be extended for 2 one-year periods if agreed by all parties. This agreement refinances the existing RCF and ensures the necessary financial stability in an uncertain volatile macroeconomic and geopolitical context. The RCF allows What’s Cooking? to further realize its Sustainable Profitable Growth Plan 2030. The financing is unsecured and allows the group to take on a debt ratio of up to 3.5 times EBITDA. In case of new acquisitions, a temporary excess of up to 4.0 times EBITDA is accepted. The financing agreement also provides the option to link the margin to the group’s sustainability objectives. The group expects to fulfill its newe covenants in 2024.
What’s Cooking? Annual report 2023 198 Consolidated financial statements
2023 2022 outstanding loan amount on 31/12/2023 Interest % outstanding loan amount on 31/12/2022 Interest % Loans with variable interest rate Loans in EURO 75,000 K EUR 4.525% 70,000 K EUR 3.26% Loans in EURO 0 K EUR 0.00% 8,000 K EUR 2.50% loans in pounds 0 K EUR 0.00% 1,635 K EUR 4.07% Loan KK Fine Foods in Pounds 0 K EUR 0.00% 791 K EUR 5.65%
2023 2022 Less than 1 year 3,394 2,989 More than 1 year and less than 5 years 81,788 85,348 More than 5 years 0 0
25.2. Lease liabilities:
The group leases its cars and some trucks under a number of operating leases. At the end of 2010, the group entered into an operating lease agreement for a new state of the art ‘value added logistics platform’ in Wijchen. There What’s Cooking centralizes the slicing activities of What’s Cooking Wijchen BV and the Dutch logistics activities.
IFRS 16 (standards and interpretations applicable from Jan. 1, 2019) requires the lessee to capitalize all lease and rental obligations on the balance sheet. The liability reflects all future lease payments associated with the lease agreement valued at current value. The asset reflects the right to use the asset during the agreed lease term.
What’s Cooking has applied IFRS 16 effective January 1, 2019, in accordance with the transitional provisions, using the modified retrospective method. Specifically, this means that the cumulative effect of applying IFRS 16 is recognized as an adjustment to the opening balance of retained earnings as of January 1, 2019, without adjustment of comparative figures.
As a result of the adoption of IFRS 16, we recognized lease liabilities for leases previously classified as operating leases in accordance with IAS 17. These lease payables were measured at the present value of the remaining lease obligations, and discounted at our “incremental interest rate “applicable at January 1, 2019. Our weighted average “marginal interest rate” used to measure lease liabilities as of January 1, 2019 was 3.35%.
What’s Cooking? Annual report 2023 199
financial statements 31/12/22 Cash Flow non-cash adjustments 31/12/23 Acquisitions opening balance IFRS 16 Exchange rate adjustment fair value adjustment Long term interest-bearing liabilities Credit institutions 80,086 -5,093 7 75,000 Lease liabilities 4,231 -641 5 3,595 Short term Interest-bearing liabilities Credit institutions 340 -347 7 0 Lease liabilities 2,452 160 3 2,615 Other long term non-interest bearing liabilities 0 0 Other short non-interest bearing liabilities 3,981 -4,060 79 0 Total 91,090 -9,981 0 0 101 0 81,210 31/12/21 Cash Flow non-cash adjustments 31/12/22 Acquisitions opening balance IFRS 16 Exchange rate adjustment fair value adjustment Long term interest-bearing liabilities Credit institutions 74,156 6,121 -191 80,086 Lease liabilities 5,572 -1,340 -1 4,231 Short term Interest-bearing liabilities Credit institutions 2,725 -2,385 340 Lease liabilities 2,854 -402 2,452 Other long term non-interest bearing liabilities 4,387 -4,052 -156 -179 0 Other short non-interest bearing liabilities 0 4,052 -71 3,981 Total 89,694 1,994 0 0 -419 -179 91,090
Consolidated
26. Trade liabilities and other debts
Exchange rate risk
Foreign exchange risk lies in the potential fluctuations in value of financial instruments due to exchange rate fluctuations. The group incurs foreign exchange risk on sales, purchases and interest-bearing loans expressed in a currency other than the company’s local currency. At December 31, 2023, the group had a net position in GBP 5,586 thousand. At December 31, 2022, it was GBP 6,409 thousand. An overview of our hedging can be found in the table below. In Poland, at December 31, 2023, we had a net position in Polish Zloty of PLN 5,370 thousand. At December 31, 2022, this was a net debt position of PLN 9,506 thousand.
Most trade payables have a maturity date of 30 or 60 days from invoice date.
On March 30, 2023, the minority shareholders of What’s Cooking Deeside UK exercised their put option. By purchasing the remaining 9% of the shares for an amount of about 4 million euros, the group is now 100% shareholder of What’s Cooking Deeside UK Ltd.
27. Risks arising from financial instruments
Interest rates and exchange rates involve risks. This exposure is a normal consequence of the Group’s activities. We use derivative financial instruments to reduce these risks. Group policy prohibits the use of derivative financial instruments for speculative purposes.
Interest risk
Interest rate risk is the risk of fluctuation in value of a financial instrument due to changes in market interest rates.
What’s Cooking is exposed to the risk of interest rate fluctuations on its entire external financing under the RCF. At December 31, 2023, the amount drawn under the RCF is 75 million. At December 31, 2022, the amount drawn down was EUR 79.6 million of which GBP 1.6 million.
What’s Cooking wishes to limit its interest risk by hedging if the Board of Directors considers hedging advantageous. To this end, on November 30, 2018, it entered into a floored IRS with maturities at the end of each quarter in the notional amount of EUR 10 million, and an option for the same notional amount with a strike of 1% at the same maturities. On January 11 and 14, 2019, respectively, the group entered into 2 additional floored IRS contracts with the other 2 participating banks of the club deal with maturities at the end of each quarter in the amount of a notional amount of EUR 10 million each, and an option for the same notional amount with a strike of 1% at the same maturities. This interest hedging expired on June 27 and June 30, 2023, respectively. No interest rate hedges were taken for the time being for the period after June 30, 2023. Hedges will be reconsidered in the future.
Credit risk
Credit risk is the risk that one of the contracting parties will default on its financial obligations, which may cause the other party to incur a loss. In our SBUs savoury and ready meals, we sell our products to a broad customer base. This includes most major European discount and retail customers. We achieve sales to these customers through various contracts and products with various maturities. We do this in several countries, both for our own brands and for customers’ own brands. The ten largest customer groups represent 67% of sales in 2023 and 2022. In both 2023 and 2022, 3 external customers exceeded the 10% mark of consolidated sales with each having sales of 13, 12 and 11% respectively (11.5% in 2022). We realized the sales of these customers in both segments. Management worked out a credit policy. We continuously monitor exposure to credit risk.
Credit risk on trade receivables: we continuously monitor credit risk on all customers.
• Credit risks on cash and short-term investments: short-term investments are made in readily marketable securities or in fixed-term deposits with reputable banks.
• Transactions with derivative financial instruments: transactions with derivative financial instruments are permitted only with counterparties that have high credit ratings.
For all of these risks except for some of the customers at What’s Cooking Deeside UK Ltd and some specific customers at What’s Cooking France SAS, the balance sheet total is the maximum credit risk. The group is currently exploring further coverage of receivables through credit insurance for other entities.
What’s Cooking? Annual report 2023 200 Consolidated financial statements
2023 2022 Trade liabilities 150,561 153,143 Dividends 87 87 Put/call option 0 3,981 Other 5,205 4,945 Total 155,853 162,156 Of which empties 4,201 4,354
Contract date Maturity date Contract type Initial notional 13/07/2023 17/01/2024 Flexiterm £2,000,000.00 12/12/2023 15/07/2024 Flexiterm £2,000,000.00 13/07/2023 17/01/2024 Accumulateur protégé £405,000.00 12/12/2023 15/07/2024 Accumulateur protégé £403,000.00
Trade receivables are subject to normal payment terms.
On closing date, there are no significant outstanding past due amounts.
The value of the put/call option we had until the end of 2022 in respect of the remaining shares of What’s Cooking Deeside UK Ltd was based on the estimated discounted future value of the company at the date we estimated the option would be exercised. This did not differ materially from the value ultimately paid in 2023.
Liquidity risk
Liquidity risk is the risk that the group cannot meet its financial obligations. The group mitigates this risk by permanently monitoring cash flows. We also ensure that sufficient credit facilities are available. See also note 25.
As of December 31, 2023, a total amount of EUR 75 million was drawn at a variable interest rate. The covenant is tested each time on the 30/06 and 31/12 figures. In 2022 and 2023, the group met its covenants.
On Feb. 22, 2024, What’s Cooking signed a new 5-year financing agreement for a Revolving Credit Facility (RCF) of EUR 175 million with a consortium of existing and new banks. The agreement can be extended for 2 times 1 year if agreed by all parties. This agreement refinances the existing RCF and ensures the necessary financial stability in an uncertain volatile macroeconomic and geopolitical context. The RCF allows What’s Cooking? to further realize its Sustainable Profitable Growth Plan 2030. The financing is unsecured and allows the group to take on a debt ratio of up to 3.5 times EBITDA. In case of new acquisitions, a temporary excess of up to 4.0 times EBITDA will be accepted. The agreement also provides for a possible increase to EUR 250 million subject to the agreement of the parties and the satisfaction of specific conditions. The financing agreement also provides the option of linking the margin to group sustainability objectives.
What’s Cooking? Annual report 2023 201
financial statements
Consolidated
2023 2022 Total outstanding client receivables 94,362 99,350 Overdue < 30 days 6,033 4,457 Overdue between 30 and 60 days 199 833 Overdue > 60 days 129 46 Consolidated balance sheet Note 2023 2022 as at December 31, 2023 and 2022 Book value Fair value Book value Fair value Current assets Trade and other receivables 21 106,949 106,949 112,491 112,491 Cash and cash equivalents 22 20,313 20,313 19,353 19,353 Long-term liabilities Long-term interestbearing liabilities 25 78,595 78,595 84,317 84,317 Other long-term liabilities 0 0 0 0 Current liabilities Current interestbearing liabilities 25 2,615 2,615 2,792 2,792 Trade liabilities and other payables 26 155,853 155,853 162,156 162,156 Social liabilities 24,962 24,962 22,567 22,567 Tax liabilities 2,805 2,805 2,997 2,997 Assets and liabilities measured at fair value: hierarchy 2023 Level 1 Level 2 Level 3 Fair value Trade and other receivables 0 0 Other long-term liabilities 0 0 0 Assets and liabilities measured at fair value: hierarchy 2022 Level 1 Level 2 Level 3 Fair value Trade and other receivables 711 711 Other long-term liabilities 4,008 27 3981 Level 1: market prices in active markets for identical assets or liabilities Level 2: inputs other than level 1, which are observable for the asset or liability either directly (through prices) or indirectly (derived from prices) Level 3: inputs that are not based on observable market prices.
28. Leasing
The group leases its passenger vehicles under a number of operating leases. At the end of 2010, the group entered into an operating lease agreement for a new state of the art ‘value added logistics platform’ in Wijchen. There, What’s Cooking centralizes the slicing activities of What’s Cooking Wijchen and the Dutch logistics activities.
IFRS 16 requires the lessee to capitalize all lease and rental obligations on the balance sheet. The liability reflects all future lease payments associated with the lease valued at present value. The asset reflects the right to use the asset during the agreed lease term.
As a result of the adoption of IFRS 16, we recognized lease payables for leases previously classified as operating leases in accordance with IAS 17. These lease payables were measured at the present value of the remaining lease obligations, and discounted at our “marginal interest rate” applicable at January 1, 2019. Our weighted average “marginal interest rate” used to measure the lease payables as of January 1, 2019 was 3.35%.
29. Off-balance sheet rights and obligations
At December 31, 2023, total purchase commitments for major investment projects amounted to EUR 7,843 thousand (2022: EUR 4,742 thousand). For these, we already awarded contracts or placed orders.
At December 31, 2023, the group had EUR 2,249 thousand outstanding purchase commitments with raw material suppliers (2022: nihil).
To limit the impact of increased energy prices, the group has set up a hedging strategy whereby parts of its energy needs are hedged as the period approaches. The group purchases its energy by country. For example, 2024 is now fully hedged for all production sites.
30. Transactions with related parties
Transactions with directors and members of the executive committee
The Remuneration and Nomination Committee prepared What’s Cooking’s compensation policy. The board of directors approved it. The compensation of executive directors and executive committee members is structured into a fixed and a variable portion. The variable portion is subject to review by the remuneration and nomination committee and long-term incentives such as pension plan, among others. Since January 1, 2006, we have included the remuneration policy as an integral part of the Corporate Governance Charter.
The compensation of board members and executive management for the financial year 2023, we summarize in the table below.
For details, please refer to the remuneration report in the Corporate Governance Statement (see above).
Transactions with other parties
Transactions with related parties are primarily commercial transactions. They are based on the “at arm’s length” principle. The costs and revenues of these transactions are immaterial in the consolidated financial statements.
In 2023 (as in 2022) we received no reports from directors or management on related transactions, as stipulated in the Corporate Governance Charter.
31. EARNINGS PER SHARE
Basic earnings per share
The calculation of basic earnings per share is based on:
• net income attributable to ordinary shareholders of EUR 7,657 thousand (2022: EUR 4,221 thousand) a weighted average number of ordinary shares outstanding during the year of 1,838,256 (2022: 1,807,722)
What’s Cooking? Annual report 2023 202 Consolidated financial statements
Transactions with Directors of What’s Cooking Group NV: in EUR million 2023 2022 Remuneration to Board of Directors What’s Cooking Group NV for the execution of their mandate 0.42 0.31 Transactions with members of the Executive Committee: in EUR million 2023 2022 Short-term employee benefits 2.86 2.1 Post-employment benefits Other long-term employee benefits 0.37 0.17 Termination benefit Share-based payments
We calculated the weighted average number of ordinary shares outstanding as follows:
32. Impact of business combinations
In 2022 and 2023, the group made no new acquisitions that fall within the definition of “business combination.
At December 31, 2023, the capital is represented by 1,856,180 shares. On July 6, 2023, the capital was increased by incorporation of 52.15% of dividend rights (EUR 2,625 thousand) instead of a cash payment.
Diluted earnings per share
In calculating diluted earnings per share, we adjust the weighted average number of shares. We take into account all dilutive potential common shares. There are none in 2023 and 2022.
What’s Cooking? Annual report 2023 203 Consolidated financial statements
2023 2022 Number of outstanding ordinary shares on 1 January financial year 1,821,006 1,794,217 Effect of ordinary shares issued Weighted average number of outstanding ordinary shares on 31 December financial year 1,838,256 1,807,722 Group share in net profit of financial year 7,657 4,221 Average number of shares 1,838,256 1,807,722 Earnings per share 4.17 2.33
2023 2022 Net group earnings 7,657 4,221 Average number of shares 1,838,256 1,807,722 Dilution effect warrant plans 0 0 Adjusted number of shares 1,838,256 1,807,722 Diluted earnings per share 4.17 2.33 2023 2022 Number of shares 1,856,180 1,821,006 Dividend per share 4.28 4 Total dividend 7,944,450 7,284,024
33. Group companies
In 2022, the group purchased a 50% stake in the start-up Davai BV. This participation was accounted for using the equity method as it is a joint control.
The parent company of the group, What’s Cooking Group NV- Beke 1 - 9950 Lievegem in Belgium, is at December 31, 2023 directly or indirectly the parent company of the following companies:
There are no significant restrictions on the ability of the Company or subsidiaries to have access to the use of the assets and meet the obligations of the Group.
What’s Cooking? Annual report 2023 204
Name and full address of the company Effective holding in % What's Cooking Savoury Belgium NV - Antoon Van der Pluymstraat 1, 2160 Wommelgem - België 100 What's Cooking Wommelgem NV - Antoon Van der Pluymstraat 1, 2160 Wommelgem - België 100 What's Cooking Waarschoot NV - Beke 1, 9950 Lievegem - België 100 What's Cooking Veurne NV - Ondernemingenstraat 1, 8630 Veurne - België 100 What's Cooking Savoury UK Ltd - Addlestone Road, Bourne Business Park, Addlestone, Surrey KT15 2LE – UK 100 What's Cooking Savoury Deutschland GmbH - Krefelder Strasse 249 - 41066 Mönchengladbach - Duitsland 100 What's Cooking Savoury Nederland BV - Bijsterhuizen 24/04, 6604 LL Wijchen - Nederland 100 What's Cooking Wijchen BV - Bijsterhuizen 24/04, 6604 LL Wijchen - Nederland 100 What's Cooking Ridderkerk BV - Scheepmakerstraat 5 , 2984 BE Ridderkerk – Nederland 100 What's Cooking Borculo B.V. - Parallelweg 21, 7271 VB Borculo 100 What's Cooking Aalsmeer B.V. - Turfstekerstraat 47, 1431 GD Aalsmeer 100 What's Cooking Immo NV - Beke 1, 9950 Lievegem - België 100 What's Cooking Belgium NV - Beke 1, 9950 Lievegem - België 100 What's Cooking Marche-En-Famenne SA - Chaussée de Wavre 259 A, 4520 Wanze - België 100 What's Cooking Wanze SA - Chaussée de Wavre 259 A , 4520 Wanze - België 100 What's Cooking Nederland BV - Bijsterhuizen 24/04, 6604 LL Wijchen - Nederland 100 What's Cooking Ibérica SL - Vía de las Dos Castillas , 33 - Complejo Empresarial Ática, Edificio 6, Planta 3a - Officina B1, 28224 Pozuelo de Alarcón, Madrid - Spanje 100 Ter Beke France SA - ZI Espace Zuckermann - BP56 - 14270 Mézidon-Canon - Frankrijk 100 What's Cooking Polska Sp. z.o.o. - Ul. Północna 12 - 45-805 Opole - Polen 100 What's Cooking France SAS - ZI Espace Zuckermann - BP56 - 14270 Mézidon-Canon – Frankrijk 100 What's Cooking Deeside UK LTD - Estuary House 10th Avenue - Zone 3 Deeside Industrial Park – Deeside – Flintshire - CH5 2UAUnited Kingdom 100 What's Cooking Deutschland GmbH -Krefelder Strasse 249 - 41066 Mönchengladbach - Deutschland 100 Davai Stationstraat 114 - 9260 Wichelen (Schellebelle)- België 50
Consolidated financial statements
34. Important events after balance sheet date
We refer to the refinancing of the group (see note 25)
• The group announced on March 25,2024 that it has started a process to explore strategic options and maximize shareholder value. As part of this process, preliminary discussions have begun on the possible sale of 100% of the share capital of What’s Cooking Savoury Belgium NV and its Savoury subsidiaries in Belgium, the Netherlands, France, UK and Germany that produce, slice and sell savoury cold cuts. The Strategic Business Unit Savoury represents EUR 464 million of the EUR 832 million consolidated turnover of What’s Cooking? for the financial year 2023. To date, no commitment has been made and no terms of a possible transaction are known. At this stage, it is also uncertain whether a transaction will happen, as well as if it would go ahead on what terms.
35. Statutory auditor’s fees
For the audit of the What’s Cooking group in 2023, the auditor charged EUR 290 thousand in fees and EUR 20 thousand for non-audit services. The companies with which the auditor has a partnership did not invoice additional fees to the Group in 2023.
What’s Cooking? Annual report 2023 205
Consolidated financial statements
Abbreviated financial statements of What’s Cooking Group NV
What’s Cooking? Annual report 2023 206
financial
1. Balance sheet 2023 2022 Non-current assets 259,981 170,721 I. Formation Expenses II. Intangible non-current assets III. Tangible non-current assets 3,567 2,314 IV. Financial non-current assets 256,414 168,407 Current assets 79,972 132,899 V. Amounts receivable after 1 year 0 0 VI. Inventories 0 0 VII. Amounts receivable within one year 69,220 120,060 VIII. Cash investments 0 0 IX. Cash and cash equivalents 10,070 11,688 X. Accrued income and deferred charges 682 1,151 TOTAL ASSETS 339,953 303,620 Shareholders’ equity 104,267 95,056 I. Capital 5,253 5,153 II. Share premiums 59,604 57,044 IV. Reserves 3,360 3,360 Statutory reserves 649 649 Reserves not available for distribution 1,457 1,457 Untaxed reserves 679 679 Reserves available for distribution 575 575 V. Transferred result 36,050 29,499 Provisions and deferred taxes 448 125 Provisions for risks and costs 448 125 Deferred taxes Debts 235,238 208,439 X. Debts payable after 1 year 136,000 79,635 XI. Debts payable within 1 year 99,234 128,804 XII. Accrued charges and deferred income 4 0 TOTAL LIABILITIES 339,953 303,620
Consolidated
statements
The valuation and translation rules for the statutory financial statements of the parent company comply with Belgian standards (BE GAAP). The consolidated financial statements were prepared in accordance with IFRS. Both valuation rules differ significantly from each other.
The statutory auditor has issued an unqualified opinion on the statutory financial statements of What’s Cooking Group NV.
The following documents are published in accordance with legal requirements and can be obtained free of charge: the integral version of the statutory financial statements, the unqualified auditor’s report and the non-consolidated annual report, which is not included in the integral version.
What’s Cooking? Annual report 2023 207
financial statements 2. Income statement 2023 2022 Operating income 33,416 16,724 Turnover Change in inventory Produced non-current assets Other operating income 33,416 16,724 Operating costs 22,690 22,265 Trade goods, raw and auxiliary items Services and miscellaneous goods 14,783 15,592 Remuneration, social security costs and pensions 6,668 5,473 Depreciation and write-downs on intangible and tangible noncurrent assets 907 1,067 Write-downs on inventory and trade receivables Provisions for risks and costs 323 125 Other operating costs 9 8 Operating result 10,726 -5,541 Financial income 13,325 6,472 Financial charges -9,540 -2,857 Result from ordinary business operations before tax 14,511 -1,926 Profit before tax 14,511 -1,926 Tax on profits -15 -15 Result for the financial year after tax 14,496 -1,941
Consolidated
Consolidated key figures 2019-2023
What’s Cooking? Annual report 2023 208
2023 2022 2021 2020 2019 Consolidated income statement Revenue (net revenue) 832,326 781,385 696,906 717,422 728,132 EBITDA 45,468 35,861 45,939 37,140 37,243 Result of operating activities (EBIT) 16,560 7,647 17,149 4,839 6,205 Result after taxes before share in the result of enterprises is accounted for using the equity method 7,755 4,609 7,333 -2,463 4,415 Earnings after taxes (EAT) 7,657 4,520 7,333 -2,463 4,415 Net cash flow 36,663 32,823 36,123 29,838 35,453 Consolidated balance sheet and financial structure Non-current assets 224,711 225,726 231,701 245,108 252,148 Current assets 174,526 178,733 150,104 156,492 186,874 Equity 125,783 120,573 121,445 116,578 124,176 Total of balance sheet 399,237 404,459 381,805 401,600 439,022 Net financial debts 60,897 67,756 73,763 99,909 124,434 Net financial debts / Equity 48.4% 56.2% 60.7% 85.7% 100.2% Equity/Total of balance sheet 31.5% 29.8% 31.8% 29.0% 28.3% Stock and dividend information Number of shares 1,856,180 1,821,006 1,794,217 1,767,281 1,732,621 Average number of shares 1,838,256 1,807,722 1,780,860 1,749,951 1,732,621 Average stock price (December) 66.13 87.82 118.24 112.59 104.45 Basic profit per share 4.17 2.50 4.12 1.41 2.55 Diluted profit per share 4.17 2.50 4.12 1.41 2.55 EBITDA per share 24.73 19.84 25.80 21.22 21.50 Net cash flow per share 19.94 18.16 20.28 17.01 20.57 Dividend per share 4.28 4.00 4.00 4.00 4.00 Payout ratio 103.75% 172.57% 97.70% -296.28% 164.04% Dividend return (December) 6.50% 4.60% 3.40% 3.60% 3.80% Valuation Market capitalisation (December) 122,749 159,921 212,148 198,978 180,972 Net financial debt 60,897 67,756 73,763 99,909 124,434 Market value of the company 183,646 227,677 285,911 298,887 305,406 Market value / Result 24.0 50.4 39.0 -121.4 69.2 Market value / EBITDA 4.0 6.3 6.2 8.0 8.2 Market value / Net cash flow 5.0 6.9 7.9 10.0 8.6
Consolidated financial statements
Declaration by the responsible persons
The undersigned, Piet Sanders°, managing director, and Yves Regniers*, chief financial officer (CFO), declare that, to the best of their knowledge:
The financial statements for financial year 2023 and 2022, prepared in accordance with International Financial Accounting Standards (IFRS) as applied by the European Union, provide a reliable view of the assets, financial situation and results of What’s Cooking Group NV and of the companies included in the consolidation.
• The annual report provides a reliable overview of the development, results and position of What’s Cooking Group NV and of the companies included in the consolidation. The annual report also provides a fair description of the main risks and uncertainties with which they are confronted.
Yves Regniers*
Piet Sanders° Chief Financial Officer Managing Director
* Permanent representative BV Esroh ° Permanent representative BV Leading For Growth
What’s Cooking? Annual report 2023 209 Consolidated financial statements
Report from the Statutory Auditor on the consolidated annual accounts
Statutory auditor’s report to the general meeting of What’s Cooking Group NV on the consolidated financial statements as of and for the year ended 31 December 2023
In the context of the statutory audit of the consolidated financial statements of What’s Cooking Group NV (“the Company”) and its subsidiaries (jointly “the Group”), we provide you with our statutory auditor’s report. This includes our report on the consolidated financial statements for the year ended 31 December 2023, as well as other legal and regulatory requirements. Our report is one and indivisible.
We were appointed as statutory auditor by the general meeting of 27 May 2021, in accordance with the proposal of the board of directors issued on the recommendation of the audit committee and as presented by the workers’ council. Our mandate will expire on the date of the general meeting deliberating on the annual accounts for the year ended 31 December 2023. We have performed the statutory audit of the consolidated financial statements of the Group for 3 consecutive financial years.
Report on the consolidated financial statements
Unqualified opinion
We have audited the consolidated financial statements of the Group as of and for the year ended 31 December 2023, prepared in accordance with IFRS Accounting Standards as issued by the International Accounting Standards Board and as adopted by the European Union, and with the legal and regulatory requirements applicable in Belgium. These consolidated financial statements comprise the consolidated balance sheet as at 31 December 2023, the consolidated income statement and the consolidated statement of the comprehensive income, consolidated statement of changes in equity and the consolidated cash flow statement for the year then ended and notes, comprising material accounting policies and other explanatory information. The total of the consolidated statement of financial position amounts to EUR 399.237 (000) and the consolidated statement of profit or loss shows a profit for the year of EUR 7.657 (000).
In our opinion, the consolidated financial statements give a true and fair view of the Group’s equity and financial position as at 31 December 2023 and of its consolidated financial performance and its consolidated cash flows for the year then ended in accordance with IFRS Accounting Standards as issued by the International Accounting Standards Board and as adopted by the European Union, and with the legal and regulatory requirements applicable in Belgium.
Basis for our unqualified opinion
We conducted our audit in accordance with International Standards on Auditing (“ISAs”) as adopted in Belgium. In addition, we have applied the ISAs as issued by the IAASB and applicable for the current accounting year while these have not been adopted in Belgium yet. Our responsibilities under those standards are further described in the “Statutory auditors’ responsibility for the audit of the consolidated financial statements” section of our report. We have complied with the ethical requirements that are relevant to our audit of the consolidated financial statements in Belgium, including the independence requirements.
We have obtained from the board of directors and the Company’s officials the explanations and information necessary for performing our audit.
We believe that the audit evidence we have obtained is sufficient and appropriate to provide a basis for our opinion.
Key audit matter
Key audit matters are those matters that, in our professional judgement, were of most significance in our audit of the consolidated financial statements of the current period. These matters were addressed in the context of our audit of the consolidated financial statements as a whole, and in forming our opinion thereon, and we do not provide a separate opinion on these matters.
Impairment of goodwill
We refer to Note 14 ‘Goodwill’ of the consolidated financial statements.
Description
As described in Note 14 – ‘Goodwill’ of the consolidated financial statements, the Company has recorded a goodwill for an amount of 78.041 (000) EUR as per 31 December 2023. Goodwill is assessed for impairment on an annual basis in accordance with IAS 36 “Impairment of Assets”. Management prepares an analysis in which the recoverable amount is assessed by discounting future cashflow projections at the level of the cash generating units. This recoverable amount is compared to the carrying amount at balance sheet date in order to determine if goodwill is impaired as well as the level of impairment charge to be recognized, if any.
What’s Cooking? Annual report 2023 210
Consolidated financial statements
Due to its significance to the balance sheet total and the significant degree of judgement required by management in developing the estimate, which mainly relates to the inputs used in forecasting as well as discounting the future cash flows in order to determine the recoverable amount, we determined impairment of goodwill as a key audit matter.
Our audit procedures
We have performed the following audit procedures:
• We assessed the process of cash flow forecasting by management, including testing the underlying calculations and reconciling them to financial targets and plans approved by the board of directors;
• We analysed management’s ability to forecast cash flows accurately and challenged the reasonableness of current forecasts by comparing the key assumptions to historical results;
We evaluated the Group’s valuation methodology and its determination of discount rates and terminal growth rates by involving valuation specialists in our audit team;
• We challenged the appropriateness of the sensitivity analysis around the key assumptions used in determining and discounting cash flow expectations, in particular discount rates and growth rates; and
• We evaluated the completeness and appropriateness of the Group’s disclosures in respect of impairment, as included in note 14 to the consolidated financial statements.
Board of directors’ responsibilities for the preparation of the consolidated financial statements
The board of directors is responsible for the preparation of these consolidated financial statements that give a true and fair view in accordance with IFRS Accounting Standards as issued by the International Accounting Standards Board and as adopted by the European Union, and with the legal and regulatory requirements applicable in Belgium, and for such internal control as board of directors determines, is necessary to enable the preparation of consolidated financial statements that are free from material misstatement, whether due to fraud or error.
In preparing the consolidated financial statements, the board of directors is responsible for assessing the Group’s ability to continue as a going concern, disclosing, as applicable, matters related to going concern and using the going concern basis of accounting unless the board of directors either intends to liquidate the Group or to cease operations, or has no realistic alternative but to do so.
Statutory auditor’s responsibilities for the audit of the consolidated financial statements
Our objectives are to obtain reasonable assurance as to whether the consolidated financial statements as a whole are free from material misstatement, whether due to fraud or error, and to issue an auditor’s report that includes our opinion. Reasonable assurance is a high level of assurance, but is not a guarantee that an audit conducted in accordance with ISAs will always detect a material misstatement when it exists. Misstatements can arise from fraud or error and are considered material if, individually or in the aggregate, they could reasonably be expected to influence the economic decisions of the users taken on the basis of these consolidated financial statements.
When performing our audit we comply with the legal, regulatory and professional requirements applicable to audits of the consolidated financial statements in Belgium. The scope of the statutory audit of the consolidated financial statements does not extend to providing assurance on the future viability of the Group nor on the efficiency or effectivity of how the board of directors has conducted or will conduct the business of the Group. Our responsibilities regarding the going concern basis of accounting applied by the board of directors are described below.
As part of an audit in accordance with ISAs, we exercise professional judgement and maintain professional skepticism throughout the audit. We also perform the following procedures:
• Identify and assess the risks of material misstatement of the consolidated financial statements, whether due to fraud or error, design and perform audit procedures responsive to those risks, and obtain audit evidence that is sufficient and appropriate to provide a basis for our opinion. The risk of not detecting a material misstatement resulting from fraud is higher than for one resulting from error, as fraud may involve collusion, forgery, intentional omissions, misrepresentations, or the override of internal control;
• Obtain an understanding of internal controls relevant to the audit in order to design audit procedures that are appropriate in the circumstances, but not for the purpose of expressing an opinion on the effectiveness of the Group’s internal control;
Evaluate the appropriateness of accounting policies used and the reasonableness of accounting estimates and related disclosures made by board of directors;
• Conclude on the appropriateness of board of directors’ use of the going concern basis of accounting and, based on the audit evidence obtained, whether a material uncertainty exists related to events or conditions that may cast significant doubt on the Group’s ability to continue as a going concern. If we conclude that a material uncertainty exists, we are required to draw attention in our auditors’ report to the related disclosures in the consolidated financial statements or, if such disclosures are inadequate, to modify our opinion. Our conclusions are based on the audit evidence obtained up to the date of our auditors’ report. However, future events or conditions may cause the Group to cease to continue as a going concern;
What’s Cooking? Annual report 2023 211 Consolidated financial statements
• Evaluate the overall presentation, structure and content of the consolidated financial statements, including the disclosures, and whether the consolidated financial statements represent the underlying transactions and events in a manner that achieves fair presentation;
• Obtain sufficient appropriate audit evidence regarding the financial information of the entities or business activities within the Group to express an opinion on the consolidated financial statements. We are responsible for the direction, supervision and performance of the group audit. We remain solely responsible for our audit opinion.
We communicate with the audit committee regarding, among other matters, the planned scope and timing of the audit and significant audit findings, including any significant deficiencies in internal control that we identify during our audit.
We also provide the audit committee with a statement that we have complied with relevant ethical requirements regarding independence, and to communicate with them all relationships and other matters that may reasonably be thought to bear on our independence, and where applicable, related safeguards.
For the matters communicated with the audit committee, we determine those matters that were of most significance in the audit of the consolidated financial statements of the current period and are therefore the key audit matters. We describe these matters in our auditor’s report unless law or regulation precludes public disclosure about the matter.
Other legal and regulatory requirements
Responsibilities of the Board of directors
The board of directors is responsible for the preparation and the content of the board of directors’ annual report on the consolidated financial statements.
Statutory auditor’s responsibilities
In the context of our engagement and in accordance with the Belgian standard which is complementary to the International Standards on Auditing as applicable in Belgium, our responsibility is to verify, in all material respects, the board of directors’ annual report on the consolidated financial statements, and to report on these matters.
Aspects concerning the board of directors’ annual report on the consolidated financial statements
Based on specific work performed on the board of directors’ annual report on the consolidated financial statements, we are of the opinion that this report is consistent with the consolidated financial statements for the same period and has been prepared in accordance with article 3:32 of the Companies’ and Associations’ Code.
In the context of our audit of the consolidated financial statements, we are also responsible for considering, in particular based on the knowledge gained throughout the audit, whether the board of directors’ annual report on the consolidated financial statements contains material misstatements, that is information incorrectly stated or misleading. In the context of the procedures carried out, we did not identify any material misstatements that we have to report to you.
The non-financial information required by article 3:32 §2 of the Companies’ and Associations’ Code has been included in the board of directors’ annual report on the consolidated financial statements. The Company has prepared this non-financial information based on ESRS Standards. In accordance with art 3:80 §1, 1st paragraph, 5° of the Companies’ and Associations’ Code, we do not comment on whether this non-financial information has been prepared in accordance with the mentioned ESRS Standards.
Information about the independence
• Our audit firm and our network have not performed any engagement which is incompatible with the statutory audit of the consolidated accounts and our audit firm remained independent of the Group during the term of our mandate.
• The fees for the additional engagements which are compatible with the statutory audit referred to in article 3:65 of the Companies’ and Associations’ Code were correctly stated and disclosed in the notes to the consolidated financial statements.
European Single Electronic Format (ESEF
In accordance with the draft standard on the audit of compliance of the Financial Statements with the European Single Electronic Format (hereafter “ESEF”), we have audited as well whether the ESEF-format is in accordance with the regulatory technical standards as laid down in the EU Delegated Regulation nr. 2019/815 of 17 December 2018 (hereafter “Delegated Regulation”).
What’s Cooking? Annual report 2023 212 Consolidated financial statements
The Board of Directors is responsible for the preparation, in accordance with the ESEF requirements, of the consolidated financial statements in the form of an electronic file in ESEF format (hereafter “digital consolidated financial statements”) included in the annual financial report.
It is our responsibility to obtain sufficient and appropriate information to conclude whether the format and the tagging of the digital consolidated financial statements comply, in all material respects, with the ESEF requirements under the Delegated Regulation.
In our opinion, based on our work performed, the format of and the tagging of information in the English version of the digital consolidated financial statements as per 31 December 2023, included in the annual financial report of What’s Cooking Group NV, are, in all material respects, prepared in compliance with the ESEF requirements under the Delegated Regulation.
Other aspect
This report is consistent with ur additional report to the audit committee on the basis of Article 11 of Regulation (EU) No 537/2014.
Zaventem, 18 April 2024
KPMG Bedrijfsrevisoren - Réviseurs d’Entreprises
Statutory Auditor represented by
Filip De Bock Bedrijfsrevisor / Réviseur d’Entreprises
What’s Cooking? Annual report 2023 213 Consolidated financial statements
Contact information
What’s Cooking Group NV
Beke 1 - B-9950 Lievegem
RPR Ghent 0421.364.139
Tel: +32 9 370 12 11
E-mail: info@Whatscooking.group
Website: www.whatscooking.group
Davai BV
Stationstraat 114 - 9260 Wichelen
RPR Ghent 0735.338.390
Ready meals
What’s Cooking Belgium NV
Beke 1 - B-9950 Lievegem
RPR Ghent 0884.649.304
What’s Cooking Marche-en-Famenne SA
Chaussée de Wavre 259a - B-4520 Wanze
RPM Huy 0442.475.396
Operating seat: 5 Chemin Saint-Antoine, 6900 Marche-en-Famenne
What’s Cooking Wanze SA
Chaussée de Wavre 259a - B-4520 Wanze
RPM Huy 0446.434.778
Ter Beke France SA
ZI Espace Zuckermann BP 56
F-14270 Mézidon-Vallée d’Auge
Registre de commerce Lisieux 309 507 176
What’s Cooking Iberica S.L.
Vía de las Dos Castillas 33
Complejo Empresarial Ática
Edificio 6, planta 3a, Officina B1
E-28224 Pozuelo de Alarcón (Madrid) ES B 82656521
What’s Cooking Netherlands BV
Bijsterhuizen 24/04 - NL-6604 LL Wijchen
Utrecht Chamber of Commerce 200.53.817
What’s Cooking Polska Sp. z.o.o.
Ul. Północna 12
PL - 45-805 Opole
KRS 0000403908
What’s Cooking France SAS
ZI Espace Zuckermann BP 56
F-14270 Mézidon-Vallée d’Auge
Registre de commerce Lisieux 309 507 176
What’s Cooking Deeside UK Ltd
Estuary House 10th Avenue Zone 3 Deeside Industrial Park Deeside
Flintshire CH5 2UA United Kingdom
Company House 02077911
What’s Cooking Deutschland GmbH
Krefelder Strasse 24941066 Mönchengladbach
Deutschland
HRB Krefeld 16709
Savoury
What’s Cooking Savoury Belgium NV
Antoon Van der Pluymstraat 1 - B-2160 Wommelgem
RPR Antwerp 0475.089.271
What’s Cooking Wommelgem NV
Antoon Van der Pluymstraat 1 - B-2160 Wommelgem
RPR Antwerp 0404.057.854
What’s Cooking Waarschoot NV
Beke 1 - B-9950 Lievegem
RPR Ghent 0406.175.424
What’s Cooking Veurne NV
Ondernemingenstraat 1 - B-8630 Veurne
RPR Veurne 0436.749.725
What’s Cooking? Annual report 2023 214
Contact information
What’s Cooking Immo NV
Beke 1 - B-9950 Lievegem
RPR Ghent 0413.756.072
What’s Cooking Savoury Nederland BV
BV Bijsterhuizen 24/04 - NL-6604 LL Wijchen
CoC Limburg North 12032497
What’s Cooking Wijchen BV
Bijsterhuizen 24/04 - NL-6604 LL Wijchen
CoC Limburg North 12036519
What’s Cooking Ridderkerk BV
Scheepmakerstraat 5 - NL-2984 BE Ridderkerk CoC Rotterdam 24140598
What’s Cooking Savoury UK Ltd
Dixcart House Addlestone Road Bourne Business Park Addlestone
KT15 2LE - Surrey - United Kingdom
What’s Cooking Savoury Deutschland GmbH
Krefelder Strasse 249 - D-41006 Mönchengladbach 117 / 5830 / 1047 - THE 123 114 501
What’s Cooking Borculo BV
Parallelweg 21 - NL-7271 VB Borculo CoC 06039901
What’s Cooking Aalsmeer BV
Turfstekerstraat 47 - NL-1431 GD Aalsmeer CoC 34053874
What’s Cooking? Annual report 2023 215
Contact information
Editing and final editing: What’s Cooking Group NV
Translation: What’s Cooking Group NV
Design and layout: Action NV
Publisher responsible: What’s Cooking Group NV
The Dutch-language IXBRL version of this annual report is the official version.
This annual report is also available in English (free translation).
We thank all our employees for their commitment and dynamism. We achieve these results thanks to them. They also give us full confidence in the future.
What’s Cooking? Annual report 2023 216
Colofon
