Q3 AT A GLANCE
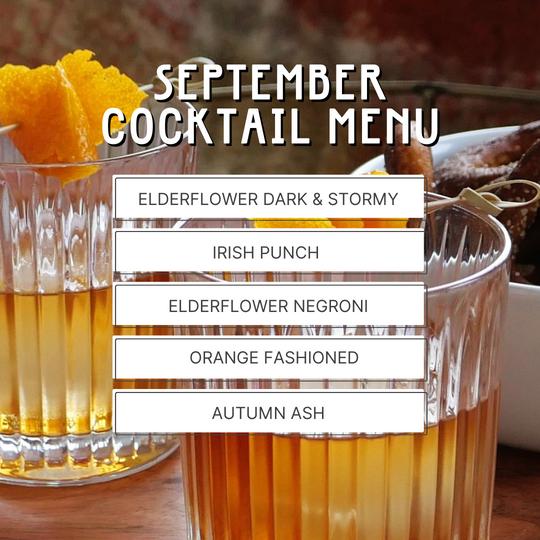
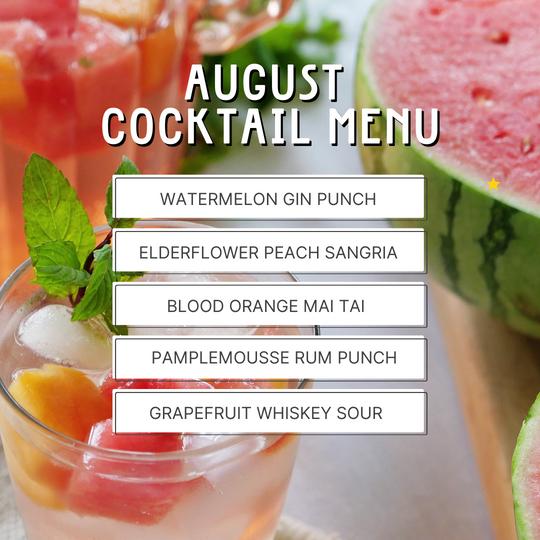
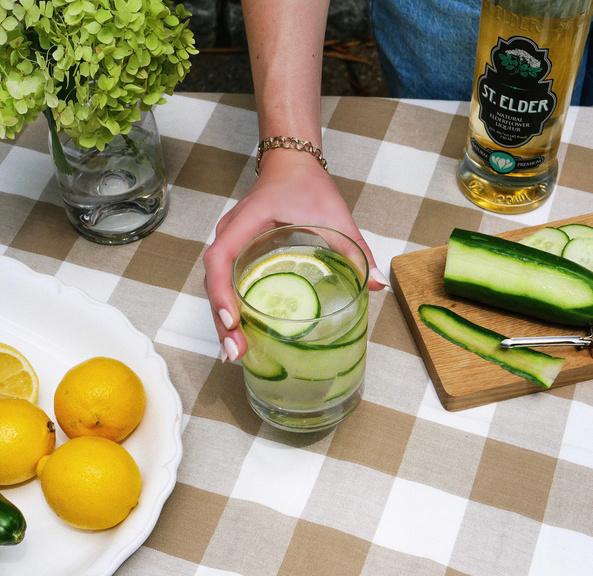
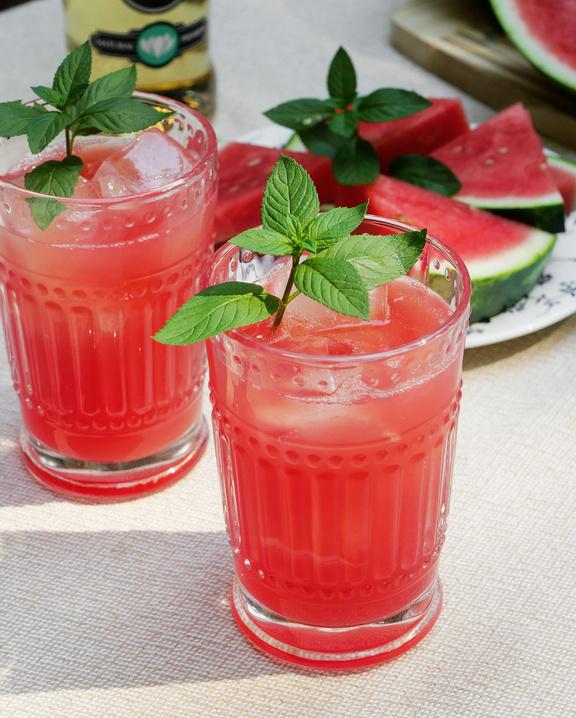
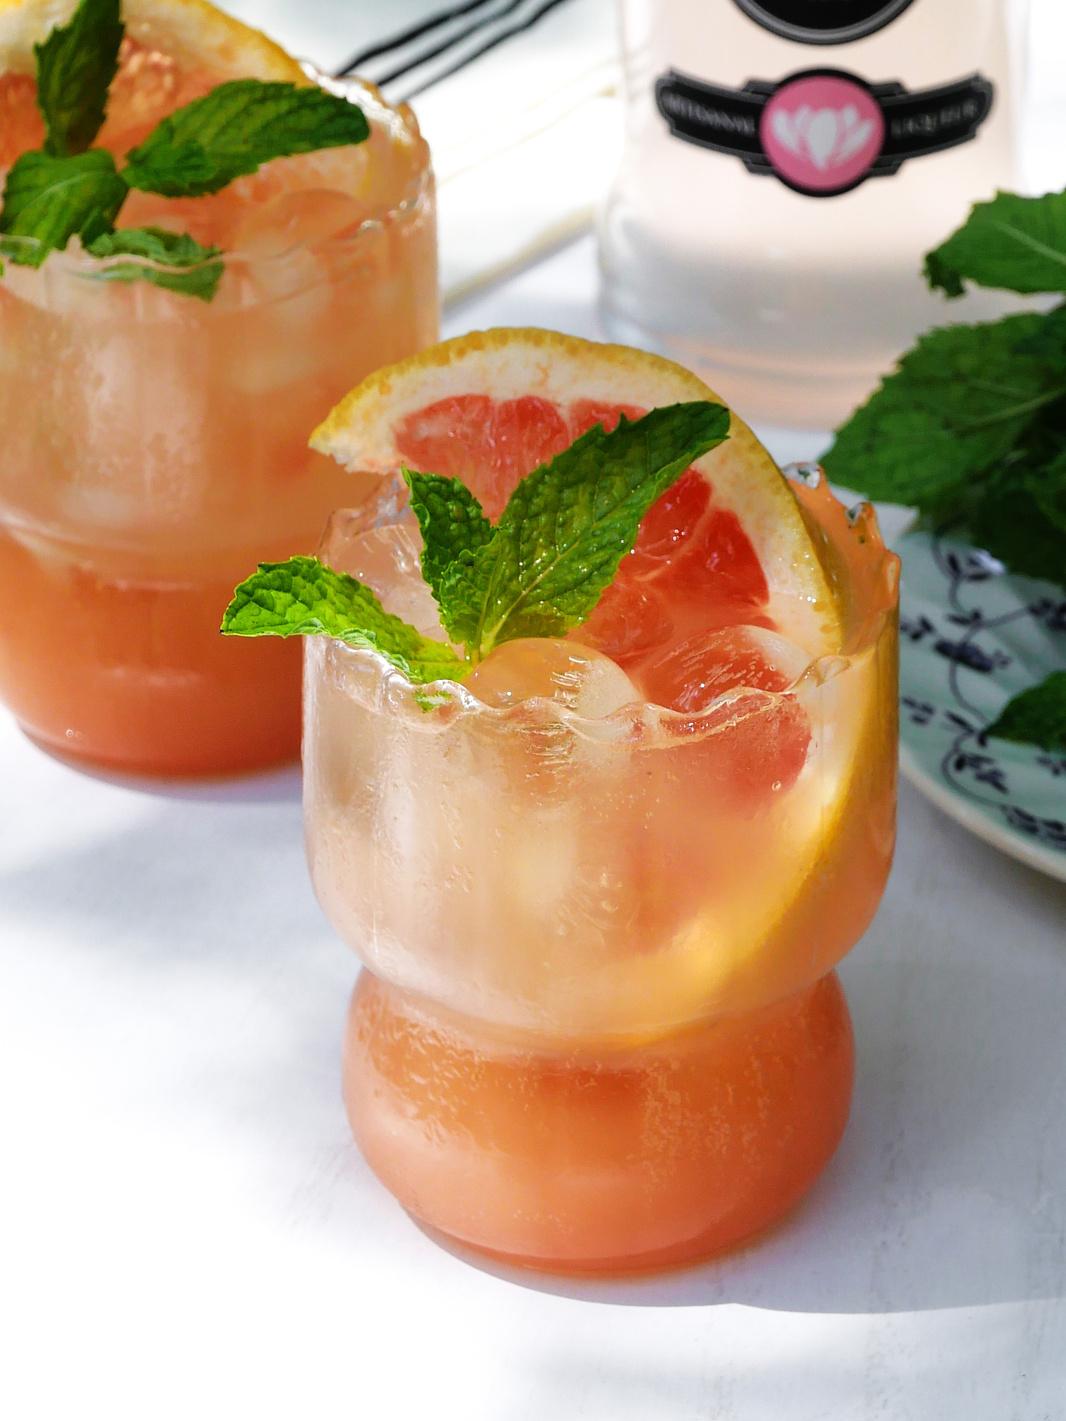
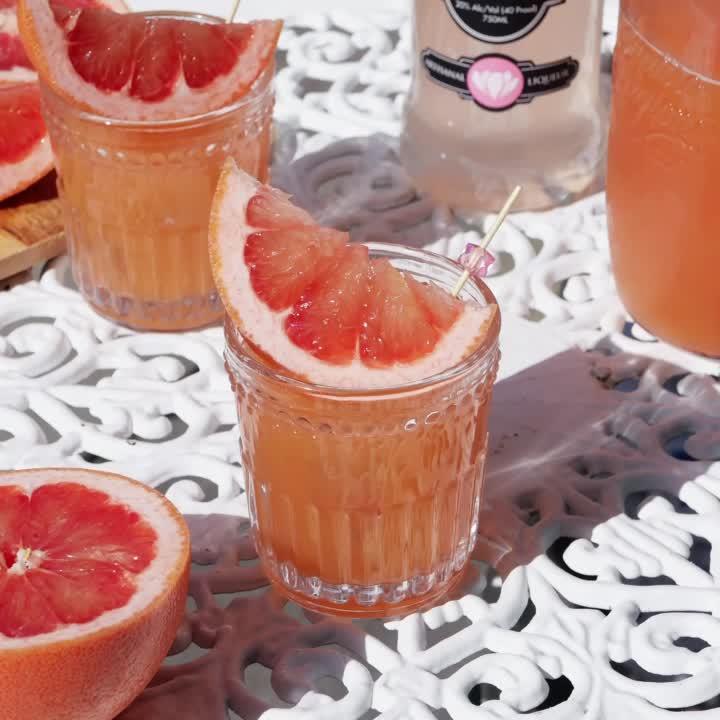
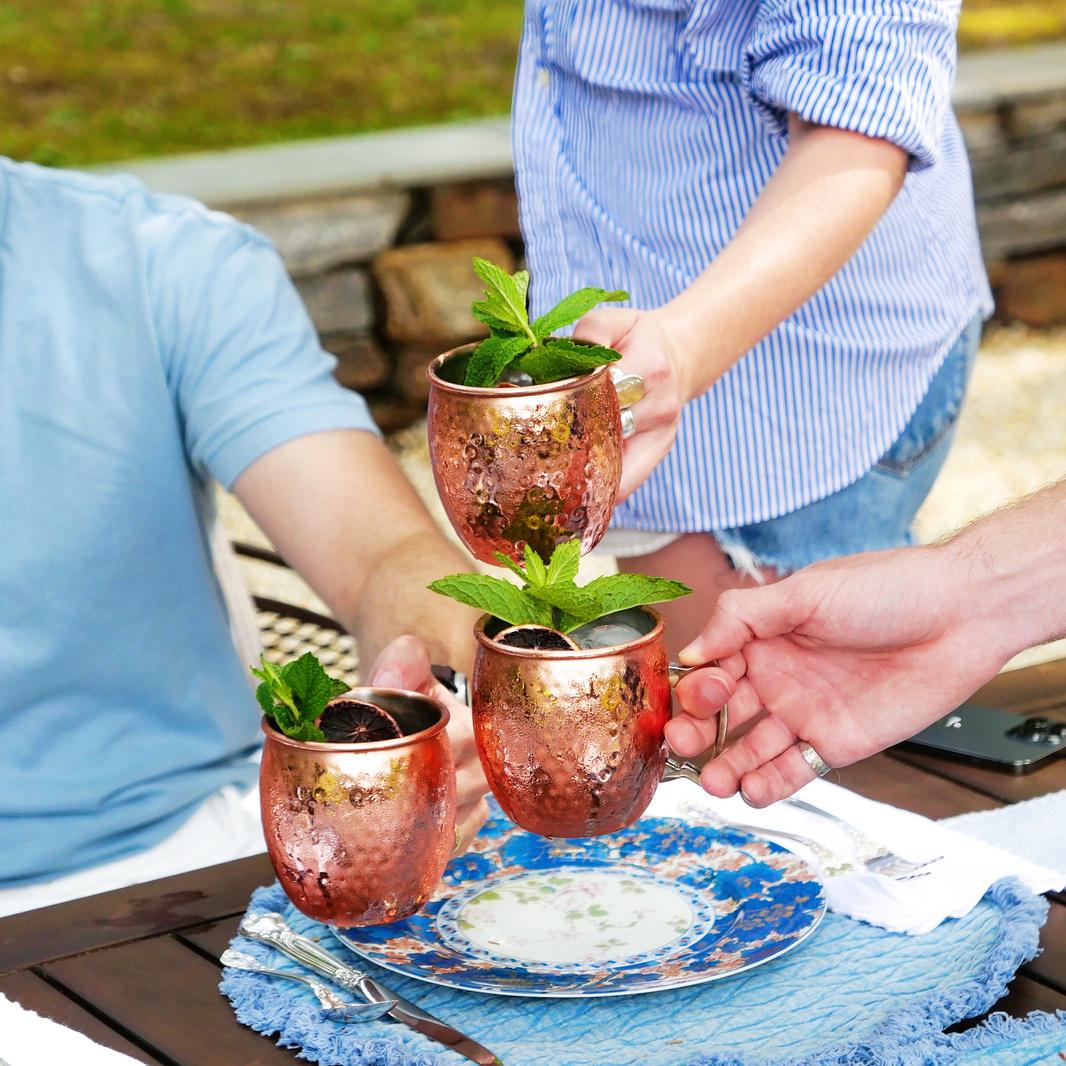
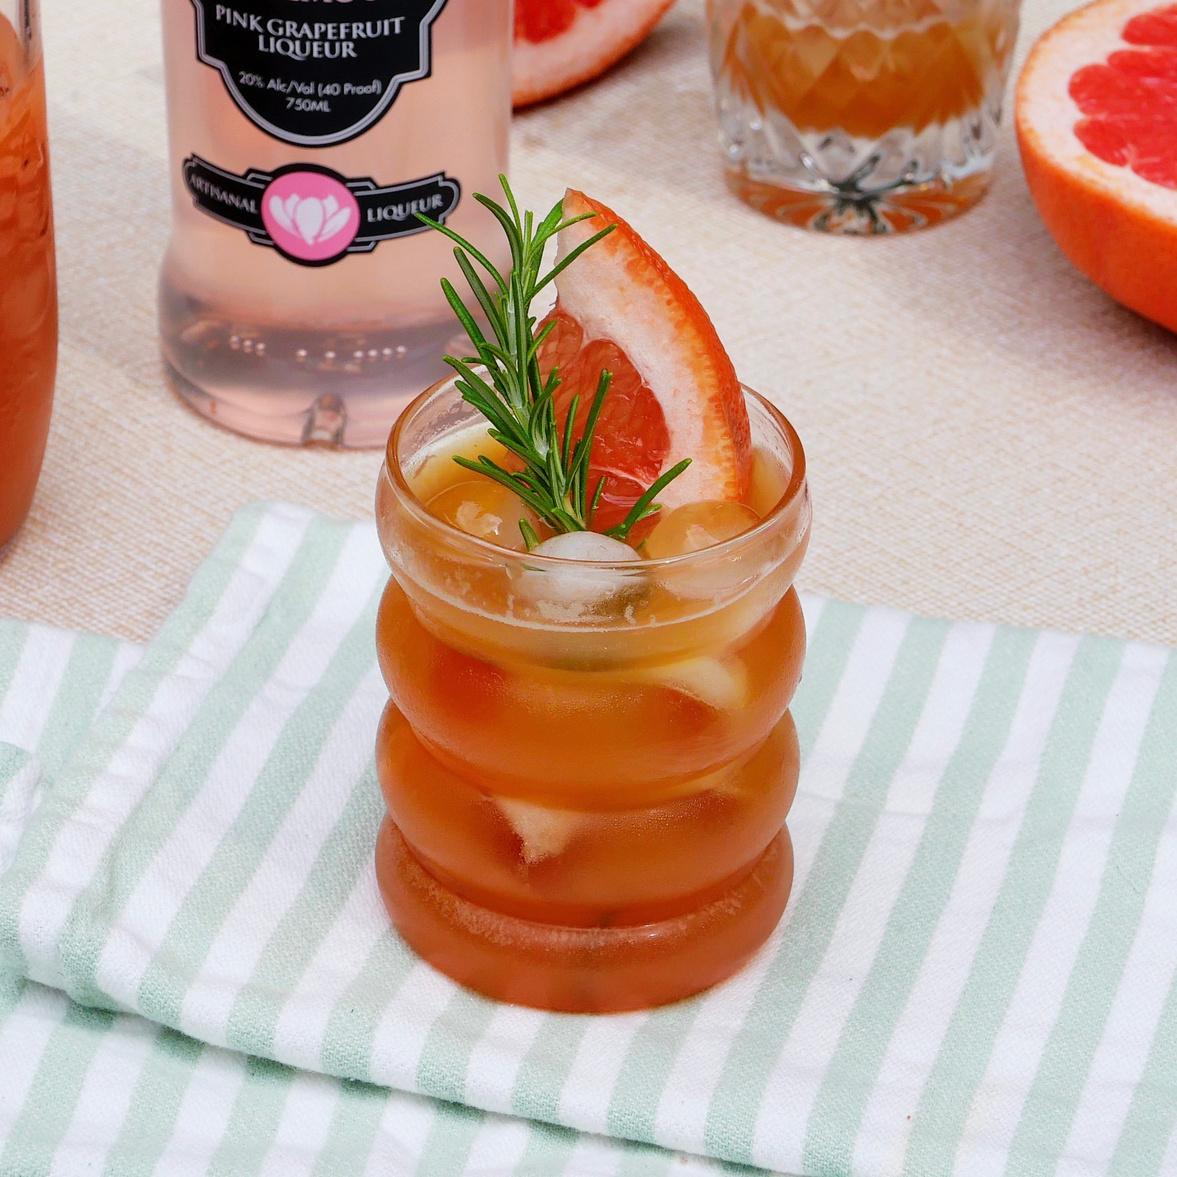
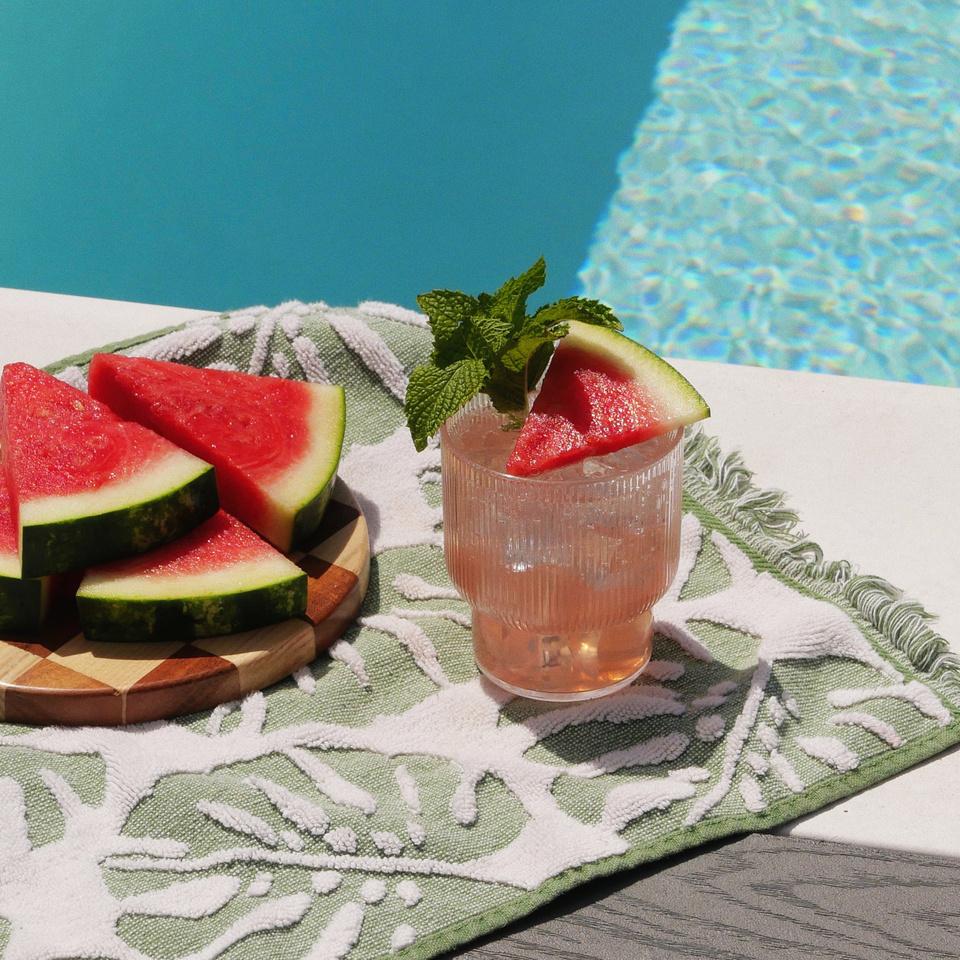
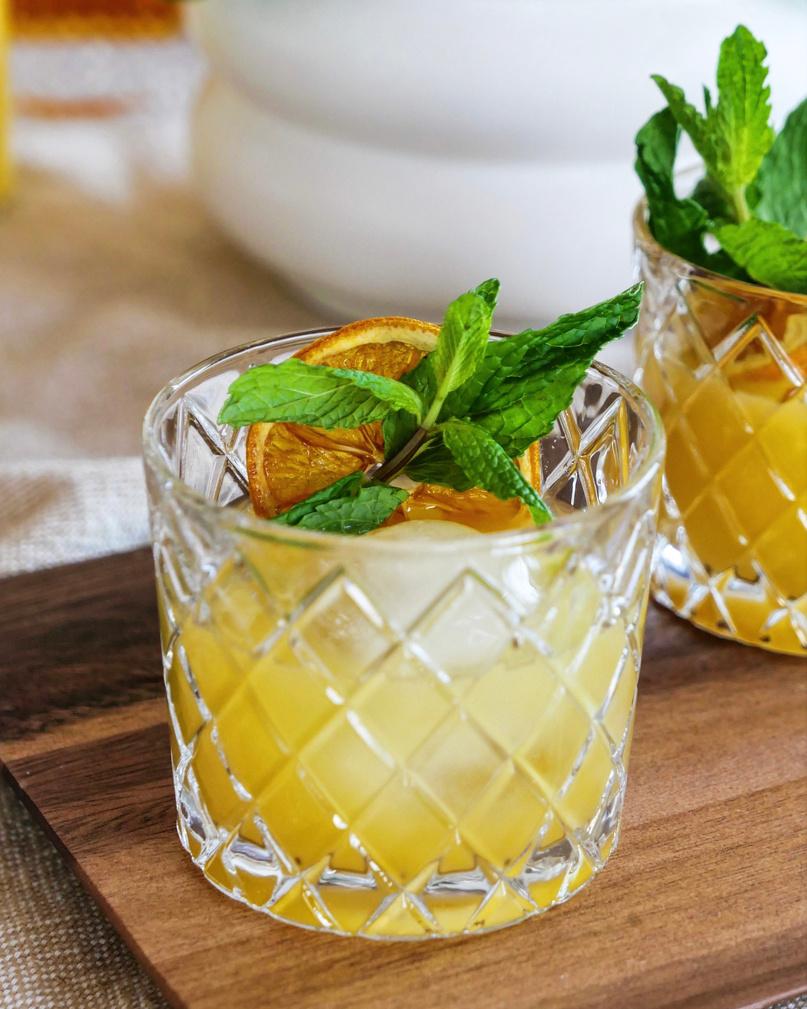
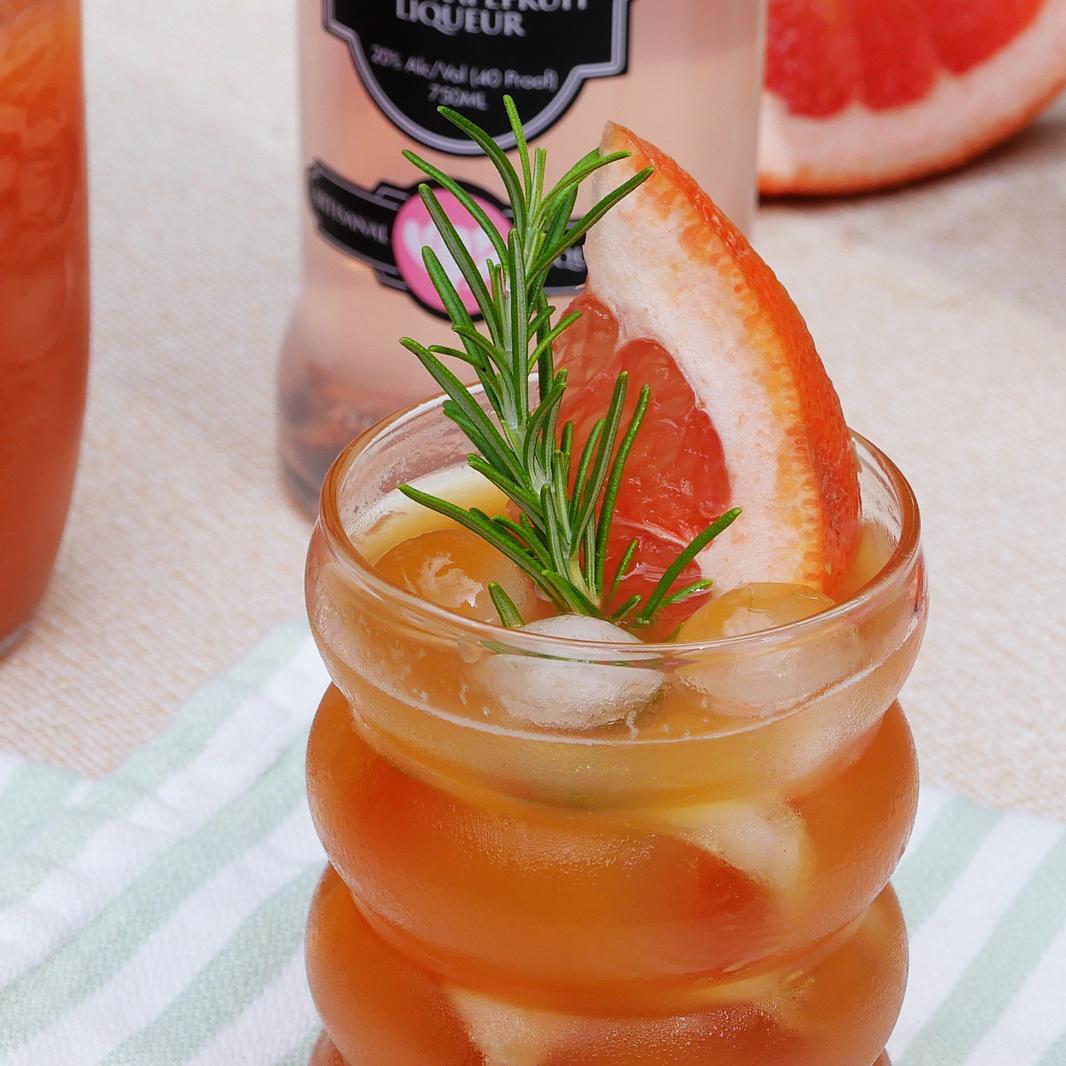
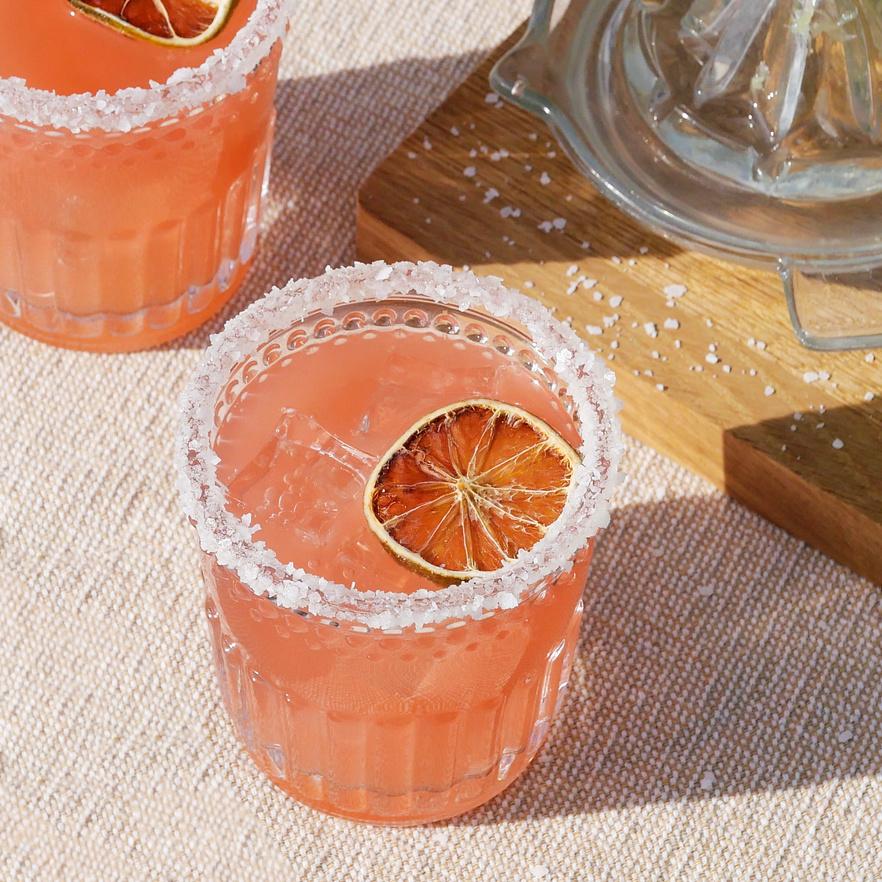
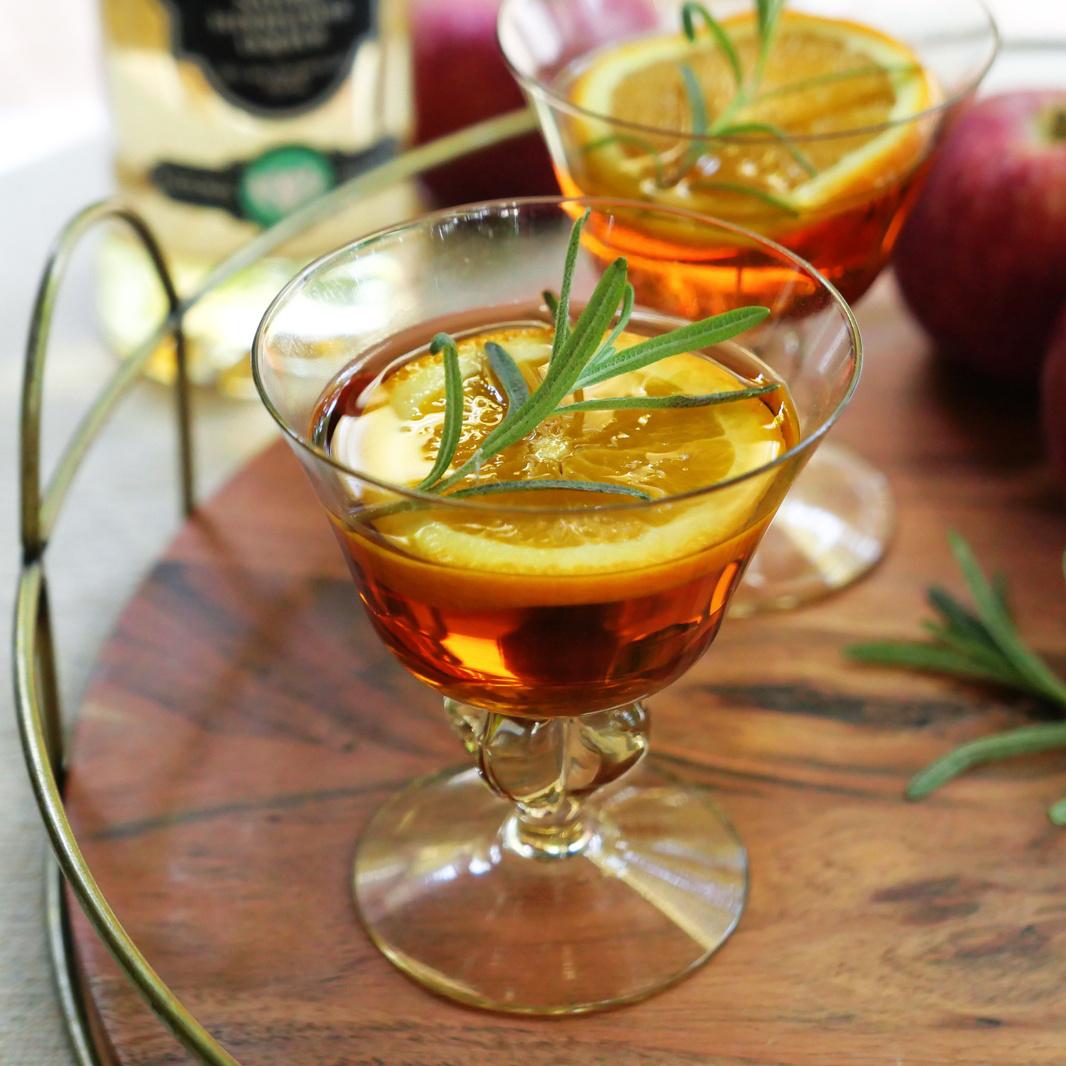
Colorful cocktails & brightly lit lifestyle shots were the focus of our July, August, & September content calendar. We introduced the "St. Elder Cocktail Menu," a first of the month post with an overview of what cocktails we'll be featuring throughout the month as a teaser of content to come.
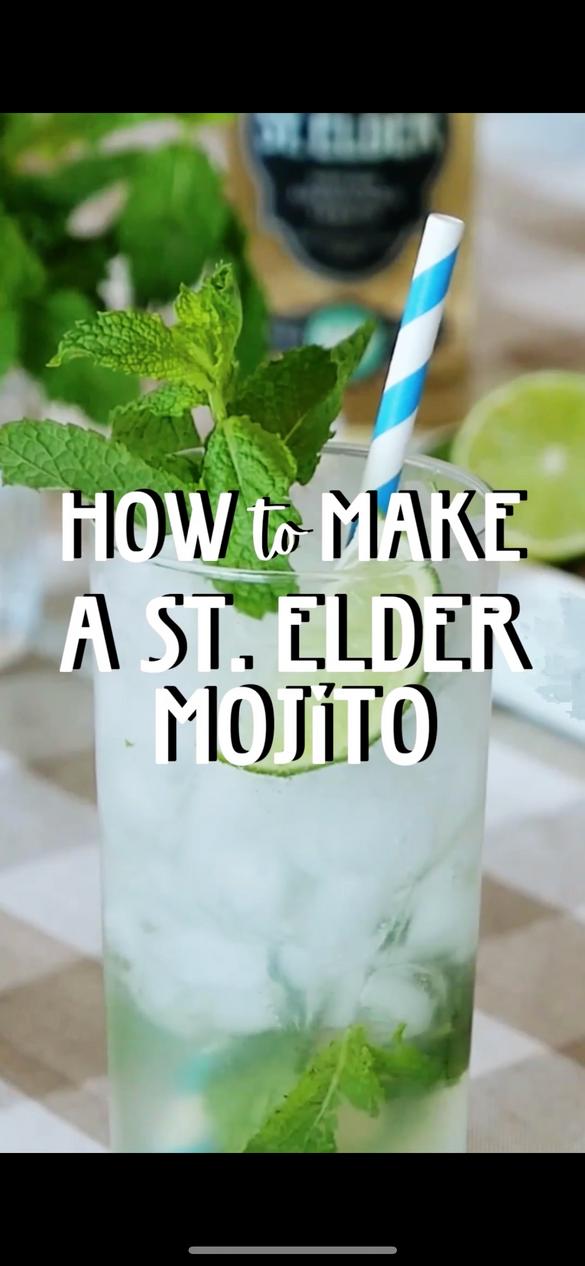
Reels continue to dominate our cocktail content strategy, and they are performing as well as ever. Instagram had multiple updates. The biggest change was the shift in video content, which is now exclusively shared as the Reel format and this includes all past videos, stop motion and animated graphics.
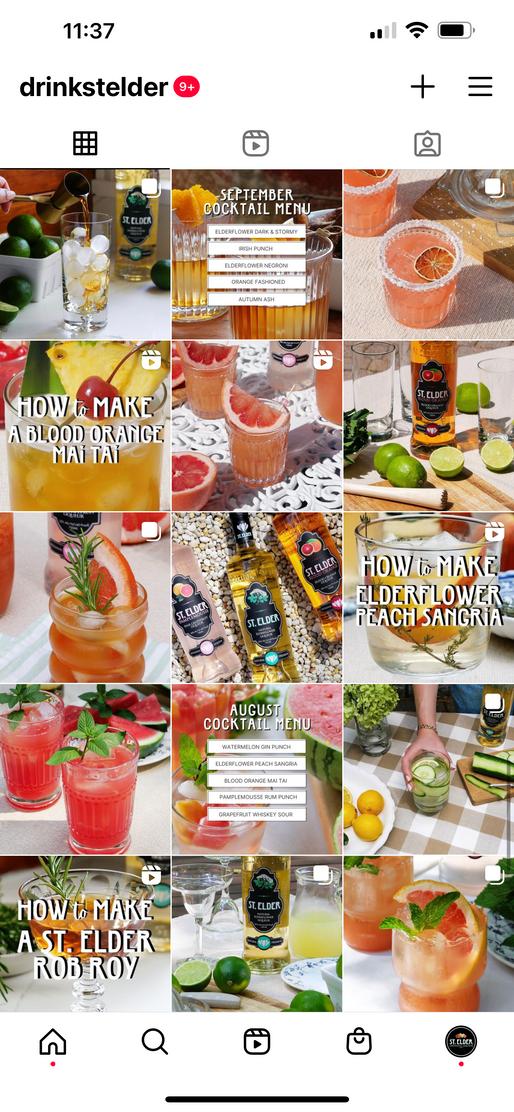
Instagram also launched the ability to boost Reels, which will improve our social spending strategy moving forward.


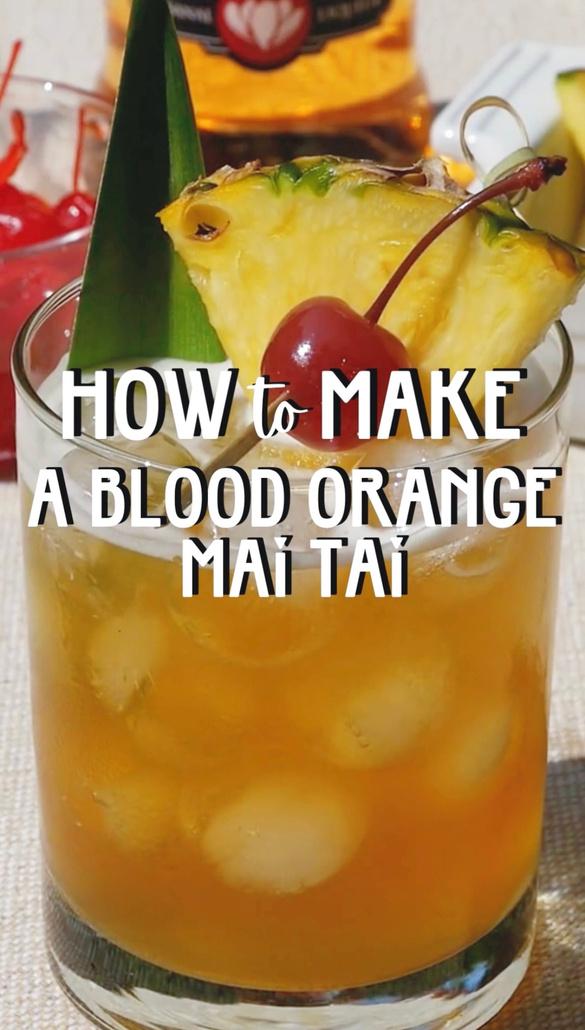
JULY 8TH Q3 TOP POST INTERACTIONS AUGUST 5TH AUGUST A30TH UGUST 10TH 570 INTERACTIONS REEL UNPAID Instagram post interactions = likes, comments, shares & saves 451 INTERACTIONS REEL UNPAID 431 INTERACTIONS STILL LIFE $150 SPENT 403 INTERACTIONS REEL UNPAID
AUGUST 5TH Q3 TOP LIKES AUGUST A30TH UGUST 10TH 289 LIKES REEL UNPAID 236 LIKES STILL IMAGE $150 SPENT 211 LIKES REEL UNPAID UNPAID
AUGUST 5TH Q3 FOLLOWERS FROM A SINGLE POST JULY 21ST AUGUST A13TH UGUST 26TH 106 FOLLOWERS STOP MOTION/REEL $150 SPENT 72 FOLLOWERS STILL LIFE $150 SPENT 58 FOLLOWERS CAROUSEL $200 SPENT 38 FOLLOWERS STILL LIFE $100 SPENT METRIC UNAVAILABLE FOR INSTAGRAM REELS

Q3 TOP REACH SEPTEMBER 12TH JULY 7TH AUGUST S5TH EPTEMBER 22ND 22,424 ACCOUNTS STILL LIFE $150 SPENT 19,957 ACCOUNTS STILL LIFE $150 SPENT 17,440 ACCOUNTS STILL LIFE $100 SPENT 17,421 ACCOUNTS STILL LIFE $150 SPENT
TOTAL SPEND: $1,850 1.7% ENGAGEMENT RATE OVERALL 4.6% AVE ENGAGEMENT PER POST 320,821 IMPRESSIONS 248,169 ACCOUNTS REACHED 469 NEW FOLLOWERS Q3 INSTAGRAM GROWTH METRICS engagement rate = total content interactions ÷ total reach engagement rate = total content interactions ÷ post reach .76% INDUSTRY AVERAGE
Q3 KEY INSTAGRAM TAKEAWAYS
MORE REELS, MORE ENGAGEMENT
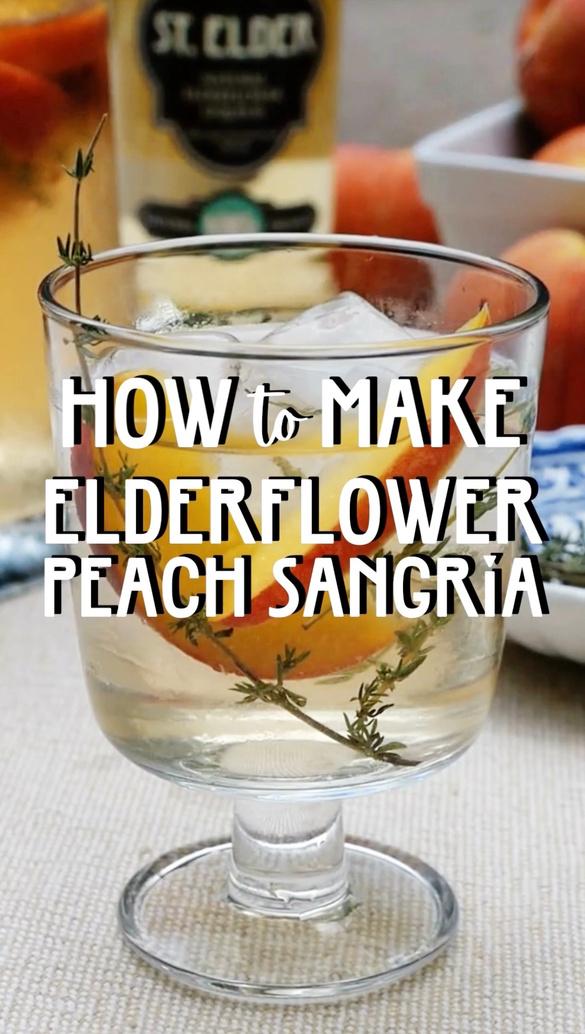
Reels continue to be a priority to our social calendar. In Q3, we increased frequency and format. Cocktail Reels continue to dominate overall engagement and post interactions
Pay to play
In Q3, engagement rate across all industries fell 30% to .67%, meaning less user activity. This makes sponsored posts more crucial than ever. It's worth noting that this rate is still much higher than Facebook (.064%) & Twitter (.037%).
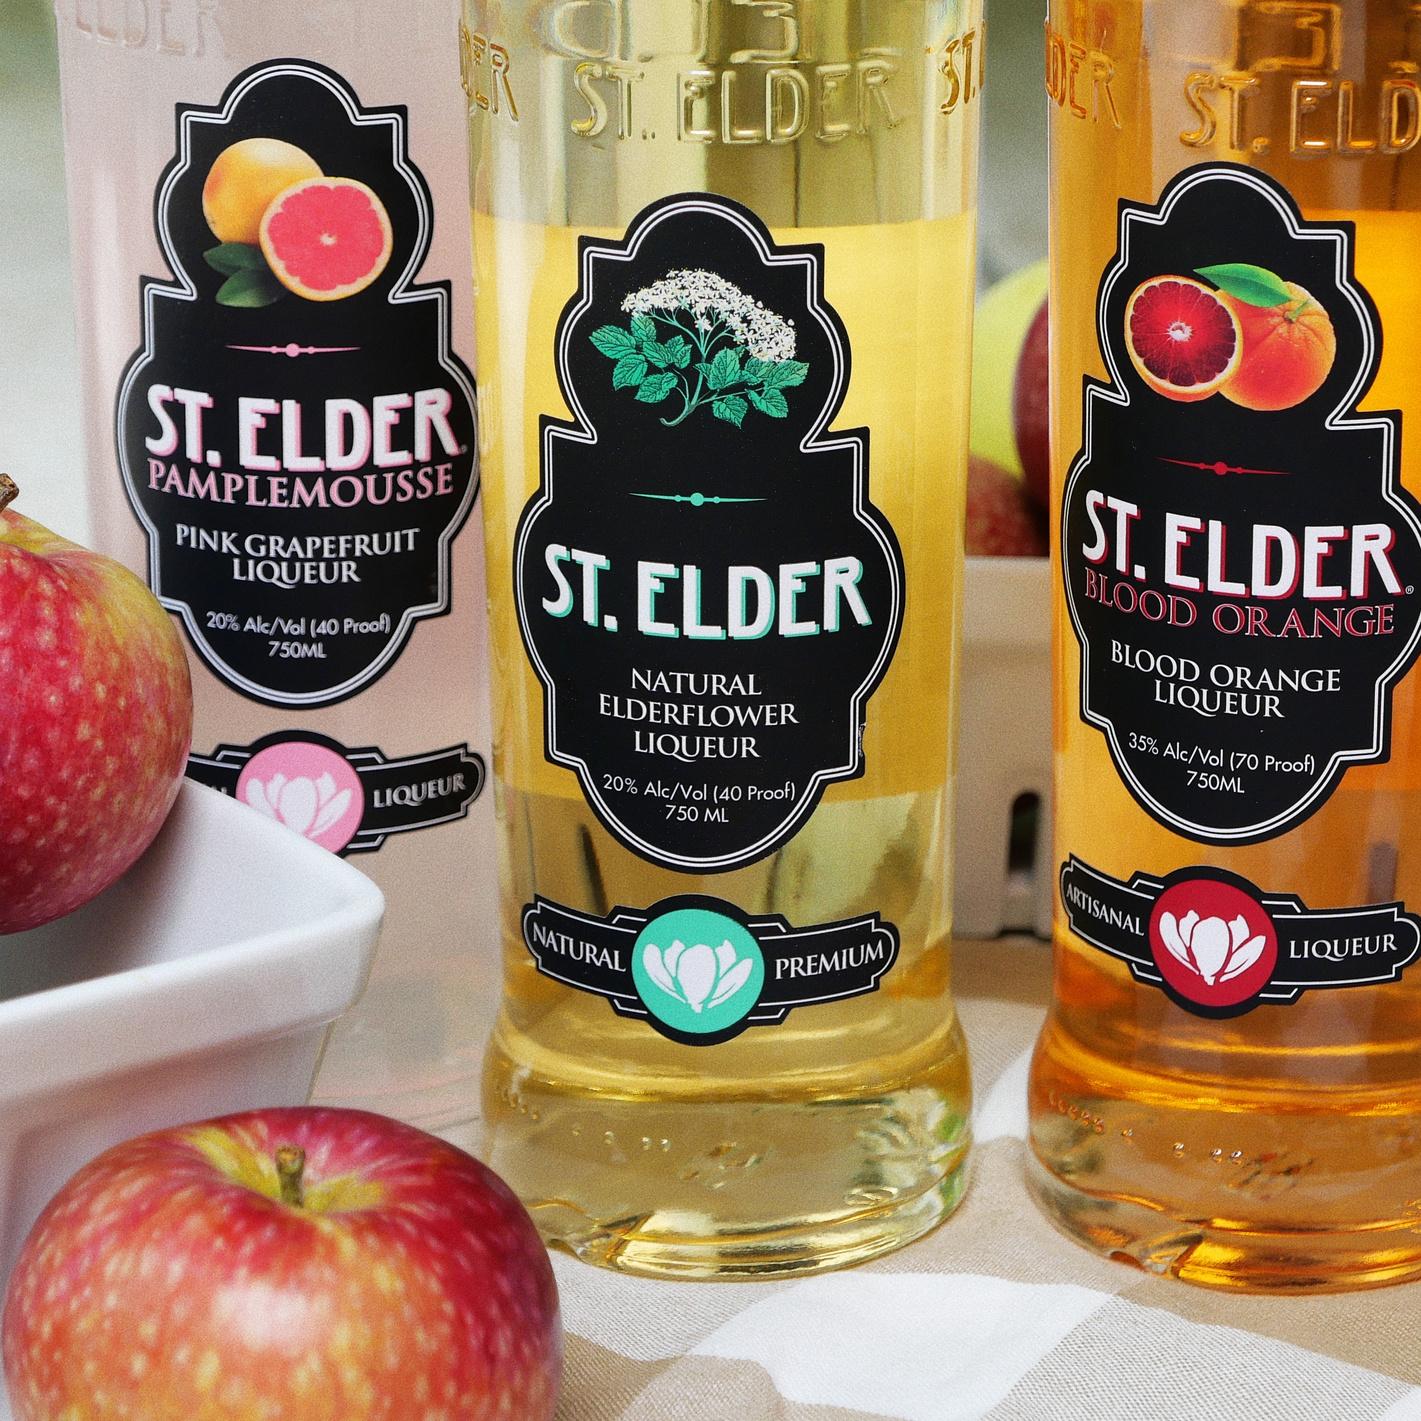
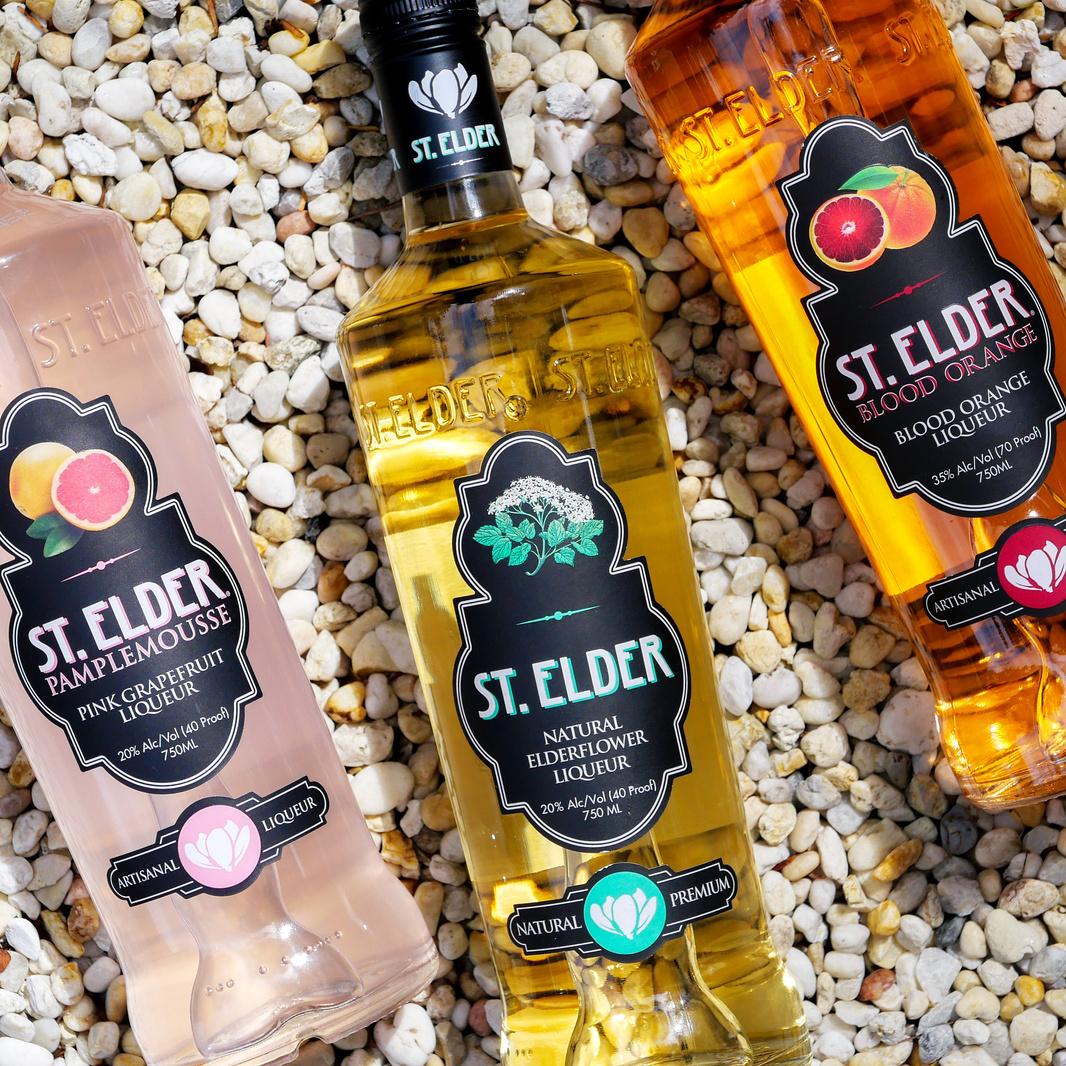
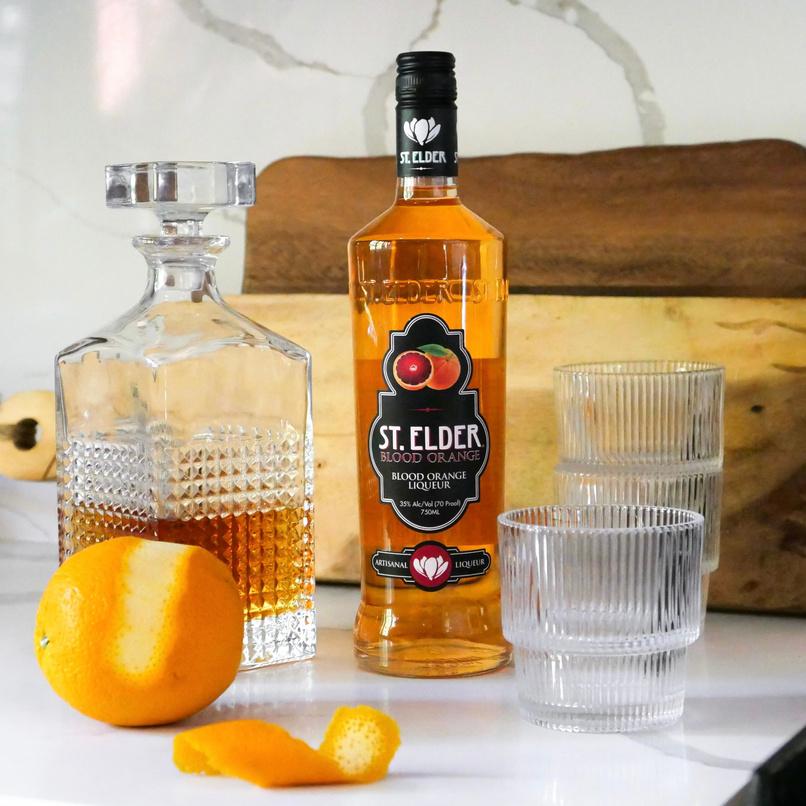
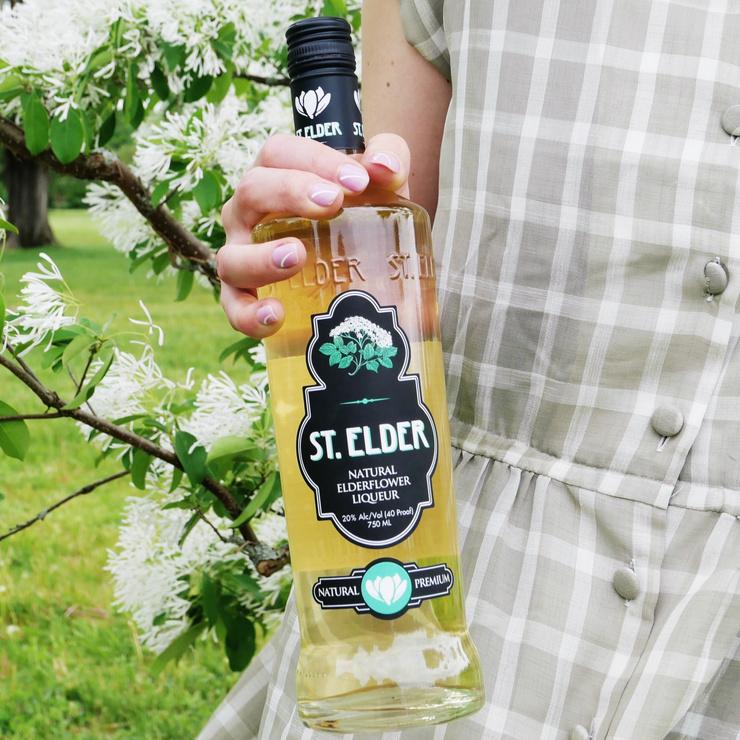
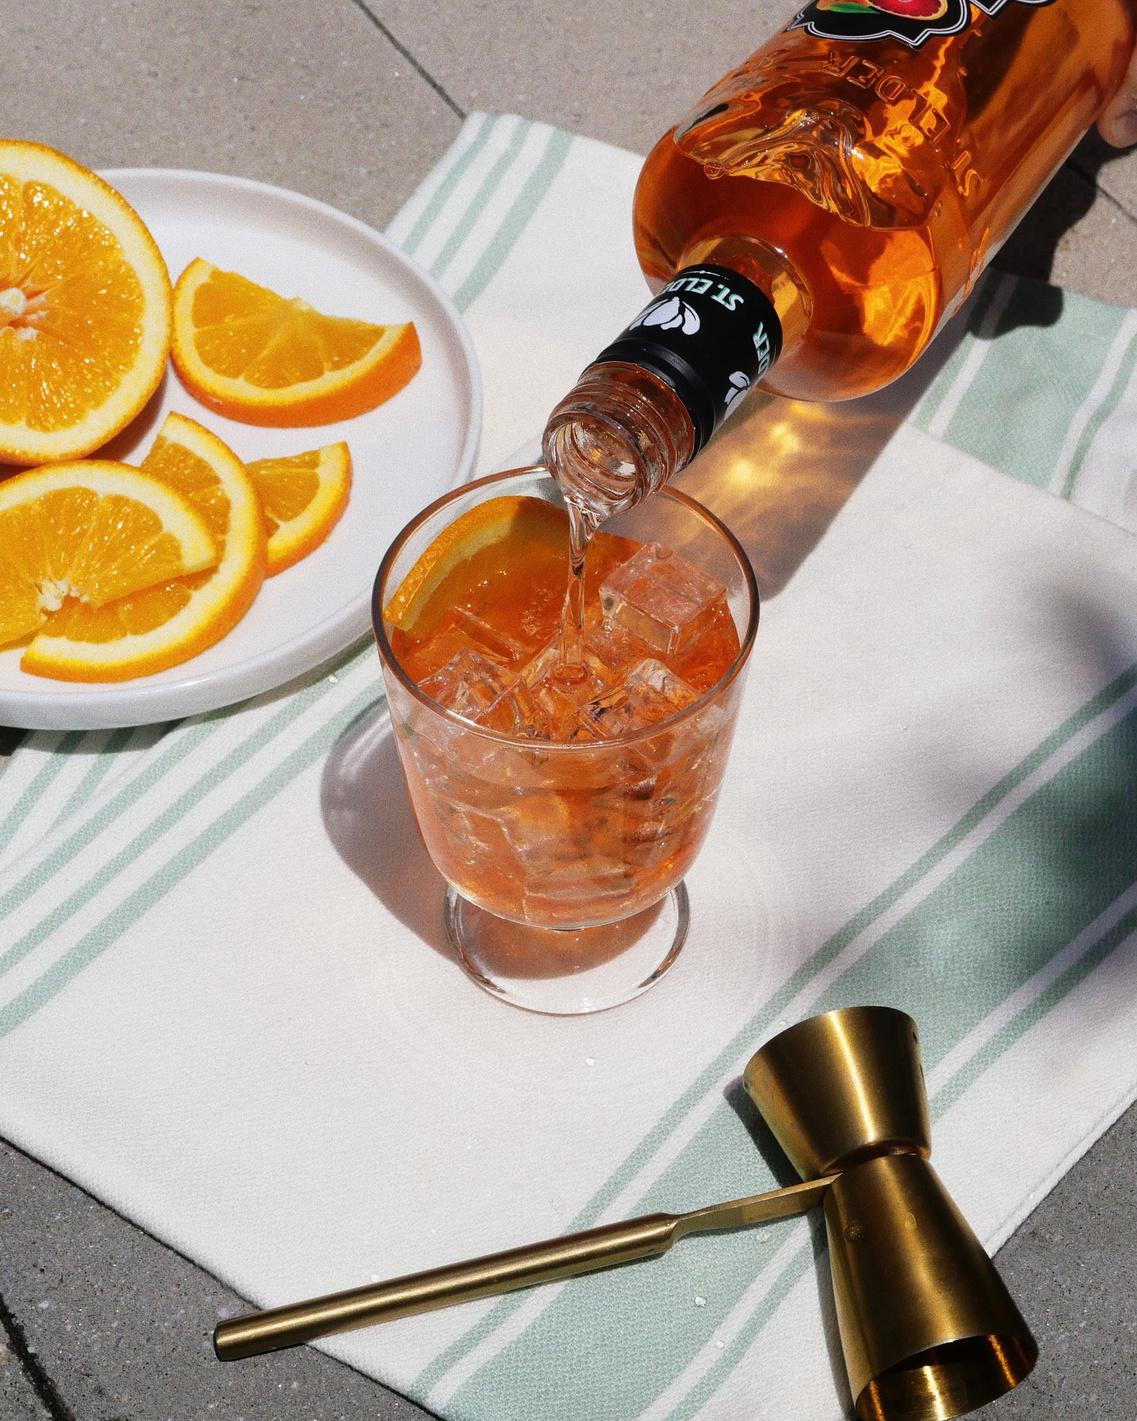
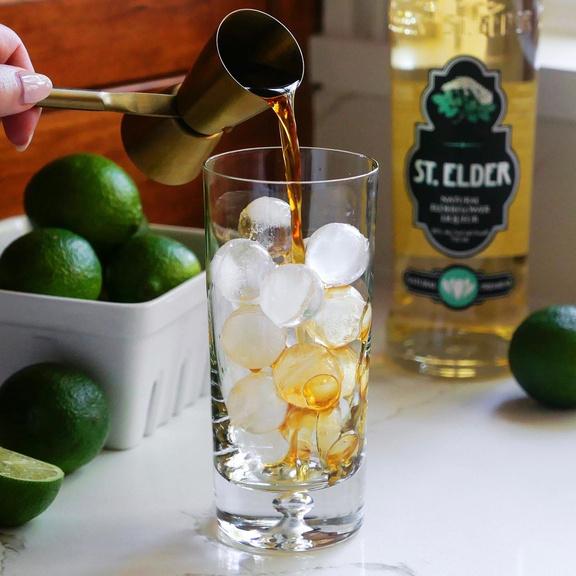
BOTTLE SHOT bump
Boosted posts that include a bottle in the visual reached the largest audience

Q3 FACEBOOK PAGE METRICS 2,484 NEW PAGE LIKES 187,911 ACCOUNTS REACHED 1.3% ENGAGEMENT RATE .1% INDUSTRY AVERAGE
SPEND: $2,250 ACCOUNTS REACHED: 54,687 PAGE LIKES FROM ADS: 2,462 COST PER LIKE: $0.91 Q3 FACEBOOK AD INSIGHTS
AUGUST 31ST Q3 FACEBOOK TOP REACH JULY 12TH 654 REACH JUNE 3RD 1,096 REACH *this was a gallery post with a collection of Summertime cocktails 609 REACH AUGUST 16TH 560 REACH

SEPTEMBER 2ND Q3 FACEBOOK TOP POST ENGAGEMENT RATE SEPTEMBER 22ND 5% ENGAGEMENT RATE AUGUST 12TH 5.3% ENGAGEMENT RATE GALLERY POST 4.74% ENGAGEMENT RATE JULY 1ST 4.72% ENGAGEMENT RATE Facebook engagement rate = post interactions ÷ reach
AUGUST 12TH Q3 FACEBOOK TOP POST INTERACTIONS SEPTEMBER 2ND 33 SEPTEMBER 18TH 44 29 JULY 1ST 21 Facebook Interactions = reactions, comments, shares & clicka