PUBLISHED STUDIES
For over 30 years, M&S Technologies has set the standard in computerized vision testing with cutting edge software and hardware technologies. Since our inception, we’ve invested millions of dollars in research and development. This has resulted in comprehensive testing features with unsurpassed accuracy and ease of use in all the products we provide to the field of vision care.
Over twenty years ago, M&S developed computerized clinical trial testing for a leading pharmaceutical company. Why? Because use of lighted chart boxes and paper forms in clinical trials resulted in too many errors and delays.
Today, the Clinical Trial Suite (CTS) provides researchers and sponsors a multitude of testing algorithms customized to meet the requirements of simple to complex clinical trials.
The FDA recognizes CTS Test Results for use in all phases of clinical trial and is backed by validated, peer-reviewed, and published studies by prominent industry professionals. CTS has been used in over 170 clinical trials by over 50 sponsors in 43 countries.
A product alone cannot ensure complete customer satisfaction, which is why M&S maintains an in-house team of Product Engineering and Technical Support personnel. This team, along with our 24-hour replacement warranty, web-based assistance, and strong network of distributors and industry partners fulfill our promise to provide complete customer satisfaction.
TECHNOLOGY TRAINING, INSTALLATION AND SITE CERTIFICATION
We offer training and certification services for clinical sites worldwide. The comprehensive program follows specific criteria for initial training, certification and follow-up re-certification based upon the duration of the clinical trial and specific needs of the sponsor.
Training includes, but is not limited to, review and understanding of test protocol, verification of device operation, data entry, calibration, luminance settings and test distance. Certification criteria are rigid, and investigators must demonstrate a complete understanding of testing objectives and successfully complete schedules.
STELLAR SUPPORT, WARRANTY AND EXTENDED SERVICE
• Each trial is assigned a dedicated CTS Technical and Administrative Specialist as a point of contact to assist with study protocols, implementation and most importantly ultimate service.
• CTS comes with a software warranty and technical support that lasts the duration of the trial.
• Hardware and software support is available 24 hours/day, 7 days a week to accommodate international customers and our software allows us to diagnose, remotely update, or add modules.
• Should any hardware issue arise, our “Spare-in-the-Air” Replacement Warranty Program assures that you will be up and running with a replacement unit within 24 hours. (International delivery times will vary based on location, customs, schedules.)
INTRODUCTION
Ophthalmic clinical trials typically require multiple visual acuity and contrast sensitivity measurements. Contrast sensitivity curve testing used in multi-center FDA clinical trials involve more than 100 subjects to reliably detect clinically significant losses in contrast sensitivity. Computer-based vision testing could help improve workflow and precise detection of clinically significant losses with fewer subjects. Contrast vision tests such as 10% contrast acuity, 25% contrast acuity, and contrast threshold tests for fixed optotype sizes, need careful evaluation before inclusion in clinical trials.
The purpose of this clinical study was to evaluate visual acuity and different contrast test methods using a computer-based test system to characterize the clinical effects of refractive error and to identify a robust contrast testing method for future product evaluation.
METHODS
Study Design: Prospective, monocular (right eye) measurement study in subjects who have had previous bilateral implantation of a monofocal intraocular lens conducted at two clinical sites (USA). Visual acuity and contrast sensitivity measurements were made with a computer-based system (M&S Technologies, Inc.) and a chart based system (Vector Vision).
Endpoints: Repeatability at best refractive correction and the rate of change with induced refractive error (+0.25 D, +0.50 D, and +0.75 D) were evaluated for the following:
Mesopic 100% contrast visual acuity, mesopic 25% low contrast acuity and mesopic 10% low contrast acuity (Computer-based system)
Mesopic contrast threshold at 0.30 logMAR (Computerbased system)
Mesopic contrast sensitivity curve without glare and with glare (repeatability only, no defocus testing for the glare condition) for spatial frequencies 1.5, 3, 6, 12, and 18 cpd with the computer-based and chart-based systems. Photopic uncorrected and best corrected visual acuity at 100% contrast were compared between the computer- and chart-based systems.
Ophthalmic
Evaluation of an Electronic Visual acuity for Use in
RESU lTS
Mesopic contrast sensitivity with the computer-based system was better than the chart system at 1.5 by 0.35 logunits (p<0.05 in each case, Figure 1A) and with glare 3.0 cpd by 0.16 logunits (p<0.05, spatial frequencies and glare conditions, the mean differences were within 0.13 logunits and not statistically (p > 0.05 for all comparisons). The highest contrast sensitivity (i.e. lowest contrast) available in the for 1.5 cpd and 2.08 logunits for 3 cpd, whereas the computer-based system can present up to 2.40 frequencies. This test method difference of 0.40 logunits may explain the measured difference between
FIGURE 1a
Computer vs. Chart: Mesopic, No Glare
FIGURE
Computer vs. Chart:
Contrast sensitivity test-retest showed no statistically significant differences. The mean paired differences 0.13 logunits for the computer based system (Figure 2A & 2B) and 0.11 log units for the chart system the no-glare and with-glare conditions. Test-retest standard deviation was up to 0.38 logunits for both frequencies and glare conditions. Interestingly, the computer-based system showed a constant standard chart system showed increasing standard deviation with spatial frequency.
FIGURE 2a
Repeatability: Computer-Based, Mesopic without Glare
FIGURE
Repeatability: Computer-Based,
FIGURE 3a
Repeatability: Chart-Based, Mesopic without Glare
Repeatability: Chart-Based,
© 2017 Abbott Medical Optics Inc. SC2017OTH0012 ARVO 2017
Age (years) Mean ± SD 71.3 ± 5.9 Age Group, n (%) 60 – 69 13 (41.9%) 70 – 79 15 (48.4%) > = 80 3 (9.7%) Sex, n (%) Male 12 (38.7%) Female 19 (61.3%) Race, n (%) African American 5 (16.1%) White 26 (83.9%)
VaRIablE N Mean SD. Median Min. Max. Sphere (D) 31 -0.42 0.56 -0.50 -2.25 0.75 Astigmatism (D) 31 +0.19 0.29 0.00 0.00 0.75 MRSE (D) 31 -0.32 0.55 -0.25 -2.25 0.75
TablE 1. Demographics for study subjects (N = 31 subjects)
TablE 2. Refractive Outcomes
FIGURE
Sanjeev Kasthurirangan,1 Carrie Garufis,1 Jay Rudd,2 Jonathan Solomon3 — 1Johnson & Johnson Vision,
cuity and Contrast Sensitivity Test System
Ophthalmic Clinical Trials
Vision, Santa Ana, CA, US; 2Clarus Eye Center, Lacey, WA, US; 3Solomon Eye Associates, Bowie, MD, US
RESU lTS
1.5 and 3.0 cpd without glare (p<0.05, Figure 1B). For all other statistically significantly different chart system is 1.97 logunits 2.40 logunits at all spatial between the two systems.
FIGURE 1b
Chart: Mesopic, with Glare
Mean photopic visual acuity with the computer-based system was slightly better than the chart system: 0.04 logunits for uncorrected distance visual acuity (UCDVA) and 0.03 logunits for best corrected visual acuity (BCDVA) (Table 3). The mesopic contrast acuity tests with the computer-based system showed a mean difference within 0.01 logMAR and repeatability standard deviation within 0.10 logMAR (Table 4). The contrast threshold test with the computer-based system had a mean difference of -0.01 logunits and a repeatability standard deviation of 0.08 logunits (Table 4). All four letter-based contrast tests plotted on the same graph show a roughly linear trend of increasing visual acuity with decreasing contrast (Figure 4).
TablE 3. Photopic uncorrected and best corrected visual acuity for the computer- and chart-based systems.
differences were within system (Figure 3A & 3B) across both systems across spatial standard deviation, whereas the
Computer-Based, Mesopic with Glare
4. Test-retest repeatability of the mesopic acuity and contrast threshold testing with computer-based testing.
Contrast sensitivity curves did not show a noticeable decrease with defocus (Figure 5) and only 0.0 D vs. 0.75 D was statistically significantly different (p < 0.05) at 6 cpd and 12 cpd (approximately 0.20 logunits). All four letter-based tests showed a statistically significant decrease in performance at 0.50 D and 0.75 D induced defocus, compared to 0.0 D (Table 5).
Chart-Based, Mesopic with Glare
CONClUSIONS
TablE 5. Effect of defocus on the letter-based contrast acuity and contrast threshold tests with the computer-based system
Contrast sensitivity testing with the two systems was largely equivalent with similar repeatability (0.38 logunits).
The computer-based system measured slightly better contrast sensitivity at low spatial frequencies, likely due to the limited range of contrast available in the chart-based system.
Visual acuity testing was slightly better (2 letters) with the computer-based system compared to the chart-based system.
Mesopic visual acuity (100% contrast, 25% contrast and 10% contrast) and contrast threshold for a fixed letter size measured with the computer-based system showed very good repeatability of approximately 1 letter for the letter-based tests and 0.01 logunit for the contrast threshold test.
The letter-based tests showed a clear reduction in performance with induced optical defocus compared to the spatial contrast sensitivity test.
FIGURE 2b
FIGURE 3b
VaRIablE N Paired Difference Mean SD Median 95% CI UCDVA 31 -0.04 0.11 -0.02 -0.09 -0.00 BCDVA 31 -0.03 0.06 -0.04 -0.05 -0.01
letter Test N Paired difference Mean SD Median 95% CI 100% (logMAR) 31 -0.01 0.06 0.00 -0.12 0.11 25% (logMAR) 31 -0.01 0.04 0.00 -0.09 0.07 10% (logMAR) 31 0.00 0.10 0.02 -0.20 0.21 Sensitivity for 20/40 letter (logunits) 31 -0.01 0.08 0.00 -0.16 0.15
FIGURE 4 0 0.25 0.50 0.75 1.00
TablE
FIGURE 5 letter Test 0.0 D vs. 0.25 D 0.0 D vs. 0.50 D 0.0 D vs. 0.75 D Paired Mean (95% CI) Paired Mean (95% CI) Paired Mean (95% CI) 100% (logMAR) -0.05 (-0.08, -0.02) -0.10 (-0.14, -0.06) -0.17 (-0.22, -0.12) 25% (logMAR) -0.03 (-0.05, -0.00) -0.06 (-0.09, -0.03) -0.13 (-0.17, -0.09) 10% (logMAR) -0.01 (-0.04, +0.01) -0.04 (-0.07, -0.02) -0.10 (-0.14, -0.06) Sensitivity for 20/40 letter (logunits) -0.04 (-0.07, +0.00) -0.10 (-0.15, -0.04) -0.17 (-0.24, -0.10)
Financial Disclosure: Sanjeev Kasthurirangan, Carrie Garufis, Abbott Medical Optics, E, Employment; Jay Rudd, Jonathan Solomon, Abbott Medical Optics, F, Financial Support
4229
Article Comparison of Backlit and Novel Automated ETDRS
Visual Acuity Charts
Paul A. Harris, OD, Southern College of Optometry, Memphis, Tennessee
Laurel E. Roberts, Southern College of Optometry, Memphis, Tennessee
Rachel Grant, OD, Southern College of Optometry, Memphis, Tennessee
ABSTRACT
Background: This study was conducted to compare two different methods and presentation systems of testing visual acuity to determine whether they are equivalent.
Methods: We compared the results of taking visual acuity (VA) measures with the standard backlit Early Treatment of Diabetic Retinopathy Study (backlit ETDRS) and Automated ETDRS (A-ETDRS) VA charts (M&S Technologies, Inc., Niles, IL) on 111 healthy subjects with corrected visual acuity of 20/20 or better. Testing was done under four conditions— with spectacles, uncorrected, with +1.50 blur over spectacles, and with +3.00 blur over spectacles—to assess correlation of primary outcomes between charts across a wide range of acuity measures. Visual acuity measures were recorded in letter count, logMAR, and standard Snellen measures.
Results: Correlations between the backlit ETDRS and the A-ETDRS chart types were 0.93 (uncorrected), 0.60 (with spectacles), 0.76 (+1.50 blur over spectacles), and 0.50 (+3.00 blur over spectacles), with all correlations statistically significant at p< 0.001.
Conclusion: This study shows that traditional backlit ETDRS and A-ETDRS charts are functionally equivalent to each other under a variety of testing conditions, mimicking both clinical and research applications. Additional benefits of the automated system over the backlit charts include: the ability to calibrate the system precisely, faster testing and scoring times combined, and less chance for error to enter into the conversion of the raw data into logMAR, letter, or Snellen scores. For all of these reasons, Automated-ETDRS testing is preferred.
Keywords: automated testing, backlit screen, digital screen display, Early Treatment of Diabetic Retinopathy Study, electronic vision chart, ETDRS, logMAR, optotype, Snellen, Visual acuity
Background
Visual acuity is one of the most important tools in determining visual function and has been established as the “gold standard” in prospective clinical trials, especially regarding eye disease and treatment. 1,2 The assessment of visual acuity with optotype charts is the most standardized test of visual function. These high-contrast printed charts include black optotypes, letters, or symbols on a white background and are externally illuminated.
The charts allow a diverse patient population to be tested. Theoretically, visual acuity testing should give a precise, reproducible, and reliable result that represents the state of macular function. The testing further implies that any acuity changes are related to disease or treatment. However, visual acuity can be influenced and altered by external factors, including but not limited to exam room lighting, contrast, design of the chart, subject motivation, and scoring technique. 3,4
Optometry & Visual Performance 87 Volume 6 | Issue 2 | 2018, April
The Snellen eye chart is the most widely used method of visual acuity measurement in clinical practice, in part due to its ease of use and availability. Snellen’s original chart had a single large letter at the top, and with each successive row, the letters became more numerous and progressively smaller.5 The letters are not equal in their legibility; there is also unequal letter and line spacing.

4,6,7 In addition, since its original conception, many variations in size, sequence, chart layout, and design of the optotypes were made; subsequently, there is no broadly accepted “standard” Snellen chart.5 Most commonly, visual acuity measurements are determined under high-contrast conditions, as previously mentioned. Over time, the required contrast level for the chart can be impacted by stains and fading, which may alter reflectivity. Room position and room illumination may also introduce variability.3
ETDRS Standards
The Early Treatment of Diabetic Retinopathy Study (ETDRS) chart is based on the previously designed Bailey-Lovie logMAR chart to establish a standardized measurement of visual acuity. The inclusion of administration and scoring protocols serves to improve the precision of visual acuity measurement in the range of poorer visual acuities.5 The ETDRS chart
has been recognized to be highly reliable for vision testing1 and has been considered one of the standard tools for measuring acuity in prospective clinical research for more than 30 years.
1,8,9 Each Sloan letter on the ETDRS chart (ten in total) has approximately equal legibility or difficulty, and each line has the same overall difficulty.10 Each row contains five letters, with the spacing between each letter being equal to the width of one letter and the space between lines being equal in height to the letters of the next lower line.10 The letter size from row to row changes in equal logarithmic intervals.4,6 The chart itself is non-reflective, white, highimpact polystyrene with the black letters creating a contrast level of approximately 90%. The accompanying light box produces a standardized illumination of 120 cd/m2, which conforms to the ANSI specifications.3,11,12 All other light sources in the room should be turned off to reduce any potential glare sources.
Although considered the standard for clinical research, ETDRS and other logMAR charts are not widely used in clinical practice.16 As evidence of this, at Southern College of Optometry, the 90+ clinical testing lanes and the 50+ student practice lanes are equipped with computerbased chart systems, while there are only two ETDRS charts in place for compliance with specific FDA clinical protocols. This ratio is similar in most North American optometry schools. It is thought that the test format, including the length of test administration, unfamiliar scoring,
Optometry & Visual Performance 88 Volume 6 | Issue 2 | 2018, April
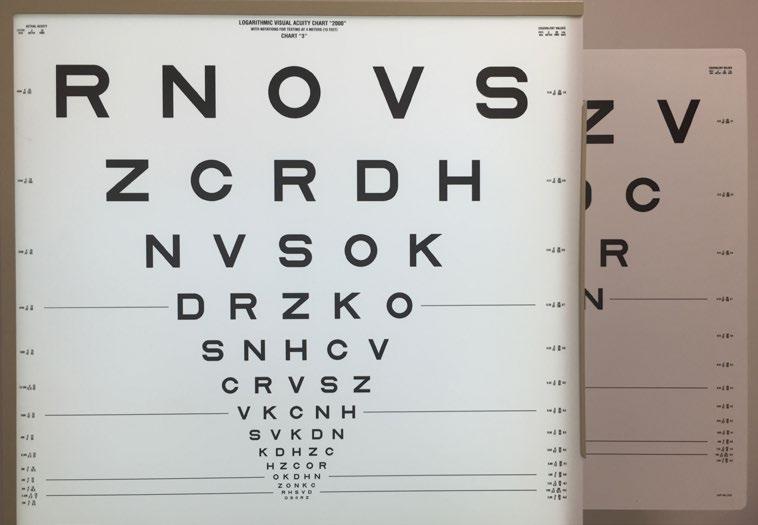
Figure 1. The backlit ETDRS chart with the A-ETDRS computer screen behind. The backlit chart starts at 20/200, while the A-ETDRS chart starts at 20/100. The sizes of the letters and spacing from 20/100 to 20/10 are exactly the same.
Figure 2. The A-ETDRS opening screen.
and patients memorizing letter sequences, as well as the inherent difficulty in discussing logMAR acuity with patients, contribute to the practical limitations.9,14,15
The standard ETDRS chart is a large, floor-mounted, backlit device that takes up a significant amount of space and requires manual changes amongst the three provided plastic sheets (Figure 1).
The Automated ETDRS chart (A-ETDRS; M&S Technologies, Inc., Niles, IL),5 which is part of the Clinical Trial Suite offered by M&S, has the potential to make the test more portable, more difficult to memorize, easier to score, and it may speed up testing time (Figure 2).
Computerized Testing
Technological advancements have improved the incorporation of technology, such as computer-based displays, in all facets of health care, including electronic vision testing. Various forms of electronic and automated displays exist on the market and continue to gain popularity with patients and practitioners alike. The inevitable trend towards using more computer-based displays for the measurement of visual acuity has specific research advantages that come from computer control of visual displays for measuring visual acuity.5 Computer displays can provide selectable options, such as optotypes, spacing and crowding arrangements, contrast, and color. Research has shown that another advantage of a computerized acuity system is the ability to increase the test-retest repeatability through repetition and averaging of measurements.8,16 Furthermore, a computerbased acuity chart allows random order presentation and automated processing.8
Purpose
This study was conducted to compare two different methods and presentation systems of testing visual acuity to determine whether they are equivalent. Should that aim be met, then additional benefits would accrue to the
user of A-ETDRS. In many clinical studies, subjects spend a great deal of time, under many different conditions, reading the backlit ETDRS charts from top to bottom, over and over. Since there are only three different charts, which must be manually changed, there is a chance that subjects could begin to know some of the letter sequences in those charts. This could lead to an overestimation of their visual acuity, which is not related to the specific testing or experimental condition. Randomization of each “chart” in the A-ETDRS configuration would eliminate memorization from prior exposures, thus increasing the validity of the measure.
An additional benefit that would result from the aim being met is increased reliability in the calculation of the letter count, from which the logMAR and/or visual acuity measure is derived. The standard backlit ETDRS charts must be manually scored. This process is highly repetitive and adds time to the process of getting the letter count. The A-ETDRS system immediately provides the user with all of the scores needed, without the need for a separate recording system or the counting or calculation of any of the scores. This should save time and guarantee that the measures reported are indeed the measures obtained.
This study also addresses some of the issues raised in discussion of some early attempts to computerize the ETDRS testing process.17 Issues that have been raised include pixelation of the letters on the computer screen, where individual pixels are visible to the naked eye, and anti-aliasing.a These specifically affect the ability cleanly to present letters smaller than 20/20 on older computer monitors. Smaller screens limit the size of the largest letter that can be shown to a subject. Larger computer monitors with smaller pixels, packed much more closely together on the screen in both the vertical and horizontal dimensions (dot pitch), combine to allow for much larger letters than before, while being able to present letters down
Optometry & Visual Performance 89 Volume 6 | Issue 2 | 2018, April
to 20/8 Snellen visual acuity levels. Aliasingb occurs in computer graphics when a screen cannot render as smooth a curve as intended and it appears on the screen as jagged. When viewed extremely closely, what is seen are small steps rather than smooth curves. Anti-aliasing software has been used to attempt to minimize these effects. The typical panel displays used now in these systems do not need anti-aliasing software because of the smaller dots, which are packed much more closely together. The M&S Technologies Smart System II used in this study has a 22-inch digital flat panel screen with a resolution of 1680 x 1050.
Lastly, the new control systems, which use a separate tablet with built-in scoring, should allow for faster data collection times.
Methods
One hundred and eleven (N=111) secondand third-year students from Southern College of Optometry (SCO), with corrected visual acuity of 20/20 or better binocularly, had their visual acuity taken eight separate times, with each of the conditions being randomized. Visual acuity was measured four different times on each of the two different types of charts. The four conditions for each chart included: with spectacles, without spectacles, with +1.50 spheres over spectacles, and with +3.00 spheres over spectacles. For each subject, randomization was across all 8 conditions, and all testing was done on the same day at a single sitting. The randomization table was generated by research randomizer.c All testing was done at 4 meters. The standard ETDRS protocol has the subject wearing a +0.25 DS lens to compensate for this distance. The +0.25 lens was not used in any of our 8 test conditions. We created the two pairs of spectacles for testing, one pair of +1.50 spheres and the other of +3.00 spheres, in frames large enough to allow them to be worn over the subjects’ own spectacles without difficulty. Those subjects who wore contact lenses were asked not to wear their contact lenses on the day of testing, but instead
to wear their spectacle correction. This made the randomization of the uncorrected conditions on both the backlit and the A-ETDRS charts less time-consuming than if we had our subjects remove their contact lenses and then readapt to them for the next condition.
All testing was done binocularly in a room where the only illumination came from the two charts. Both displays were on all the time. Whenever a backlit chart was to be used for testing, one of the three charts was selected based on a randomization table. It should be noted that for each subject, four different measures were made on the backlit chart, but there are only three different charts. Each chart had an equal chance of being used at any time. Although it was time-consuming to change the charts manually, it was done to minimize any chance of a subject memorizing the charts, as well as to simulate formal research protocols. In the cases where the randomization table indicated that the same backlit chart was to be used again, the researcher went through the chart changing routine and simply put the prior chart back in position. This was to encourage the thought in the subjects that the charts were different each time.
When the backlit ETDRS charts were used, printed score sheets were available for each of the three charts. The appropriate score sheet was selected, and the subject was asked to read each letter distinctly from the top of the chart. Every letter was marked on the recording form as either correct or incorrect. The total number of letters correct was recorded, and a conversion chart was used to derive the logMAR and Snellen score for that condition.
The protocol used to measure visual acuity with these charts followed standard ETDRS research protocol, where for every measurement, letters were read at a speed of one per second, beginning at the top left of the chart and proceeding line by line, left to right, with an opportunity to correct an error only before the next letter was attempted. The
Optometry & Visual Performance 90 Volume 6 | Issue 2 | 2018, April
procedures for encouraging letter recognition and the stopping rule are standardized. Training materials for Ophthalmic Clinical Trial Training and Certification are available from the Emmes Corporation.d The researchers did not anticipate any of the subjects triggering the standard protocol for the conditions when visual acuity was worse than 20/200. When this was encountered, the A-ETDRS program returned a standard value of 20/250 and a letter count of 34, and similar results were recorded with the backlit ETDRS chart. The portion of the standardized testing protocol used to change the working distance to one meter was not done.
The A-ETDRS uses an Android tablet with the M&S Technologies, Inc. custom control program, which synchronizes with the main Smart System through a Bluetooth connection. Each time the protocol is run, the chart provides a random sample of the 10 ETDRS letters, making memorization of the chart impossible. There are two phases of determining the endpoint

of visual acuity measures, range-finding and thresholding. During the range-finding phase, the subject finds the smallest line of letters that they believe they can read completely correctly and proceeds to read them aloud. The operator presses the button on the control software that corresponds to that line of letters. Figure 3 shows the screen from the tablet. The letters shown to the subject on the display screen are also displayed to the operator on the tablet.

Figure 4 shows the screen that the subject would see after the operator presses the number 20 on the tablet’s screen, indicating that the subject got all the letters correct on the 20/20 line but made a mistake on the 20/16 line. At this point, the program switches to the thresholding phase. Now the tablet asks the operator to specify how many letters the subject correctly reports on each subsequently smaller line and finally stops either when the subject is unable to get any letters correct on the next smaller line or no more smaller lines exist to be shown.
After the A-ETDRS testing is complete, the system saves the results and reports the test results to the main screen, which can be printed. A sample set of data includes the eye (Right, Left, or Both), test distance (4 meters in this protocol), spectacles (on or off), light level (photopic vs. mesopic), and the visual acuity results in three forms (letter score, visual acuity, and logMAR). The letter score is the total number of letters that the subject said correctly, which results in a standard Snellen equivalent and a logMAR score. For example, a letter score of 87 converts to a Snellen VA of 20/20 and a logMAR score of -0.04.
Test times were measured for all trials using a stopwatch function on the investigator’s smart phone. Timing started as soon as the A-ETDRS chart was presented and terminated when the program displayed the scores to the computer screen for recording. For the backlit chart, timing was started when the subject said the first letter and finished when they were no
Optometry & Visual Performance 91 Volume 6 | Issue 2 | 2018, April
Figure 3. Android tablet with control program showing the lines from 20/50 to 20/16 in the red background area. Pressing the “Up” or the “Down” buttons on the screen changes the display to different parts of the chart.
Figure 4. The A-ETDRS opening screen.
Table 1 .logMAR scores by condition and chart type. Note: Significance test based on paired t-tests for Automated vs. Backlit on the common sample within each condition.
Note: Significance test based on paired t-tests for Automated vs. Backlit on the common sample within each condition.
longer able to get any letters correct. Time to change the plastic test cards in the backlit box was not included in the timing, nor was the time to count and score the subject’s results.
Weber Contrast was calculated for each of the targets using measurements collected with the Konica-Minolta LS-110 luminance meter, which measures the amount of reflected or emitted light from an area of 0.33 of a degree. On the backlit box, the white area was 181 cd/m2, while the black was 1.35 cd/m2. This produced a Weber Contrast of 99.25%. On the M&S Technologies A-ETDRS screen, the white was 120 cd/m2, and the black was 0.72 cd/m2, which produced a Weber Contrast of 99.4%. The backlit box was not adjustable in luminance. The M&S system was at its calibrated light value of 120 cd/m2. Both are compliant with ANSI Z80.21-2010 (R2015) and ISO 8597:1994(E) standards.11,12
All subjects gave informed consent after a verbal and written explanation of the experiment, which was approved by the Southern College of Optometry Institutional Review Board in accordance with the Declaration of Helsinki.
Statistical Analysis
Measurement of visual acuity with the ETDRS charts yields two different scores. The first is a Letter Score, which is a count of the total number of letters correct from the largest letter until the subject stops getting letters correct.
There is also a calculated logMAR visual acuity level assigned to this value.
LogMAR scores for both Backlit ETDRS and A-ETDRS chart types were compared under each of four testing conditions (uncorrected, with spectacles, +1.50 blur over spectacles, and +3.00 blur over spectacles) using paired t-tests. Findings were also confirmed using nonparametric alternatives (Wilcoxon sign-rank tests), as well as a repeated measures analysis of variance (ANOVA), which yielded the same conclusions. Thus, for ease of presentation, the mean comparisons of each chart type at each testing condition are shown here. BlandAltman plots were used to illustrate agreement between A-ETDRS and Backlit ETDRS chart types. Correlations between A-ETDRS and Backlit ETDRS chart types were examined using Pearson’s r.
Results
Analyses were conducted using Stata/SE software, version 13.e Table 1 shows means, standard deviations (SDs), standard errors (SEs), and 95% confidence intervals comparing logMAR scores on A-ETDRS and Backlit ETDRS charts for each condition. There were no significant differences between the chart types at any condition. Figure 5 shows mean logMAR values for Automated and Backlit charts graphically, with error bars. The widest standard deviations exist for the uncorrected measures,
Optometry & Visual Performance 92 Volume 6 | Issue 2 | 2018, April
mean SD SE 95% Confidence Interval (CI) Difference Sig With spectacles (n= 110) Automated -.16 .12 .01 -.18, -.14 -.001 p = .89 Backlit -.16 .10 .01 -.18, -.14 Uncorrected (n= 87) Automated .20 .47 .05 .10, .30 -.028 p = .13 Backlit .23 .46 .05 .13, .32 +1.5 Blur over spectacles (n= 111) Automated .29 .22 .02 .24, .33 -.005 p = .70 Backlit .29 .20 .02 .25, .33 +3.0 Blur over spectacles (n= 102) Automated .71 .21 .02 .67, .75 -.010 p = .62 Backlit .72 .19 .02 .69, .76
and here the visual acuities measured trended to be worse with the backlit ETDRS. However, the differences were neither statistically nor clinically significant. Figures 6 to 9 show Bland-Altman plots for each study condition, which plot the difference of the paired chart vs. their average. There were only very few cases where individual values fell outside the range of agreement.


Correlations between Automated and Backlit chart types were 0.93 (uncorrected), 0.60 (with spectacles), 0.76 (+1.50 blur over spectacles), and 0.50 (+3.00 blur over spectacles), with all correlations statistically significant at p< 0.001.
It was decided to eliminate any data points in the Bland-Altman plots when one or both logMAR values was greater than 1.0, because we had not anticipated that we would have significant numbers of these measures. Indeed, only 9 subjects in the +3.00 blur and 24 subjects

Optometry & Visual Performance 93 Volume 6 | Issue 2 | 2018, April
Figure 5. Mean logMAR values for Automated and Backlit EDTRS charts
Figure 6. Bland-Altman plot for the “with spectacles” condition.
Figure 7. Bland-Altman plot for the “uncorrected” condition.
Figure 8. Bland-Altman plot for the “+1.50 blur over spectacles” condition.
Figure 9. Bland-Altman plot for the “+3.00 blur over spectacles” condition.
in the uncorrected conditions had one or more logMAR measures greater than 1.0. This accounted for the different number of subjects in each direct comparison. Figure 6 shows the Bland-Altman plot for the “with spectacles” condition. Three of the 110 subjects (2.73%) fell outside the 95% limits of agreement.
Figure 7 shows the Bland-Altman plot for the “uncorrected” condition. Three of the 87 subjects (3.45%) fell outside the 95% limits of agreement. The number of subjectsfor this condition was the smallest, because 24 of the subjects had either the A-ETDRS or the backlit ETDRS visual acuity worse that 1.0 logMAR and therefore were not included in the analysis.
Figure 8 shows the Bland-Altman plot for the “+1.50 blur over spectacles” condition. Four of the 111 subjects (3.6%) fell outside the 95% limits of agreement.
Figure 9 shows the Bland-Altman plot for the “+3.00 blur over spectacles” condition. Six of the 102 subjects (5.88%) fell outside the 95% limits of agreement. The N for this condition was reduced to 102 as nine subjects had either the A-ETDRS or the backlit ETDRS visual acuity worse than 1.0 logMAR.
The authors independently took the raw scores from the A-ETDRS testing and verified that the computer algorithm indeed yielded the correct Letter and logMAR Scores for each measurement for the first 20 subjects.
Timing data for all 444 trials on the A-ETDRS chart across all conditions averaged 21.24 seconds (SD 18.6 seconds), with a range from 3 to 180 seconds. The average time varied across the conditions, with the corrected measures averaging the fastest (24.88 seconds SD 9.9 seconds) The “+3.00 blur over spectacles” condition averaged 39.1 seconds (SD 25.7).
Timing data for all 444 trials on the backlit ETDRS averaged 18.7 seconds (SD 11.9 seconds), with a range from 2 to 117 seconds. This was only the time to perform the test and did not include the time to score the results or to change the chart prior to starting each trial (Table 2).
Discussion
The four different testing conditions for each chart were chosen to represent both real-world conditions (uncorrected and with spectacles) as well as some research-based conditions (simulated 1.50 D and 3.00 D of uncorrected myopia). We did not anticipate any of our subjects triggering the standard protocol for the conditions when visual acuity was worse than 20/200. When this was encountered, the A-ETDRS program returned a standard value of 20/250 and a letter count of 34. As we reviewed the results, nine subjects in the “+3.00 blur over spectacles” and 24 subjects in the “uncorrected” group had visual acuities worse than 20/200, or logMAR greater than 1.0. In future studies, we will repeat measures in those conditions following the standard protocol, which is to reduce the working distance to one meter and repeat the testing. In that setup, the 20/200-sized letters at four meters are equivalent to 20/800 at one meter. This was not done. Measures where the visual acuity was greater than logMAR 1.0 were removed for analysis. This did not affect any measures in either the “spectacles” or the “+1.50 blur over spectacles” groups.
Calibration
In formal research settings, having testing instruments able to be calibrated is a must. Many individual systems are used for periods of years. Though the backlit ETDRS systems have been the gold standard for many years, there is no easy way to calibrate them, short of changing bulbs until the measured luminance levels are within standards. Luminance of the bulbs in the units varies, and the plastic sheets
Optometry & Visual Performance 94 Volume 6 | Issue 2 | 2018, April
All With Spectacles Uncorrected +1.50 Blur over Spectacles +3.00 Blur over Spectacles Number N=444 N=111 N=111 N=111 N=111 Average 31.2 24.8 26.8 39.1 16.6 SD 18.6 9.9 15.9 15.7 9.0 Low 3 10 3 12 10 High 180 77 95 118 180
Table 2. Timing data for each condition
are prone to yellowing over time, which reduces contrast. The A-ETDRS systems ship with a luminance measuring system, the use of which is integrated into the system. Periodically, as prompted by the software, the measuring system is suspended directly in front of the screen, and the system varies the illumination to reach the exact specified amount of 120 cd/m2. Both the bright and dark luminance measures are taken and adjusted to ensure proper calibration, within very tight tolerances. This is a major advantage of the A-ETDRS system over the backlit ETDRS targets.
Randomized letters
Two major advantages accrue to those using A-ETDRS over standard backlit charts. The scoring step is eliminated, from the hard copy made during the testing to however the results are being recorded. The first benefit is that errors are eliminated in the calculation of the score. Others have reported that in their experience, manual recording systems are prone to error.18 A second benefit is that about 30 seconds are saved, which is the typical time it takes to do the actual scoring.19
Time Saving from Automation
The new A-ETDRS is faster to use than standard ETDRS testing when scoring time on the standard ETDRS charts was added to the time needed to perform the test. The A-ETDRS system automatically scores the trial and shows all measures (letter score, Snellen visual acuity, and logMAR) immediately after the testing. All 444 A-ETDRS tests averaged 21.2 seconds (SD 18.6 seconds). Laidlaw et al. found an average time for standard EDTRS measures of 56 seconds with adult populations, and on average their computerized system was 7-10 seconds slower.18 Timing for each of the backlit ETDRS trials was recorded in our study, but these did not include the time spent scoring each of the results. We only recorded the raw data for each trial on the matching score sheet for that trial, but we did
not take the time to perform the letter count and corresponding conversion to logMAR while the subject was present. We neglected to record the time it took for scoring the data as we did it during downtime between subject sittings, and we did not add in the time to change the backlit ETDRS charts, which would affect this comparison even more. In a future study, the timing of the scoring and conversion to logMAR values as well as changing the charts should be done for each data point to be comparing like entities.
Conclusions
The findings of this study show that the traditional and automated ETDRS charts are functionally equivalent to each other under a variety of testing conditions, mimicking both clinical and research applications. Use of the A-ETDRS system by M&S Technologies is faster and less prone to recording errors or calculation errors, can be calibrated regularly, and is very easy. These findings set the stage for the adoption of the A-ETDRS chart by M&S Technologies in any clinical research study or clinical trial setting that calls for ETDRS testing.
Acknowledgments
Thank you to: Jan Gryczynski, PhD, Founding Partner COG Analytics, Potomac, MD, for his assistance with the statistics in this paper.
References
1. Beck R, Moke P, Turpin A, et al. A computerized method of visual acuity testing: Adaptation of the early treatment of diabetic retinopathy study testing protocol. Am J Ophthalmol 2003;135:194-205. http://bit.ly/2qH31bW
2. Ferris FL, Bailey I. Standardizing the measurement of visual acuity for clinical research studies: Guidelines from the Eye Care Technology Forum. Ophthalmology 1996;103:181-2. http://bit.ly/2HavdyP
3. Ehrmann K, Fedtke C, Radić A. Assessment of computer generated vision charts. Cont Lens Anterior Eye 2009;32:13340. http://bit.ly/2qJJt6C
4. Williams MA, Moutray TN, Jackson AJ. Uniformity of visual acuity measures in published studies. Invest Ophthalmol Vis Sci 2008;49:4321-7. http://bit.ly/2qJCdb7
Optometry & Visual Performance 95 Volume 6 | Issue 2 | 2018, April
5. Bailey IL, Lovie-Kitchin JE. Visual acuity testing. From the laboratory to the clinic. Vision Res 2013;90:2-9. http://bit. ly/2HdOhMA
6. Rosser D, Laidlaw D, Murdoch IE. The development of a “reduced logMAR” visual acuity chart for use in routine clinical practice. Br J Ophthalmol 2001;85:432-6. http://bit. ly/2qHCqLO
7. Ferris FL 3rd, Sperduto RD. Standardized illumination for visual acuity testing in clinical research. Am J Ophthalmol 1982;94:97-8. https://go.nature.com/2qJD37J
8. Rosser D, Murdoch IE, Fitzke FW, Laidlaw DAH. Improving on ETDRS acuities: Design and results for a computerised thresholding device. Eye 2003;17:701-6. http://bit.ly/2H9qrSu
9. Ferris FL, Bailey I. Standardizing the measurement of visual acuity for clinical research studies: Guidelines from the Eye Care Technology Forum. Ophthalmology 1996;103(1):181-2. http://bit.ly/2qISQDM
10. Ferris FL 3rd, Kassoff A, Bresnick GH, et al. New visual acuity charts for clinical research. Am J Ophthalmol 1982;94:91-6. http://bit.ly/2H9RQn3
11. American National Standards Institute, Inc. American National Standards for Ophthalmics – Instruments – General-Purpose Clinical Visual Acuity Charts, ANSA Z80.21-2010 (R2015), The Vision Council, Alexandria, VA. http://bit.ly/2qEMfds
12. Technical Committee ISO/TC 172, Optics and optical instruments – Visual acuity testing – method of correlating optotypes, International Standard ISO 8597, International Organization of Standardization 1984, Genève, Switzerland. http://bit.ly/2qIwfXO
13. Kaiser PK. Prospective evaluation of visual acuity assessment: A comparison of Snellen versus ETDRS charts in clinical practice (An AOS Thesis). Trans Am Ophthalmol Soc 2009;107:311-24. http://bit.ly/2qMtYLw
14. Lovie-Kitchin JE. Validity and reliability of visual acuity measurements. Ophthalmic Physiol Opt 1998;8:363-70. http://bit.ly/2HbPFjb
15. Kuo HK, Kuo MT, Tiong IS, et al. Visual acuity as measured with Landolt C chart and Early Treatment of Diabetic Retinopathy Study (ETDRS) chart. Graefes Arch Clin Exp Ophthalmol 2011;249:601-5. http://bit.ly/2qKEjY7
16. Shah N, Laidlaw DAH, Shah SP, et al. Computerized repeating and averaging improve the test-retest variability of ETDRS visual acuity measurements: Implications for sensitivity and specificity. Invest Ophthalmol Vis Sci 2011;52:9397-402. http://bit.ly/2HehuHC
17. McClenaghan N, Kimura A, Stark LR. An evaluation of the M&S Technologies Smart System II for visual acuity measurement in Young Visually-Normal Adults. OVS 2007;84:3:218-23. http:// bit.ly/2HehuHC
18. Laidlaw DAH, Tailor V, Shah N, Atamian S, Harcourt C. Validation of a computerised logMAR visual acuity measurement system (COMPlog): comparison with ETDRS and the electronic ETDRS testing algorithm in adults and amblyopic children. J Ophthalmol 2008;92:241-4. http://bit.ly/2qHDVJW
19. Bokinni Y, Shah N, Maquire O, Laidlaw DAH. Performance of a computerised visual acuity measurement device in subjects with age-related macular degeneration: Comparison with gold standard ETDRS chart measurements. Eye 2015;29:1085-91. http://bit.ly/2qIJic1
a. https://goo.gl/U3zCun
b. https://goo.gl/tbzBN5
c. https://www.randomizer.org
d. https://goo.gl/qaYrTu
e. https://www.stata.com
Correspondence regarding this article should be emailed to Paul A. Harris, OD, MS, at pharris@sco.edu. All statements are the author’s personal opinions and may not reflect the opinions of the representative organizations, ACBO or OEPF, Optometry & Visual Performance, or any institution or organization with which the author may be affiliated. Permission to use reprints of this article must be obtained from the editor. Copyright 2018 Optometric Extension Program Foundation. Online access is available at www.acbo.org.au, www.oepf.org, and www.ovpjournal.org.
Harris PA, Roberts LE, Grant R. Comparison of backlit and novel automated etdrs visual acuity charts. Optom Vis Perf 2018;6(2):87-96.
Optometry & Visual Performance 96 Volume 6 | Issue 2 | 2018, April
AComputerizedMethodofVisualAcuity Testing:AdaptationoftheEarlyTreatmentof DiabeticRetinopathyStudyTestingProtocol
ROYW.BECK,MD,PHD,PAMELAS.MOKE,MSPH,ANDREWH.TURPIN,PHD, FREDERICKL.FERRISIII,MD,JOHNPAULSANGIOVANNI,SCD, CHRISA.JOHNSON,PHD,EILEENE.BIRCH,PHD,DANIELLEL.CHANDLER,MSPH, TERRYA.COX,MD,PHD,R.CLIFFORDBLAIR,PHD,ANDRAYMONDT.KRAKER,MSPH
● PURPOSE: Todevelopacomputerizedmethodofvisual acuitytestingforclinicalresearchasanalternativetothe standardEarlyTreatmentforDiabeticRetinopathy Study(ETDRS)testingprotocol,andtoevaluateits test-retestreliabilityandconcordancewithstandard ETDRStesting.
● DESIGN: Test-retestreliabilitystudy.
● METHODS: Multicentersettingofastudypopulationof 265patientsatthreeclinicalsites.Visualacuitywas measuredwithboththeelectronicvisualacuitytesting algorithm(E-ETDRS)andstandardETDRSprotocol (S-ETDRS)twiceononeeyeofeachpatient.E-ETDRS testingwasconductedusingtheelectronicvisualacuity tester(EVA),whichutilizesaprogrammedPalm(Palm, Inc,SantaClara,California,USA)hand-helddevice communicatingwithapersonalcomputerand17-inch monitoratatestdistanceof3meters.
● RESULTS: FortheE-ETDRSprotocol,test-retestreliabilitywashigh(r 0.99;with89%and98%ofretests within0.1logMARand0.2logMARofinitialtests, respectively)andcomparablewiththatofS-ETDRS testing(r 0.99;with87%and98%ofretestswithin 0.1logMARand0.2logMARofinitialtest,respectively).TheE-ETDRSandS-ETDRSscoreswerehighly correlated(r 0.96forinitialtestsandr 0.97for repeattests).Basedonestimatesof95%confidence
AcceptedforpublicationAug21,2002.
InternetAdvancepublicationatajo.comNov14,2002.
FromtheJaebCenterforHealthResearch(R.W.B.,P.S.M.,R.C.B., R.T.K.),Tampa,Florida;CurtinUniversity(A.H.T.),Bentley,Western Australia;theNationalEyeInstitute,DivisionofEpidemiologyand ClinicalResearch,theNationalInstitutesofHealth(F.L.F.,J.P.S.G., T.A.C.),Bethesda,Maryland;DiscoveriesinSightResearchLabs,Devers EyeInstitute(C.A.J.),Portland,Oregon;andtheRetinaFoundationof theSouthwest(E.E.B.),Dallas,Texas.
ThisstudywassupportedbytheNationalEyeInstitutegrant#EY13095.
InquiriestoRoyW.Beck,MD,PhD,JaebCenterforHealthResearch, 3010E.138thAve.,Suite9,Tampa,FL33613;fax:(813)975-8761; e-mail:rbeck@jaeb.org
intervals,achangeinvisualacuityof0.2logMAR(10 letters)fromabaselinelevelisunlikelytoberelatedto measurementvariabilityusingeithertheE-ETDRSor theS-ETDRSvisualacuitytestingprotocol.
● CONCLUSIONS: TheE-ETDRSprotocolhashightestretestreliabilityandgoodconcordancewithS-ETDRS testing.Thecomputerizedmethodhasadvantagesover theS-ETDRStestinginelectronicallycapturingthedata foreachtestedletter,requiringonlyasingledistancefor testingfrom20/12to20/800,potentiallyreducingtestingtime,andpotentiallydecreasingtechnician-related bias.(AmJOphthalmol2003;135:194–205.©2003 byElsevierScienceInc.Allrightsreserved.)
VISUALACUITYISACOMMONPRIMARYOUTCOME measureinclinicalresearchofeyediseases.In multicenterclinicaltrials,considerableeffortis placedonthestandardizationofacuitytestingacross sites.1–3 Tomoreeasilystandardizemeasurementofvisual acuityinclinicaltrialsandtoprovideamethodtodirectly captureacuitydataelectronically,wehavedevelopeda computerizedvisiontestercalledtheelectronicvisual acuitytester(EVA).
PreviouslywereportedontheadaptationoftheAmblyopiaTreatmentStudy(ATS)visualacuitytestingprotocol fortheEVA.4 Thistestingprotocolwasdevelopedto facilitatethestandardizationofvisualacuitytestingin clinicaltrialsofpediatriceyediseaseinvolvingchildren from3to6yearsold.5
Wenowreportonthedevelopmentandevaluationofa secondtestingprotocolfortheEVA,oneforthetestingof olderchildrenandadults.Thisprotocolisbasedinparton thetestingprotocoldevelopedforEarlyTreatmentfor DiabeticRetinopathyStudy(ETDRS),1,6 aprotocolwhich hasbeenthestandardforvisualacuitytestinginmost clinicalresearchformorethan15years.Weconducteda studytoassesstest-retestreliabilityforboththeelectronic
194 0002-9394/03/$30.00 PIIS0002-9394(02)01825-1
© 2003BY ELSEVIER SCIENCE INC.ALLRIGHTSRESERVED.
(E-ETDRS)andstandardETDRS(S-ETDRS)protocols andtocomparevisualacuityscoresobtainedwiththetwo protocols.
METHODS
● DESCRIPTIONOFTHEEVA: TheEVAutilizesaprogrammedPalmhand-helddevice(Palm,Inc.,SantaClara, California,USA)thatcommunicateswithapersonal computerrunningaLinuxoperatingsystem(IBMCorp., Armonk,NewYork,USA)(Figure1).Stimuliarehigh contrast,black-and-whiteletterswithluminanceof85to 105candelas/meter2 andcontrastof98%.BothSloanand HOTVlettersetsareavailable.Singlelettersarepresented framedwithcrowdingbarsthatarespacedaletterwidth aroundtheletter.Withahigh-resolution(1600 1200) 17-inchmonitor,letterscanbedisplayedfrom20/800(1.6 logarithmoftheminimumangleofresolution[logMAR]) to20/12( 0.2logMAR)atatestdistanceof3meters. Lettersarerenderedandpresentedonthemonitorby manipulatingtheindividualpointsinagraphicalimage, knownaspixels(pictureelements).Lettersizesaredeterminedbytranslatingoctavesteps(3logMARlines)tothe numberofpixelsforagivenstrokewidth,beginningwith 3pixelsfora20/12letter.Lettersizeisaclose,butnot exact,approximationofthelogMARprogressionofthe ETDRScharts(withinabout2%ofthelettersizeateach logMARlevel).ThePalmhand-helddevice,whichis connectedtothepersonalcomputerthroughaserialcable, providesinstructionsforthetechnician,displaystheletter thatisbeingillustratedonthemonitor,recordstheresponses, andsendsinstructionstothepersonalcomputerwithregard tothesequenceofletterpresentations.Thesizeofeachletter presentationcanbeeithercontrolledbythetechnicianor determinedfromacomputerprogrambasedonthesubject’s responses.BoththelettergraphicsandthePalmapplications arewrittenintheCprogramminglanguage.
● ELECTRONICETDRSVISUALACUITYTESTINGPROTOCOL: TheE-ETDRStestingprotocolisdescribedin Figure2.Testingbeginswithascreeningphasetodetermineanapproximatevisualacuitythreshold,usingthe lettersV,R,K,andD(whichhavebeenreportedtobeof intermediateandcomparableidentificationdifficulty6). Thisphaseisfollowedbythresholdtestingtodeterminean upperlogMARlevelatwhich5of5lettersarecorrectly identifiedandalowerlogMARlevelatwhich0of5letters arecorrectlyidentified.Thespecificletterstestedateach logMARlevelarethesamelettersasthoseonthe original-seriesETDRSchartsfortherightandlefteyes.6 A letterscoretoapproximatetheS-ETDRSscoreiscomputedasthenumberofletterscorrectlyidentifiedduring thresholdtesting,plus5lettersforeachlogMARline abovetheupperboundarythrough20/800.
California,USA)hand-helddevice(bottom)thatcommunicates withapersonalcomputerrunningaLinuxoperatingsystem(IBM, Armonk,NewYork,USA).Withahigh-resolution(1600 1200)17-inchmonitor(top),singleletterscanbedisplayedfrom 20/800to20/12atatestdistanceof3meters.

ACOMPUTERIZED METHODOF VISUAL ACUITY TESTING VOL. 135,NO. 2 195
FIGURE1. Electronicvisualacuitytester.Theelectronicvisual acuitytesterutilizesaprogrammedPalm(Palm,Inc.,SantaClara,
FIGURE2. ElectronicEarlyTreatmentforDiabeticRetinopathyStudy(E-ETDRS)visualacuitytestingstrategy.Testingbeginswith ascreeningphasetodetermineanapproximatevisualacuitythreshold.Thisphaseisfollowedbythresholdtestingtodetermineanupper logMARlevelatwhich5of5lettersarecorrectlyidentifiedandalowerlogMARlevelatwhich0of5arecorrectlyidentified.
● STUDYPROTOCOL: Thetest-retestreliabilityofboth E-ETDRSandS-ETDRStestingwereevaluatedatthree sites.Thestudypopulationconsistedofindividualsage7
yearsoldandolderwhowerebeingseenaspatientsatthe threesitesandwhoagreedtoundergothetesting.The studywasapprovedbytherespectiveInstitutionalReview
AMERICAN JOURNALOF OPHTHALMOLOGY 196 FEBRUARY2003
Boards,andwasinaccordancewiththeDeclarationof Helsinki;informedconsentwasobtainedfrompatients.
VisualacuitywasmeasuredwithboththeE-ETDRSand S-ETDRSprotocolstwiceononeeyeofeachpatient.The E-ETDRStestingprotocol,whichusessingle-letterpresentationsata3-metertestdistance,isdescribedabove.The S-ETDRStestingprotocolusesa5-letterperlinechartat a4-metertestdistance.Thepatientisaskedtoreadeach letterstartingatthetopofthechart(20/200).Iffewer than20lettersarecorrectlyidentifiedat4meters,testing isalsodoneat1meter.Testingendswhennolettersare correctlyidentifiedonaline.
Forthe first151patients,therighteyewasthestudyeye; thereafter,theeyewiththeworseacuitywastestedsoasto increasethenumberofeyeswithreducedacuityinthe studysample.Attwosites(atwhich128and60patients participated)thetestingorderwasS-ETDRS,E-ETDRS, repeatE-ETDRS,andrepeatS-ETDRS.Thistestingorder permittedcompletionoftheinitialS-ETDRStesting beforeanyothertestingtoavoidinterferingwithother studiesforwhichtheS-ETDRSdatawerebeingused.At onesiteatwhich77patientsparticipated,patientswere notparticipatinginanyotherstudiesusingtheacuitydata; thereforethetestingorderoftheS-ETDRSandE-ETDRS protocolswasrandomlydeterminedfortheinitialtests, followedbyrepeattestinginthesameorder.Thetesting wasconductedinsequencewithoutabreakunlessthe patientwastired,inwhichcaseashortbreakwasgiven.In
TABLE2. BaselineCharacteristicsofSubjects
mostcases,apatient’srepeattestingwasconductedbythe sametechnicianastheonewhoconductedtheinitial testing.TheS-ETDRStestingwasconductedwithcharts placedinaretroilluminatedlightboxatatestdistanceof 4meters(aspertheprotocol,thetestdistancewasreduced to1meterwhentheletterscoreat4meterswaslessthan 20).6 TheE-ETDRStestingwasconductedatatest distanceof3meters.TheS-ETDRSletterscorewas calculatedasthenumberofletterscorrectlyidentifiedat
LetterScore LogMARValue SnellenEquivalent 5 1.6 20/800 10 1.5 20/640 15 1.4 20/500 20 1.3 20/400 25 1.2 20/320 30 1.1 20/250 35 1.0 20/200 40 0.9 20/160 45 0.8 20/125 50 0.7 20/100 55 0.6 20/80 60 0.5 20/63 65 0.4 20/50 70 0.3 20/40 75 0.2 20/32 80 0.1 20/25 85 0.0 20/20 90 0.1 20/15 95 0.2 20/12 LogMAR logarithmoftheminimalangleofresolution.
TABLE1. ConversionsBetweenLetter,LogMAR,and SnellenVisualAcuityScores
BaselineCharacteristics* TotalNumber 265 Agen(%) 7–17years 24(9) 18–50years 108(41) 50years 130(50) mean( SD),years 50 22 Femalesex,number(%) 155(59) Ethnicity,number(%) Caucasian 201(77) AfricanAmerican 40(15) Hispanic 11(4) Asian 9(3) Other 1(.4) Education,number(%) Lessthanhighschool 30(15) Highschool 56(28) College 80(40) Post-graduate 35(17) Clinicaldiagnosis,number(%) Normal 53(20) Uncorrectedrefractiveerror 21(8) Age-relatedmacular degeneration 25(10) Diabeticretinopathy 15(6) Otherretinaldisease 58(22) Cataract 11(4) Opticnerve 3(1) Cornea 5(2) Uveitis 30(11) Glaucoma 29(11) Amblyopia 2(1) Other 11(4) VisualacuityoninitialS-ETDRS test,number(%) 20/20(logMAR 0.00) 55(21) 20/20to 20/40(logMAR 0.02to0.28) 77(29) 20/40to20/100(logMAR 0.30to0.70) 80(30) 20/100(logMAR 0.70) 53(20) S-ETDRS standardEarlyTreatmentforDiabeticRetinopathyStudy.
anddiagnosis(2). ACOMPUTERIZED METHODOF VISUAL ACUITY TESTING VOL. 135,NO. 2 197
*Missingdata:age(3),gender(3),ethnicity(3),education(64),
4metersplus30whenthe4-meterscorewas 20andplus thenumberofletterscorrectlyidentifiedat1meterwhen the4-meterscorewas 20.Alltestingwasconducted eitherwiththepatient’scurrentspectaclesorwithout correction.Arefractionwasnotperformedforpurposesof thestudy;thereforethemeasuredacuitiesdidnotnecessarilyrepresentbest-correctedvisualacuity.Studyenrollmentcontinueduntiltherewereatleast50subjectswith studyeyeswithacuityworsethan20/100.
Theprimarydiagnosis/causeofvisuallossofeacheye wasrecordedasoneofthefollowing:normal,uncorrected refractiveerror,maculardisease(age-relatedmaculardegeneration,diabeticretinopathy,orotherretinaldiseases ordystrophies),cataract,opticnervedisease,uveitis, glaucoma,amblyopia,orother.
● DATAANALYSIS: Onlypatientswhohadscoresfor allfourtestswereincludedintheanalysis(datafrom14 patientswithincompletetestingwerenotincluded).For boththeE-ETDRSandS-ETDRStests,theletterscores wereconvertedtologMARequivalentsusingtheformula logMAR 1.7 (.02)(letterscore).ConversionsbetweenletterscoresandSnellenscoresaregiveninTable1. Withthisconversion,a5-letterdifferenceinvisualacuity isequivalenttoadifferenceof0.1logMARandtoone Snellenline.
Toassesstest-retestreliability,frequencydistributionsof thedifferencesinvisualacuityscoresbetweentheinitial andrepeattestscorewereevaluatedandintraclasscorrelationcoefficientswerecomputed.Ninety-fivepercent confidenceintervals(95%CI)foranacuityscorewere determinedbasedonthestandarderrorofmeasurement,7 andforachangeinanacuityscorefromabaselinelevel weredeterminedbasedonthestandarderrorofthe differences.Analyseswerereplicatedinsubgroupsbased onvisualacuityandage.McNemartestwasusedto compareproportionsinpaireddata;Fisherexacttestwas usedtocompareproportionsbetweensubgroups.Separate assessmentsweremadeusingidenticalmethodsforthe S-ETDRSandE-ETDRStests.
TocompareE-ETDRSscoreswiththeS-ETDRS scores,frequencydistributionsofthedifferencesbetween E-ETDRSandS-ETDRSvisualacuityscoresforeach subjectwereconstructedandintraclasscorrelationcoefficientswerecomputed.Analyseswerereplicatedinsubgroupsbasedonvisualacuityandage.Similarmethods wereusedtocompareE-ETDRSandS-ETDRSscoresina subsetthatincludedonlyeyeswithhightest-retestreliability(bothE-ETDRSandS-ETDRStest-retestscores within fiveletters).
Bland-Altmanplots8 wereconstructedtofurtherassess test-retestreliabilityandtheconcordanceofS-ETDRS andE-ETDRSaccordingtolevelofvisualacuity.All analyseswereconductedusingSASsoftwareversion8 (Cary,NorthCarolina,USA).9
E-ETDRS electronicEarlyTreatmentforDiabeticRetinopathyStudy;S-ETDRS standardETDRS.
*0.1logMAR 5letters;0.2logMAR 10letters;0.3 logMAR 15letters.
†Duetorounding,percentagesmaynotsumto100and/or theirrespectivecumulativepercentages.
RESULTS
● DESCRIPTIONOFSUBJECTS: Themeanageof265 patientswas50 22yearsold;155werefemale(59%), and201wereCaucasian(77%).Fifty-three(20%)study eyeswereconsiderednormal(includingcorrectedrefractiveerror),21hadanuncorrectedrefractiveerror(8%), and189hadeyedisease(72%).Visualacuitywasbetter than20/40in132eyes(50%),20/40to20/100in80eyes (30%),andworsethan20/100in53eyes(20%)(Table2).
● TEST-RETESTRELIABILITYASSESSMENTS: Thedistributionsofthetest-retestdifferencesforboththeE-ETDRS andS-ETDRStestingappearedsimilar(Table3).Forboth methods,thecorrelationbetweentheinitialandtheretest visualacuityscoreswas0.99.FortheE-ETDRStesting, 89%oftheretestscoreswerewithin0.1logMARofthe initialtestscoreand98%werewithin0.2logMAR; whereasfortheS-ETDRStesting,87%oftheretestscores werewithin0.1logMARoftheinitialtestscoreand98% werewithin0.2logMAR(Table4andFigure3).
Test-retestreliabilitywashighacrosstherangeofvisual acuity.Withbothtestingmethods,morethan90%of
AbsoluteValueof DifferenceinLetters* E-ETDRS (Number 265) S-ETDRS (Number 265) n(%)† Cumulative Percent† n(%)† Cumulative Percent† 034(13)13%44(17)17% 163(24)37%71(27)43% 253(20)57%40(15)58% 340(15)72%27(10)69% 426(10)82%28(11)79% 519(7)89%21(8)87% 612(5)93%12(5)92% 7 5(2)95%12(5)96% 8 5(2)97%2(1)97% 9 3(1)98%2(1)98% 10 1(.4)98%1(.4)98% 11 1(.4)99%2(1)99% 12 1(.4)99%2(1)100% 13 0(0)99%1(.4)100% 14 1(.4)100%0(0)100% 15 0(0)100%0(0)100% 16 0(0)100%0(0)100% 17 0(0)100%0(0)100% 18 1(.4)100%0(0)100%
TABLE3. Test-RetestDifferencesWiththeElectronic ETDRSandStandardETDRSProtocols
AMERICAN JOURNALOF OPHTHALMOLOGY 198 FEBRUARY2003
TABLE4. Test-RetestDifferencesWiththeElectronicETDRSandStandardETDRSProtocolsAccordingtoVisualAcuity*
0.30to0.70;and 20/100 logMAR 0.70.
5letters;0.2logMAR 10letters;0.3logMAR 15letters;0.4logMAR 20letters. ‡Positivevaluemeansrepeatscorewashigher(better).
retestswerewithin0.2logMARoftheinitialtesteven whenacuitywasworsethan20/100.Whenacuitywas betterthan20/40,theproportionofretestswithin0.1 logMARoftheinitialtestwashigherwiththeE-ETDRS methodthanwiththeS-ETDRSmethod(P .02;Table 4andFigure4).Table4alsoprovidesthe95%CIforboth methodsforanindividualacuityscoreaswellasfora changeinacuity.
Test-retestreliabilitywashighirrespectiveofage(Table 5).Withbothtestingmethods,morethan95%ofretests werewithin0.2logMARoftheinitialtesteveninpatients 65yearsoldorolder.
● COMPARISONOFE-ETDRSANDS-ETDRSSCORES: Comparingeachpatient’sE-ETDRSscoreandS-ETDRS score,therewasnotendencyforscoresononetesttobe higherthanontheother(Table6).Thecorrelation
betweentheE-ETDRSandS-ETDRSacuityscoreswas 0.96fortheinitialtestsand0.97fortheretests.The E-ETDRSandS-ETDRSscoresdifferedby 0.1logMAR on74%oftheinitialtestsand79%oftherepeattestsand differedby 0.2logMARon94%and96%oftests, respectively(Table6andFigure5).
AgreementbetweentheE-ETDRSandS-ETDRSscores waslowerinpatientswithacuityworsethan20/100 comparedwithpatientswithacuityof20/100orbetter(for agreementwithin0.2logMAR, P .05forinitialtests and P .01forrepeattests;Table6andFigure6),but agreementwassimilarwhencomparingpatients65years oldorolderwithpatientsyoungerthan65yearsold (Table7).
Withtheanalysislimitedtothe207patientswithhigh test-retestreliability(test-retestscoreswithin0.1logMAR withboththeE-ETDRSandS-ETDRStests),the
AllPatients(Number 265) VisualAcuity 20/40 (Number 132) VisualAcuity20/40to20/100 (Number 80) VisualAcuity 20/100 (Number 53) E-ETDRSS-ETDRSE-ETDRSS-ETDRSE-ETDRSS-ETDRSE-ETDRSS-ETDRS Absolutevalueof difference† number(%) 0.1logMAR235(89)231(87)126(95)115(87)68(85)72(90)41(77)44(83) 0.2logMAR261(98)260(98)132(100)131(99)79(99)78(98)50(94)51(96) 0.3logMAR264(100)265(100)132(100)132(100)80(100)80(100)52(98)53(100) 0.4logMAR265(100)265(100)132(100)132(100)80(100)80(100)53(100)53(100) Differencebetween repeatandinitial scoresinletters‡ mean SD0.77 3.641.10 3.500.29 2.800.77 3.381.15 3.651.50 3.331.42 5.091.34 4.00 (95%CI)(0.33to1.21)(0.68to1.53)( 0.19to0.77)(0.18to1.35)(0.34to1.96)(0.76to2.24)(0.01to2.82)(0.24to2.44) Intraclass correlation coefficient .99 .99 .94 .86 .91 .87 .93 .95 95%CI(two-sided) foracuityscore, logMAR: halfwidth .10 .10 .08 .09 .09 .08 .14 .11 95%CIforchange betweentwo acuityscores, logMAR Half-widthof two-sidedCI .14 .14 .11 .13 .13 .11 .20 .15 WidthofonesidedCI .12 .12 .09 .11 .11 .10 .17 .13 CI
logarithmoftheminimalangle
*VisualacuitybasedonletterscorefrominitialstandardETDRStest.Visualacuity 20/40 logMAR 0.28;20/40–20/100 logMAR
ACOMPUTERIZED METHODOF VISUAL ACUITY TESTING VOL. 135,NO. 2 199
confidenceinterval;E-ETDRS electronicEarlyTreatmentforDiabeticRetinopathyStudy;logMAR
ofresolution;S-ETDRS standardETDRS;SD standarddeviation.
†0.1logMAR
E-ETDRSandS-ETDRSscoresdifferedby 0.1logMAR on81%oftheinitialtestsand84%oftherepeattests,and differedby 0.2logMARon95%and99%oftests, respectively.
● DIFFERENCESAMONGCENTERS: Althoughtherewere somedifferencesinthecharacteristicsofthepatientswhen comparingthethreeclinicalsites(aswasexpected,dueto thedifferenttypesofpatientseachhadaccesstofor inclusioninthestudy),therewerenomeaningfuldifferencesintheresultscomparingthecenters(datanot shown).
AttheonesiteatwhichthetestingorderofS-ETDRS andE-ETDRSwasdeterminedatrandom,thetest-retest reliabilityresultsandtheresultsofthecomparisonofthe
Thedottedlinesseparatethetest-retestscoresthatwerewithin 10lettersofeachotherfromthoseinwhichthedifferencewas greaterthan10letters.
scoresonthetwotestsweresimilartotheoverallresults (datanotshown).
DISCUSSION
WEFOUNDTHATOURCOMPUTERIZEDVISUALACUITY testingprotocolhastest-retestreliabilitycomparabletothe standardETDRScharttestingprotocolonwhichitwas based.Withbothtestingmethods,closeto90%ofpatients testedwithin0.1logMAR(5letters)oftheinitialscoreon theretest,andmorethan95%testedwithin0.2logMAR (10letters)ontheretest.Test-retestreliabilitydidnot varywithage,but,notunexpectedly,variabilitywas slightlygreaterinpatientswithpooracuity.Still,about
FIGURE3.Distributionoftest-retestdifferencesinacuity scores(number 265).Apositivedifferenceindicatesthe repeatscorewasbetterthantheinitialscore.
AMERICAN JOURNALOF OPHTHALMOLOGY 200 FEBRUARY2003
FIGURE4.BlandAltman8 plotoftest-retestdifferenceversus averagevisualacuityscore(number 265).Apositivedifferenceindicatestherepeatscorewasbetterthantheinitialscore.
E-ETDRS electronicEarlyTreatmentforDiabeticRetinopathyStudy;logMAR logarithmoftheminimalangleofresolution;S-ETDRS standardETDRS.
*Threepatientsaremissingdataonage.
†0.1logMAR 5letters;0.2logMAR
CI confidenceinterval;E-ETDRS electronicEarlyTreatmentforDiabeticRetinopathyStudy;logMAR logarithmoftheminimumangle ofresolution;SD standarddeviation;S-ETDRS standardETDRS;SD standarddeviation.
*VisualacuitybasedonletterscorefrominitialstandardETDRStest: 20/40 logMAR 0.28;20/40 –20/100 logMAR0.30to0.70; and 20/100 logMAR 0.70.
†0.1logMAR 5letters;0.2logMAR 10letters;0.3logMAR 15letters;0.4logMAR 20letters. ‡NegativevaluemeansS-ETDRSletterscorewashigher(better).
80%ofpatientswithpooracuity(worsethan20/100)had retestscoreswithin0.1logMAR(5letters)oftheinitial testscores,andabout95%retestedwithin0.2logMARof theinitialscore.Basedonourestimatesof95%CI,we foundthatachangeinacuityof0.2logMAR(10letters)
fromabaselinelevelisunlikelytoberelatedtomeasurementvariabilityusingeithertheE-ETDRSorthe S-ETDRSvisualacuitytestingprotocol.
WefoundagreementbetweentheE-ETDRSand S-ETDRSscorestobehigh,suggestingstrongconcurrent
AbsoluteValueof Difference† Age 40YearsOld(Number 86) Age40– 65YearsOld (Number 94) Age 65YearsOld(Number 82) E-ETDRS n(%) S-ETDRS n(%) E-ETDRS n(%) S-ETDRS n(%) E-ETDRS n(%) S-ETDRS n(%) 0.1logMAR 80(93) 72(84) 79(84) 84(89) 74(90) 72(88) 0.2logMAR 84(98) 83(97) 93(99) 93(99) 81(99) 81(99) 0.3logMAR 86(100) 86(100) 94(100) 94(100) 81(99) 82(100) 0.4logMAR 86(100) 86(100) 94(100) 94(100) 82(100) 82(100)
TABLE5. Test-RetestDifferencesWiththeE-ETDRSandS-ETDRSProtocolsAccordingtoAge*
10letters;0.3logMAR 15letters;0.4logMAR 20letters.
AllPatients (Number 265) VisualAcuity 20/40 (Number 132) VisualAcuity20/40to20/100 (Number 80) VisualAcuity 20/100 (Number 53) Initialtest Absolutevalueofdifference† number(%) 0.1logMAR 196(74) 108(82) 58(73) 30(57) 0.2logMAR 248(94) 127(96) 75(94) 46(87) 0.3logMAR 261(98) 131(99) 80(100) 50(94) 0.4logMAR 262(99) 131(99) 80(100) 51(96) DifferencebetweenE-ETDRSand S-ETDRSscores,letters mean SD 0.14 5.94 0.48 5.09 0.45 5.25 0.19 8.44 (95%CI)‡ ( 0.86to0.58)( 1.35to0.40)( 0.72to1.62) ( 2.52to2.14) Intraclasscorrelationcoefficient .96 .77 .76 .81 Repeattest Absolutevalueofdifference† number(%) 0.1logMAR 210(79) 117(89) 64(80) 29(55) 0.2logMAR 255(96) 130(98) 78(98) 47(89) 0.3logMAR 260(98) 131(99) 79(99) 50(94) 0.4logMAR 263(99) 131(99) 80(100) 52(98) DifferencebetweenE-ETDRSand S-ETDRSscores,letters mean SD 0.47 5.14 0.95 4.28 0.10 4.64 0.11 7.36 (95%CI)‡ ( 1.09to0.15)( 1.69to 0.22)( 0.93to1.13) ( 2.14to1.91) Intraclasscorrelationcoefficient .97 .82 .85 .86
TABLE6. DifferencesBetweenE-ETDRSandS-ETDRSAccordingtoVisualAcuity*
ACOMPUTERIZED METHODOF VISUAL ACUITY TESTING VOL. 135,NO. 2 201
FIGURE5.DistributionofdifferencesbetweenacuityscoresonelectronicEarlyTreatmentforDiabeticRetinopathyStudy (ETDRS)andstandardETDRStesting(number 265).ApositivedifferenceindicatestheelectronicETDRSscorewasbetter thanthestandardETDRSscore.
validity.Thedifferencesinvisualacuityscores,however, weregreaterincomparingthetwotestingmethodsthanin therepeatingofeachtest.Thisistobeexpectedbecause thetwotestingstrategiesandtheirmethodsofcomputing thevisualacuityscorediffer,thusaddingasecondsource
ofvariationinadditiontothetest-retestvariability.Thisis particularlytrueforthetestingofpatientswithlowvision, forwhomtheS-ETDRSscorecombinestheresultsof testingat4metersand1meter,whereastheE-ETDRS testingisatasingledistance.TheE-ETDRSscorewas
AMERICAN JOURNALOF OPHTHALMOLOGY 202 FEBRUARY2003
FIGURE6.BlandAltman8 plotofdifferencebetweenacuityscoresonelectronicEarlyTreatmentforDiabeticRetinopathyStudy (ETDRS)andstandardETDRSvsaveragevisualacuityscore(number 265).Apositivedifferenceindicatestheelectronic ETDRSscorewasbetterthanthestandardETDRSscore.ThedottedlinesseparatetheE-ETDRS:S-ETDRSscoresthatwere within10lettersofeachotherfromthoseinwhichthedifferencewasgreaterthan10letters.
developedtobesimilartotheS-ETDRSletterscoreandto maintaintheadvantagesofletterscoringoverlinescoring.6,10 –13 However,somevariationundoubtedlyisdueto differencesinthescoringmethodsandtotheeffectof usingsingle-letterpresentationswiththeE-ETDRS procedureandlinepresentationswiththeS-ETDRS
procedure. 14 – 16
TherewasnotendencyfortheEETDRSandS-ETDRSscorestobehigherorlowerthan theother.
Forbothprocedures,retestscoresonaveragewereabout oneletter(orless)higherthantheinitialtestscores, indicativeofaninconsequentiallearningeffect.Mostprior
ACOMPUTERIZED METHODOF VISUAL ACUITY TESTING VOL. 135,NO. 2 203
TABLE7. DifferencesBetweenE-ETDRSandS-ETDRSAccordingtoAge
E-ETDRS electronicEarlyTreatmentforDiabeticRetinopathyStudy;logMAR logarithmoftheminimalangleofresolution;S-ETDRS standardETDRS.
*0.1logMAR 5letters;0.2logMAR 10letters;0.3logMAR 15letters;0.4logMAR 20letters.
studies2,3,6,11 havealsoreportedthatthelearningeffectis minimalusingS-ETDRSorsimilartesting.
Campariniandcolleagues17 reportedtheresultsofan adaptivestrategyforvisualacuitycharttestingcalled ETDRS-fast.Theprocedureinvolvesadeterminationof approximatethresholdfollowedbythetestingofall5 lettersonaline.Theapproximatethresholdisdetermined byshowingoneletterperlineonthechartstartingat 20/200untilaletterismissedandthenshowingmultiple lettersperlineuntilthelowestlinewith4or5correctis identified.Smallerlinesarethentestedasperthestandard ETDRStestingprotocoluntil0or1letteriscorrectona line.Aletterscoreisdetermined,similartoourscoring method,byassumingthatallletterslargerthanthelargest testedlinewouldhavebeencorrectlyidentifiedandnone oftheletterssmallerthanthesmallesttestedlinewould havebeencorrectlyidentified.Bothtest-retestreliability (r 0.96;97%ofretestswithin0.1logMARofinitialtest) andthecorrelationoftheETDRS-fastscorewiththe standardETDRSscore(r 0.95)werefoundtobehighin astudyof57patientswithacuitiesintherangeof20/100 to20/10,mostofwhomhadacuityof20/40orbetter.
WiththeE-ETDRStestingmethod,thenumberof letterpresentationsinourstudyaveragedabout25letters (forthescreeningphaseandthresholdtestingcombined) whenvisualacuitywasbetterthan20/40andabout30 letterswhenacuitywas20/40orworse.Comparedwith S-ETDRStesting,thenumberofletterpresentationswith theE-ETDRSmethodusuallywillbefewerforacuities betterthan20/63.Thebettertheacuity,thelargerthe differenceinnumberofletterstestedwillbe.Forinstance, withacuityof20/20,about55letterswillbetestedwith S-ETDRStestingcomparedwithabout25letterswith E-ETDRStesting.Forverypooracuity,however,the E-ETDRSproceduremaytestmorelettersthanwillthe S-ETDRSprocedure,dependingonwhetherS-ETDRS testingisalsodoneat1meter.
Severalotherstudieshavedemonstratedthatthe ETDRStestingandsimilaroptotypetestingwithletter scoringhavehightest-retestreliability.2,6,11,13 Mostofthe studieshavepredominatelyincludedeyeswithnormalor
near-normalvision.OnlythestudyofBlackhurstand associates2 includedasubstantialnumberofeyeswith visualimpairment.Inthatstudy,visualacuitywastested twiceusingtheETDRSchartsin89eyeswithacuityof 20/100orbetterandin75eyeswithacuityworsethan 20/100.Test-retestreliabilitywashigherintheeyesinthe bettervisiongroup.Thepercentagesofeyeswithretest scoreswithin0.1logMARand0.2logMARoftheinitial scoreswere92%and98%,respectively,inthebettervision groupand80%and89%,respectively,intheworsevision group.Theintraclasscorrelationcoefficientwas0.95in eachgroup.
Insummary,theE-ETDRSprotocolhashightest-retest reliabilityandgoodconcordancewithS-ETDRStesting. Althoughweexpectthatthistestingmethodwillbeuseful forpediatricpatientsasyoungas6or7yearsofage,wehad toofewchildreninthestudytobeabletodeterminethis and,therefore,willbeconductingaseparatetest-retest reliabilitystudyinapediatricpopulation.Foraclinical trial,thepotentialadvantagesofusingacomputerized methodoftestingovermanualtestingincludebetter standardizationofthetestingprocedureacrossmultiple sites,lesstrainingrequiredforthetechniciansadministeringthetest,reductionofpotentialbiasbylimitingtherole ofthetechnicianinthetestingprocedure,theabilityto testvisualacuityfrom20/800to20/12atasingletest distance,theabilitytodirectlycapturethetestingdata electronicallywithouttheneedtomanuallyrecordevery responseonascoresheetandtocalculatethescore automatically,andtheneedforfeweroptotypepresentationswhenvisualacuityisgood.Disadvantagesincludethe costofpurchasingandmaintainingtheequipment,the inabilitytomeasure20/10visualacuityatthe3-metertest distance(althoughthiswouldbepossibleifthetest distancewereincreasedto4meters),andthefactthat lettersizeisacloseapproximation,butnotanexact logMARprogression,duetothemethodbywhichthe lettersarerenderedonthepersonalcomputer.Despitethe potentialadvantagesoftheE-ETDRSprotocol,incorporatingthisnewprocedureintoongoingclinicalstudiesthat areusingtheS-ETDRSprotocoltoassesschangeinvisual
AbsoluteValueof Difference* Age 40YearsOld(Number 86) Age40– 65YearsOld(Number 94) Age 65YearsOld(Number 82) InitialTestn(%)RepeatTestn(%)InitialTestn(%)RepeatTestn(%)InitialTestn(%)RepeatTestn(%) 0.1logMAR61(71) 73(85) 73(78) 74(79) 60(73) 62(76) 0.2logMAR82(95) 84(98) 87(93) 91(97) 77(94) 77(94) 0.3logMAR86(100) 86(100) 93(99) 92(98) 79(96) 79(96) 0.4logMAR86(100) 86(100) 93(99) 93(99) 80(98) 81(99)
AMERICAN JOURNALOF OPHTHALMOLOGY 204 FEBRUARY2003
acuityseemsinappropriate.However,fornewclinical studies,theE-ETDRSmethodisaviablealternativethat shouldbeconsidered.TheE-ETDRSprotocolcanbe adaptedforuseoncommercially-availablecomputerized visualacuitytestersusingdifferentoperatingsystems. However,forusewithstandardofficepersonalcomputers, considerablemodificationswouldbeneededtoprovidethe necessarypixelresolution.Informationontherequired technicalspecificationscanbeobtainedbycontactingthe authors.Futureworkisindicatedtodeterminewhetherthe E-ETDRStestingalgorithmcanbemodifiedtofurther reducethenumberofletterpresentationsbyalteringthe stoppingrulesand/orreducingthenumberofpresentations ateachlogMARlevel.
ACKNOWLEDGMENTS
Thefollowingresearchstaffparticipatedinthestudyatthe clinicalsites:R.Mercer,L.Goodman,D.Koutsandras,T. LaReau,R.Nashwinter,J.P.Rowan,G.Foster,W.R. O’Donnell(NationalEyeInstitute,DivisionofEpidemiologyandClinicalResearch,NationalInstitutesofHealth, Bethesda,MD);K.G.Locke,C.E.Wilson(Retina FoundationoftheSouthwest,Dallas,TX);andJ.Thompson,T.Smith,C.Blachly,K.Novitsky(Discoveriesin SightResearchLabs,DeversEyeInstitute,Portland,OR).
REFERENCES
1.EarlyTreatmentDiabeticRetinopathyStudyResearch Group.Earlytreatmentdiabeticretinopathystudydesignand baselinepatientcharacteristics.ETDRSreportnumber7. Ophthalmology1991;98:741–756.
2.BlackhurstDW,MaguireMG,MacularPhotocoagulation StudyGroup.Reproducibilityofrefractionandvisualacuity measurementunderastandardprotocol.Retina1989;9:163–169.
3.ElliottDB,SheridanM.Theuseofaccuratevisualacuity
measurementsinclinicalanti-cataractformulationtrials. OphthalmicPhysiolOpt1988;8:397–401.
4.MokePS,TurpinAH,BeckRW,etal.Computerized methodofvisualacuitytesting:adaptationoftheamblyopia treatmentstudyvisualacuitytestingprotocol.AmJOphthamol2001;132:903–909.
5.HolmesJM,BeckRW,RepkaMX,etal.Theamblyopia treatmentstudyvisualacuitytestingprotocol.ArchOphthalmol2001;119:1345–1353.
6.FerrisFL,KassoffA,BresnickGH,BaileyI.Newvisual acuitychartsforclinicalresearch.AmJOpthalmol1982;94: 91–96.
7.CrockerL,AlginaJ.Introductiontoclassicalandmodern testtheory.NewYork:Holt,RinehartandWinston,1986: 150 –151.
8.BlandJM,AltmanDG.Statisticalmethodsforassessing agreementbetweentwomethodsofclinicalmeasurement. Lancet1986;1:307–310.
9.SAS.SAS/STATuser’sguide,version8.Cary,NC:SAS Institute,Inc,1999.
10.VandenBoschME,WallM.Visualacuityscoredbythe letter-by-letterorprobitmethodshaslowerretestvariability thanthelineassignmentmethod.Eye1997;11:411–417.
11.Lovie-KitchinJE.Validityandreliabilityofvisualacuity measurements.OphthalmicPhysiolOpt1988;8:363–370.
12.BaileyIL,BullimoreMA,RaaschTW,TaylorHR.Clinical gradingandtheeffectsofscaling.InvestOphthalmolVisSci 1991;32:422–432.
13.ArditiA,CagenelloR.Onthestatisticalreliabilityof letter-chartvisualacuitymeasurements.InvestOphthalmol VisSci1993;34:120 –129.
14.StagerDR,EverettME,BirchEE.Comparisonofcrowding barandlinearoptotypeacuityinamblyopia.AmOrthoptJ 1990;40:51–56.
15.FlomMC,WeymouthFW,KahnemanD.Visualresolution andcontourinteraction.JOptSocAm1963;53:1026 –1032.
16.StuartJA,BurianHM.Astudyofseparationdifficulty:its relationshiptovisualacuityinnormalandamblyopiceyes. AmJOphthalmol1962;53:471–477.
17.CampariniM,CassinariP,FerrignoL,MacalusoC.ETDRSfast:implementingpsychophysicaladaptivemethodstostandardizedvisualacuitymeasurementwithETDRScharts. InvestOphthalmolVisSci2001;42:1226 –1231.
ACOMPUTERIZED METHODOF VISUAL ACUITY TESTING VOL 135,NO 2 205
Validationofanautomated-ETDRSnearandintermediatevisual acuitymeasurement
DOI:10.1111/cxo.13018
YiPang ODPhD
LaurenSparschu BS
ElyseNylin BS
DepartmentofDean’sEducation,IllinoisCollegeof Optometry,Chicago,Illinois,USA
E-mail:ypang@ico.edu
Background: Theaimofthisstudywastodeterminetherepeatabilityofanautomated-ETDRS (EarlyTreatmentDiabeticRetinopathyStudy)nearandintermediatevisualacuitymeasurement insubjectswithnormalvisualacuityandsubjectswithreducedvisualacuity.Theagreementof automated-ETDRSwithgoldstandardchart-basedvisualacuitymeasurementwasalsostudied.
Methods: Fifty-onesubjectsweretested(aged23to91years;33subjectswithnormal visualacuity:6/7.5orbetter;18subjectswithreducedvisualacuity:6/9to6/30).Nearand intermediatevisualacuityofoneeyefromeachsubjectwasmeasuredwithanautomated tablet-computersystem(M&STechnologies,Inc.)andPrecisionVisionpaperchartinarandomsequence.Subjectswereretestedoneweeklater.Repeatabilitywasevaluatedusing the95percentlimitsofagreement(LoA)betweenthetwovisits.
Results: Averagedifferencebetweenautomated-ETDRSnearvisualacuityandnearvisualacuity bypaperchartwas0.02 0.10logMAR(p>0.05).Agreement ofnearvisualacuitybetween automated-ETDRSandpaperchart wasgood,with95percentLoAof 0.19logMAR.Furthermore, automated-ETDRSnearvisualacuityshowedgoodrepeatability(95percentLoAof 0.20).Mean differencebetweenautomated-ETDRSintermediatevisualacuityandintermediatevisualacuityby paperchartwas0.02 0.10logMAR(p>0.05).Agreementofintermediatevisualacuitybetween automated-ETDRSandpaperchart wasgood,with95percentLoAof 0.20logMAR.Inaddition, automated-ETDRSintermediatevisualacuityhadgoodrepeatability(95percentLoAof 0.16).
Submitted:27February2019
Revised:20September2019
Acceptedforpublication:15October2019
Conclusion: Automated-ETDRSnearandintermediatevisualacuitymeasurementshowed goodrepeatabilityandagreementwiththegoldstandardchart-basedvisualacuitymeasurement.Thefindingsofthisstudyindicatetheautomatedvisualacuitymeasurementsystemmayhavepotentialforuseinbothpatientcareandclinicaltrials.
Keywords: computer,intermediatevision,nearvision,tablet,visualacuity
Visualacuityisthemostcommonandprimarymeasurementofvisualfunction.In addition,visualacuityisoneofmostcommonoutcomemeasurementsinclinical research.1–5 TheEarlyTreatmentDiabetic RetinopathyStudy(ETDRS)chartisdesigned foruseinclinicalstudieswhereaccurateand repeatablevisualacuitymeasurementsare required.6,7 Althoughmanytypesofvisual acuitychartsareused,theETDRSchartis acceptedworldwideasthegoldstandardfor accuratevisualacuitymeasurement.
Withadvancesintechnology,automated visualacuitytestsusingelectronicdeviceshave beendevelopedandstudied.8–11 Theadvantagesofautomatedvisualacuitytestingover papercharttestingincludeuseofa standardisedprotocol,reducedriskofpatients memorisingtheletters,andlimitinghuman errorincountinglettersandcalculatingvisual
acuity.Thus,manyclinicaltrialsuseautomated visualacuitytestingasthegoldstandardto measuretreatmentoutcomes.3–5
ThepurposeofthisstudywastodeterminetherepeatabilityofanautomatedETDRSnearandintermediatevisualacuity measurementinsubjectswithnormalvisual acuityandsubjectswithreducedvisualacuity.Inaddition,agreementofautomatedETDRSwithgoldstandardchart-basedvisual acuitymeasurementwasalsostudied.
Methods Studypopulationanddata collection
BoththestudyprotocolandinformedconsentformswereapprovedbytheInstitutionalReviewBoardoftheIllinoisCollegeof
Optometry.InaccordancewiththeguidelinesoftheDeclarationofHelsinki,written informedconsentwasobtainedfromeach subject.
Testprocedure
Atotalof51sequentialsubjectswhounderwentacomprehensiveeyeexaminationat theIllinoisEyeInstitute,anurbaneyeclinic, wereenrolledintothestudy.Thirty-three subjectshadnormaldistancevisualacuity of6/7.5orbetter,withhabitualrefractive correction.Theremaining18subjectshad reducedhabitualdistancevisualacuity (from6/9to6/30)duetocataract,glaucoma,degenerativemyopia,retinaldisease, diabeticretinopathy,and/oruncorrected refractiveerror.Patientswithdistancevisual acuityworsethan20/100wereexcluded fromthisstudy.
RESEARCH
ClinExpOptom 2019
©2019OptometryAustralia ClinicalandExperimentalOptometry2019 1 CLINICAL AND EXPERIMENTAL
Subjectsworetheirhabitualrefractive correctionforalltests.Righteyevisualacuityofeachsubjectwasmeasuredwithan automatedtablet-computersystem(M&S Technologies,Inc.,Niles,IL,USA)andwitha paperETDRSchart(PrecisionVision,Woodstock,IL,USA)inarandomsequence.Left eyevisualacuitywasmeasuredintwosubjectswhoserighteyevisionwasworsethan theinclusionlimit.
Nearvisualacuityat40cmwasmeasured first,followedbyintermediatevisualacuity at67cm.Bothpaperandautomated-ETDRS testsweremeasuredusinghigh-contrastletters.VisualacuitywiththepaperETDRS chartwastestedattheluminanceof 100–110cd/m2.ForpaperETDRSchart,subjectswereaskedtoreadthesmallestline theycouldread.Subjectswereaskedtoread thelinebelowthesmallestlinethatthey haveread.Thetestwasterminatedifnoletter inthelinewascorrectlyread.Subjectswere givenatleastaone-minutebreakbetween eachtest.Aretestwasperformedoneweek ( 3days)afterthefirstvisit.Forty-eightsubjects(94percent)completedtheretest.
Automatedtablet-computer visualacuitytestalgorithms
ETDRSlettersweredisplayedonacomputer screenforsubjectstoread.Theexaminer viewedatabletthatdisplayedthecorrect answers(FigureS1).Thecomputerscreen wasauto-calibratedtotheluminancelevel of85cd/m2 ( 5percent)after15minutes warmup.ADatacolorSpyder5colorimeter aspartoftheautomated-ETDRSsystemwas usedtoconfirmtheluminancelevelofthe computerscreen.Glarewascontrolledby usinga90o metaldisplaytraythatthecomputerwassetinto;thus,aconsistentangle forthescreendisplaywasmaintained.The resolutionofthe13.3inchcomputerscreen was3,200 × 1,800,whichresultedinaresolutionof276pixelsperinch,apixelsizeof 0.79minutesofarcat40cm,andapixel sizeof0.47minutesofarcat67cm.Filtered optotypeswereusedforbothnearand intermediateautomated-ETDRStest.Two phaseswereusedtodeterminethevisual acuityendpoint.
PhaseI:initialthreshold
AnETDRSchart(from6/60to6/3)wasdisplayedonthecomputerscreenandsubjects wereinstructedtoreadthesmallestlinefor whichtheycouldreadallfiveletters.The examinersubmittedthevisualacuitylevel atwhichsubjectscorrectlyreadallletters.
PhaseII:threshold
ETDRSlettersattheinitialthresholdvisual acuityleveltheexaminersubmittedwere displayedonthecomputerscreenaswellas smallersizelinesofthechart.Abluedot wasshownnexttothevisualacuitylevel onelinebelowthesubmittedlettersizeand subjectswereinstructedtoreadtheline nexttothebluedot.Theexaminersubmittedthecorrectnumberoflettersthatsubjectsreadandthencontinuedtoinstruct subjectstoreadlettersofdecreasingsize (0.1logMARsteps).Theteststoppedwhen subjectswereunabletocorrectlyreadany lettersonalineortherewerenosmaller linesavailabletobetested.Thisending pointprotocolhasbeenutilisedinprevious studies.12–14 ThesystemautomaticallycalculatedthelogMARvisualacuityusingthecorrectlettersthatsubjectsread.
Thetestresultsweredisplayedonthe computerafterthecompletionofthemeasurementwiththefollowingparameters: eyetested,testdistance,letterscorefor visualacuity,logMARvisualacuity,and Snellenvisualacuityequivalent.
Dataanalysis
VisualacuitywasconvertedtologMARfor analysis.TheKolmogorov–Smirnovtestwas usedtocheckthenormalityofdistributions forallparameters.Nearvisualacuityand intermediatevisualacuitytestedwiththe paperchartwerenotnormallydistributed. Wilcoxonsignedranktestwasperformed todeterminethedifferenceinvisualacuity testedbypaperchartandautomatedETDRS.
Test–retestreliabilityoftheautomatedETDRSwasevaluatedusingtheBland–Altman95percentlimitsofagreement (LoA)method.Agreementbetweenthe automated-ETDRSandthegoldstandard paperchartwasalsodeterminedbythe Bland–Altmanmethod.
Powercalculationwasperformedafter dataof51subjectswerecollected.Basedon thestandarddeviationofdifference betweenpaperandautomated-ETDRSvisual acuitytest,therewas93.8percentpowerto detectdifferenceof0.05logMAR(0.5 logMARlineor2.5letters)betweenthetwo tests.
AlldatawereanalysedusingStatistical PackageforSocialSciences(IBMSPSSversion21.0;SPSSInc.,IBMUK,Portsmouth, UK)andMedCalcversion12.2.1(MedCalc Software,Ostend,Belgium).Ap-valueof <0.05wasconsideredstatisticallysignificant.
Results
Table1listsdemographiccharacteristicsof thesubjects.Theaveragedifferencebetween theautomated-ETDRSnearvisualacuityand nearvisualacuitybypaperchartwas 0.02 0.10logMAR(oneletterdifference) withoutstatisticalsignificance(Figure1A).The meandifferencebetweenthetestandretest measurementsforbothautomated-ETDRS nearvisualacuityandnearvisualacuityby paperchartAwas0.02logMAR(oneletter) withnostatisticalsignificance.Agreementof nearvisualacuitybetweentheautomatedETDRSandpaperchart(Figure1A)wasgood, with95percentLoAof 0.19logMAR.Furthermore,theautomated-ETDRSnearvisual acuityshowedgoodrepeatability(95percent LoAof 0.20,Figure2A)betweenthetwosessions(oneweekapart),slightlybetterthan thatofnearvisualacuitybypaper(95percent LoAof 0.24,Figure3A).
MeandifferencebetweentheautomatedETDRSintermediatevisualacuityandintermediatevisualacuitybypaperchartwas 0.02 0.10logMAR(oneletterdifference) withoutstatisticalsignificance(Figure1B).Averagedifferencesbetweenthetestandretest measurementswere0.02 0.12logMARand 0.01 0.10logMARforautomated-ETDRS intermediatevisualacuityandtheintermediatevisualacuitybypaper,respectively.
Agreementofintermediatevisualacuity betweentheautomated-ETDRSandpaper chartwasgood,with95percentLoAof 0.22 logMAR(Figure1B).Inaddition,theautomated-
n(%) Visualacuity 6/7.5orbetter 33(64.7) 6/9to6/30 18(35.3) Gender Female 42(82.4) Male 9(17.6) Race Non-HispanicBlack22(43.1) Hispanic/Latino 8(15.7) Non-HispanicWhite16(31.4) Asian 5(9.8) Age(years) Range 22.6–91.1 Mean(SD) 46.7(17.5)
ClinicalandExperimentalOptometry2019 ©2019OptometryAustralia 2 Automated-ETDRSvisualacuity Pang,SparschuandNylin
Table1.Demographiccharacteristicsof thesubjects(n=51)
Figure1.Agreementbetweenautomated-EarlyTreatmentDiabeticRetinopathyStudyvisualacuity(A-ETDRS-VA)testandpaperchart visualacuity(P-VA)test.Thedifferencebetweenthefirstadministrationofeachtestwasplottedagainstthemeanforthetwotests. Exactconfidenceintervalswerecalculatedandplotted.32 A:Nearvisualacuitytest(NVA).B:Intermediatevisualacuitytest(IVA).
ETDRSintermediatevisualacuityhadgood repeatability(95percentLoAof 0.16) betweenthetwosessions(Figure2B),witha slightlybetterrepeatabilitythanthatofintermediatevisualacuitybypaper(95percentLoAof 0.20,Figure3B).
Repeatabilityofautomated-ETDRSnear visualacuityandintermediatevisualacuity wasnotsignificantlydifferentbetweensubjectswithnormalandreducedvisual acuityusingindependent-samplest-test(all pvalues>0.05).
Discussion
Repeatabilityofvisualacuityhasbeen extensivelystudied.11,15–24 Repeatabilityof distancevisualacuity(95percentLoA)has beenreportedatratesvaryingfrom 0.07
Figure2.Repeatabilityofautomated-EarlyTreatmentDiabeticRetinopathyStudyvisualacuity(A-ETDRS-VA)twomeasurements,one weekapart.Thedifferencebetweenthefirst andsecondadministrationsofA-ETDRS-VAwasplottedagainstthemeanofthetwomeasurements.Exactconfidenceintervalswerecalculatedandplotted.32 A:Nearvisualacuitytest(NVA).B:Intermediatevisualacuitytest(IVA).


©2019OptometryAustralia ClinicalandExperimentalOptometry2019 3 Automated-ETDRSvisualacuity Pang,SparschuandNylin
to 0.25logMAR.15
17,20,22,25 Manyfactors couldcontributetotest–retestvariability, includinguseofdifferentvisualacuity charts,subjectage(childrenandolderindividualsshowinghighervariability),26,27 opticaldefocus(highervariability),25 andocular abnormalities(highervariability).20,26

Despitenumerousreportsonrepeatabilityofdistancevisualacuity,fewerstudiesof nearvisualacuity11,23,24 havebeenconducted.Aslametal.11 testednearvisualacuityattwotimes,15–20minutesapart,in 78subjectswithorwithouteyepathologies, usinganautomatedcomputertablet-based visualacuitysystem.Theyreportedthe repeatabilitywas 0.17logMAR,whichis comparabletothecurrentstudy.These authorsalsofoundthattheagreement betweentheirautomatednearvisualacuity andpapernearchart(nearLandoltC)was 0.31logMAR,whichisworsethanthepresentstudy.
ChoandWoo23 measurednearvisualacuityin55youngoptometrystudentswith normalvisionandreportedthattherepeatabilityofnearvisualacuityusingapaper chart(WaterlooFour-ContrastlogMARVisual AcuityChart)was 0.06logMAR.Lametal. measurednearvisualacuityin55young optometrystudentswithvisualacuity6/6or betterandstatedthattherepeatabilityof nearvisualacuitywas 0.06logMARfora PolyUpaperchartand 0.12logMARforthe Precisionpapercharts.24 Therepeatability
ofnearvisualacuityinthepresentstudyis lowerthaninbothstudiesbyChoandWoo andLametal.23,24
Thetwostudiesreferredtoabovetested youngadultswithnormalvisualacuity.23,24 Bothfactors,youngadultandnormalvisual acuity,havebeenreportedtobeassociated withabettervisualacuityrepeatability,25
27 whichcouldcontributetothedisparities betweenthosestudiesandthepresent work.Inaddition,subjectsinbothstudies wereoptometrystudents,whomightunderstandthetestprocedurebetterandprovide morereliableresponses.
Otherfactorscouldaffecttest–retest repeatabilityincludingterminationrulesof visualacuitytests.Carkeet28 suggestedthat aterminationruleoffourmistakesormore onalineshouldbeusedforETDRScharts andsingle-letterscoring.Shahetal.29 tested visionin50normalobserversanddeterminedthattest–retestvariabilitywas smallerforaterminationruleoffourorfive mistakes( 0.14logMAR)comparedtothe ruleofthreemistakesorless.Thepresent studyusedaterminationruleoffivemistakestominimisethetest–retestvariability assuggestedbypreviousauthors.28,29
Withtheextensiveuseofcomputers,intermediatevisualacuitybecomesmorecritical inthelivesofmanyindividuals.However,only onestudyofintermediatevisualacuitywas identifiedafterathoroughliteraturesearch. Tsilimbarisetal.30 simulatedpresbyopiain
34healthyyoungemmetropesormyopes withoutocularabnormalities.Theyreported themeanintermediatevisualacuitywas 0.01 0.09;however,theydidnotstudy repeatabilityofintermediatevisualacuity.In thepresentstudy,boththerepeatabilityof intermediatevisualacuityusingautomatedETDRSandagreementofautomated-ETDRS withpaperchartswerecomparabletothat ofnearvisualacuity.
Therearesomelimitationsofthepresent study.First,thelettersizesinthe automated-ETDRSsystemwerelimitedby thescreensizeofthemonitor;thus,the rangeoftestingwaslimitedto6/3to6/60. Althoughashorttestdistancecanbe utilisedinclinicalpracticetomeasurevisual acuityworsethan6/60,ashortertestdistancemayintroduceothervariablesincludingchangeofrefractivecorrection.Second, theresolutionofthecomputerscreeninthe presentstudywas3,200 × 1,800,which resultedinaresolutionof276pixelsperinch andapixelsizeof0.092mm,whichislower thansuggestedbyCarkeetandLister31 in theirstudy.Thismaypotentiallyimpact ETDRSletterresolutionofsmallersize.
Insummary,thepresentstudydeterminedtherepeatabilityofautomated-ETDRS nearandintermediatevisualacuitymeasurementonawideagerangeofindividuals withnormalorreducedvision.Two-session repeatabilitywasmeasuredratherthan one-sessionrepeatability.Becausevisual
–
–
ClinicalandExperimentalOptometry2019 ©2019OptometryAustralia 4
Figure3.Repeatabilityofpaperchartvisualacuity(P-VA)twomeasurements,oneweekapart.Thedifferencebetweenthefirst andsecondadministrationsofP-VAwasplottedagainstthemeanofthetwomeasurements.Exactconfidenceintervalswerecalculatedandplotted.32 A:Nearvisualacuitytest(NVA).B:Intermediatevisualacuitytest(IVA).
Automated-ETDRSvisualacuity Pang,SparschuandNylin
acuityismeasuredovertimeondifferent visitsinbothpatientcareandclinicaltrials, itiscriticaltoestablishtwo-sessionvisual acuityrepeatability.Thepresentstudyrevealedthattheautomated-ETDRSnearand intermediatevisualacuitymeasurements hadgoodrepeatabilityandagreementwith thegoldstandardpaperchart,whichindicatesthisautomatedvisualacuitymeasurementsystemmayhavepotentialforusein bothpatientcareandclinicaltrials.
ACKNOWLEDGEMENTS
TheauthorswouldliketothankM&STechnologies,Inc.forprovidingtheautomatedtabletcomputervisualacuitysystemforthisstudy. TheauthorsalsowouldliketothankDrKelly Frantzinhelpingeditthemanuscript.
REFERENCES
1.Earlytreatmentdiabeticretinopathystudydesignand baselinepatientcharacteristics.ETDRSreportnumber 7. Ophthalmology 1991;98:741–756.
2.Photocoagulationfordiabeticmacularedema.Early treatmentdiabeticretinopathystudyreportnumber 1.Earlytreatmentdiabeticretinopathystudyresearch group. ArchOphthalmol 1985;103:1796–1806.
3.PediatricEyeDiseaseInvestigatorGroup.Arandomizedtrialofatropinevs.patchingfortreatmentof moderateamblyopiainchildren. ArchOphthalmol 2002;120:268–278.
4.HolmesJM,EdwardsAR,BeckRWetal.Arandomized pilotstudyofnearactivitiesversusnon-nearactivities duringpatchingtherapyforamblyopia. JAAPOS 2005; 9:129–136.
5.HolmesJM,KrakerRT,BeckRWetal.Arandomized trialofprescribedpatchingregimensfortreatmentof severeamblyopiainchildren. Ophthalmology 2003; 110:2075–2087.
6.ToldR,BaratsitsM,GarhoferGetal.Earlytreatment diabeticretinopathystudy(ETDRS)visualacuity. Ophthalmologe 2013;110:960–965.
7.KoenigS,TonagelF,SchieferUetal.Assessingvisual acuityacrossfivediseasetypes:ETDRSchartsare fasterwithclinicaloutcomecomparabletoLandoltCs. GraefesArchClinExpOphthalmol 2014;252:1093–1099.
8.ZhangZT,ZhangSC,HuangXGetal.Apilottrialof theiPadtabletcomputerasaportabledevicefor
visualacuitytesting. JTelemedTelecare 2013;19: 55–59.
9.BokinniY,ShahN,MaguireOetal.Performanceofa computerisedvisualacuitymeasurementdevicein subjectswithage-relatedmaculardegeneration:comparisonwithgoldstandardETDRSchartmeasurements. Eye(Lond) 2015;29:1085–1091.
10.BlackJM,JacobsRJ,PhillipsGetal.Anassessmentof theiPadasatestingplatformfordistancevisualacuityinadults. BMJOpen 2013;3:e002730.
11.AslamTM,ParryNR,MurrayIJetal.Developmentand testingofanautomatedcomputertablet-based methodforself-testingofhighandlowcontrastnear visualacuityinophthalmicpatients. GraefesArchClin ExpOphthalmol 2016;254:891–899.
12.RavikumarA,SarverEJ,ApplegateRA.Changein visualacuityishighlycorrelatedwithchangeinsix imagequalitymetricsindependentofwavefronterror and/orpupildiameter. JVis 2012;12:11.
13.RavikumarA,MarsackJD,BedellHEetal.Changein visualacuityiswellcorrelatedwithchangeinimagequalitymetricsforbothnormalandkeratoconic wavefronterrors. JVis 2013;13:28.
14.ApplegateRA,MarsackJD,ThibosLN.Metricsofretinalimagequalitypredictvisualperformanceineyes with20/17orbettervisualacuity. OptomVisSci 2006; 83:635–640.
15.CampariniM,CassinariP,FerrignoLetal.ETDRS-fast: implementingpsychophysicaladaptivemethodsto standardizedvisualacuitymeasurementwithETDRS charts. InvestOphthalmolVisSci 2001;42:1226–1231.
16.ReevesBC,WoodJM,HillAR.Reliabilityofhigh-and low-contrastlettercharts. OphthalmicPhysiolOpt 1993;13:17–26.
17.KheterpalS,JonesHS,AuldRetal.Reliabilityofvisual acuityinchildrenwithreducedvision. OphthalmicPhysiolOpt 1996;16:447–449.
18.BarrioA,AntonaB,PuellMC.Repeatabilityofmesopic visualacuitymeasurementsusinghigh-andlowcontrastETDRSlettercharts. GraefesArchClinExp Ophthalmol 2015;253:791–795.
19.RaaschTW,BaileyIL,BullimoreMA.Repeatabilityof visualacuitymeasurement. OptomVisSci 1998;75: 342–348.
20.BlackhurstDW,MaguireMG.Reproducibilityofrefractionandvisualacuitymeasurementunderastandard protocol.Themacularphotocoagulationstudygroup. Retina 1989;9:163–169.
21.Lovie-KitchinJE.Validityandreliabilityofvisualacuity measurements. OphthalmicPhysiolOpt 1988;8:363–370.
22.MannyRE,HusseinM,GwiazdaJetal.Repeatabilityof ETDRSvisualacuityinchildren. InvestOphthalmolVis Sci 2003;44:3294–3300.
23.ChoP,WooGC.RepeatabilityoftheWaterloofourcontrastLogMARvisualacuitychartandnearvision
testcardonagroupofnormalyoungadults. OphthalmicPhysiolOpt 2004;24:427–435.
24.LamAK,TongC,TseJetal.Repeatabilityofnear visualacuitymeasurementathighandlowcontrast. ClinExpOptom 2008;91:447–452.
25.RosserDA,MurdochIE,CousensSN.Theeffectof opticaldefocusonthetest-retestvariabilityofvisual acuitymeasurements. InvestOphthalmolVisSci 2004; 45:1076–1079.
26.DoughertyBE,FlomRE,BullimoreMA.Anevaluation oftheMarslettercontrastsensitivitytest. OptomVis Sci 2005;82:970–975.
27.ElliottDB,YangKC,WhitakerD.Visualacuitychanges throughoutadulthoodinnormal,healthyeyes:seeing beyond6/6. OptomVisSci 1995;72:186–191.
28.CarkeetA.ModelinglogMARvisualacuityscores: effectsofterminationrulesandalternativeforcedchoiceoptions. OptomVisSci 2001;78:529–538.
29.ShahN,DakinSC,WhitakerHLetal.Effectofscoring andterminationrulesontest-retestvariabilityofa novelhigh-passletteracuitychart. InvestOphthalmol VisSci 2014;55:1386–1392.
30.TsilimbarisMK,PlainisS,TontosCetal.Normative distance,intermediateandnearvisualacuityinsimulatedpresbyopia. InvestOphthalmolVisSci 2011;52: 2833.
31.CarkeetA,ListerLJ.Computermonitorpixellationand Sloanlettervisualacuitymeasurement. Ophthalmic PhysiolOpt 2018;38:144–151.
32.CarkeetA.Exactparametricconfidenceintervalsfor bland-Altmanlimitsofagreement. OptomVisSci 2015; 92:e71–e80.
Supportinginformation
Additionalsupportinginformationmaybe foundintheonlineversionofthisarticleat thepublisher’swebsite:
FigureS1. Automated-ETDRS(EarlyTreatmentDiabeticRetinopathyStudy)measurement.A:Automated-ETDRSmeasurementat nearinasubject.B:Automated-ETDRSlettersviewedbysubjects.C:AutomatedETDRSlettersviewedbytheexaminer.D:An exampleofautomated-ETDRSat6/6level viewedbytheexaminer.
©2019OptometryAustralia ClinicalandExperimentalOptometry2019 5 Automated-ETDRSvisualacuity Pang,SparschuandNylin
AnEvaluationoftheM&STechnologiesSmart SystemIIforVisualAcuityMeasurementin YoungVisually-NormalAdults
NEILMCCLENAGHAN,BS,AYUMIKIMURA,BA,andLAWRENCER.STARK,PhD,FAAO SouthernCaliforniaCollegeofOptometry,Fullerton,California
ABSTRACT
Purpose. TocomparevisualacuitymeasuresobtainedwiththeM&STechnologiesSmartSystemII(SSII)andtherevised EarlyTreatmentofDiabeticRetinopathyStudy(ETDRS)chartsintermsofaccuracyandtest–retestrepeatability. Methods. Monocularvisualacuitiesweretakenin57young,visuallynormaladultsontwoseparatevisitsinwhichboth theSSIIsystemandtheETDRSchartsweretestedinrandomorderbytwomaskedexaminers.Theeyetobetested throughoutwaschosenrandomlyattheinitialvisit.Measurementsweremadethroughanoptimalphoroptercorrection, determinedbyanoncycloplegicrefractionfora10-footdistance.Bothchartswerepresentedat10feet,andwere matchedcloselyforluminance.
Results. Themeanvisualacuityinthegroupwas 0.16logminimumangleofresolution(MAR)fortheETDRSchartand 0.18logMARfortheSSII,asmallbutstatisticallysignificantdifference.A95%confidenceintervalforthemean differenceinvisualacuitybetweenthetwochartswas 0.033logMARto 0.003logMAR.Thetest–retestrepeatability wasnotsignificantlydifferentinthetwotests.The95%limitsofagreementfortest–retestrepeatabilitywere 0.13log MARto 0.17logMARfortheSSIIand 0.12logMARto 0.13logMARfortheETDRScharts.
Conclusions. TheSSIIcanprovideanaccurate(meandifference 0.033logMAR)andrepeatablealternativetothe ETDRSchartsforvisualacuitymeasurementinyoung,visuallynormal,well-correctedindividuals. (OptomVisSci2007;84:218–223)
KeyWords:visualacuity,M&STechnologiesSmartSystemII
Visualacuity(VA)istheresultoftheculminationofmany criticalelementsofthevisualprocess.Despitetheimportanceinevaluatingvisualfunctionwithvisualacuity,1 this measurementisoftensubjecttoerror.ConventionalSnellenwall chartsinparticularhavebeenthetopicofmanycriticisms.The standardforvisualacuitymeasurementisconsideredtobeachart basedonBailey–Lovieprinciples.2 Weusedonesuchchartseriesin thepresentstudy:therevisedEarlyTreatmentofDiabeticRetinopathyStudy(ETDRS)charts.3,4 Someoftheimportantfeatures oftheBailey–Lovieinspiredchartsinclude:lettersthatareofapproximatelyequallegibility;equallettersperlinetocontroltask difficultyandcontourinteractions;andaregularprogressionin lettersizebetweenlines.
TheM&STechnologiesSmartSystemII(SSII;ParkRidge,IL) isanewandamoretechnologicallyadvancedcomputergenerated visualacuitytest(VAT).TheSSIIcomprisesacomputerprocessor, 17-inchflatLCDscreenmonitor,andaninteractivekeypadcon-
troller.The17-inchflatLCDscreenmonitoriswall-mountedand manufacturedtoM&STechnologies’specifications,withhighresolutionanda450:1nominalcontrastratio.5 Theexaminerusesthe keypadtoaccessdirectlyeachprimaryacuitytest,specificoptotypes,randomizationoptions,andtoincreaseordecreasethesize oftheoptotypeondemand.5 Thesystemallowstheexaminera higheramountofcontroloverthevariablesinvisualacuitytesting.6 Inparticular,theabilitytopresentrandomlettersequences precludespatientsfromusingmemorizationtopasseachline.In addition,theSSIIcanbecalibratedforlanelengthsof6to22feet.
UponvisualinspectionofanSSIIunit,variouscharacteristics werenotedwhichcouldpotentiallyleadtolessaccurateorless repeatableVAreadings.Theseincluded:(1)anunequalnumber oflettersperlinewithsomecharts.Forexample,somelineshave fiveletters,whileothershavesix;(2)lettersoneachlineofvarying legibilitywithsomecharts.Forexample,thelettersetincludes mostofthealphabet,insteadofarestrictednumberofletterswith
ORIGINALARTICLE
1040-5488/07/8403-0218/0VOL.84,NO.3,PP.218–223 OPTOMETRYANDVISIONSCIENCE Copyright©2007 AmericanAcademyofOptometry OptometryandVisionScience,Vol.84,No.3,March2007
approximatelyequallegibility,suchasintheSloansetortheBritishstandardset;(3)aslightlyunevenprogressionoflettersizes betweenlines.Forexample,theprogressionfollowsthe0.1log minimumangleofresolution(MAR)incrementoftheETDRS chartsexceptforthesubstitutionofthenominal 0.2logMAR line(20/12.5Snellenequivalent)witha20/12Snellenequivalent line;and(4)variableletterqualityfor20/20equivalentlettersand smallerwhentheSSIIwascalibratedfora10-footdistance.In particular,oninspectionwithaloupe,wenotedsomedegreeof anti-aliasingfortheseletters(whichcouldreducethelocalcontrast ofpartsofeachletter),andobservedthatthe20/10equivalent lettersweresubjecttopixilation.
Intheabovelist,item(4)wasofmostinterestbecauseifthe smalllettersarenotrenderedsufficientlywell,thenlegibilitymight suffer,causingtheSSIItounderestimateacuityinthoseindividualswithnormalvisualacuity.
Incontrast,theETDRSchartshaveanequalnumberofletters perline(fiveletters),thelettersareofapproximatelyequallegibility,4 thereisaregularprogressionoflettersizebetweenlines(that is,adifferenceof0.1logMARperline),andtheprintedlettersare notsubjecttotherenderinglimitationsofanLCDdisplay.
Therehavebeennopublishedstudiesofhigh-contrastacuity testingwiththeSSII.However,onestudyonlow-contrasttesting withtheSSIIsuggestedtheprocedurewassimpletoadminister, especiallyforinexperiencedparticipants.6 ThepurposeofthecurrentstudythenistocomparetheSSIIandETDRSintermsofthe accuracyandrepeatabilityofhigh-contrastdistancevisualacuity measuresinyoung,well-corrected,visuallynormaladults.
METHODS Participants
Volunteerswereconsideredforinclusioninthestudyiftheymet thefollowingcriteria:aged18yearsorolder;nocurrentocular pathologyorhistoryofsignificantocularpathology;nohistoryof amblyopia,strabismus,orpresenceofsignificantuncorrectedanisometropiaorastigmatismatanytimeupto7yearsofage;no historyofcataract,keratoconus,ocularsurgery,orsignificanteye injuries;nohistoryofsystemicdiseaseswithoculareffects;andno currentuseofmedicationsknowntohavevisualside-effects.Thus, thestudyisdesignedtoinvestigateacuityinvisuallynormaladults.
Therewere60volunteers,butonevolunteerdidnotmeetallthe inclusioncriteria.Twoparticipantsdidnotcomeforthesecond visit,soonlycompletedatafor57participantswereavailablefor analysis.ParticipantswereoptometrystudentsoftheCollege.The averageageoftheparticipantswas25.7yearswitharangeof22.1 to33.4years.Therewere28malesand29females.Bestspherical ocularrefractionfortherighteyerangedfrom 10.31to 4.19 D,withanaverageof 3.26D.Bestsphericalocularrefractionfor thelefteyerangedfrom 8.52to 5.22D,withanaverageof 2.94D.Theaveragebest-correctedVA(measuredjustaftersubjectiverefractionwiththeSmartSystemII)fortherighteyewas
0.20logMARwitharangeof 0.30to 0.08logMAR.For thelefteyeitwas 0.21logMAR,witharangeof 0.30to 0.02 logMAR.
Participantsgaveinformedconsenttoparticipateinthestudy. TheprotocolwasapprovedbytheSCCOInstitutionalReview BoardandfollowedthetenetsoftheDeclarationofHelsinki.
SampleSizeEstimates
Samplesizeestimates7 weremadeforStudent’st-testtocompare meanVAbythetwoVATs.Fortheseestimates,a“clinicallyimportant”changeinvisualacuitywastakenas0.025logMAR,as suchadecrementisconsideredunacceptablebyasignificantnumberofindividuals.8 Anaprioriestimateofthestandarddeviation ofvisualacuitymeasureswastakenas0.03logMAR.9 For90% powerwitha5%significancelevel,therequiredsamplesizewas estimatedat24.ForcalculationsofBland–Altmanlimitsofagreement,itwasnecessarytohavesufficientpowertokeepthe95% confidenceintervalsforthoselimitswithinacceptablebounds. Onceagain,0.025logMARwastakenasaclinicallyimportant bound.AnaprioriestimateofthestandarddeviationfordifferencesbetweenrepeatedVAmeasureswastakenas0.056log MAR.10 Thesevalueswerethenusedinformulaeprovidedby BlandandAltman11 toyieldasamplesizeestimateof58.Other statisticaltestsinthisstudy(seeStatisticalAnalysis)donothave publishedmethodsforestimatingsamplesizes.Insummary,the largestrequiredsamplesizewasestimatedas58,andsothiswasset asthetargetsamplesizeofthestudy.
Apparatus
TheequipmentincludedETDRSlettercharts(“Revised”chart 1and“Revised”chart2;10-footdesign)producedbyPrecision Vision(LaSalle,IL),3,4 andtheSmartSystemIIPC-Plus(SSII)by M&STechnologies(ParkRidge,IL).Bothchartsweresetatatest distanceof10feet.Thisdistancewasusedbecausemanypractices cannotaffordthespaceneededfora4-mor6-mtestlane.Thetwo systemswerematchedforluminanceusingtheSSIIsoftware,room lightingandaluminanceprobe.Meanluminancewas141.6cd m 2 fortheSSIIand135.1cdm 2 forETDRS,whileroom illuminationwasidenticalinbothcases.
TheSSIIwascalibratedtoa10-footdistance.Theoptionto “calibrateforshortlanes”wasnotused.ThescreensizewascalibratedusingtheSSIIsoftware.Thedefaultlettersetwasused, whichincludesallthecapitalRomanlettersexceptI,J,M,Q,W, X,andY.TheSSIIwassettopresentlettersrandomly.Adefault SnellendistanceincrementwasusedcorrespondingtodenominatorsintheSnellenequivalentfraction20/xof40,32,25,20,16, 12,and10feet.(Bywayofcomparison,thePrecisionVision ETDRSchartshaveadenominatorprogressionof40,32,25,20, 16,12.5,and10feetfortheSnellenequivalentfraction20/x.)The defaultnumberoflettersperlinewereutilized;namely,fiveletters forrowswithdenominatorsof40to25feet,andsixlettersforrows withdenominatorsof20to10feet,alldenominatorsbeingforthe Snellenequivalentfraction20/x.
Procedures
Datawerecollectedintwovisitsconductedondifferentdays separatedby1to3days.Onthefirstvisit,abriefcasehistorywas conducted.Best-correctedvisionwasdeterminedafteranoncycloplegicsubjectiverefractioninaphoropterfora10-foottest distance.Thistestdistancewastohelpassuremaximalacuityfor thedistanceofthechart.A“maximumpositivepowerforbest visualacuity”criterionwasusedandvisualacuitieswiththiscor-
EvaluationofVisualAcuityMeasurementinYoungVisually-NormalAdults—McClenaghanetal.219 OptometryandVisionScience,Vol.84,No.3,March2007
rectionwererecordedusingtheSmartSystemII.Next,visual acuitiesweremeasuredbyeachprocedurethroughthephoropter withthepreviouslyobtainedsubjectiverefractioninplace.The secondvisitinvolvedavisualacuitymeasurementbyeachprocedureunderidenticaltestconditions.
TheorderoftestingwiththeETDRSorSSIIwasrandomized acrossparticipantsinboththefirstandsecondvisits.AllrandomizedtestorderswereobtainedwiththeRAND()function,apseudorandomnumbergeneratorintheMicrosoftExcelprogram.The examinersweremaskedbyhavingoneexaminerperformonetest andtheotherperformthesecondtest,withoutcommunication. Visualacuitieswerecalculatedwithletter-by-letterscoring.Each correctletterwasawarded0.02logMARinlinesthathadfive lettersperrow,and0.0167logMARinlinesthathadsixlettersper row.Thisstudyfollowedrecommendationstouseatermination ruleofstoppingafterfourormoremistakesonalineforletter-byletterscoring.12 Althoughsucharuleimpliesdifferenteffective thresholdsforfive-letterandsix-letterlines,simulationsofvarious line-by-lineterminationrulessuggestthatanyeffectsonmeasured visualacuitywouldbeminor.12
Allvisualacuitymeasurementswereobtainedmonocularly.Left orrighteyeatrandomforeachparticipantwereselectedatthe initialvisit.Thetestedeyewastherighteyein20participantsand thelefteyein37participants.
StatisticalAnalysis
TheassumptionsofStudent’st-testwereinvestigatedroutinely beforeitsuse.ThenormalityofeachdatadistributionwasinvestigatedwiththeKolmogorov–Smirnovtest,13 andhomogeneityof varianceswiththeBrown–Forsythetest.14
ToassessinparttheaccuracyoftheSSII(seeResults),principal axisregressionwasused.15 Thisisanalternativetolinearregression whenthereisnotrueindependentvariable.(Inthecurrentcase,we wishedtoregressSSIIvisualacuityagainstETDRSvisualacuity, butneitheroftheseisanindependentvariable.)Beforeprincipal axisregression,plotswereinvestigatedvisuallyforoutliers.We calculatedboththeslopeandinterceptofthebestfitline,anda 95%CIfortheslopeofthebestfitline.15
Agreementbetweentests,andthetest–retestrepeatabilityofeach testwereassessedwithBland–Altmananalysis.11 Beforeanalyses, normalityofthedistributionswasassessedwiththeKolmogorov–Smirnovtest.13 AstheBland–Altmanlimitsofagreementareonly estimatesoftheirrespectivepopulationparameters,95%CIsforthe limitsofagreementwerealsocalculated.11
Tomakeaformalcomparisonoftest–retestrepeatabilitywith thetwoVATs,itwasnecessarytochooseasuitableparameterand designacustomstatistic.Thedifferenceinmeasuredvisualacuity betweenfirstandsecondvisits(d)wasusedasaparameterfor comparingthetest–retestrepeatabilityofthetwoVATs.DifferencesinrepeatabilitybetweenVATscouldmanifestasadifference inaveraged(forexample,aVATshowsasystematicdriftbetween visits),oradifferenceinthevarianceofd(forexample,oneVATis inherentlymorevariable,butthemeanacuityisconstant),ora combinationofboth.Accordingly,theCrame´r–vonMisesW2 statisticwasusedasanoverallmeasureof any differenceinthe empiricaldistributionfunctions(alsoknownascumulativedistributionfunctions)betweenVATs.16 Aprobabilityvaluewascalcu-
latedbyarandomizationprocedure17 withrandomenumeration (n 500).18
RESULTS DifferencesBetweenTwoExaminers
Therewerenosignificantdifferencesinmeasuredvisualacuities betweenthetwoexaminersoneithervisitforeitherVAT,byt-test, whereddenotesthemeanExaminerAacuityreadinglessthemean ExaminerBacuityreading(visit1,ETDRS,d 0.017log MAR,t 0.81,p 0.42;visit1,SSII,d 0.030,t 1.30,p 0.20;visit2,ETDRS,d 0.010,t 0.56,p 0.58;visit2, SSII,d 0.027,t 1.33,p 0.19).
Accuracy
Theaveragevisualacuityinthegroupwassignificantlydifferent betweenVATs(t 2.46,p 0.017),being 0.16logMARfor ETDRSand 0.18logMARfortheSSIIcharts.Thesevalues correspondtoavisualacuitydifferenceofaboutonelogMAR lettermoreonSSIIincomparisontotheETDRS.A95%confidenceintervalforthedifferenceinVAbetweenthetwosystems was 0.033to 0.003logMAR.Thus,wecanbereasonably certainthatthetruedifferencebetweenchartsislessthanabout 1.65letters.
HomogeneityofAccuracyAcrosstheChart
Oneeffectweanticipatedisthataccuracycouldbepoorerin certainpartsofthechartduetodesignissuessuchaspoorpixel renditionoftheverysmallestlinesontheSSII.Toinvestigatethis issue,meanvisualacuityfortheSSIIoverbothvisitswasplottedas afunctionofmeanvisualacuityfortheETDRSchartoverboth visits,andprincipalaxisregression15 usedtodeterminethebest fittinglinetothedata(Fig.1).Ifthedifferenceinacuitybetween instrumentsisuniformacrossalllettersizes,thenthisplotshould haveaslopeof1.00.
Thebest-fitlineforSSIIvisualacuityasafunctionofETDRS visualacuityhadaslopeof 1.1097andaninterceptof 0.001. The95%confidenceintervalfortheslopewas 0.82to 1.52. Thebest-fitlinehasaslopecloseto1.0andaninterceptcloseto zero.Thissuggestsnegligibledifferencesbetweenthetwosystems.
AgreementBetweentheTwoTests
ABland–Altmananalysiswasusedtopresentvisuallyandquantitativelythelevelofagreementbetweenthetwoinstruments(Fig. 2).11 The95%limitsofagreementbetweenthetwoVATswere 0.129and 0.092logMAR.The95%CIsforthelimitsof agreementhadalargestexpectedrangeof 0.155and 0.118, andasmallestexpectedrangeof 0.104and 0.067.
Test–RetestRepeatability
ABland–Altmananalysiswasusedseparatelyforeachinstrumenttoestablish95%limitsofagreementforvisualacuitytestretestrepeatability.TheBland–AltmanplotfortheSSIIisshown inFig.3.The95%limitsofagreementforrepeatabilityfortheSSII
220EvaluationofVisualAcuityMeasurementinYoungVisually-NormalAdults—McClenaghanetal. OptometryandVisionScience,Vol.84,No.3,March2007
FIGURE1.
MeanSSIIlogMARvisualacuityoverbothvisitsasafunctionofmean ETDRSlogMARvisualacuityoverbothvisits.Thesolidlineindicatesthe best-fitlinetothedatabyprincipalaxisregression.Thedashedline indicatestheunit-slopelinecorrespondingtonodifferencebetweenthe twocharts.
FIGURE3.
Bland–Altmanplotfortest–retestrepeatabilityoftheSSII.Theaverage visualacuity(logMAR)ofthetwovisitsisplottedontheabscissaandthe differencebetweenthetwovisualacuitymeasurementsisplottedonthe ordinate.Thesolidlineindicatesthemeandifferencebetweenthetwo visitsanddashedlinesindicatethe95%limitsofagreementforthe differenceinvisualacuitybetweenvisits.
ComparisonofTest–RetestRepeatability
Thedifferenceinmeasuredvisualacuitybetweenfirstandsecondvisits(d)wasusedasaparameterforcomparingthetest-retest repeatabilityofthetwoVATs.Differencesinrepeatabilitybetween VATscouldmanifestasadifferenceinaveraged,adifferenceinthe varianceofd,oracombinationofboth.Therewasnosignificant differenceinrepeatabilitybetweenthetwoVATs(p 0.19;randomizationtestwithCrame´r–vonMisesW2).

DISCUSSION
FIGURE2.


Bland–AltmanplotforacomparisonoftheSSIIandETDRScharts.The averagevisualacuity(logMAR)ofthetwochartsisplottedontheabscissa andthedifferencebetweenthetwovisualacuitymeasurementsisplotted ontheordinate.Thesolidlineindicatesthemeandifferencebetweenthe twochartsanddashedlinesindicatethe95%limitsofagreementforthe differenceinvisualacuitybetweencharts.
were 0.125and 0.166logMAR.Incomparison,theBland–AltmanplotfortheETDRSisshowninFig.4.The95%limitsof agreementforrepeatabilityfortheETDRSchartswere 0.121 and 0.132logMAR.
FortheSSII,95%CIsforthelimitsofagreementhadalargest expectedrangeof 0.158and 0.199,andasmallestexpected rangeof 0.091and 0.132.FortheETDRS,95%CIsforthe limitsofagreementhadalargestexpectedrangeof 0.150and 0.161,andasmallestexpectedrangeof 0.092and 0.103.
Asmallstatisticallysignificantdifferenceinmeanvisualacuity wasfoundbetweenthetwoVATs.Meanvisualacuitywason average0.02logMARbetterontheSSIIthantheETDRScharts. Inaddition,the95%confidenceintervaldemonstratedthatthis differenceisunlikelytobemorethan0.033logMAR.If0.025log MARistakenasadifferenceinacuitynoticeabletomanyindividuals,8 thenthedifferencesbetweenVATsaremostlikelynegligible, butpossiblysmallandnoticeable.Bywayofcomparison,mean differencesofupto0.09logMARhavebeenfoundbetweencommontestchartsbasedontheBailey–Lovieprinciples.19 Thesedifferencescouldbeofimportanceinsituationswhereapatientis testedontwoormoreVATsandclinicaldecisionswerenecessary basedonthemeasuredVAs.
Thelimitsofagreementfortest–retestrepeatabilityoftheSSII wereequivalenttoafluctuationofalittleoverplusorminusone line( 0.125to 0.166logMAR).Uponinitialinspection,this fluctuationseemedhigh.However,similartest–retestrepeatability wasfoundwiththeETDRS.Furtherstatisticalanalysisdemonstratednosignificantdifferencebetweentherepeatabilityofthe SSIIandtheETDRSsystems.Inaddition,theselevelsofrepeatabilityaretypicalofcommonlyusedlogMARtestingcharts.19,20
EvaluationofVisualAcuityMeasurementinYoungVisually-NormalAdults—McClenaghanetal.221 OptometryandVisionScience,Vol.84,No.3,March2007
FIGURE4.
Bland–Altmanplotfortest–retestrepeatabilityoftheETDRScharts.The averagevisualacuity(logMAR)ofthetwovisitsisplottedontheabscissa andthedifferencebetweenthetwovisualacuitymeasurementsisplotted ontheordinate.Thesolidlineindicatesthemeandifferencebetweenthe twovisitsanddashedlinesindicatethe95%limitsofagreementforthe differenceinvisualacuitybetweenvisits.

Puttingasidevariableswhichtheexaminermayeasilycontrol (suchasmostaspectsofchartdesign21),therearenotmanysuggestionsforwhyvisualacuitymeasurementvariabilityissohigh. Somepossibilitiesaretoofewlettersperlineonavailablecharts,21 smalldifferencesinlegibilityoflettersbetweenlinesondifferent chartversions,22 memorization,23 andsmalluncorrectedrefractive errors.10,24 Moreresearchisneededonthetemporalpropertiesof visualacuity.
BasedoncertaincharacteristicsoftheSSIIunitmentionedin theIntroduction,onemightexpectvisualacuitiestobemoreaccurateandrepeatablewiththeETDRSchart.However,itwas foundthatclinicallytheyarevirtuallyequivalentintermsofaccuracyandrepeatability.
Theissuesofpixilationandanti-aliasingofletterssmallerthan 20/20Snellenequivalent,noticeableundercloseinspectionofthe SSII,maynotbeimportantforthecurrentrecognitiontaskat threshold.Letterrecognitiondependsonanarrowbandofspatial frequencies,whichforsmallletterstendstobecenteredonspatial frequenciesthatarelowintermsofcyclesperletter.25 Thus,itmay bethatpixilationofthecurrentLCDdisplayisirrelevanttothe taskprovidedthelowspatialfrequenciesoftheletterstrokesare adequatelyrepresentedbythedisplay.
TheSSII,asconfiguredforthecurrentstudy,alsodifferedfrom theETDRSchartbyanunequalnumberoflettersperline(some rowshadsixratherthanfiveletters),useofalargerandnonstandardletterset,andslightdifferencesinsizeprogression(a20/12 ratherthan20/12.5equivalentline).Thecurrentresultsshowthat thesesmalldifferenceswerenotcriticaltothemeasuredacuity. However,ourresultsshouldnotbeconstruedtosupportareturn topreBailey–Lovie2 chartdesigns.
WhensettinguptheSSII,wenotedthatselectionofthe“calibrateforshortlanes”optionwithinthesoftwareledtolargeand noticeableerrorsintherenditionoflettersizessmallerthan20/20 equivalentatdistancesof10feetandless.Inthecurrentprotocol wedidnotusethe“calibrateforshortlanes”option.
IncomparingtheSSIIandtheETDRS,wefoundthetwo systemstobevirtuallyequivalentinaccuracyandrepeatabilityina clinicalsetting.Ifanything,wefoundtheSSIItocarryanadvantageintermsofflexibilityandconvenienceoftargetpresentation.
ACKNOWLEDGEMENTS
WethanktheCaliforniaChapteroftheAmericanAcademyofOptometryfor theirsupportofthisprojectbyaStudentODProjectResearchGrant. ReceivedMarch24,2006;acceptedNovember13,2006.
REFERENCES
1.LennieP,VanHemelSB,eds.VisualImpairments:Determining EligibilityforSocialSecurityBenefits.Washington,DC:National AcademyPress;2002.
2.BaileyIL,LovieJE.Newdesignprinciplesforvisualacuityletter charts.AmJOptomPhysiolOpt1976;53:740–5.
3.FerrisFL3rd,KassoffA,BresnickGH,BaileyI.Newvisualacuity chartsforclinicalresearch.AmJOphthalmol1982;94:91–6.
4.FerrisFL3rd,FreidlinV,KassoffA,GreenSB,MiltonRC.Relative letterandpositiondifficultyonvisualacuitychartsfromtheEarly TreatmentDiabeticRetinopathyStudy.AmJOphthalmol1993; 116:735–40.
5.MeszarosL,TrokelS. Integratedsystemsolvesmanyacuitytesting problems:visualassessmentdeviceallowsforfingertipcontrol, superiorvisionevaluationofpatients.OphthalmolTimes2004; March1;41. Availableat:http://www.ophthalmologytimes.com/ ophthalmologytimes/article/articleDetail.jsp?id 88657.Accessed December28,2006.
6.KhananiAM,BrownSM,XuKT.Normalvaluesforaclinicaltestof letter-recognitioncontrastthresholds.JCataractRefractSurg2004; 30:2377–82.
7.KraemerHC,ThiemannS.HowManySubjects?StatisticalPower AnalysisinResearch.NewburyPark,CA:SagePublications;1987.
8.MillerAD,KrisMJ,GriffithsAC.Effectofsmallfocalerrorson vision.OptomVisSci1997;74:521–6.
9.BrownB,Lovie-KitchinJ.Repeatedvisualacuitymeasurement:establishingthepatient’sowncriterionforchange.OptomVisSci 1993;70:45–53.
10.RosserDA,MurdochIE,CousensSN.Theeffectofopticaldefocus onthetest-retestvariabilityofvisualacuitymeasurements.Invest OphthalmolVisSci2004;45:1076–9.
11.BlandJM,AltmanDG.Statisticalmethodsforassessingagreement betweentwomethodsofclinicalmeasurement[revised].Lancet 1986;1:307–10.Availableat:http://www-users.york.ac.uk/ mb55/ meas/ba.htm.AccessedDecember28,2006.
12.CarkeetA.ModelinglogMARvisualacuityscores:effectsofterminationrulesandalternativeforced-choiceoptions.OptomVisSci 2001;78:529–38.
13.SiegelS,CastellanNJJr.NonparametricStatisticsfortheBehavioral Sciences,2nded.Boston:McGraw–Hill;1988.
14.BrownMB,ForsytheAB.Robusttestsfortheequalityofvariances. JAmStatAssoc1974;69:364–67.
15.SokalRR,RohlfFJ.Biometry:ThePrinciplesandPracticeofStatisticsinBiologicalResearch,2nded.SanFrancisco:Freeman;1981.
16.StephensMA.TestsbasedonEDFstatistics.In:D’AgostinoRB,
222EvaluationofVisualAcuityMeasurementinYoungVisually-NormalAdults—McClenaghanetal. OptometryandVisionScience,Vol.84,No.3,March2007
StephensMA,eds.Goodness-of-FitTechniques.NewYork:M. Dekker;1986:97–194.
17.EdgingtonES.RandomizationTests,3rded.NewYork:M.Dekker;1995.
18.ManlyBFJ.RandomizationandMonteCarloMethodsinBiology. London:ChapmanandHall;1991.
19.HazelCA,ElliottDB.ThedependencyoflogMARvisualacuity measurementsonchartdesignandscoringrule.OptomVisSci2002; 79:788–92.
20.Lovie-KitchinJE,BrownB.Repeatabilityandintercorrelationsof standardvisiontestsasafunctionofage.OptomVisSci2000;77: 412–20.
21.RaaschTW,BaileyIL,BullimoreMA.Repeatabilityofvisualacuity measurement.OptomVisSci1998;75:342–8.
22.McMonniesCW,HoA.Letterlegibilityandchartequivalence.OphthalmicPhysiolOpt2000;20:142–52.
23.McMonniesCW.Chartmemoryandvisualacuitymeasurement. ClinExpOptom2001;84:26–34.
24.CarkeetA,LeeL,KerrJR,KeungMM.TheslopeofthepsychometricfunctionforBailey-Lovielettercharts:defocuseffectsandimplicationsformodelingletter-by-letterscores.OptomVisSci2001;78: 113–21.
25.MajajNJ,PelliDG,KurshanP,PalomaresM.Theroleofspatial frequencychannelsinletteridentification.VisionRes2002;42: 1165–84.
LawrenceR.Stark SouthernCaliforniaCollegeofOptometry 2575YorbaLindaBlvd Fullerton,California92831 e-mail:lstark@scco.edu EvaluationofVisualAcuityMeasurementinYoungVisually-NormalAdults—McClenaghanetal.223 OptometryandVisionScience,Vol.84,No.3,March2007
Article • Normal Values for Mesopic and Photopic Contrast
Sensitivity Function with and without Glare using a Sinusoidal Bull’s-Eye Target
Paul A. Harris, OD • Southern College of Optometry • Memphis, Tennessee
Zachary German, OD • Southern College of Optometry • Memphis, Tennessee
Laurel Roberts, OD • Southern College of Optometry • Memphis, Tennessee
ABSTRACT
Purpose: To determine the normal mesopic and photopic contrast sensitivity function in young, healthy individuals with a sinusoidal bull’s-eye with and without glare.
Methods: Contrast sensitivity (CS) was measured on 105 healthy volunteers with 20/20 BCVA. A sinusoidal bull’s-eye target was used for all tests. After dark adaptation, four different spatial frequencies under mesopic and five different spatial frequencies under photopic conditions were presented in a two-choice, forced-choice paradigm. Each of the nine conditions was tested under three different levels of glare and without glare. The targets were varied in each trial from high contrast to threshold using a staircase method.
Results: The without-glare condition demonstrated the expected CS curve; each of the different glare conditions dropped CS statistically significantly. Low- and medium-glare levels dropped CS by similar amounts, showing a 0.1 log (NOTE: all log units in this paper are log10) decrease under both conditions. The high-glare condition dropped the CS by greater than an additional 0.1 log compared with the low and medium conditions. Standard deviations were small in each condition tested, which leads to the conclusion that in this group of 105 healthy subjects, the differences seen from condition to condition are demonstrable.
Conclusion: Glare testing, combined with the sinusoidal bull’s-eye target, may become a valuable clinical and research tool to aid in the diagnosis of visual conditions affecting the CSF, as well as for measuring the effects of optical and medical interventions on visual performance.
Keywords: bull’s-eye, circular Bessel-function, circular sine wave, contrast sensitivity, glare, J0 targets, mesopic, photopic, rectilinear sine-wave gratings, sinusoidal bull’s eye
Introduction
Contrast sensitivity (CS) has been a staple of optometric testing for 40+ years. Glare testing has been mostly research-based. CS testing is used to measure the performance of optical corrections, from contact lenses to ophthalmic lenses to implanted intraocular lenses (IOL), particularly multifocal IOLs. Clinical CS testing is often quite time-consuming, and glare testing has not established itself yet in the
clinic. The new bull’s-eye concentric rings, sinewave grating targets, and automated testing protocols combine CS and glare testing in an easy-to-use testing system for both research and clinical use. This study was undertaken to determine values with healthy subjects for all conditions, using the testing system and methods for possible adoption for both research and clinical use.
Optometry & Visual Performance 138 Volume 7 | Issue 3 | 2019, July
Many disciplines look to measure human visual performance precisely in meaningful and clinically relevant ways. Visual acuity has been the mainstay of clinical human visual performance measurements. 1 Though there have been many improvements over the years, searches for more insightful probes of visual performance continue.
CS testing has evolved to meet some of the perceived shortcomings of visual acuity testing. The primary targets for contrast testing have been letters (Pelli-Robson and Bailey-Lovie charts), linear sine wave gratings (Vistech, FACT, and many others), and radial or circular types of targets (J0 or Bessel-function target and sinusoidal–radial sine wave). “Shortcomings of the letter charts include letters having different degrees of contrast thresholds and patients’ varying levels of language ability.” 2
The value of CS testing is its objectivity and the ability to detect small but significant changes in a short period of time. When there is loss of contrast sensitivity, many activities of daily living are negatively impacted, including reading, using tools, finding objects, mobility, and driving, to name a few.3 Contrast sensitivity also plays a role in many aspects of vision, specifically motion detection, visual field, pattern recognition, and dark adaptation, besides its obvious effect on visual acuity. 2 On a clinical basis, CS is important because it predicts functional vision better than other visual diagnostics. 4
CS testing has also been done in both mesopic and photopic conditions, with and without glare, in order to assess how the person performs in a variety of conditions that have been related to different aspects of daily living, but never with all combinations being assessed at the same time. Although contrast sensitivity tests under high-illumination conditions show the best reproducibility, measurements of the full spectrum of the contrast sensitivity function under various
light conditions might give information about the patients’ visual abilities in daily life situations. 5 This is echoed in the recent recommendations by the Food and Drug Administration (FDA), where they state that vision testing should be performed in dark or dim ambient lighting conditions. 6
Many of the early charts of CS, such as the Vistech chart, had sine wave gratings of different spatial frequencies and contrast levels.7 However, astigmatism and higher-order aberrations (coma, trefoil, and tetrafoil) cause lines to appear darker (higher contrast) in one angular orientation than in the orthogonal orientation, where they appear much lighter (lower contrast). 8 The first targets developed were circular or bull’s-eye sine-wave gratings. These were to overcome a potential problem of orientation bias from astigmatism with linear vertical sine-wave gratings. 7 In order to address these issues, Holladay developed a rotationally symmetric target (sinusoidal bull’s-eye target). The sinusoidal bull’s-eye has a spatial frequency that is the same as linear gratings, but the target is rotationally symmetric. Patients with astigmatism and other non-rotationally symmetric aberrations will have no advantage or disadvantage based on the orientation of the appearance of the target. For two patients with the same amount (magnitude) of astigmatism but at different orientations, the target will appear the same, only rotated. The result is no difference in the apparent contrast of the target. 8
A recent development in CS testing has been the addition of glare testing in both the mesopic and photopic conditions. Disability glare is the reduction in visual acuity or CS resulting from a nearby glare source and is the result of forward intraocular light scatter. 9 In looking at the reliability, validity, and discriminative ability of glare testing, unless good chart design and psychophysics are used, the geometry and the intensity of the glare source are of little importance. 9
Optometry & Visual Performance 139 Volume 7 | Issue 3 | 2019, July
Computerization of the presentation of stimuli has been taking hold both clinically and in research settings in many fields, with the vision care field being no exception. In testing CS, computerization has allowed for finer and more accurate control of many facets of the testing protocols, as well as making the targets highly consistent over time. Using digitized charts aids with the sensitivity and randomization of the grating presentations, 6 and computerized testing can exploit adaptive testing strategies that greatly improve testing efficiency without experimenter intervention. 4
The testing protocol that was used in this study follows the recommendations cited in both the FDA consensus statement and in the work on the quick CSF method. As a critical outcome measure for clinical trials, contrast sensitivity must be measured with and without glare at four spatial frequencies: 3, 6, 12, and 18 cycles per degree for photopic (85 cd/m2) vision and 1.5, 3, 6, and 12 cycles per degree for mesopic (3 cd/m2) vision. 4,6
Methods
One hundred and five subjects were recruited from the Southern College of Optometry student population with the following characteristics: 23 male, 82 female;
mean age 25.25 years (range 22.7 to 40.3 years); and best-corrected visual acuity 20/20 or better in each eye. Visual acuities were tested using the automated ETDRS testing protocol (Clinical Trial Suite (CTS) M&S Technologies Systems, Niles, IL). All testing was done with room lights off, and background luminance was verified to be 0 cd/m2. Prior to each testing session, the system was calibrated with screen luminance set to 85 cd/m2.
The CTS system is shown in Figure 1, with the bull’s-eye target as seen by subjects with glare lights off. The Asus Zenbook UX303UB laptop shown has a pixel resolution of 3200 x 1800, with a mean luminance of 170 cd/ m2, allowing a target with a constant spaceaveraged stimulus luminance of 85 cd/m2 at all contrast levels. The gray-level resolution is 24 bit, with the capability of displaying 0.4% or -2.4 log CS. Four glare lights were chosen surrounding the screen to give an equal distribution of light over the surface of the eyes. A diffuser covers each light to mitigate optical aberrations in the light path. The diffuser breaks up any aberrations introduced by the focusing lens in front of the LED.
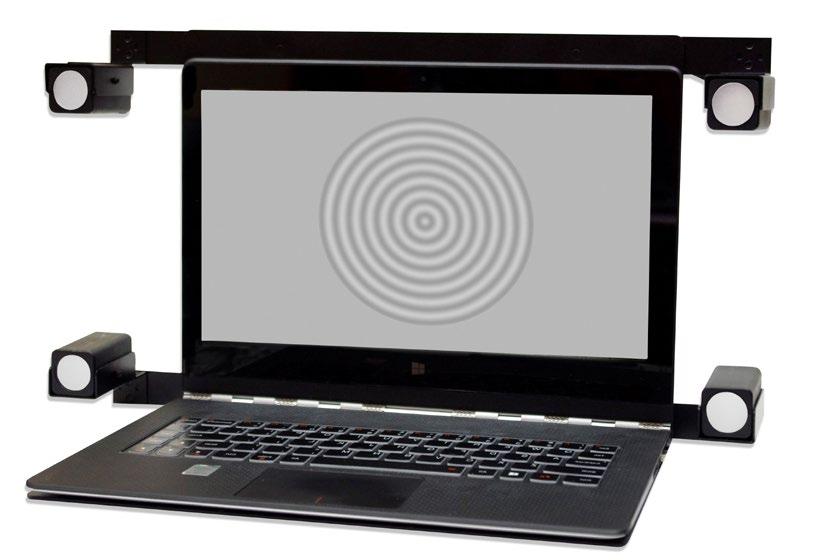
Subjects were seated 8 feet from the screen, and a tablet (Figure 2) paired to the computer via Bluetooth was placed before them. The system follows a protocol as described here:

Optometry & Visual Performance 140 Volume 7 | Issue 3 | 2019, July
Figure 1. The system used, with one of the sinusoidal bull’s-eye CS targets shown. The four outboard lights provide the glare source; luminance was calibrated with a lux meter at the plane of the face of the subjects.
Figure 2. The tablet that is placed before the subject on which they make their responses. Subjects are instructed to press the bull’s-eye on the screen or the solid circle on the right if they do not detect a bull’s-eye.
Testing begins at 0.6 log above previously calculated expected levels of CS in the general population. If the patient answers correctly, the test reduces the contrast in 0.3 log unit steps with every “Yes” or “Correct” until an incorrect is recorded. The protocol then goes up 0.2 log units and will reduce in 0.1 log unit steps until the next incorrect answer. Next, the best (lowest) two contrast levels are averaged for the final result, recorded numerically. Final results are plotted on printouts after all testing is complete. Five to 8 gray disks (not sinusoidal bull’s-eyes) are randomly displayed throughout the test to evaluate for possible false positives as an indicator of patient reliability.
Subjects were oriented as to what would transpire during the testing. At the beginning of the first visit, the study was briefly explained to the subject. Because some of the tests being used were likely to be unfamiliar and to use forced-choice procedures, the subject is informed that he/she will be required to make decisions about stimuli that might be very difficult to see and that for all observers, there would probably be some stimuli that might not be discernable. It was stressed that subjects should not become anxious because of the uncertainty that they might experience. They were encouraged to try as hard as possible when the stimuli were difficult to see.10 Subjects often felt like they were guessing as the targets approached threshold. After preliminary testing during the pilot phase of the study, we found that using the criteria of seeing at least two parts of circles going at least one-third of the way around helped to reduce subjects’ anxiety of guessing.
CS was measured under mesopic (4 spatial frequencies) and photopic (5 spatial frequencies) conditions, with three different levels of glare and without glare, for a total of 36 different testing conditions. All 36 thresholds were identified in about 25 minutes of testing for each subject. A digital lux meter was positioned directly where the
subject’s face would be, and the glare lights were calibrated at 8 feet prior to beginning the study to be: low = 120 lux, medium = 150 lux, and high = 450 lux. To conduct the mesopic tests, subjects were dark adapted for 5 minutes prior to beginning testing. A large filter was placed over the entire CTS, including the 4 glare lights, reducing all light levels to 3.53% of the photopic levels (mean target luminance was 3 cd/m2)(Appendix A).
Statistical Analysis
Data were examined using mixed-effects linear regression, fitting separate models for experiments at photopic and mesopic luminance. The dependent variable for each model was the log contrast sensitivity value (reciprocal of contrast threshold value). Fixed parameters included a spatial frequency factor (in cycles per degree, for photopic: 1.5, 3, 6, 12, and 18; for mesopic: 1.5, 3, 6, and 12), a glare level factor (baseline, low, medium, and high), and their interaction to characterize the effect of glare level at each spatial frequency. Each model included a subject-specific random intercept to account for repeated measurement on the same individuals. Model-predicted means, standard errors, and 95% confidence intervals were computed. Statistical significance was tested for contrasts at each spatial frequency, comparing baseline against each level of glare (i.e., baseline vs. low; baseline vs. medium; baseline vs. high). Finally, contrasts comparing low to medium glare were examined at each spatial frequency.
Results
CSF plots for all conditions under mesopic and photopic thresholds were plotted and compared. Results showed that all levels of glare reduced CS. The low and medium levels of glare reduced CS to about the same level; both were significantly different than no glare but were not different from each other. High
Optometry & Visual Performance 141 Volume 7 | Issue 3 | 2019, July
glare reduced CS statistically significantly from no glare, as well as from both the lowand medium-glare conditions.
Figure 3 shows the results of testing under mesopic conditions at each of the four spatial frequencies tested. The highest line is the noglare baseline condition, showing maximum CS without glare. The bars above and below each data point show the 95% confidence interval (CI). The lowest line is the high-glare condition, and the two almost-superimposed lines in the middle represent the low- and medium-glare conditions.

Figure 4 shows the results for testing under photopic conditions at each of the five spatial frequencies tested. The configuration of the lines, with the no-glare baseline condition on top and the high-glare on the bottom,
with the other conditions overlapping in the middle, repeats itself here, as in Figure 3.
Table 1 shows the data for all subjects combined for both the mesopic and photopic conditions. For each comparison, the value of the contrast, the 95% confidence limits, and the p-value are shown.
Contrasts comparing glare levels at each spatial frequency showed significant differences between glare levels at most frequency comparisons, with some exceptions (Table 1). In the mesopic data, there were no significant differences between low- and noglare (baseline) at 12 cpd (p=0.57), between medium- and no-glare (baseline) at 12 cpd (p=0.13), or between low- and medium-glare at any frequency level (all p values>0.05). All remaining contrasts showed significant
Optometry & Visual Performance 142 Volume 7 | Issue 3 | 2019, July
Figure 3. Results of the mesopic testing conditions
differences between glare levels. The photopic data yielded a similar pattern of significant differences, again with few exceptions. Lowglare did not differ from no-glare (baseline) at 18 cpd (p=0.47), while medium-glare did not differ from no-glare (baseline) at 1.5 cpd (p= 0.07) or 18 cpd (p=0.58). As in the mesopic data, there were no significant differences between low- and medium-glare levels at any frequency (all p values >0.05), suggesting that low- and medium-glare levels yield very similar results on contrast sensitivity. All remaining glare comparisons were significantly different at each frequency examined.

Discussion
Light Levels
In a pilot version of this study, each of the glare light levels were lower, with the prior
value for high being set at the current medium value and the others scaled down from there. With these reduced glare levels, at the low level of glare, a number of subjects actually showed a slight improvement in CS. This could have been due to a small amount of pupillary constriction, possibly improving CS by eliminating some of the peripheral rays through the optics of the visual system. This led to a revision of the glare light levels for each of the three levels tested in this study; glare levels were increased at each of the three levels over those used in the pilot study.
At the levels chosen for the full study, better stratification of the data between each of the three levels of glare was expected. The low-glare level was indeed enough to cause a decrease in CS at all spatial frequencies in both the mesopic and photopic conditions.
Optometry & Visual Performance 143 Volume 7 | Issue 3 | 2019, July
Figure 4. Results for all five spatial frequencies under photopic conditions
Table 1. Contrasts Comparing Glare Levels at Each Frequency Measurement
Optometry & Visual Performance 144 Volume 7 | Issue 3 | 2019, July
Mesopic Contrast 95 % CI p-value (Low vs Baseline) @ 1.5 0.12 0.06 0.18 0.0001 (Low vs Baseline) @ 3 0.14 0.08 0.20 0.0000 (Low vs Baseline) @ 6 0.11 0.05 0.17 0.0002 (Low vs Baseline) @ 12 0.02 -0.04 0.08 0.5736 (Medium vs Baseline) @ 1.5 0.16 0.10 0.22 0.0000 (Medium vs Baseline) @ 3 0.16 0.10 0.22 0.0000 (Medium vs Baseline) @ 6 0.15 0.09 0.21 0.0000 (Medium vs Baseline) @ 12 0.05 -0.01 0.11 0.1227 (High vs Baseline) @ 1.5 0.35 0.29 0.41 0.0000 (High vs Baseline) @ 3 0.35 0.29 0.41 0.0000 (High vs Baseline) @ 6 0.32 0.26 0.38 0.0000 (High vs Baseline) @ 12 0.18 0.12 0.24 0.0000 (Medium vs Low) @ 1.5 0.04 -0.02 0.10 0.1857 (Medium vs Low) @ 3 0.02 -0.04 0.08 0.5974 (Medium vs Low) @ 6 0.03 -0.03 0.09 0.2578 (Medium vs Low) @ 12 0.03 -0.03 0.09 0.3267 (High vs Medium) @ 1.5 0.19 0.13 0.25 0.0000 (High vs Medium) @ 3 0.19 0.13 0.25 0.0000 (High vs Medium) @ 6 0.17 0.11 0.23 0.0000 (High vs Medium) @ 12 0.14 0.08 0.20 0.0000 Photopic Contrast 95 % CI p-value (Low vs Baseline) @ 1.5 0.09 0.02 0.16 0.0124 (Low vs Baseline) @ 3 0.09 0.02 0.16 0.0146 (Low vs Baseline) @ 6 0.11 0.04 0.18 0.0021 (Low vs Baseline) @ 12 0.17 0.10 0.23 0.0000 (Low vs Baseline) @ 18 0.03 -0.04 0.10 0.4670 (Medium vs Baseline) @ 1.5 0.06 -0.01 0.13 0.0739 (Medium vs Baseline) @ 3 0.12 0.05 0.19 0.0007 (Medium vs Baseline) @ 6 0.13 0.07 0.20 0.0001 (Medium vs Baseline) @ 12 0.13 0.06 0.20 0.0002 (Medium vs Baseline) @ 18 0.02 -0.05 0.09 0.5830 (High vs Baseline) @ 1.5 0.31 0.24 0.38 0.0000 (High vs Baseline) @ 3 0.39 0.33 0.46 0.0000 (High vs Baseline) @ 6 0.37 0.30 0.44 0.0000 (High vs Baseline) @ 12 0.33 0.26 0.40 0.0000 (High vs Baseline) @ 18 0.21 0.14 0.28 0.0000 (Medium vs Low) @ 1.5 -0.03 -0.09 0.04 0.4754 (Medium vs Low) @ 3 0.03 -0.04 0.10 0.3367 (Medium vs Low) @ 6 0.03 -0.04 0.10 0.4619 (Medium vs Low) @ 12 -0.03 -0.10 0.04 0.3521 (Medium vs Low) @ 18 -0.01 -0.08 0.06 0.8584 (High vs Medium) @ 1.5 0.25 0.18 0.32 0.0000 (High vs Medium) @ 3 0.27 0.20 0.34 0.0000 (High vs Medium) @ 6 0.24 0.17 0.30 0.0000 (High vs Medium) @ 12 0.20 0.13 0.27 0.0000 (High vs Medium) @ 18 0.19 0.12 0.26 0.0000
The high-glare level was enough to create a significant difference from both the low- and medium-glare levels, again reducing CS from baseline and from either the low- or mediumglare levels. Low- and medium-glare levels were found both functionally and clinically interchangeable.
New Tests and Significance
CS testing has yet to become routine in the eye and vision care field. When clinicians look to include new testing protocols, they should make themselves aware of the various factors that can affect the measurements. Without estimates for the significance of changes of the kind reported here, they have no basis on which to decide whether or not a patient’s test score has truly changed.10 The primary aim of this study was to provide both the researcher and the clinician with normal values and values of significant change. With the current level of glare set to our medium level, the clinician and researcher know to expect a 0.1 log unit decrease in CS at each spatial frequency in both the mesopic and photopic conditions. Should a patient or subject show larger changes
than this in response to glare, this would be a clear indication that CS is negatively affected and needs further investigation. In order to establish the significant level of change, it was important to have many steps of CS levels in the testing paradigm, with fine gradations between steps. The present study results thus show very small standard deviations. Narrow standard deviations facilitate the definition of finer significant changes in the levels of CS recorded. A study outcome of refined measurement of CS provides both the researcher and the clinician with support for the expected 0.1 log change in CS as normal with medium glare.
Not all Bull’s-Eye Targets are the Same
The term “bull’s-eye” has been used to describe two different types of circular targets used in CS testing. The first are radial frequency stimuli, defined in polar coordinates, where the spatial frequency varies along the radius and is modulated by spherical Bessel functions (J0). They are referred to in the literature as J0 targets (cylindrical Bessel functions), bull’seye, or circular gratings. Contrary to sine-wave


Optometry & Visual Performance 145 Volume 7 | Issue 3 | 2019, July
Figure 5. Circular J0 or Bessel-function targets
Figure 6. Sinusoidal bull’s-eye target on the screen as it appears to the test subject. The target shown here is the 12 cycles per degree target.
gratings, radial frequency stimuli are circularly symmetric and have a fixed center. 11 Examples of the J0 targets can be seen in Figure 5.
The second type of target that is known as a sinusoidal bull’s-eye target is the Holladay target (Figure 6). A characteristic of the Holladay version of the bull’s-eye CS target is that it is more similar to linear sine-wave gratings in that the amount of contrast is the same across the entire target. The J0 type target uses highest contrast in the center and drops off towards the periphery.
Kelly and Magnuski conducted substantial work determining contrast thresholds primarily using the J0 targets. Contrast thresholds for circular J0 targets and rectilinear sine-wave gratings behave quite differently as functions of spatial frequency. 12 The J0 pattern has its highest contrast in the center, and the contrast gets less and less as you move to the outside part. This is totally unlike the Holladay bull’s-eye in that anywhere you look, the contrast ratio is the same. Each pattern is detected at threshold, not in terms of its spatial contrast, but rather in terms of the component of maximum amplitude in its two-dimensional Fourier transform. 12
The original reasons given for using the J0 pattern were simply that as visual stimuli, circularly symmetric patterns seem more natural, and the J0 target in particular provides a center of fixation, while rectilinear gratings do not. Results showed that there was a significant difference between CS as measured by J0 targets and by rectilinear sinewave gratings. Following comparison with a Holladay-type target, Kelly and Magnuski found that the Holladay type functioned more similarly to linear sine wave gratings than did the J0 pattern.
An earlier barrier to using circular targets is that they are more difficult to generate accurately than rectilinear ones. Eventually, a suitable simulator was constructed. This was back in the 1970s when monitors that could
render these types of targets were severely limited as compared to what can be produced with today’s monitors and software.
Conclusions
Results presented here demonstrate that the use of the sinusoidal bull’s-eye target for measuring CSF does follow the expected CS curves. Additionally, we identified the specific level of glare that causes CS to drop by 0.1 log unit for each spatial frequency under both mesopic and photopic conditions. Using the different levels of glare helped to define the parameters through which glare affects CS in normal healthy subjects.
These curves provide the basis for considering adding the use of the bull’seye target with glare to determine how well different contact lenses, ophthalmic lenses, and IOLs perform under glare conditions. Additionally, the CS findings defined may lead to development of clinical testing protocols for aiding in the diagnosis of conditions such as cataract, macular degeneration, and epi-retinal membranes. Future testing with these specific populations and comparisons of performance on this test with linear CS targets should be done.
The M&S CTS system provides significant improvement over existing CS testing methods that project a fixed 8-target display with minimal luminance control. The M&S CTS system provides precision luminance with no floor or ceiling to the display targets, allowing for much greater sensitivity and a broader range of CS testing results.
Acknowledgements
Thank you to Jan Gryczynski, PhD, founding partner COG Analytics, Potomac, MD, for his assistance with the statistics.
Optometry & Visual Performance 146 Volume 7 | Issue 3 | 2019, July
1. Snellen H. Probebuchstaben zur Bestimmung der Sehschärfe. Utrecht : Van de Weijer, 1862.
References
2. Richman J, Spaeth GL, Wirostko B. Contrast sensitivity basics and a critique of currently available tests. J Cataract Refract Surg 2013;39:1100-6. http://bit.ly/2XE6avM
3. Hong YT, Kim SW, Kim EK, Kim T. Contrast sensitivity measurement with 2 contrast sensitivity tests in normal eyes and eyes with cataract. J Cararact Refract Surg 2010;36:54752. http://bit.ly/2XJPR08
4. Lesmes LA, Lu ZL, Baek J, Albright TD. Bayesian adaptive estimation of the contrast sensitivity function: The quick CSF method. J Vis 2010;10(3):17.1-21. http://bit.ly/2XFGeQg
5. Hohberger B, Laemmer R, Adler W, Juenemann AGM, Horn FK. Measuring contrast sensitivity in normal subjects with OPTEC® 6500: Influence of age and glare. Graefes Arch Clin Exp Ophthalmol 2007;245:1805-14. http://bit.ly/2XAEc3Z
6. MacRae S, Holladay JT, Glasser A, Calogero D, Hilmantel G, et al. Consensus statement on contrast sensitivity. Food and Drug Administration. s.l. : Ophthalmology 2017;124:139-41.
7. Ginsburg AP. Contrast sensitivity: Determining the visual quality and function of cataract, intraocular lenses and refractive surgery. Curr Opin Ophthalmol 2006;7:19-26. http://bit.ly/2XNMEwZ
8. Holladay JT. Astigmatic axis independent sparial frequency and contrast sensitivity target and method. US 7,354,155 B2 USA, April 8, 2008. http://bit.ly/2XJQ2Zm
9. Elliott DB, Bullimore MA. Assessing the reliability, discriminative ability, and validity of disability glare tests. Invest Ophthalmol Vis Sci 1993;34:108-19. http://bit.ly/2XG8P87
10. Reeves BC, Wood JM, Hill AR. Reliability of high- and lowcontrast letter charts. Ophthal Physiol Opt 13;1993:17-26. http://bit.ly/2XHEzts
11. Santos NA, Oliveira AB, Nogueira R, Simas M. Mesopic radial frequency contrast sensitivity function for young and older adults. Brazilian J Med Biol Res 2006;39:791-4. http://bit.ly/2XHELca
12. Kelly DH, Magnuski HS. Pattern detection and the twodimensional Fourier transform: Circular targets. Vis Res 1975; 15:911-5. http://bit.ly/2XNmDxO
Correspondence regarding this article should be emailed to Paul Harris, OD, at pharris@sco.edu. All statements are the authors’ personal opinions and may not reflect the opinions of the representative organizations, ACBO or OEPF, Optometry & Visual Performance, or any institution or organization with which the authors may be affiliated. Permission to use reprints of this article must be obtained from the editor. Copyright 2019 Optometric Extension Program Foundation. Online access is available at www.oepf.org, and www.ovpjournal.org.
Harris PA, German Z, Roberts L. Normal values for mesopic and photopic contrast sensitivity function with and without glare using a sinusoidal bull’s-eye target. Optom Vis Perf 2019;7(3):138-48.
Test Protocol Description
1. A training phase is conducted to familiarize the patient with the targets. In the case of the bull’s-eye gratings, a grating and a blank disk are alternately displayed so that the patient learns to differentiate these targets.
2. The high-frequency cut-off is determined. This will provide an equivalent acuity at the end of the exam. Starting at 18 cycles per degree at 99% contrast, the patient is presented with increasingly higher spatial frequency targets (e.g., 24, 30, 38 cpd) until they record an incorrect answer. The last correct spatial frequency is then verified.
3. For 18, 12, 6, 3, and 1.5 cycles per degree, contrast testing begins at 0.3 log units above the normative results. If this is not visible, it moves to 0.3 log unit steps of contrast. With the first correct answer, the test moves down 0.3 log units until an incorrect response is recorded. The test then moves up 0.2 log units, works back down in 0.1 log unit steps if correct, and goes up another 0.2 if incorrect. It continues reducing contrast in 0.1 log steps until a miss or a repeat of the best answer occurs. The system averages the two best at the next incorrect or reports the final answer if correct twice on the same log unit of contrast.
4. Throughout the exam, randomly interspersed gray disks are shown in order to prevent guessing (false positives). At the conclusion of the exam, the report will include a reliability index that shows the number of gray disks presented and the number that the patient identified. It also provides a percentage. A low score may indicate the need to educate the patient and to have them retake the exam.
5. The exam beeps, adding a beep at each spatial frequency so that the clinician can hear that the patient is still progressing. At completion, the Windows 'Ta Da' is played to let the clinician know that the test is completed.
6. The report will provide the raw data as well as a percentage of normal based on normative values. It also provides an elapsed time and reliability index. For each cycle/degree, the percent of contrast and its corresponding log units are printed.
7. Finally, the report presents the high-frequency cut-off and its equivalent acuity level.
Optometry & Visual Performance 148 Volume 7 | Issue 3 | 2019, July Appendix
A
Relationshipbetweencontrastsensitivity andsphericalaberration
Comparisonof7contrastsensitivitytestswithnatural andartificialpupilsinhealthyeyes
KimW.vanGaalen,MSc,NomdoM.Jansonius,MD,PhD,StevenA.Koopmans,MD,PhD, ThomTerwee,MSc,AartC.Kooijman,PhD
PURPOSE: Tofindacontrastsensitivitytestthatcanbeusedclinicallytoevaluateinterventions aimedatminimizingsphericalaberrationanddeterminethecircumstancesunderwhichthesetests shouldbeperformed.
SETTING: LaboratoryofExperimentalOphthalmology,UniversityofGroningen,Groningen,The Netherlands.
METHODS: Contrastsensitivitytestswereperformedusing2experimentaldesigns.Design1was withanaturalpupilundermesopicandphotopicconditions.Design2waswitha5.0mmartificial pupilaftercycloplegiaunderphotopicconditionsonly.Twocomputerizedtests(verticalsine-modulatedgratings[VSG]andHolladaycircularsine-modulatedpatterns[HACSS])and5charttests (Pelli-Robson,acuity-measuringletterchartsatlowcontrast[2.5%and10%],VectorVision,and edgecontrastsensitivity)wereused.SphericalaberrationwasassessedwithaHartmann-Shack wavefrontanalyzer.
RESULTS: Forty-ninehealthysubjectsaged20to35years(n Z 24)and55to70years(n Z 25) participated.Design2showedasignificantrelationshipbetweencontrastsensitivityandspherical aberrationwiththeHACSSat3cyclesperdegree(cpd)(P Z .03)and6cpd(P Z .01)andwiththe VSGat6cpd(P Z .01).Design1yieldednosignificantrelationships.
CONCLUSIONS: Usinganartificialpupil,arelationshipbetweencontrastsensitivityandspherical aberrationwasestablishedwiththeVSGandHACSStestsbutnotwiththecharttests.Notest showedarelationshipusingnaturalpupilsundereitherlightingcondition.Charttestsareunsuitable foruncoveringcontrastsensitivitydifferencesrelatedtodifferencesinsphericalaberration,as typicallyfoundinhealthyphakiceyes.
JCataractRefractSurg2009;35:47–56
2009ASCRSandESCRS
Inrecentyears,cataractsurgeryhasconsistedof replacingthecataractouslenswithasphericalintraocularlens(IOL).Theyounghumanlens,however, isanythingbutsphericalandactuallyimprovesthe opticsoftheeyebycompensatingforthespherical aberrationsofthecornea.Hence,opticalperformance aftercataractsurgerycanbelessthanperfect.Inan attempttofurtherimprovetheopticalperformance ofthepseudophakiceye,IOLswithopticalpropertiesmoresimilartothoseoftheclearyounghuman lenshavebeendesigned.Severalstudies1–11 have foundimprovedopticalperformanceafterthecataractouslensisreplacedwithaso-calledaspherical
IOLcomparedwiththeperformancewithaspherical IOL.
Theresultsofcataractsurgerywithimplantationof asphericalIOLsthataimtominimizesphericalaberrationscanbeevaluatedusingaHartmann-Shackwavefrontsensoranddynamicskiascopy.Thesetechniques measuretheopticalaberrationsoftheeyeprecisely andobjectively.Theprinciplesassociatedwiththese techniqueswereexplainedbyLiangetal.12 andCervinoetal.13 Theadvantageofthesemethodsistheobjectivity,andthedisadvantagesarethehighcostandthat theapparatusdoesnotmeasurevisualperformance directly.
Q
Q 2009ASCRSandESCRS PublishedbyElsevierInc. 0886-3350/09/$ seefrontmatter 47 doi:10.1016/j.jcrs.2008.09.016 ARTICLE
Inaclinicalsetting,contrastsensitivitytestingwith charttestscouldbeasimpleandinexpensivemethod ofdirectlyevaluatingvisualperformanceaftercataractsurgery.Manycontrastsensitivitycharttestsare commerciallyavailable,includingedgecontrastsensitivitytestsandlettercontrastsensitivitytestssuchas thePelli-Robson14 andtheMars,15 whichdisplaysingle-sizeoptotypeswithdecreasingcontrast(Kooijman AC,etal.IOVS1994;35:ARVOAbstract550).Adifferentapproachtocontrastsensitivitytestingwithletter chartsistheuseofchartsthatpresentoptotypesat afixedlowcontrastwitharangeofsizessimilarto thatofvisualacuitycharts.16
Traditionally,contrastsensitivityismeasuredwith gratingsatarangeofspatialfrequencies.17 Thesegratingscanbegeneratedbyacomputeranddisplayedon amonitororpresentedwithcharttestssuchastheVectorVision.18 Computer-driventestsallowcontinuous controllablecontrastlevelsthatenablepreciseassessmentofthethresholdatawiderangeofspatialfrequencies,whichresultsinacompletecontrast sensitivityfunction.Thedisadvantagesofcomputerdriventestsarethelongtestingtimeandtherelatively highcostoftheequipment.
RecentstudiesthatattemptedtoevaluatevisualperformanceaftertheimplantationofasphericalIOLs withcontrastsensitivitymeasurementsyieldedconflictingresults.1–11,19–22 Therefore,wethoughtthat asystematicinventoryoftheabilityofcontrastsensitivityteststouncovertheeffectsofdifferencesinspherical aberrationwaslongoverdue.Inthisstudy,weselected 2computerizedtestsand5charttests.Weassessedthe
Submitted:July14,2008.
Finalrevisionsubmitted:September16,2008.
Accepted:September21,2008.
FromtheLaboratoryofExperimentalOphthalmology(vanGaalen, Kooijman)andDepartmentofOphthalmology(Jansonius, Koopmans),UniversityMedicalCenterGroningen,Universityof Groningen,andAdvancedMedicalOpticsGroningenBV(Terwee), Groningen,theNetherlands.
Dr.TerweeisanemployeeofAdvancedMedicalOpticsGroningen BV,TheNetherlands.Nootherauthorhasafinancialorproprietary interestinanymaterialormethodmentioned.
PresentedattheannualmeetingoftheAssociationforResearchin VisionandOphthalmology,FortLauderdale,Florida,USA,May 2007.
SupportedbySenterNovem,TheHague,TheNetherlands,and DutchNationalGrantISO43081.
Correspondingauthor:K.W.vanGaalen,MSc,DepartmentofOphthalmology,UniversityMedicalCenterGroningen,Universityof Groningen,Postbus30.001,9700RB,Groningen,TheNetherlands. E-mail: k.van.gaalen@ohk.umcg.nl.
abilityoftheseteststoshowarelationshipbetween contrastsensitivityandsphericalaberration,thelatter measuredwithawavefrontsensor.Wealsoexplored theconditionsunderwhichcontrastsensitivitymeasurementsshouldbeperformedforthispurpose.
SUBJECTSANDMETHODS SubjectsandWavefrontAnalysis
ThestudyadheredtothetenetsoftheDeclarationofHelsinkiandwasapprovedbytheMedicalEthicalCommitteeof theUniversityMedicalCenterGroningen.Thestudywas registeredintheISRCTNregister(trialISCRTN66724598) andintheDutchtrialregisters(trial812).
Measurementswereobtainedfromhealthysubjectsin2 agegroups(20to35yearsand55to70years).Beforeinclusioninthestudy,subjectsgavetheirwritteninformedconsent.Eyeswitharefractiveerrorofmorethan G2.00 diopters(D)sphericalequivalentwereexcluded,aswere eyeswithacylindricalcorrectionofmorethan1.50Dor withacylindricalcorrectionthatdeviatedmorethan20degreesfromthehorizontalorverticalaxis.Onlythedominant eyewastested.Thebestcorrectedvisualacuity(BCVA)in thateyehadtobeatleast0.8(20/25).VisualacuityafteroptimalsubjectiverefractionwasdeterminedwithanEarly TreatmentDiabeticRetinopathyStudy(ETDRS)chart.No subjecthadaknownhistoryofocularpathologyorsurgery. Tofurtherdocumenttheabsenceofocularpathology,cornealtopographywasperformed(OrbscanIIversion3.12, Bausch&Lomb,Inc.)andadilatedfundusphotographof thepapillomacularregionwastakenandevaluatedbyan ophthalmologist.
Wavefrontaberrationsweremeasuredwithawavefront analyzer(WASCAversion1.26.3,AsclepionMeditec)in standardizedOpticalSocietyofAmericavalues(micrometers).23 TheZerniketermZ(4,0)wasusedasameasureof thesphericalaberrationintheeye.Initially,wavefrontaberrationsweremeasuredin35subjectsineachagegrouptoestimatetheGaussiansphericalaberrationdistributioninthat group.Next,subjectswereselectedfromeachagegroupto obtainroughlyequalnumbersofsubjectsin4subgroups ( 2SDto 1SD; 1SDtomean;meanto1SD;1SDto2 SD).Inotherwords,theaimwasauniformdistribution aroundthemeansphericalaberration.Thisresultedin24 youngersubjectsand25oldersubjects.Thisselectionwas performedtoimprovetheobservationofapotentialeffect ofsphericalaberrationoncontrastsensitivity.Thespherical aberrationwasmeasuredwithanaturalpupil(experimental design1)andwithanartificialpupil(experimentaldesign2). Inexperimentaldesign2,contrastsensitivitymeasurements started30minutesaftercycloplegiaandiridoplegiawereobtainedwithcyclopentolate1%.
ContrastSensitivityTests
Contrastsensitivitywastestedusing2computerizedtests and5charttests.Contrastsensitivitywasmeasuredatseveralspatialfrequenciesforbothcomputerizedtestsand1 charttest.Theorderofthetestswasrandomized.Tests wereperformedwithbestspectaclecorrectioninatrial frame.Eachtestwasperformedattherecommendedviewingdistance,andtherefractivecorrectionofthesubjects wascorrectedforthatviewingdistanceatthebeginningof eachtest.
48 CONTRASTSENSITIVITYANDSPHERICALABERRATION JCATARACTREFRACTSURG- VOL35,JANUARY2009
Thefirstcomputerizedtest,verticalsine-modulatedgratings(VSG)(VSG2/3version4.02,CambridgeResearchSystems),generatesverticalsine-modulatedgratings(3cycles perdegree[cpd]and6cpd)onacathoderaytube(Barco CCID7351B,Video&Communicationsn.v.)(Figure1, A). Thistestwasviewedatadistanceof2m.ThevonBe´ke´sy trackingmethodwasusedtoassessthecontrastthreshold. Inthismethod,thecontrastchangescontinuously.First,itincreasesuntilthesubjectobservesthepattern.Onpressing abutton,thecontraststartstodecreaseuntilthesubject cannolongerseethepattern.Thecontrastlevelsatwhich thegratingsarereportedasappearinganddisappearing arerecorded.Thespeedofchangeofcontrastwassetat0.3 log/second.Sixupperreversalsandlowerreversalswere measured.Thefirst,highest,andlowestvaluesofboththe upperandlowerreversalswereexcluded.Theremainingupperandlowerreversalswereaveraged,resultinginthecontrastthreshold.24 Thegratingpatterncontrastisexpressedin Michelsoncontrast:
Michelsoncontrast Z ðLmax Lmin Þ=ðLmax þ Lmin Þð1Þ whereLmax isthemaximumluminanceofthebrightbarsand Lmin theminimumluminanceofthedarkbars.Theorderin whichthespatialfrequenciesweretestedwasrandomized. Contrastsensitivitywasdefinedastheinverseofthemeasuredcontrastthreshold.
TheothercomputerizedtestwastheHolladayautomated contrastsensitivitytestingsystem(HACSS)(M&STechnologies)(Figure1, B).Thecircularsine-modulatedpatternswith spatialfrequenciesof3cpdand6cpdwereused.Thetestbeginswith50%contrast,startingatthehighestspatialfrequency.Thesubjectindicateswhetherthedisplayed stimulusisacircularpatternorablankdisk.Throughout thetest,severalblankdisksareshownatthesamemeanluminanceleveltocheckreliability.Aftereachcorrectanswer, thecontrastofthestimulusdecreasesinstepsof0.3logunits. Nearthethreshold,contrastdecreasesby0.1logunits.When anincorrectanswerisgiven,contrastincreasesby0.3log units(afterthesecondincorrectanswerby0.2logunits) anddecreasesby0.1logunituntilthenextincorrectresponse.Thecontrastthresholdcorrespondstothelowest contrastlevelatwhichthesubjectcancorrectlyidentify2 of3circularpatterns.Thecontrastsensitivityisbasedon
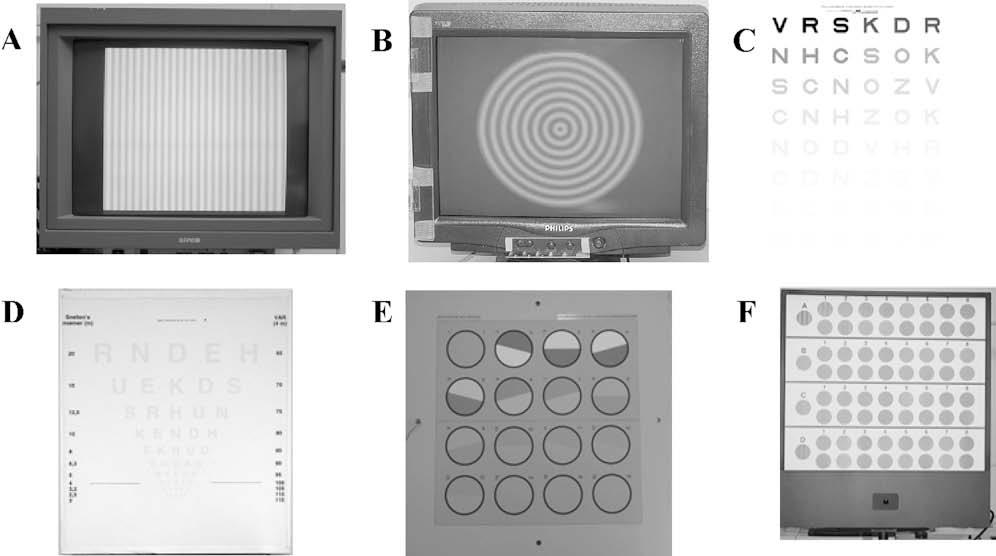
Figure1. Thecontrastsensitivity testsusedinthestudy. A:Vertical sine-modulatedgratings. B: Holladaycircularsine-modulated patterns. C:Pelli-Robson. D:Early TreatmentDiabeticRetinopathy Study2.5%and10.0%. E:GroningenEdgeContrastChart. F: VectorVision.
Michelsoncontrast(equation 1).Thistestwasperformedat therecommendedviewingdistanceof4m.
ThePelli-Robsoncontrastsensitivitycharttest(Clement ClarkeInternationalLtd.)displaysSloanlettersofconstant size(Figure1, C).Thechartconsistsof8rows,eachwith2 triplets.Contrastdecreasesfrom1triplettothenextinsteps of0.15logunits.ContrastsensitivityisexpressedastheinverseoftheWebercontrast:
Webercontrast Z ðLmax Lmin Þ=Lmax ð2Þ whereLmax istheluminanceofthebackgroundandLmin the luminanceoftheletters.Thetestwasperformedataviewing distanceof3m,whichcorrespondstoaspatialfrequencyof approximately3cpd.25 Themaximumlogcontrastsensitivity(logCS)thatcanbetestedis2.20.Whenasubjectmakes2 mistakeswithin1triplet,14 thetestisterminatedandthen scoredbyletter.26
TwootherchartcontrastsensitivitytestswereETDRS-like optotypechartsdevelopedintheLaboratoryofExperimentalOphthalmology,UniversityofGroningen,withlowcontrast(2.5%and10.0%)optotypesinWebercontrast(equation 2)(Figure1, D).Thesechartsmeasureresolution thesmallestoptotypethatcanbeseen atagivenfixedlowcontrast. Thevisualacuityrate(VAR)valueswereusedforstatistical evaluation.27,28 Thesetestsareperformedataviewingdistanceof1m.Whenthesubjectmakesthefirstmistake,the testisterminatedandthelastcorrectanswernoted.Contrast sensitivityisscoredbyletterwithamaximumVARof85and aminimumVARof35.
EdgecontrastsensitivitywasmeasuredusingatestdevelopedintheLaboratoryofExperimentalOphthalmology. Thistest,theGroningenEdgeContrastChart(GECKO) Figure1, E),presents16circulartargets(diameter74.0mm)dividedintohalveswithdifferentreflectionvalues(Kooijman AC,etal.IOVS1994;35:ARVOAbstract550).Thecontrast betweenthehalvesdecreasesinstepsof0.15logunits.The orientationoftheseparationlinehasatilt C15degrees,0degrees,or 15degreesintheverticalorthehorizontaldirection.Thesubjecthastoindicatethedarkesthalfandthe orientationoftheseparationline.Whenthesubjectmakes thefirstmistake,thetestisterminatedandthelastcorrectanswernoted.Theminimumcontrastforthischartis0.01in Michelsoncontrast(equation 1),correspondingto
49 CONTRASTSENSITIVITYANDSPHERICALABERRATION JCATARACTREFRACTSURG- VOL35,JANUARY2009
amaximumlogCSof2.0.Thistestwasperformedataviewingdistanceof3m.
TheVectorVisioncontrastsensitivitycharttest(VectorVision)(Figure1, F)presentstargetswithsine-wavegratingsat variousspatialfrequencies(3,6,12,and18cpd).Thesetargetsarepresentedonadoublerowoftargets;1ofthe2verticallyalignedtargetsisblankandtheother,modulated.The subjecthastoindicateinwhichtargetthegratingispresent. Whenthesubjectmakesamistake,thetestingofthatparticularspatialfrequencyisterminatedandthelastcorrectanswernoted.Thecontrast,expressedinMichelsoncontrast (equation 1),decreasesinstepsof0.15logunits.TheminimumcontrastforthischartcorrespondstoalogCSof2.3. Thistestwasperformedataviewingdistanceof2.5m.
ExperimentalDesigns
ExperimentalDesign1:MeasurementswithNatural Pupil Inthisexperiment,subjectswereaskedtoperform 2computerizedcontrastsensitivitytestsand5charttests monocularlywiththedominanteye.Theorderofthetests wasrandomized.Contrastsensitivitytestswereperformed attheoptimumrefractivestatefortheirviewingdistanceundermesopicconditions(3candelas[cd]/m2)andphotopic conditions(85or160cd/m2)withoutiridoplegiaorcycloplegia.Themesopicconditionwasachievedbyplacinganeutral densityfilterinfrontoftheeye.Forthephotopiccondition, theGECKO,VectorVision,VSG,andHACSSwereperformedatameanluminanceof85cd/m2 andthePelli-Robsonandlow-contrastETDRSataluminanceof160cd/m2 of thewhitebackground.Theluminanceofthetargetsandthe backgroundwasmeasuredwithaMinoltaCS-100Achroma meter(MinoltaCameraCo.Ltd.).Adigitalphotooftheeye, witharulerbeneaththeeye,wastakenwithbothluminance conditionstomeasuretheapparentpupilsize(approximately12%largerthanthephysicalpupilsize29 asusedin theWASCAsoftware).Sphericalaberrationwasmeasured andcalculatedfortheindividuallymeasuredphotopicand mesopicphysicalpupilsizesusingtheWASCAsoftware. Unlessotherwisestated,allpupilsizesreportedhererefer totheapparentpupilsize.
ExperimentalDesign2:MeasurementswithArtificial Pupil Inthisexperiment,subjectswereaskedtoperform the2computerizedtests,theVSGandtheHACSSat3cpd and6cpd,andthePelli-Robsontestmonocularlywiththe dominanteye.Theremainingtestswerediscardedbecause oftheresultsinexperimentaldesign1(seeResults).Theorderofthetestswasrandomized.Cycloplegiaandiridoplegia inthetestedeyewereobtainedwith2dropsofcyclopentolate1%.After30minutes,thepupilsizewasmeasuredand thesphericalaberrationandcontrastsensitivitymeasurementswerebegun.Contrastsensitivitytestswereperformed withoptimumrefractionfortheviewingdistanceunder photopicconditions(seeexperimentaldesign1).Measurementswereperformedwitha5.0mmartificialpupilinthe trialframeinfrontoftheeye.Thesphericalaberrationmeasurementswerenormalizedtothis5.0mmapparentpupil sizeandtothesizeofthemaximallydilatedpupil.
StatisticalAnalysis
Themainoutcomevariableforalltests,exceptthelowcontrastETDRS-likeoptotypecharts,wasthelogCSvalue. Thelow-contrastETDRS-likeoptotypechartresultswere
expressedinVAR.28 Statisticalanalyseswereperformedusingthecontrastsensitivityvaluesandsphericalaberration valuesofeachsubjectseparately.Thenonparametric Mann-Whitney U testforindependentsampleswasused tocalculatethedifferencebetweenthemeasuredcontrast sensitivityandsphericalaberrationvaluesobtainedfrom bothagegroups.ThenonparametricWilcoxonsignedrank testfordependentsampleswasusedtocalculatethedifferencebetweenthemeasuredcontrastsensitivityobtainedunderbothlightingconditions.Therelationshipbetweenthe contrastsensitivityvaluesandtheabsolutesphericalaberrationvalues(aimingatalinearrelationship)wascalculated withlinearregressionanalysis.Toconfirmanormaldistributionoftheresiduals,anonparametricKolmogorov-Smirnov Z testwasperformed.Themeansarepresentedwith theirstandarddeviation.A P valuelessthan0.05wasconsideredstatisticallysignificant.
RESULTS
Measurementswereobtainedfrom49healthysubjects in2agegroups.Themeanageinthe20to35year group(youngergroup;n Z 24)was25yearsandin the55to70yeargroup(oldergroup;n Z 25),60years.
All49subjectsparticipatedinexperimentaldesign 1.Inexperimentaldesign2,37subjectsagreedtoparticipate;17wereintheyoungergroup(meanage26 years)and20,intheoldergroup(meanage62years).
PupilSizeandSphericalAberration
ThemeanBCVAwas107VAR(range103to113 VAR; 0.1to 0.3logMAR;20/16to20/10Snellen) intheyoungergroupand107VAR(range100to113 VAR;0.0to 0.3logMAR;20/20to20/10Snellen)in theoldergroup.
Therewasastatisticallysignificantdifferencein meannaturalpupilsizebetweenthemesopicconditionandphotopicconditionintheyoungergroup (4.78 G 0.60mmand4.03 G 0.64mm,respectively; P Z .000)andtheoldergroup(3.89 G 0.53mmand 3.21 G 0.53mm,respectively; P Z .000).Thedifferencebetweentheyoungerandoldergroupswasstatisticallysignificantundermesopicconditionsand photopicconditions(both P Z .000).Therewasnodifferenceinmeansphericalaberrationwithanaturalpupilbetweentheyoungergroupandoldergroupunder mesopicconditions(0.016 G 0.072 mmand0.012 G 0.045 mm,respectively; P Z .650)orunderphotopic conditions(0.002 G 0.036 mmand 0.007 G 0.035 mm, respectively; P Z .749).However,whenspherical aberrationwasmeasuredwithanartificialpupil,the oldergrouphadstatisticallysignificantlygreater meansphericalaberration(0.054 G 0.050 mm)than theyoungergroup(0.024 G 0.043 mm(P Z .045). Figure2 showssphericalaberrationasafunctionofage measuredduringexperimentaldesign2aftercycloplegiaandiridoplegiawitha5.0mmpupil.
50 CONTRASTSENSITIVITYANDSPHERICALABERRATION JCATARACTREFRACTSURG- VOL35,JANUARY2009
Figure3 showstherelationshipbetweenspherical aberrationandpupilsizewiththenaturalpupilunder mesopicandphotopicconditionsandaftercycloplegia andiridoplegia.Asexpected,sphericalaberrationincreasedwithincreasedpupilsize.Sphericalaberration valuesshowedalargevariationforpupilslargerthan 5.0mm.
ContrastSensitivityMeasurements
TherewasaceilingeffectintheGECKO,the10.0% ETDRS-likeoptotypechart,andtheVectorVisiontest at3and6cpdbecausesomesubjectswereableto readthemostdifficulttargetsinthecharts(Table1). Incontrast,undermesopicconditions,aflooreffectappearedinthe2.5%ETDRS-likeoptotypechartbecause somesubjectswereunabletoperceiveanyoptotype (Table1).Therefore,theresultsobtainedusingthese testswerenotevaluatedfurther.
Table2 showsthemeancontrastsensitivityvalues measuredwithanaturalpupilattheoptimumrefractivestateoftheeyeintheremainingtestsundermesopicconditionsandphotopicconditions.Dueto technicalproblems,3subjectsinbothagegroupsdid notperformtheVSGtest.Undermesopicconditions, themeancontrastsensitivitywasstatisticallysignificantlylowerthanunderphotopicconditionsinboth agegroupsinalltestsshownin Table2 (P!.015).Furthermore,therewasastatisticallysignificantage-relateddeclineincontrastsensitivityforHACSS measurementsunderbothlightingconditions(P!.05).
Table3 showsthemeancontrastsensitivityvalues measuredwithanartificialpupilof5.0mm.Thedifferenceincontrastsensitivitybetweentheyoungergroup andoldergroupwasstatisticallysignificantforall testsexceptthePelli-Robson.

ContrastSensitivityVersusSphericalAberration
Figure4 showstherelationshipbetweencontrast sensitivityassessedaftercycloplegiaandiridoplegia witha5.0mmartificialpupilandtheabsolutevalue ofthecorrespondingsphericalaberration(n Z 37).

Asignificantslopeintheregressionlinewaspresent intheresultsobtainedwiththeHACSSat3cpd (P Z .03)andat6cpd(P Z .01)andwiththeVSGat 6cpd(P Z .01).Withanaturalpupil,therewasnosignificantrelationshipbetweencontrastsensitivityand sphericalaberrationforanytest.Thewavefrontdata usedinthenaturalpupilsituationwerebasedonthe actualpupilsizeofeachindividualsubject.When thesedatawerenormalizedtoa5.0mmpupilinall subjects,nostatisticallysignificantrelationshipswere foundexcepttheHACSSundermesopicconditions at3cpd(r 2 Z 0.12; P Z .033).
DISCUSSION
Inthisstudy,weassessedtherelationshipbetween contrastsensitivityandsphericalaberrationusing differentcontrastsensitivitytestswithartificialand naturalpupils.Theexperimentswereperformedinindividualswhowereemmetropicornearemmetropic andwhowereselectedfortheirsphericalaberration. Sphericalaberrationincreaseswithage.Witha5.0mm artificialpupil,asignificantrelationshipbetween
representthe mesopicconditionandthe opencircles,thephotopiccondition. B:Artificialpupil;the solidcircles represent sphericalaberrationmeasurements calculatedformaximumdilated pupilsandthe opencircles,spherical aberrationcalculationsforanapparent5.0mmpupil(SA Z sphericalaberration).
Figure2. Sphericalaberrationasafunctionofagemeasuredafter cycloplegiaandiridoplegiawitha5.0mmartificialpupil(SA Z sphericalaberration).
51 CONTRASTSENSITIVITYANDSPHERICALABERRATION JCATARACTREFRACTSURG- VOL35,JANUARY2009
Figure3. Sphericalaberrationas afunctionofpupilsize. A:Natural pupil;the solidcircles
cpd Z cyclesperdegree;ETDRS Z EarlyTreatmentDiabeticRetinopathyStudy;GECKO Z GroningenEdgeContrastChart
*Aceilingeffectmeansthetestistooeasy;allresponsesarecorrect.Aflooreffectmeansthetestistoodifficult;nocorrectresponseisassessedbythetest
contrastsensitivityandsphericalaberrationwasfound forcontrastsensitivitymeasurementsperformedwith theHACSSat3and6cpdandtheVSGat6cpd.Norelationshipwasfoundbetweencontrastsensitivityand sphericalaberrationwhencontrastsensitivitywas measuredwithanaturalpupilundermesopicorphotopicconditions.
Inthepresentstudy,onlyprimarysphericalaberration,representedbytheZerniketermZ(4,0),wasused. TheZ(4,0)termisreportedtobethemostimportant higher-orderaberrationterm;otherhigher-order terms,30,31 includingsecondarysphericalaberration Z(6,0),31 aremuchsmaller.WhenreplacingtheabsoluteZ(4,0)by O(Z(4,0)2 C Z(6,0)2)inourdata,the samerelationshipswerefound.Similarly,including comadidnotimprovetherelationshipbetweencontrastsensitivityandthetotalamountofaberration. Forthosereasons,weconfinedouranalysestoZ(4,0).
Thereareseveralpossibleexplanationsfortheabsenceofasignificantrelationshipinthenaturalpupil condition.Underthephotopiccondition,thepupils aresmallandthesphericalaberrationineyeswith asmallpupilisnearlyzero.Thissmallsphericalaberrationbarelyaffectsretinalimagequality,thusdecreasinganypossiblerelationshipbetweenspherical aberrationandcontrastsensitivity.Becauseanatural pupilwasused,thepupilsize,andthustheresulting retinalillumination,varied.Retinalilluminationhas astrongeffectontheshapeofthecontrastsensitivity function,32,33 especiallyatlowerretinalilluminations. Thus,thevariationintheretinalilluminationinthe testconditionsmightinfluencetheassessedcontrast sensitivity.Underphotopicconditions,theluminance ofthestimulusanditsdirectsurroundingswasbetween85cd/m2 and160cd/m2.Thepupildiameters ofthesubjectsvariedbetween2.0mmand6.7mm.
MeanLogCS G SD(Range)
cpd Z cyclesperdegree;HACSS Z Holladaycircularsine-modulatedpatterns;LogCS Z logcontrastsensitivity;VSG Z verticalsine-modulatedgratings
*Intheyoungergroup,n Z 21;intheoldergroup,n Z 22
†Intheyoungergroup,n Z 17;intheoldergroup,n Z 20
Mesopic Photopic Test Effect* Younger (n Z 24) Older (nZ25) Younger (n Z 24) Older (nZ25) 2.5%ETDRS-likeoptotypechart Floor 6 16 0 1 10.0%ETDRS-likeoptotypechart Ceiling 0173 GECKO Ceiling 11 4 16 11 VectorVision3cpd Ceiling 0155 VectorVision6cpd Ceiling 3193
Table1. Ceilingandflooreffectsincontrastsensitivitycharttests.
NumberofSubjects
Table2. MeanlogCSwithanaturalpupilmeasuredwithdifferentcontrastsensitivitytestsbyagegroup.
LightingandTest Younger(n Z 24) Older(n Z 25) P Value Mesopic HACSSat3cpd 1.90 G 0.17(1.70–2.40) 1.69 G 0.13(1.49–2.00) .00 HACSSat6cpd 1.80 G 0.16(1.60–2.40) 1.62 G 0.17(1.40–2.10) .00 VSGat3cpd* 2.14 G 0.20(1.77–2.51) 2.01 G 0.25(1.70–2.74) .04 VSGat6cpd† 1.68 G 0.24(1.08–2.06) 1.75 G 0.27(1.40–2.40) .67 Pelli-Robson 1.49 G 0.11(1.35–1.65) 1.39 G 0.12(1.20–1.55) .01 Photopic HACSSat3cpd 1.94 G 0.14(1.75–2.40) 1.81 G 0.13(1.50–2.00) .00 HACSSat6cpd 1.96 G 0.11(1.80–2.40) 1.87 G 0.12(1.60–2.10) .02 VSGat3cpd* 2.35 G 0.18(1.90–2.76) 2.42 G 0.27(1.72–3.03) .32 VSGat6cpd† 2.10 G 0.19(1.67–2.35) 2.20 G 0.27(1.72–2.72) .28 Pelli-Robson 1.66 G 0.06(1.50–1.75) 1.67 G 0.07(1.50–1.80) .85
52 CONTRASTSENSITIVITYANDSPHERICALABERRATION JCATARACTREFRACTSURG- VOL35,JANUARY2009
cpd Z cyclesperdegree;HACSS Z Holladaycircularsine-modulatedpatterns;LogCS Z logcontrastsensitivity;VSG Z verticalsine-modulatedgratings
Hence,theresultingretinalilluminationsrangedfrom 85 (2.0/2)2 p Z 267trolandsto160 (6.7/2)2 p
Z 5638trolands.Underthemesopiccondition,theluminanceofthecontrasttestswas3cd/m2 andthe measuredpupildiametervariedbetween3.0mm and7.0mm.Theresultingretinalilluminationsranged from3 (3/2)2 p Z 21trolandsto3 (7.1/2)2 p
Z 119trolands.VanNesetal.32 andVanNes33 found thatcontrastsensitivityincreasesmonotonicallyfrom 0.0009trolandsto90trolandsandstabilizesathigher retinalilluminance;thepeakofthecontrastsensitivity functionincreasedby0.2logunitsbetween9trolands and90trolands.Thisimpliesthattheinfluenceoncontrastsensitivityofthevariationinretinalillumination
Figure4. Logcontrastsensitivityas afunctionofabsolutesphericalaberrationmeasuredwithdifferent contrastsensitivitytestswitha5.0 mmartificialpupil. Solidcircles representtheyounggroup, opencircles theoldgroup. A:Pelli-Robson. B: Verticalsine-modulatedgratings at3cpd. C:Verticalsine-modulated gratingsat6cpd. D:Holladaycircularsine-modulatedpatternsat3 cpd. E:Holladaycircularsine-modulatedpatternsat6cpd(logCS Z logcontrastsensitivity;SA Z sphericalaberration).

MeanLogCS G SD(Range) Test Younger(nZ17) Older(nZ20) P Value HACSSat3cpd 1.76 G 0.19(1.45–2.10) 1.61 G 0.27(1.20–2.40) .02 HACSSat6cpd 1.93 G 0.13(1.70–2.15) 1.73 G 0.23(1.35–2.40) .00 VSGat3cpd 2.31 G 0.13(2.12–2.64) 2.18 G 0.26(1.69–2.74) .04 VSGat6cpd 2.23 G 0.15(1.89–2.49) 2.01 G 0.24(1.62–2.51) .00 Pelli-Robson 1.63 G 0.09(1.40–1.80) 1.58 G 0.11(1.30–1.80) .05
Table3. MeanlogCSwithanartificialpupilmeasuredunderphotopicconditionswithdifferentcontrastsensitivitytestsbyagegroup.
53 CONTRASTSENSITIVITYANDSPHERICALABERRATION JCATARACTREFRACTSURG- VOL35,JANUARY2009
canbeignoredunderphotopicconditionsbutnotundermesopicconditions.Undermesopicconditions, thebeneficialeffectofasmallpupiloncontrastsensitivitythroughloweringthesphericalaberrationis counteractedbytheadverseeffectofthelowerretinal illumination.Inaddition,thevariationinretinalilluminationundermesopicconditionsandtheresulting variationincontrastsensitivitymightaddtoomuch variationtoproduceastatisticallysignificanteffect ofsphericalaberrationoncontrastsensitivity.Thus, withanaturalpupil,thesmallsphericalaberration valueforsmallpupilscouldexplaintheabsenceof aclearrelationshipbetweensphericalaberrationand contrastsensitivityunderphotopicconditions.Thedependenceofcontrastsensitivityonretinalillumination couldexplainthisabsenceundermesopicconditions.
Byalsomeasuringcontrastsensitivitywithanartificialpupilinfrontofadilatedpupil,wewereableto combinealargerpupilsizeandthus,ingeneral,alarger sphericalaberrationwithahighandconstantretinal illumination.Thisconditioneliminatestheinfluence ofretinalilluminationoncontrastsensitivity,increasing theinfluenceofsphericalaberrationoncontrastsensitivityvariation.Inthisstudy,asignificantrelationship betweencontrastsensitivityandsphericalaberration wasmeasuredin2ofthe3contrastsensitivitytests.
Anotherphenomenonthatcouldreducetheinfluenceofsphericalaberrationoncontrastsensitivityis theStiles-Crawfordeffect,whichdescribesthedirectionalsensitivityoftheretinaasadifferenceinsensitivitybetweenlightthatenterstheeyethroughthe centerofthepupilasopposedtothroughtheperiphery. 34 Peripheralrays,whoserefractionisthemost influencedbysphericalaberration,arelesseffective instimulatingtheretinathanthecentralrays.The sphericalaberrationcausesawideneddistributionof peripherallightraysaroundtheidealimageofapoint sourceattheretina,butitsinfluenceontheperceived imageisdecreasedbytheStiles-Crawfordeffect. Sphericalaberration,measuredinthisstudyusing awavefrontanalyzer,isnotinfluencedbytheStilesCrawfordeffect.Olsen35 foundthattheStiles-Crawfordeffectreducedthedistancebetweentheeffective focusandparaxialfocusinpupilslargerthan4.0mm, therebyminimizingtheeffectofsphericalaberration, whichcouldexplainthemoderaterelationshipbetweencontrastsensitivityandsphericalaberrationin thepresentstudy.
Inthisstudy,bothagegroupswereplottedtogether in Figure4 toestablisharelationshipbetweencontrast sensitivityandsphericalaberration.Therefore,age-relatedchangesincontrastsensitivityduetocauses otherthanachangeinsphericalaberrationcouldbe aconfounderinthisanalysis.Bothopticalfactors36–39 andneuralchanges40–44 havebeenreportedto
contributetoage-relatedchangesincontrastsensitivity.Controversyexistsregardingtheprimarycause ofthislossinvisualperformance.Age-relatedmeasurementshavebeenperformedinyoung,middleaged,andoldersubjects.Nosignificantdifferencebetweentheyoungandthemiddle-agedgroupswas found;however,theoldersubjectshadsignificantly lowercontrastsensitivity.36,40,45–47 Severalstudies havecomparedthevisualperformanceofphakic eyesandpseudophakiceyes.Thevisualperformance ofsubjectswithasphericalIOLwascomparableto thatofage-relatedphakicsubjectsbutworsethan thatofyoungersubjects.48,49 Furthermore,implantationofanasphericalIOLresultedinahighervisual performancethanimplantationofasphericalIOL.1–11 Thesefindingssuggestthatthelensistheprimary causeoflossinvisualperformancewithage.Inthe presentstudy,wewereunabletodistinguishoptical fromneuralfactors.However,thisdoesnotexplain theabsenceofarelationshipbetweencontrastsensitivityandsphericalaberrationinourstudy.
Toconclude,inthisstudytheinfluenceofspherical aberrationoncontrastsensitivityinphakicsubjects withclearlensescouldonlybeestablishedwithcomputertestsandbyusingcycloplegiaandanartificial pupil.Chartcontrastsensitivitytestsarenotsuitable. Unfortunately,computertestsaredifficulttoperform inaclinicalsettingduetothelongtestingtimesand highcost.Therefore,contrastsensitivitytestingisnot aneasy-to-applytoolfortheassessmentofspherical aberrationandthechangesinit.
REFERENCES
1.BellucciR,ScialdoneA,BurattoL,MorselliS,ChieregoC, CriscuoliA,MorettiG,PiersP.VisualacuityandcontrastsensitivitycomparisonbetweenTecnisandAcrySofSA60ATintraocularlenses:amulticenterrandomizedstudy.JCataractRefract Surg2005;31:712–717;errata,1857
2.DenoyerA,LeLezM-L,MajzoubS,PisellaP-J.Qualityofvision aftercataractsurgeryafterTecnisZ9000intraocularlensimplantation:effectofcontrastsensitivityandwavefrontaberration improvementsonthequalityofdailyvision.JCataractRefract Surg2007;33:210–216
3.HolladayJT,PiersPA,KoranyiG,vanderMM,NorrbyNES.A newintraocularlensdesigntoreducesphericalaberrationof pseudophakiceyes.JRefractSurg2002;18:683–691
4.MesterU,DillingerP,AnteristN.Impactofamodifiedopticdesignonvisualfunction:clinicalcomparativestudy.JCataract RefractSurg2003;29:652–660
5.PackerM,FineIH,HoffmanRS,PiersPA.Prospectiverandomizedtrialofananteriorsurfacemodifiedprolateintraocularlens. JRefractSurg2002;18:692–696
6.PackerM,FineIH,HoffmanRS,PiersPA.Improvedfunctional visionwithamodifiedprolateintraocularlens.JCataractRefract Surg2004;30:986–992
7.PiersPA,FernandezEJ,ManzaneraS,NorrbyS,ArtalP.Adaptiveopticssimulationofintraocularlenseswithmodifiedsphericalaberration.InvestOphthalmolVisSci2004;45:4601–4610.
54 CONTRASTSENSITIVITYANDSPHERICALABERRATION JCATARACTREFRACTSURG- VOL35,JANUARY2009
Availableat: http://www.iovs.org/cgi/reprint/45/12/4601.Accessed October2,2008
8.KershnerRM.Retinalimagecontrastandfunctionalvisual performancewithaspheric,silicone,andacrylicintraocular lenses;prospectiveevaluation.JCataractRefractSurg2003; 29:1684–1694
9.TzelikisPF,AkaishiL,TrindadeFC,BoteonJE.OcularaberrationsandcontrastsensitivityaftercataractsurgerywithAcrySof IQintraocularlensimplantation;clinicalcomparativestudy. JCataractRefractSurg2007;33:1918–1924
10.SandovalHP,FernandezdeCastroLE,VromanDT,Solomon KD.Comparisonofvisualoutcomes,photopiccontrastsensitivity,wavefrontanalysis,andpatientsatisfactionfollowingcataractextractionandIOLimplantation:asphericvsspherical acryliclenses.Eye2007,E-pubaheadofprint
11.BellucciR,MorselliS.Optimizinghigher-orderaberrationswith intraocularlenstechnology.CurrOpinOphthalmol2007; 18:67–73
12.LiangJ,GrimmB,GoelzS,BilleJF.Objectivemeasurement ofwaveaberrationsofthehumaneyewiththeuseofaHartmann-Shackwave-frontsensor.JOptSocAmA1994; 11:1949–1957
13.CervinoA,HoskingSL,Montes-Mico R.Comparisonofhigher orderaberrationsmeasuredbyNIDEKOPD-scandynamic skiascopyandZeissWASCAHartmann-Shackaberrometers. JRefractSurg2008;24(8):790–796
14.PelliDG,RobsonJG,WilkinsAJ.Thedesignofanewletterchart formeasuringcontrastsensitivity.ClinVisSci1987/88;2:187–199
15.ArditiA.Improvingthedesignofthelettercontrastsensitivity test.InvestOphthalmolVisSci2005;46:2225–2229.Available at: http://www.iovs.org/cgi/reprint/46/6/2225.AccessedOctober 2,2008
16.BrownB,Lovie-KitchinJE.Highandlowcontrastacuityandclinicalcontrastsensitivitytestedinanormalpopulation.OptomVis Sci1989;66:467–473
17.CampbellFW,RobsonJG.ApplicationofFourieranalysistothe visibilityofgratings.JPhysiol1968;197:551–566.Availableat: http://jp.physoc.org/cgi/reprint/197/3/551.AccessedOctober4, 2008
18.PomeranceGN,EvansDW.Test-retestreliabilityoftheCSV1000contrasttestanditsrelationshiptoglaucomatherapy. InvestOphthalmolVisSci1994;35:3357–3361.Availableat: http://www.iovs.org/cgi/reprint/35/9/3357.AccessedOctober3, 2008
19.KasperT,BuhrenJ,KohnenT.Visualperformanceofaspherical andsphericalintraocularlenses:intraindividualcomparisonof visualacuity,contrastsensitivity,andhigher-orderaberrations. JCataractRefractSurg2006;32:2022–2029
20.MunozG,Albarran-DiegoC,Montes-Mico R,RodrıguezGalieteroA,Alio ´ JL.Sphericalaberrationandcontrastsensitivity aftercataractsurgerywiththeTecnisZ9000intraocularlens. JCataractRefractSurg2006;32:1320–1327
21.JohanssonB,SundelinS,Wikberg-MatssonA,UnsboP, BehndigA.VisualandopticalperformanceoftheAkreosAdapt AdvancedOpticsandTecnisZ9000intraocularlenses;Swedishmulticenterstudy.JCataractRefractSurg2007;33: 1565–1572
22.KurzS,KrummenauerF,ThiemeH,DickHB.Contrastsensitivityafterimplantationofasphericalversusanasphericalintraocularlensinbiaxialmicroincisioncataractsurgery.JCataract RefractSurg2007;33:393–400
23.ThibosLN,ApplegateRA,SchwiegerlingJT,WebbR.Standardsforreportingtheopticalaberrationsofeyes;VSIA StandardsTaskforceMembers.JRefractSurg2002; 18:S652–S660
24.NioYK,JansoniusNM,LamersP,MagerA,ZeinstraJ, KooijmanAC.Influenceoftherateofcontrastchangeonthequalityofcontrastsensitivityassessment:acomparisonofthreepsychophysicalmethods.OphthalmicPhysiolOpt2005;25:18–26
25.MaaranenT,MantyjarviM.Contrastsensitivityinpatientsrecoveredfromcentralserouschorioretinopathy.IntOphthalmol 1999;23:31–35
26.ElliottDB,BullimoreMA,BaileyIL.Improvingthereliability ofthePelli-Robsoncontrastsensitivitytest.ClinVisSci 1991;6:471–475
27.BaileyIL,LovieJE.Newdesignprinciplesforvisualacuityletter charts.AmJOptomPhysiolOpt1976;53:740–745
28.ColenbranderMC.Visualacuity,visualfieldandphysicalability. Ophthalmologica1975;171:100–108
29.KooijmanAC.Lightdistributionontheretinaofawide-angletheoreticaleye.JOptSocAm1983;73:1544–1550
30.PorterJ,GuiraoA,CoxIG,WilliamsDR.Monochromaticaberrationsofthehumaneyeinalargepopulation.JOptSocAm AOptImageSciVis2001;18:1793–1803
31.SalmonTO,vandePolC.Normal-eyeZernikecoefficientsand root-mean-squarewavefronterrors.JRefractSurg2006; 32:2064–2074
32. van Nes FL,KoenderinkJJ,NasH,BoumanMA.Spatiotemporalmodulationtransferinthehumaneye.JOptSocAm1967; 57:1082–1088
33.vanNesFL.Experimentalstudiesinspatiotemporalcontrast transferbythehumaneye.DoctoralThesis,Universityof Utrecht,Utrecht,TheNetherlands,1968
34.StilesWS,CrawfordBH.Theluminousefficiencyofraysenteringthepupilatdifferentpoints.ProcRSocB1933; 112:428–450
35.OlsenT.OntheStiles-Crawfordeffectandocularimagery.Acta Ophthalmol(Copenh)1993;71:85–88
36.NioYK,JansoniusNM,FidlerV,GeraghtyE,NorrbyS, KooijmanAC.Age-relatedchangesofdefocus-specificcontrast sensitivityinhealthysubjects.OphthalmicPhysiolOpt2000; 20:323–334
37.HemengerRP.Intraocularlightscatterinnormalvisionlosswith age.ApplOpt1984;23:1972–1974
38.LiangJ,WilliamsDR,MillerDT.Supernormalvisionandhighresolutionretinalimagingthroughadaptiveoptics.JOptSoc AmA1997;14:2884–2892
39.SturrJF,ChurchKL,TaubHA.Temporalsummationfunctions fordetectionofsine-wavegratingsinyoungandolderadults. VisionRes1988;28:1247–1253
40.MorrisonJD,McGrathC.Assessmentoftheopticalcontributionstotheage-relateddeteriorationinvision.QJExpPhysiol 1985;70:249–269.Availableat: http://ep.physoc.org/cgi/reprint/70/2/249.AccessedOctober4,2008
41.ElliottDB.Contrastsensitivitydeclinewithageing:aneuralor opticalphenomenon?OphthalmicPhysiolOpt1987;7:415–419
42.JayJL,MammoRB,AllanD.Effectofageonvisualacuityafter cataractextraction.BrJOphthalmol1987;71:112–115.Availableat: http://www.pubmedcentral.nih.gov/picrender.fcgi? artid=1041100&;blobtype=pdf.AccessedOctober4,2008
43.OwsleyC,GardnerT,SekulerR,LiebermanH.Roleofthe crystallinelensinthespatialvisionlossoftheelderly.InvestOphthalmolVisSci1985;26:1165–1170.Availableat: http://www. iovs.org/cgi/reprint/26/8/1165.AccessedOctober4,2008
44.WealeRA.Senilechangesinvisualacuity.TransOphthalmol SocUK1975;95:36–38
45.McGrathC,MorrisonJD.Theeffectsofageonspatialfrequency perceptioninhumansubjects.QJExpPhysiol1981;66:253–261. Availableat: http://ep.physoc.org/cgi/reprint/66/3/253.Accessed October4,2008
55 CONTRASTSENSITIVITYANDSPHERICALABERRATION JCATARACTREFRACTSURG- VOL35,JANUARY2009
46.DerefeldtG,LennerstrandG,LundhB.Agevariationsinnormal humancontrastsensitivity.ActaOphthalmol(Copenh)1979; 57:679–690
47.RossJE,ClarkeDD,BronAJ.Effectofageoncontrastsensitivityfunction:uniocularandbinocularfindings.BrJOphthalmol 1985;69:51–56.Availableat: http://www.pubmedcentral.nih. gov/picrender.fcgi?artidZ1040522&;blobtypeZpdf.Accessed October4,2008
48.GuiraoA,RedondoM,GeraghtyE,PiersP,NorrbyS,ArtalP. Cornealopticalaberrationsandretinalimagequalityinpatients inwhommonofocalintraocularlenseswereimplanted.Arch Ophthalmol2002;120:1143–1151
49.NavarroR,FerroM,ArtalP,MirandaI.Modulationtransferfunctionsofeyesimplantedwithintraocularlenses.ApplOpt1993; 32:6359–6367
56 CONTRASTSENSITIVITYANDSPHERICALABERRATION JCATARACTREFRACTSURG- VOL35,JANUARY2009
ValidationofanAutomatedEarlyTreatmentDiabeticRetinopathy StudyLow-contrastLetterAcuityTest

YiPang,OD,PhD,1*LaurenSparschu,OD,1 ElyseNylin,BA,1 andJingyunWang,PhD2
SIGNIFICANCE: Automatedlow-contrastletteracuity(LCLA)hasseveraladvantages:consistentluminance,reduced chanceofindividualsmemorizingtestletters,andconvenientandaccuratevisualacuityreportingfunctions.Although automatedLCLAmightreportslightlyworseacuitythanSloanLCLAchart,consideringitsadvantages,itmaybeaviable alternativetoSloanLCLAchartinclinicalpracticeandresearch.
PURPOSE: ThepurposeofthisstudywastodeterminetherepeatabilityofanautomatedLCLAmeasurementand itsagreementwiththeSloanLCLAcharttestinnormalparticipantsandreduced-visionparticipants.
METHODS: Adultparticipants(n=49)weremeasuredwithbothautomatedEarlyTreatmentDiabeticRetinopathy StudyandSloanLCLAtests,includingnormalandreduced-visiongroups.Low-contrastletteracuityattwocontrast levels(2.5and10%)wasmeasuredat3minarandomsequencewithbothLCLAtests.Totestrepeatability, participantswereretested1weeklater.Repeatabilityofthetwotestsbetweentwovisitsandagreementbetween automatedandSloanLCLAtestswereevaluatedusing95%limitsofagreement.
RESULTS: Intermsofthe95%limitsofagreement,therepeatabilityofbothtestswasasfollows:automatedLCLA at2.5%,±0.26;automatedLCLAat10%,±0.22;SloanLCLAat2.5%,±0.23,andSloanLCLAat10%,±0.16. Theagreementofthetwotestswasasfollows:±0.19at2.5%and±0.24at10%.TheautomatedLCLAat2.5and 10%levelswasgenerallyreportedone-halftoonelogMARlinelowerthanSloanLCLA(meandifferences, 0.04at 2.5%and 0.13at10%;paired t test, P <.05).
CONCLUSIONS: TheautomatedLCLAtestshowsfairlygoodtest-retestrepeatabilityatboth2.5and10%contrast levels.TheagreementbetweentheautomatedandtheSloanlow-contrastletteracuitytestswascomparablewith test-retestagreement.AlthoughtheautomatedLCLAtestreportsslightlyworseacuitythantheSloanLCLAtest,it couldbeanappropriatealternativetotheSloanLCLAtest.
OptomVisSci2020;97:370–376.doi:10.1097/OPX.0000000000001506
Copyright©2020AmericanAcademyofOptometry
Low-contrastletteracuity,asavisualfunctiontest,hasbeen identifiedasanimportantcomponentintheprofileofmanytypes ofpatients.1–4 Forinstance,low-contrastletteracuityiswidely usedasabenchmarkofvisualdysfunctionforpatientswithmultiplesclerosis.1 Accordingtoanincreasingbodyofevidence,in thesepatients,low-contrastletteracuityisaphysiologicallymeaningfultestbecausedecreasedlow-contrastletteracuityscoreshave beencorrelatedwithretinalthinninginopticalcoherencetomographyimaging,theMRIlesionvolume,andreducedresponsesin multifocalelectroretinography.1 Furthermore,low-contrastletter acuityismoresensitivetosomediseasesthanishigh-contrastvisual acuity.5 Reducedlow-contrastletteracuityandvision-specificqualityoflifeareevidentmanyyearsafteracuteopticneuritis,evenwhen high-contrastvisualacuityhasrecovered.5 TheSloanlow-contrast letteracuitycharttest(PrecisionVision,LaSalle,IL)isthecriterion standardtomeasurelow-contrastletteracuity,whichhasexcellent interraterreliability,withhighintraclasscorrelationacrossall contrastlevels.6
Withrecentadvancesintechnology,computerizedtestshave beenusedtomeasurevisualfunction.Iftestdistance,luminance, andcontrastofthetestscreenarecarefullycalibratedandexternal glareislimited,computerizedequipmentcangeneratesimilar resultscomparedwithcriterion-standardcharts.Severalcommercially
AuthorAffiliations: 1IllinoisCollegeofOptometry, Chicago,Illinois
2SalusUniversityPennsylvaniaCollege ofOptometry,ElkinsPark,Pennsylvania *ypang@ico.edu
availablecomputer-basedcontrastsensitivitytestshavebecomeavailable.TheFreiburgVisualAcuityandContrastTestiswidelyused.7 Kollbaumetal.8 validatedaniPadtestoflettercontrastsensitivity; however,thistestdidnotdecreaselettersizetomeasurelowcontrastletteracuity.Unfortunately,therehavebeenfewstudiesto validaterepeatabilityofcomputerized low-contrastletteracuitytests. Implementationofalow-contrastletteracuitytestonanelectronic platformhasseveraladvantages:(1)specificcontrastlevels,(2)randomizationoftargetpresentation,and(3)automaticscoringforprinting,whichfacilitatesdocumentationandcommunication,thereby savingpreciousclinictime.
Thecommerciallyavailableautomatedlow-contrastletteracuitytest(M&STechnologies,Inc.,Niles,IL)isoneofthenewcomputerizedtests.Toovercomethecommonissueofvariablemonitor screenbrightnessincomputerizedtests,thisautomatedtestincludesself-calibrationofluminance.Systemcalibrationofthisautomatedtestissetinmetersatvirtuallyanydistanceandis adjustableandprecisetowithin1cm.Thesystemiscalibrated forbothdistance-to-participantandpixelsperinchsothat optotypespreciselyfollowANSIZ80.21-2010(R2015)andSO 8596:2009regardingsize,spacingbetweenoptotypes,andspacingbetweenlines.Backgroundluminanceisaccuratelycalibrated to85cd/m2 forstandardizedANSIandISOtesting(M&S
Downloaded from http://journals.lww.com/optvissci by b6PmUnxvNXlbyx1T4UvwFJNShiZv5OkFRmehhbzKY0cwQyHhAddCUtlkz7+5iv3434JxBrfzYIFoR7GWpJpoKHnFVe7TTlOv on 05/18/2020
ORIGINALINVESTIGATION www.optvissci.com OptomVisSci2020;Vol97(5) 370 Copyright © American Academy of Optometry. Unauthorized reproduction of this article is prohibited.
Technologies,http://www.mstech -eyes.com/products/detail/ automated-etdrs-defocus-curve).Lettercontrastsystemluminance canbeautomaticallycalibratedandambientroomconditionsmeasuredwiththeoptionalintegratedluminancemeter.
Sloanlow-contrastletteracuitychartshaveastandardizedformat basedontheEarlyTreatmentDiabeticRetinopathyStudyvisual acuitycharts,whichisoftenthestandardusedinclinicaltrials;thus, itwaschosenasthecriterion-standardlow-contrastletteracuitytest forcomparison.Thepurposeofthisstudywastodeterminethe repeatabilityofanEarlyTreatmentDiabeticRetinopathyStudy–automatedlow-contrastletteracuitytestonatablet-computersystem anditsagreementwiththecriterion-standardchart-basedtest,forinstance,Sloanlow-contrastletteracuitychart,innormallysightedparticipantsandreduced-visionparticipants.
METHODS
Thisresearchprotocolandtheinformedconsentformwere approvedbytheinstitutionalreviewboardofIllinoisCollegeofOptometry,Chicago,IL.
Participants
WeenrolledadultparticipantsfromthegreaterChicagoarea. Demographiccharacteristicsoftheparticipantsareshownin Table1.Informedconsentwasobtainedfromallparticipants. Best-correctedvisualacuitywasrangedfrom20/25to20/100 eacheyeintheparticipants.
Low-contrastLetterAcuityTests
Tovalidatethecommerciallyavailableautomatedlow-contrast letteracuitytest,weusedtheSloanlow-contrastletteracuitychart (low-contrastSloanletterchart;PrecisionVision)asthecriterion standard.Because10%contrastisconsideredtheleveltobeused asadaptationand2.5%ismoresensitivetovisualdeficits,we
chosethesetwocontrastlevelsforrepeatabilitytests.Acontrast of100%isthelevelofhigh-contrastvisualacuity.
AutomatedLow-contrastLetterAcuityTest
Thesystemincludesalaptopcomputerwithahigh-resolution 13-inchdisplayandawirelesscontroltabletfortheexaminer (Fig.1)Weusedthebuilt-inautomatedcontrastsensitivityfunctionsystem.Fixedcontrastwithdecreasingsizesystemwasused toestimatelow-contrastletteracuityat2.5and10%contrast levels.Thetestincluded10Sloanletters.Thecomputerscreen wasautocalibratedtotheluminancelevelof85cd/m2 withaphotometerforalltests.Todeterminetheendpointofautomatedlowcontrastletteracuity,twophaseswereused.(1)PhaseI:todetermineinitialthreshold,anEarlyTreatmentDiabeticRetinopathy Studychart(from20/200to20/10)ateither10or2.5%contrast levelwasdisplayedonthecomputerscreen,andparticipantswere instructedtoreadthesmallestlineinwhichtheycouldreadallfive letters.Theexaminersubmittedthelowestvisualacuitylevelat whichparticipantsreadallletterscorrectly.(2)PhaseII:todeterminethreshold,theEarlyTreatmentDiabeticRetinopathyStudy lettersatthevisualacuitylevelthatexaminersubmittedwere displayedonthecomputerscreen,aswellastheremainingsmaller lettersofthechart;inthisphase,participantsweretestedwitha changeof0.1logMARacuityandaterminationruleoffivemistakes.Thepurposeofthisprocedurewastoensurearelativelyefficient(thus,participantswerelessfatigued)andatthesametimea moreaccurateresult.
Abluedot(Fig.1B)wasshownnexttothevisualacuitylevelone linebelowthesubmittedvisualacuitysize,andparticipantswere instructedtoreadthelinenexttothebluedot.Theexaminersubmittedthecorrectnumberoflettersparticipantsreadandthen continuedtoinstructparticipantstoreadletterswithdecreasing size,in0.1logMARsteps.Theteststoppedwhentheparticipants wereunabletoreadanyletterscorrectlyorwhennosmallerlines wereavailabletobetested.Thesystemautomaticallycalculated thelogMARvisualacuityusingthecorrectlettersthatparticipants read.Theendpointoffivetotalmistakeshasbeenusedinprevious studieswithvisualacuityoutcomes.9–11
Aftercompletionofthemeasurement,thetestoutcomeswere displayedonthecomputerwiththefollowingparameters:which eye,testdistance,visualacuityletterscore,logMARvisualacuity, andSnellenvisualacuityequivalent.
SloanLow-contrastLetterAcuityCharts
Thechartsmeasure14 14inchesandweremountedona retroilluminatedcabinet.Sloanlow-contrastletteracuitycharts werestandardizedaccordingtotheEarlyTreatmentDiabetic RetinopathyStudyvisualacuitychartswithfivelettersperline. Sloanlow-contrastletteracuitypercontrastlevelisgivenas numberoflettersidentifiedcorrectly(maximumof60letters).
Procedures
Alltestswereadministeredmonocularlyandat3minthesame roomwithhabitualrefractivecorrection.Twocontrastlevels(2.5 and10%)ofoneeyefromeachparticipantweremeasuredinarandomsequencewiththetwolow-contrastletteracuitytests.Arandom numbergeneratorinExcelwasutilizedtoprovidetherandomtestsequenceoftheautomatedandSloanmeasurements.Twenty-four participantsweremeasuredwiththeautomatedtestsfirstandthen theSloantests.Theremaining25participantsweremeasuredwith theSloantestsfollowedbytheautomatedtests.Thesamerandom
No.participants(%) Visualacuity 20/25orbetter 32(65.3) 20/30to20/100 17(34.7) Sex Female 41(83.7) Male 8(16.3) Race Black 20(40.8) Hispanic 8(16.3) White 16(32.7) Asian 5(10.2) Age(y) Range 22.6–91.1 Mean(SD) 46.7(17.5) SD=standarddeviation. AutomatedLow-contrastLetterAcuityTest Pangetal. www.optvissci.com OptomVisSci2020;Vol97(5) 371 Copyright © American Academy of Optometry. Unauthorized reproduction of this article is prohibited.
TABLE1. Demographiccharacteristicsoftheparticipants(n=49)
sequenceforeachparticipantwasusedforbothtest-retestmeasurements.After1week(±3days),allparticipantswereretestedwiththe sameprocedure,withtheexceptionoffourparticipantswhodid notreturn.
PowerCalculation
Priordataindicatethatthedifferenceintheresponseof matchedpairsisnormallydistributedwithastandarddeviationof 0.2.Wewereplanningastudywith35participants.Ifthetruedifferenceinthemeanresponseofmatchedpairswas0.1,wewould beabletorejectthenullhypothesisthatthisresponsedifference waszerowithapowerof0.82.TypeIerrorprobabilityassociated withthistestwas.05.Wecollecteddatafromatotalof49
participantsforcomparisonoftheautomatedandSloantests;for repeatability,wecollecteddatafrom45participants.
StatisticalAnalysis
Therepeatabilitybetweentwoadministrationsoftheautomated andSloanlow-contrastletteracuitytests,aswellasagreementbetweenthetwolow-contrastletteracuitytestsinbothgroups,was evaluatedusingthe95%limitsofagreement,whichcorresponds to±1.96standarddeviationofthedifferencesbetweenadministrationsortests.Thedifferencebetweenthescoresforeachadministrationortestwascalculatedforeachparticipant.Thedistribution ofthesedifferenceswasanalyzedbycalculatingthemean,standarddeviation,andthe95%limitsofagreement.Thebreadthof theselimitsofagreementindicatestherepeatabilityofthetest.
Themeandifferenceand95%LoAarealsoshown.Paired t testwasusedtocomparetwoadministrationsofeachtest.LCLA=low-contrastletteracuity; LoA=limitofagreement;SD=standarddeviation.
 FIGURE1. AutomatedETDRSlow-contrastletteracuitymeasurementviewedbytheparticipants(phaseI[A],phaseII[B]withabluedot)andtheexaminer (phaseI[C],phaseII[D]).ETDRS=EarlyTreatmentDiabeticRetinopathyStudy.
Repeatability:allparticipantsinbothgroups 2.5%Contrastlevel(n=35) 10%Contrastlevel(n=45) TestRetest Mean difference t Testand P value 95% LoATestRetest Mean difference t Testand P value 95% LoA Automated0.74(0.19)0.74(0.20) 0.002(0.13) t = 0.10; P =.92±0.260.51(0.34)0.49(0.35)0.02(0.11) t =1.23; P =.22±0.22 Sloan0.69(0.15)0.65(0.14)0.04(0.12) t =2.27; P =.03±0.230.38(0.30)0.38(0.30)0.01(0.08) t =0.64; P =.52±0.16
TABLE2. Mean(±SD)scoresforthefirstandsecondadministrationofeachLCLAtestinallparticipants
AutomatedLow-contrastLetterAcuityTest Pangetal. www.optvissci.com OptomVisSci2020;Vol97(5) 372 Copyright © American Academy of Optometry. Unauthorized reproduction of this article is prohibited.
Thenarrowerthelimitsofagreement,themorerepeatablethe test.12 Apaired t testwasusedtocomparetestandretestinboth groupsatboth2.5and10%contrastlevels.Bonferronicorrection wasappliedbecauselow-contrastletteracuitywastestedattwo contrastlevels;thus, P <.03indicatesstatisticalsignificance.
RESULTS
Forty-nineparticipantsacrossarangeofacuitiesweretested. Forretest,fourparticipantsdidnotreturn.Table1showsthebasic characteristicsoftheseparticipants.Notethat10participantswith poorhigh-contrastvisualacuitywerenotabletoidentify2.5%contrastforbothtests.
Table2showsresultsfromallparticipants.Intermsofthe95% limitsofagreement,therepeatabilityofbothtestswasasfollows: automatedlow-contrastletteracuityat2.5%,±0.26;automated low-contrastletteracuityat10%,±0.22;Sloanlow-contrastletter acuityat2.5%,±0.23;andSloanlow-contrastletteracuityat 10%,±0.16.
1.Repeatabilityofautomatedlow-contrastletteracuitytest (Figs.2A,B):atboth2.5and10%contrastlevels,the automatedlow-contrastletteracuityoftheretestwasnot statisticallydifferentfromthatofthefirstadministration (Table2).
2.RepeatabilityoftheSloanlow-contrastletteracuitytest (Figs.2C,D):atboth2.5and10%contrastlevels,the
FIGURE2. RepeatabilityoftheSloanlow-contrastletteracuity(Sloan-LCLA)testandtheautomatedlow-contrastletteracuity(automated-LCLA)testis showninBland-Altmanplotsat2.5and10%contrastlevels.TheLCLAdifferencebetweenthesecondandthefirstadministrations(secondminusfirst) ofeachtestisplottedagainstthemeanoftwotests.(A)Automated-LCLAat 2.5%.(B)Automated-LCLAat10%.(C)Sloan-LCLAat2.5%.(D)Sloan-LCLA at10%.Fromthetoptothemiddleandthebottom,threelinesshowtheupper95%LoA,bias,andthelower95%LoA,respectively.
www.optvissci.com OptomVisSci2020;Vol97(5) 373 Copyright © American Academy of Optometry. Unauthorized reproduction of this article is prohibited.
AutomatedLow-contrastLetterAcuityTest Pangetal.
Sloanlow-contrastletteracuityoftheretestwasnot statisticallydifferentfromthatofthefirstadministration (Table2).
3.AgreementoftheautomatedandSloanlow-contrastletter acuitytests:agreementbetweentheautomatedlow-contrast letteracuityandSloanlow-contrastletteracuityat2.5and 10%levelsisshowninFigs.3AandB.
Themean(±standarddeviation)differencesbetweentheautomatedandSloanlow-contrastletteracuityat2.5and10%contrast levelswere 0.04(±0.10)logMARand 0.13(±0.12),respectively,withstatisticalsignificanceinallparticipants(paired t test, t = 2.19, P= .005; t = 7.06, P <.001).Intermsofthe95% limitsofagreement,theagreementsbetweentwolow-contrastletteracuitytestswere±0.19at2.5%contrastleveland±0.24at 10%contrastlevel(Table3).
Specifically,Fig.3showsthatmoredatawerebelowzeroat bothcontrastlevels,whichindicatesthattheautomatedlowcontrastletteracuityreportedone-halftoonelogMARlinehigher values(worseacuity)thantheSloanlow-contrastletteracuity.
DISCUSSION
Theautomatedlow-contrastletteracuitytestshowedfairlygood test-retestrepeatabilityinadultparticipantsacrosstherangeof acuitiesatboth2.5and10%contrastlevels.Inaddition,the agreementbetweentheautomatedandtheSloanlow-contrastletteracuitytestswassimilartotest-retestagreement.
Accordingtothe95%limitsofagreementrangeofrepeatability, therewasoneoutlierdatapointonboththeSloanandautomated testsat2.5%level,anditwasfroma42-year-oldparticipantwith ahigh-contrastvisualacuityof20/15;thelargedifferencebetween
testandretestforthisparticipantmaybeduetohislackofengagementwithcontrasttestsatthesecondvisit.TheSloanlow-contrast visualacuityscoreoftheretestwasslightlybutsignificantlybetter thanthefirsttest,whichmightrepresentapotentiallearningeffect andimprovedfamiliaritywiththeSloanlow-contrastletteracuity chart,butnotwiththeautomatedlow-contrastletteracuitysystem.
Accordingtothe95%limitsofagreement,theagreementbetweenautomatedandSloanlow-contrastletteracuitychartswas comparablewiththetest-retestrepeatabilityoftheautomated andSloanlow-contrastletteracuitycharts,whichindicatesthat theagreementbetweenautomatedandSloanlow-contrastletter acuitychartswasasgoodascouldbeexpectedbasedontestretestrepeatability.Therewasoneoutlier;thisparticipanthad 20/100+high-contrastvisualacuity.Previousstudieshavereportedthatvisiontestsinreduced-visionparticipantsarelikelyto belessrepeatablethaninindividualswithnormalvision.8,13,14
ComparedwiththeSloantest,theautomatedlow-contrastletter acuitytestinthisstudyoftenreportedworseacuityatboth2.5 and10%contrastlevels.Onefactorcouldbetheluminanceof thetest.Theautomatedlow-contrastletteracuitywasalwayscalibratedat85cd/m2.Ontheotherhand,thebuilt-inluminanceof theSloantestwasoftenhigherthan85cd/m2;wefoundthatitaveraged108to128cd/m2.Unfortunately,wewerenotabletoadjusttheluminanceoftheSloantestbecauseofthebuilt-in system.Itisunclearwhythebuilt-inluminanceoftheSloantest haslargervariance.OurfindingsareoppositetothecontrastsensitivitytestresultsofKollbaumetal.8 Intheirstudy,bothiPadand Freiburgcomputerizedtestsyieldedbettercontrastsensitivity functionthandidthePelli-Robsontest.8 Thedifferencemaybe duetothenatureoflow-contrastletteracuitytests,withdifferent studyconditionsanddifferenttests.
Comparinglow-contrastletteracuitywithordinarylow-contrast charttesting,limitsofagreementinourstudyweresimilartothose
acuity(automated-LCLA)at2.5%(A)and10%(B)levels.Thedifferencebetweentheaveragescores(i.e.,Sloan-LCLAminusautomated-LCLA)forthe twotestsisplottedagainstthemeanoftwotests.Fromthetoptothemiddleandthebottom,threelinesshowtheupper95%LoA,themeandifference, andthelower95%LoA,respectively.
AutomatedLow-contrastLetterAcuityTest Pangetal. www.optvissci.com OptomVisSci2020;Vol97(5) 374 Copyright © American Academy of Optometry. Unauthorized reproduction of this article is prohibited.
FIGURE3. Bland-AltmanplotstodemonstrateagreementbetweenSloanlow-contrastletteracuity(Sloan-LCLA)andtheautomatedlow-contrastletter
TABLE3. Mean(±SD)scoresforthetwokindsofLCLAtestsinallparticipants
Agreementbetweentwotestsintheallparticipants 2.5%Contrastlevel(n=39)
inpreviousstudies.Kollbaumetal.8 investigated20normal-vision and20low-visionparticipants;theirlimitsofagreementinnormalvisionparticipantswere±0.19,±0.19,and±0.15foriPad,PelliRobson,andFreiburg,respectively.Theyreportedlimitsofagreement forlow-visionparticipantsas±0.24,±0.23,and±0.21,respectively, forthethreetests.8 Doughertyetal.15 studied37participantsandreportedthatlimitsofagreementwere±0.20fortheMarstestand ±0.20forthePelli-Robsontest.Balceretal.6 measuredtheSloanletteracuityatcontrastlevelsof100,5,1.25,and0.6%onindividuals withnormalvisualacuityaswellasindividualswithmultiplesclerosis. TheyreportedtheinterrateragreementICCbetween0.86and0.95at eachcontrastlevel;however,theydidnotstudylimitsofagreement.6
Wehavepreviouslyreportedthatindividualswithamblyopiaassociatedwithmyopicanisometropiahadclinicallyandstatistically significantlyreducedcontrastsensitivityatthemiddleandhigher spatialfrequencies.16 Althoughacontrastsensitivityfunctiontest canthoroughlymeasureindividuals'contrastsensitivity,thelength oftheprocedureposesanobstaclefor applicationinroutineclinical care.Meanwhile,low-contrastacuitynotonlydetectsvisionloss, whichcouldbemissedbyhigh-contrastvisualacuitymeasurement, butalsomeasurescontrastsensitivitybecausethedecreaseinletter sizeincorporatestestingofdifferentspatialfrequencies.Inaddition, theautomatedlow-contrastletteracuityisamucheasierand quickertestcomparedwithcontrastsensitivityfunctionmeasurement;thus,automatedlow-contrastletteracuitymayresultin broaderapplicationinbothclinicalcareandclinicaltrials.
Limitations
(1)Participantswithpoorerhigh-contrastvisualacuity(20/30 to20/100)haddifficultyreading2.5%contrastlevel(measurementrange,20/10to20/200)suchthatfewerparticipantscould providethetestscores.Therefore,cautionmustbeusedingeneralizingourfindingstoindividualswhosehigh-contrastvisualacuity isworsethan20/100.(2)Insomestudies,low-contrastletteracuitytestswereconductedbinocularly(botheyesopen),asthisapproachintegratespossiblyrelevantbinocularsummation/inhibition
effects,17 providingameasureofoverallvisualfunctioncloserto the “real-life” situationthandoesmonoculartesting.Ourstudy testedlow-contrastletteracuitymonocularly.Afuturestudyiswarrantedtomeasurerepeatabilityofbinocularlow-contrastletteracuity.(3)Agerelationshipwithtestswasnotinvestigatedinthisstudy becauseofthelimitednumberofparticipantsindifferentagecategories.Althoughthissamplehadnosignificantdifferenceinage,the olderparticipantsoftenhadpoorervision.
Significance
Theautomatedlow-contrastletteracuityhasseveraladvantages:consistentluminance,reducedchanceofindividualsmemorizingtestletters,andconvenientandaccuratevisualacuity reportingfunctions.Althoughtheautomatedlow-contrastletter acuitymightreportahigherlogMARvalue(worseacuity)thanthe Sloanchart,consideringitsadvantages,theautomatedtestmay beaviablealternativetotheSloanlow-contrastletteracuitychart inbothclinicalpracticeandresearch.Low-contrastletteracuity, beingpotentiallymoresensitivethanhigh-contrastvisualacuity, isnotverycommonlyusedinclinicalpractice.Ithasbeenrecommendedthatclinicaltrialsadoptalow-contrastletteracuitytest asanoutcomemeasure.1–4 Thus,anautomatedlow-contrastletter acuitytestmayfacilitatelow-contrastletteracuityapplication.
CONCLUSIONS
Theautomatedlow-contrastletteracuitytestshowedfairlygood test-retestrepeatabilityinparticipantsatboth2.5and10%contrastlevels.Inaddition,theagreementbetweentheautomated andtheSloanlow-contrastletteracuitytestswascomparablewith test-retestagreement.Althoughtheautomatedlow-contrastletter acuitytestreportedslightlyworseacuitythantheSloanlowcontrastletteracuitytest,itcouldbeanappropriatealternativeto theSloanlow-contrastletteracuitytest.
ARTICLEINFORMATION
Submitted: February13,2019
Accepted: January25,2020
Funding/Support: NationalEyeInstitute(EY026664;toJW).
ConflictofInterestDisclosure: Thisstudywassupported byM&STechnologies(M&STechnologiesprovideresearch equipmentandcompensationtostudysubjects)andby grantsfromtheNationalEyeInstitute(EY026664;JW)and ThePennsylvaniaLionsSightConservationandEye ResearchFoundationGrant(JW).
AuthorContributions: Conceptualization:YP,JW;Data Curation:YP,LS,EN;FormalAnalysis:YP,JW;Funding Acquisition:YP,JW;Investigation:YP,JW;Methodology: YP,LS,EN,JW;ProjectAdministration:YP,EN; Resources:YP,EN;Software:YP;Supervision:YP; Validation:YP,JW;Visualization:YP;Writing – Original Draft:YP,JW;Writing – Review&Editing:YP,LS,EN,JW.
REFERENCES
1. BalcerLJ,RaynowskaJ,NolanR,etal.Validityof Low-contrastLetterAcuityasaVisualPerformance
OutcomeMeasureforMultipleSclerosis.MultScler 2017;23:734–47.
2. ElliottDB,SituP.VisualAcuityversusLetterContrast SensitivityinEarlyCataract.VisionRes1998;38: 2047–52.
3. LoefflerM,WiseJS,GansM.ContrastSensitivity LetterChartsasaTestofVisualFunctioninAmblyopia.JPediatrOphthalmolStrabismus1990;27: 28 –31.
4. StavrouEP,WoodJM.LetterContrastSensitivity ChangesinEarlyDiabeticRetinopathy.ClinExpOptom 2003;86:152–
6.
Automated
10%Contrastlevel(n=49) Sloan Mean difference t Testand P value95%LoAAutomatedSloan Mean difference t Testand P value95%LoA 0.75(0.20)0.71(0.17) 0.04(0.10) t = 2.195; P =.005*±0.190.51(0.33)0.38(0.30) 0.13(0.12) t = 7.06; P <.001*±0.24 Themeandifferenceand95%LoAarealsoshown.Paired
AutomatedLow-contrastLetterAcuityTest Pangetal. www.optvissci.com OptomVisSci2020;Vol97(5) 375 Copyright © American Academy of Optometry. Unauthorized reproduction of this article is prohibited.
t testwasusedtocomparetwotests.*Statisticalsignificance.LCLA=low-contrastletter acuity;LoA=limitofagreement;SD=standarddeviation.
5. ColeSR,BeckRW,MokePS,etal.TheNationalEye InstituteVisualFunctionQuestionnaire:Experienceofthe ONTT.OpticNeuritisTreatmentTrial.InvestOphthalmol VisSci2000;41:1017–21.
6. BalcerLJ,BaierML,PelakVS,etal.NewLow-contrast VisionCharts:ReliabilityandTestCharacteristicsinPatientswithMultipleSclerosis.MultScler2000;6:163–71.
7. BachM.TheFreiburgVisualAcuityTest Automatic MeasurementofVisualAcuity.OptomVisSci1996;73: 49–53.
8. KollbaumPS,JansenME,KollbaumEJ,etal.ValidationofaniPadTestofLetterContrastSensitivity.Optom VisSci2014;91:291–6.
9. ApplegateRA,MarsackJD,ThibosLN.Metricsof RetinalImageQualityPredictVisualPerformancein
Eyeswith20/17orBetterVisualAcuity.OptomVisSci 2006;83:635–40.
10. RavikumarA,MarsackJD,BedellHE,etal.Change inVisualAcuityIsWellCorrelatedwithChangeinImagequalityMetricsforBothNormalandKeratoconic WavefrontErrors.JVis2013;13:1–16.
11. RavikumarA,SarverEJ,ApplegateRA.Changein VisualAcuityIsHighlyCorrelatedwithChangeinSix ImageQualityMetricsIndependentofWavefrontError and/orPupilDiameter.JVis2012;12:1–13.
12. BlandJM,AltmanDG.StatisticalMethodsfor AssessingAgreementbetweenTwoMethodsofClinical Measurement.Lancet1986;1:307–10.
13. ElliottDB,SheridanM.TheUseofAccurateVisualAcuityMeasurementsinClinicalAnti-cataract
FormulationTrials.OphthalmicPhysiolOpt1988; 8:397 – 401.
14. ReevesBC,HillAR,AspinallPA.TheClinicalSignificanceofChange.OphthalmicPhysiolOpt1987;7: 441–6.
15. DoughertyBE,FlomRE,BullimoreMA.AnEvaluationoftheMarsLetterContrastSensitivityTest.Optom VisSci2005;82:970–5.
16. PangY,AllenM,RobinsonJ,etal.ContrastSensitivityofAmblyopicEyesinChildrenwithMyopicAnisometropia.ClinExpOptom2019;102:57–62.
17. PinelesSL,BirchEE,TalmanLS,etal.OneEyeor Two:AComparisonofBinocularandMonocular Low-contrastAcuityTestinginMultipleSclerosis. AmJOphthalmol2011;152:133–40.
AutomatedLow-contrastLetterAcuityTest
www.optvissci.com OptomVisSci2020;Vol97(5) 376 Copyright © American Academy of Optometry. Unauthorized reproduction of this article is prohibited.
Pangetal.
Report Measuring Contrast Sensitivity Using the M&S Smart System II versus the Pelli-Robson Chart
Contrast sensitivity (CS) refers to the ability of the visual system to detect differences in luminance (i.e., brightness) between an object and its background.1 Assessment of CS provides valuable information in the early detection and monitoring of ocular diseases, as well as evaluating the impact of therapy.2 The most widely used clinical spatial CS test is the Pelli-Robson chart (Clement Clarke International, Essex, UK).3 Several factors may influence the CS threshold measured. First, although the recommended luminance is 85 candelas/m2 (range, 60e120), maintaining consistent luminance across the entire chart can be difficult. Overhead lighting in most examination rooms illuminates preferentially the top portion of the chart, and decreases nonuniformly toward the lower portion. In addition, patients tested in different examination rooms with different light fixtures may exhibit some variation in threshold measurement. Second, the Pelli-Robson chart fades over time with exposure, with a manufacturer-recommended expiry of 7 years. Variation and inaccuracy may occur when comparing measurements using charts of different ages. Third, the chart has only 2 versions with different triplets of optotypes. Patients may recall letters with frequent use, especially those letters that are found around their threshold.
The M&S Smart System II (MSSS-II; M&S Technologies Inc, Niles, IL) includes a computer-generated, letter-based CS test. The luminance of the liquid crystal display (LCD) screen can be adjusted to recommended level of 85 candelas/m2 using the built-in control and can be monitored for any changes using an external light meter or luminance probe. The testable contrast ranges from 0.0 to 2.3 log units (similar to the PelliRobson chart), with each level corresponding to a change of 0.1 log units. Unlike the Pelli-Robson chart, the letters are not arranged in triplets of equal contrast. Instead, a single Sloan letter is displayed randomly in the center of the screen for any given contrast level. The keypad is used by the examiner to access the CS test, to choose randomization options, and to increase or decrease the contrast level of each letter. The system offers several advantages over the Pelli-Robson chart. The test is conducted in a dark room, thereby avoiding issues related to variation in room illumination. The system can be cali-brated for various viewing distances (1.8e6.7 m) and does not require recalibration to account for the lighting environment at each testing distance. Furthermore, presentation of random letters prevents patients from memorizing the letters (Table 1, available at http://aaojournal.org). Currently, there are no published data on the validity or reliability of CS testing using the MSSS-II. We compared the MSSS-II with the PelliRobson chart as a clinical test for measuring CS in a large population.
Testing was performed on 134 adults and children (262 eyes). The mean age ( standard deviation) was 19.5 14.9 years (range, 5e69 years; 78 females). There were 66 eyes from 33 visually normal participants (mean age, 29.4 15.7 years; range, 5e56; 23 females; visual acuity, 20/15e20/25) and 196 eyes from 101patients (mean age, 16.3years; range, 6e69; 55 females; visual acuity, 20/20e20/400). The ophthalmic diagnoses included glaucoma, diabetic retinopathy, macular drusen, retinitis pigmen-tosa, optic neuritis, idiopathic intracranial hypertension, optic glioma, and
Six eyes with visual acuity of 20/200 were excluded. Participants who were not able to read a standard Early Treatment of Diabetic Retinopahty Study (ETDRS) letter chart and those with a prior history of refractive surgery were also excluded. The study was approved by the Research Ethics Board at The Hospital for Sick Children and all protocols adhered to the guidelines of the Declaration of Helsinki. Informed consent was obtained from each participant.
Participants were tested using the MSSS-II and the Pelli-Robson chart in random order during monocular viewing. The MSSS-II optotype size of 1.5 logarithm of the minimum angle of resolution at a testing distance of 4 m was chosen to match the visual angle subtended by the letters presented on the Pelli-Robson chart at 1 m, representing a spatial frequency of 1 cycle per degree for both distances. Participants were tested with the Pelli-Robson chart with each letter being scored individually and assigned a score of 0.05 for each correct response.4 For the MSSS-II, participants were asked to name the letter that was displayed in the center of the screen. The experimenter then increased or decreased the contrast level based on the previous response. A single Sloan letter was displayed for each contrast level starting at 100% contrast. Once the participant approached their threshold, as determined by any hesitation in response or error in letter identification, randomly selected Sloan letters were presented 2 more times at the same contrast level and the participant was required to identify 2 of the 3 letters per contrast level correctly before the contrast threshold was finalized. The outcome measure was the agreement between MSSSII and Pelli-Robson.
BlandeAltman analysis5 demonstrated that the MSSS-II test and Pelli-Robson chart show comparable CS values for both visually normal participants and patients (Fig 1; available at http:// aaojournal.org). For visually normal participants (n ¼ 66 eyes), mean CS was 1.670.12 log units with MSSS-II, and 1.640.04 log units with the Pelli-Robson chart. For patients (n ¼ 196 eyes), mean CS was 1.440.29 log units with the MSSS-II, and 1.480.28 log units with the Pelli-Robson chart. The mean CS difference detected between the 2 testing methods was minimal: 0.030.12 log units (95% confidence interval of limits of agreement, 0.20 to 0.26 log units) for visually normal participants and 0.040.12 log units (95% confidence interval of limits of agreement, 0.28 to 0.19 log units) for patients. This variation may be due to the minimal differences in the log progression of the 2 charts (0.10 log units between CS levels for MSSS-II and 0.15 log units for Pelli-Robson). The testing time with the MSSS-II system was shorter because participants were screened with only 1 letter at a high contrast level, and the contrast level was decreased imme-diately if they identified the single letter with ease. This differed from using the Pelli-Robson chart, which required the participants to read all 3 letters in the triplet for every contrast level. In conclusion, the close agreement of CS thresholds suggests that the updated version of MSSS-II, when carefully calibrated, can be used as an alternative method to the Pelli-Robson chart in the measurement of CS in a wide variety of ophthalmic conditions, in both adults and children.
increasedthecontrastby0.3logunitsuntiltheycould readthemtoobtainthestartinglevel.Thesameprotocol wasfollowedbydecreasingcontrastat0.1logunitsper step.Theendpointoffivetotalerrorshasbeenusedin previousstudies.7 Whentheparticipantswereunableto readanylettersonalinecorrectlyorwhenlowercontrastwasnotavailable,thetestwasstopped.Aftercompletionofthemeasurement,thetestoutcomeswere displayedonthecomputerwiththefollowingparameters: rightorlefteye,testdistance,contrastthresholdscoreas apercentage,contrastsensitivity(CS)inlogequivalent.
AllautomatedETDRS-CTtestswereconductedbythe sameexaminerinthesameroomat3mwhileparticipants woretheirhabitualrefractivecorrection.Contrastthresholdwasmeasuredintherighteyeofnormalvisionparticipants;inthereduced-visionsubjects,therighteyewas testedunlessvisualacuitylayoutsidetheenrolmentcriteria,inwhichcasethelefteye(N = 6)wastested.After45 ( 15)minutes,allparticipantswereretestedwiththesame procedurebythesameexaminer.
Statisticalanalysis
Thecontrastscoreasapercentagewasconvertedtolog (1/contrastscore)(log(CS))units.Apairedt-testwasused tocomparetestandretest.Therepeatabilitybetweenthe twoautomatedETDRS-CTtestswasevaluatedwithBlandAltmananalysis,usingthe95%limitsofagreement,which correspondsto 1.96 * standarddeviationofthedifferencesbetweenadministrations.8 Thedifferencebetweenthe scoresforeachadministrationwascalculatedforeachparticipant.Thedistributionofthesedifferenceswasdescribed bythemean,standarddeviationandthe95%limitsof agreement(namely,thecoefficientofrepeatability).The breadthofthe95%limitsofagreementindicatesthe repeatabilityofthetest.Thenarrowerthelimitsofagreement,themorerepeatablethetest.Theaveragedifference betweentestandretestindicatestheaccuracyofthetest. Thecloserthebiastozero,themoreaccuratethetest.8 An independent t-testwasusedtocomparethemeancontrast scoreofthetestandretestbetweenthetwogroups.APearsoncorrelationbetweenthefirstcontrastthresholdtestand habitualvisualacuitythroughthehabitualrefractivecorrectionwasalsocalculated.Dataanalysiswasperformed usingR3.5.0statisticssoftware,including“blandr”and “irr”packages.(RFoundationforStatisticalComputing, R-project.org).
wereAfricanAmerican;80%ofparticipantswerefemale. Reducedvisionresultedfromuncorrectedrefractiveerror (N = 8),degenerativemyopia(N = 3),opticatrophy (N = 3),cystoidmacularoedema(N = 1),diabetic retinopathy(N = 1),oculocutaneousalbinism(N = 1), wetage-relatedmaculardegeneration(N = 1),primary openangleglaucoma(N = 1),Stargardtdisease(N = 1)or strabismicamblyopia(N = 1).Thetimetotestoneeyevariedbetween3and10mininthisgroup.
TherepeatabilityoftheETDRS-CTtestisshownin Figure1,wherethetest-retestdifferenceisplottedasafunctionofthemeanoftwoadministrationsusingtheBlandAltmanmethod.Themean(SD)firstandsecondETDRSCTtestresultswere1.18 0.46log(CS)and1.23 0.44 log(CS),respectively.Theaveragedifferencebetweentest andretestwas 0.05log(CS),i.e.,halfalineor2.5letters betteronretest,withastatisticallysignificantdifference (paired t-test: t = 3.27,df = 39, p = 0.002).The95% limitsofagreementbetweentestandretest,orthecoefficientofrepeatability(CoR),was 0.18log(CS). Figure1 showscomparisonbetweenthenormalandreduced-vision groupasaBland-Altmanplot.Therewasasignificantdifferencebetweenthetwogroups(Normal:1.52 0.17, Reducedvision:0.91 0.43log(CS), t = 5.97,df = 27, p < 0.001).Additionally,therewasasignificantcorrelation betweenthefirstETDRS-CTtestresultinlogunitsandthe habitualvisualacuity(0.20 0.25logMAR)(R = 0.86, t = 10.36, df = 38, p < 0.001).
Discussion
Tothebestofourknowledge,thisisthefirststudytoinvestigatetherepeatabilityoftheETDRS-CTtest.Wefound
Table1. Demographiccharacteristicsoftheparticipants(N = 40)
Results
Atotalof40participantsweretested,including21inthe reduced-visiongroupand19inthenormalgroup. Table1 showsthebasiccharacteristicsoftheparticipants.Overhalf
NumberofParticipants(%) VisualAcuity Normal(6/7.5orbetter) 19(48) ReducedVision(6/9to6/30) 21(52) Range(logMAR) 0to0.7 Mean(StandardDeviation,logMAR)0.2(0.3) Gender Female 32(80) Male 8(20) Race Black 22(55) Hispanic 7(18) White 8(20) Asian 3(8) Age(years) Range 22.2–75.0 Mean(StandardDeviation) 47.6(13.8) © 2021TheAuthorsOphthalmicandPhysiologicalOptics © 2021TheCollegeofOptometrists 2 AutomatedETDRScontrastthreshold YPang etal
thatthistesthadgoodrepeatabilitywith95%limitsof agreementof 0.18inbothnormalandreducedvision participants.Inaddition,contrastsensitivitytestedwith ETDRS-CTcorrelatedsignificantlywithhabitualvisual acuity.

Kollbaum etal.reportedthatboththeiPadandFreiburg computerisedtestsdemonstratedbettercontrastsensitivity valuesthanthePelli-Robsonchart.3 Theycomparedthe iPad,Pelli-RobsonandFreiburgtests,finding95%limitsof agreementof 0.24, 0.23and 0.21,respectively.3 Habtamu etal.reported95%limitsofagreementforthesmartphone-basedPeekContrastSensitivitytestof 0.30.4 The 95%limitsofagreementinthepresentstudywas 0.18, whichisslightlybetterthantheseprevioustwoinvestigations.Dougherty etal.reportedgoodrepeatabilityofthe MarsLetterContrastSensitivityTest(95%LoAof 0.20) andexcellentagreementwiththePelli-Robsontest(95% LoAof 0.21).9 Theirresultiscomparabletothefindings ofthisinvestigation,whichindicatethattheETDRS-CT testisarelativelypreciseautomatedtest.Retestingofthe ETDRS-CTyieldedmeanfindings0.05log(CS)higher(2.5 lettersmore)thanthefirsttest.Similarly,theiPadretest resultswere0.04log(CS)higherthanthefirsttest.3 Kollbaum etal.reportedthatachangeof0.25log(CS)wasclinicallymeaningfulfortheiPadtestofcontrastsensitivity basedontheir95%limitsofagreement.3 Ourfindingsindicatedthatachangeof0.20log(CS)couldberegardedas beingclinicallymeaningfulfortheautomatedETDRS-CT testbasedonthe95%limitsofagreement.
Previously,wereportedthatpatientswithamblyopia associatedwithmyopicanisometropiahadsignificantly reducedcontrastsensitivityatthemiddleandhigherspatial frequencies.10 Althoughacontrastsensitivityfunctiontest measuresanindividual’scontrastsensitivitythoroughly,it
isalongprocedurewhichmaypresentsomeobstaclesin routineclinicalapplication.TheautomatedETDRS-CT test,whichrequiresminimumeffortfromtheparticipants andlessclinicaltestingtimemayhaveabroaderapplicationinbothclinicalcareandexperimentaltrials.
Limitations
Thereareatleastfourlimitations:(1)Ourstudyemployed monoculartestingonly.Afuturestudyiswarrantedto measurerepeatabilityoftheautomatedETDRS-CTtest binocularly.(2)Anyagerelationshipwithtestingwasnot investigatedduetoalimitednumberofparticipantsindifferentagecategories.(3)Duetothesizelimitationofthe computerscreenandEDTRStestprotocol(5lettersina row),thelargestlettersizepossibleis6/30.Forindividuals withvisualacuitypoorerthanthisvalue,ashortenedtest distancemustbeusedtodeterminetheCSthreshold.(4) WedidnotcomparetheETDRS-CTtestwiththePelliRobsonchartbecausetheyarenotdirectlycomparable basedontestdistanceandlettersize.ThePelli-Robson chartisdesignedtobeusedat1mwithlettersizeof1/34 (6/204),whiletheautomatedETDRS-CTtestwasdesigned tobeusedat3mwithlettersizeof6/30.
Significance
TheautomatedETDRS-CTtesthasseveraladvantages: consistentluminance,reducedchanceofindividualsmemorisingtestlettersandconvenientandaccuratecontrast thresholdreportingfunctionstoavoidhumanrecording errors.AlthoughtheautomatedETDRS-CTtestmight reportaslightlyhighercontrastsensitivityvalueatretest (halfalineor2.5lettersbetter),thischangeisnotclinically
firstadministration(secondminusfirst,inblack)ofeachindividualisplottedagainstthemeanofthetwotests,while 1.96SDisplottedinblue.CoR ( 0.18)ismarked.Theblacktrianglesindicatethenormalsubjects,whiletheredcirclesymbolsindicatethereducedvisiongroupparticipants.The finedashedlinesshowthe95%CIforthemeanandSD,respectively.Onedarkersymbolindicatesrepeateddatafromtwoindividuals.
© 2021TheAuthorsOphthalmicandPhysiologicalOptics © 2021TheCollegeofOptometrists 3 YPang etal AutomatedETDRScontrastthreshold
Figure1. RepeatabilityoftheautomatedcontrastthresholdtestshownasaBland-Altmanplot.Themeandifferencebetweenthesecondandthe
significantandmayduetoalearningeffect.Itisstillcontroversialwhetherthelearningeffectinfunctionaltestsis significant,withstudiesreportingalearningeffectinautomatedperimetry11,12 whileothersreportingnolearning effectinpulsarperimetry.13 Consideringitsadvantages,this testmaybeaviablealternativetothePelli-Robsonchartin bothclinicalpracticeandresearch.
Conclusion
TheautomatedETDRScontrastthresholdtestshowed goodtest-retestrepeatabilitybetweentwoadministrations inbothnormalandreducedvisionparticipants.Measurementattheretestyielded0.05log(CS)highercontrastsensitivitythanatthefirstmeasurement,whichmightbedue toalearningeffectamongstparticipants.
Funding
ThisstudywassupportedbyM&STechnologies(M&S Technologiesprovideresearchequipmentandcompensationtostudysubjects).
Conflictofinterest
Theauthorsreportnoconflictsofinterestandhavenoproprietaryinterestinanyofthematerialsmentionedinthis article.
Authorcontributions
YiPang: Conceptualization(lead);Datacuration(equal); Formalanalysis(supporting);Fundingacquisition(equal); Investigation(equal);Methodology(equal);Projectadministration(equal);Resources(equal);Software(equal); Supervision(equal);Validation(equal);Visualization (equal);Writing-originaldraft(supporting);Writing-review&editing(supporting). LaurenSparschu: Datacuration(lead);Investigation(equal);Methodology(equal); Projectadministration(equal);Validation(equal);Writing-originaldraft(supporting). JingyunWang: Conceptualization(supporting);Formalanalysis(lead);Investigation (equal);Methodology(supporting);Software(equal);Visualization(lead);Writing-originaldraft(lead);Writing-review&editing(lead).
References
1.PangY,SparschuL&NylinE.ValidationofanautomatedETDRSnearandintermediatevisualacuitymeasurement. ClinExpOptom 2019;103:663–667.
2.BachM.TheFreiburgvisualacuitytest-automaticmeasurementofvisualacuity. OptomVisSci 1996;73:49–53.
3.KollbaumPS,JansenME,KollbaumEJ&BullimoreMA. ValidationofaniPadtestoflettercontrastsensitivity. OptomVisSci 2014;91:291–296.
4.HabtamuE,BastawrousA,BolsterNM etal.Development andvalidationofasmartphone-basedcontrastsensitivity test. TranslVisSciTechnol 2019;8:13.Availableat:https:// tvst.arvojournals.org/article.aspx?articleid=2751399. AccessedApril15,2021
5.FariaBM,DumanF,ZhengCX etal.Evaluatingcontrast sensitivityinage-relatedmaculardegenerationusinganovel computer-basedtest,theSpaeth/Richmancontrastsensitivitytest. Retina 2015;35:1465–1473.
6.PangY,SparschuL,NylinE&WangJ.Validationofan automatedearlytreatmentdiabeticretinopathystudylowcontrastletteracuitytest. OptomVisSci 2020;97:370–376.
7.RavikumarA,MarsackJD,BedellHE etal.Changeinvisual acuityiswellcorrelatedwithchangeinimage-qualitymetricsforbothnormalandKeratoconicWavefronterrors. J Vis 2013;13:28.Availableat:https://jov.arvojournals.org/ article.aspx?articleid=2193847.AccessedApril15,2021
8.BlandJM&AltmanDG.Statisticalmethodsforassessing agreementbetweentwomethodsofclinicalmeasurement. Lancet 1986;1:307–310.
9.DoughertyBE,FlomRE&BullimoreMA.Anevaluationof theMarslettercontrastsensitivitytest. OptomVisSci 2005; 82:970–975.
10.PangY,AllenM,RobinsonJ&FrantzKA.Contrastsensitivityofamblyopiceyesinchildrenwithmyopicanisometropia. ClinExpOptom 2019;102:57–62.
11.AydinA,KocakI,AykanU etal.TheinfluenceofthelearningeffectonautomatedperimetryinaTurkishpopulation. JFrOphtalmol 2015;38:628–632.
12.WildJM,Dengler-HarlesM,SearleAE etal.Theinfluence ofthelearningeffectonautomatedperimetryinpatients withsuspectedglaucoma. ActaOphthalmol(Copenh) 1989; 67:537–545.
13.SalvetatML,ZeppieriM,ParisiL etal.Learningeffectand test-retestvariabilityofpulsarperimetry. JGlaucoma 2013; 22:230–237.
© 2021TheAuthorsOphthalmicandPhysiologicalOptics © 2021TheCollegeofOptometrists 4 AutomatedETDRScontrastthreshold YPang etal
Measuring Contrast Sensitivity Using the M&S Smart System II versus the Pelli-Robson Chart
Contrast sensitivity (CS) refers to the ability of the visual system to detect differences in luminance (i.e., brightness) between an object and its background.1 Assessment of CS provides valuable information in the early detection and monitoring of ocular diseases, as well as evaluating the impact of therapy.2 The most widely used clinical spatial CS test is the Pelli-Robson chart (Clement Clarke International, Essex, UK).3 Several factors may influence the CS threshold measured. First, although the recommended luminance is 85 candelas/m2 (range, 60e120), maintaining consistent luminance across the entire chart can be difficult. Overhead lighting in most examination rooms illuminates preferentially the top portion of the chart, and decreases nonuniformly toward the lower portion. In addition, patients tested in different examination rooms with different light fixtures may exhibit some variation in threshold measurement. Second, the Pelli-Robson chart fades over time with exposure, with a manufacturer-recommended expiry of 7 years. Variation and inaccuracy may occur when comparing measurements using charts of different ages. Third, the chart has only 2 versions with different triplets of optotypes. Patients may recall letters with frequent use, especially those letters that are found around their threshold.
The M&S Smart System II (MSSS-II; M&S Technologies Inc, Niles, IL) includes a computer-generated, letter-based CS test. The luminance of the liquid crystal display (LCD) screen can be adjusted to recommended level of 85 candelas/m2 using the built-in control and can be monitored for any changes using an external light meter or luminance probe. The testable contrast ranges from 0.0 to 2.3 log units (similar to the PelliRobson chart), with each level corresponding to a change of 0.1 log units. Unlike the Pelli-Robson chart, the letters are not arranged in triplets of equal contrast. Instead, a single Sloan letter is displayed randomly in the center of the screen for any given contrast level. The keypad is used by the examiner to access the CS test, to choose randomization options, and to increase or decrease the contrast level of each letter. The system offers several advantages over the Pelli-Robson chart. The test is conducted in a dark room, thereby avoiding issues related to variation in room illumination. The system can be cali-brated for various viewing distances (1.8e6.7 m) and does not require recalibration to account for the lighting environment at each testing distance. Furthermore, presentation of random letters prevents patients from memorizing the letters (Table 1, available at http://aaojournal.org). Currently, there are no published data on the validity or reliability of CS testing using the MSSS-II. We compared the MSSS-II with the PelliRobson chart as a clinical test for measuring CS in a large population.
Testing was performed on 134 adults and children (262 eyes). The mean age ( standard deviation) was 19.5 14.9 years (range, 5e69 years; 78 females). There were 66 eyes from 33 visually normal participants (mean age, 29.4 15.7 years; range, 5e56; 23 females; visual acuity, 20/15e20/25) and 196 eyes from 101patients (mean age, 16.3years; range, 6e69; 55 females; visual acuity, 20/20e20/400). The ophthalmic diagnoses included glaucoma, diabetic retinopathy, macular drusen, retinitis pigmen-tosa, optic neuritis, idiopathic intracranial hypertension, optic glioma, and amblyopia.
Six eyes with visual acuity of 20/200 were excluded. Participants who were not able to read a standard Early Treatment of Diabetic Retinopahty Study (ETDRS) letter chart and those with a prior history of refractive surgery were also excluded. The study was approved by the Research Ethics Board at The Hospital for Sick Children and all protocols adhered to the guidelines of the Declaration of Helsinki. Informed consent was obtained from each participant.
Participants were tested using the MSSS-II and the Pelli-Robson chart in random order during monocular viewing. The MSSS-II optotype size of 1.5 logarithm of the minimum angle of resolution at a testing distance of 4 m was chosen to match the visual angle subtended by the letters presented on the Pelli-Robson chart at 1 m, representing a spatial frequency of 1 cycle per degree for both distances. Participants were tested with the Pelli-Robson chart with each letter being scored individually and assigned a score of 0.05 for each correct response.4 For the MSSS-II, participants were asked to name the letter that was displayed in the center of the screen. The experimenter then increased or decreased the contrast level based on the previous response. A single Sloan letter was displayed for each contrast level starting at 100% contrast. Once the participant approached their threshold, as determined by any hesitation in response or error in letter identification, randomly selected Sloan letters were presented 2 more times at the same contrast level and the participant was required to identify 2 of the 3 letters per contrast level correctly before the contrast threshold was finalized. The outcome measure was the agreement between MSSSII and Pelli-Robson.
BlandeAltman analysis5 demonstrated that the MSSS-II test and Pelli-Robson chart show comparable CS values for both visually normal participants and patients (Fig 1; available at http:// aaojournal.org). For visually normal participants (n ¼ 66 eyes), mean CS was 1.670.12 log units with MSSS-II, and 1.640.04 log units with the Pelli-Robson chart. For patients (n ¼ 196 eyes), mean CS was 1.440.29 log units with the MSSS-II, and 1.480.28 log units with the Pelli-Robson chart. The mean CS difference detected between the 2 testing methods was minimal: 0.030.12 log units (95% confidence interval of limits of agreement, 0.20 to 0.26 log units) for visually normal participants and 0.040.12 log units (95% confidence interval of limits of agreement, 0.28 to 0.19 log units) for patients. This variation may be due to the minimal differences in the log progression of the 2 charts (0.10 log units between CS levels for MSSS-II and 0.15 log units for Pelli-Robson). The testing time with the MSSS-II system was shorter because participants were screened with only 1 letter at a high contrast level, and the contrast level was decreased imme-diately if they identified the single letter with ease. This differed from using the Pelli-Robson chart, which required the participants to read all 3 letters in the triplet for every contrast level. In conclusion, the close agreement of CS thresholds suggests that the updated version of MSSS-II, when carefully calibrated, can be used as an alternative method to the Pelli-Robson chart in the measurement of CS in a wide variety of ophthalmic conditions, in both adults and children.
Report
2160 Ophthalmology Volume120,Number10,October2013
Visually normal participants
Table1.FeaturesandSpecificationsofM&SSmartSystemIIandPelli-RobsonChart Feature M&SSmartSystemII
Viewingdistance Wallmountedat1 6.7m
CSrange(logunits)0.0 2.3
Wallmountedat1or3m
0.0 2.25
Unitdecrement(logunits)0.1 (1/O2)0.15pertriplet
Source of illumination
Setup
Durability
Expiration
Other considerations
CS ¼ contrast sensitivity.
Intrinsic(monitorconfiguration) Extrinsic(overheadlighting)
Calibrationisnotchallenging,onlyrequiringmonitor configurationtosetappropriateluminance
Calibrationmaybechallengingdependingontheconfiguration ofambientlighting
Softwaretransferabletonewcomputer/displayChartmayfadeovertimerequiringreplacement Noexpiration 7years
Built-invisualacuityandCStestsprovide convenienceandconfiguration flexibility
MANOKARAANANTHAN CHANDRAKUMAR, HBSC1
LINDA COLPA, OC(C)1
Y. ARUN REGINALD, MD, FRCS1
HERBERT C. GOLTZ, PHD1,2
AGNES M.F. WONG, MD, PHD, FRCSC1,2
1Department of Ophthalmology and Vision Sciences, The Hospital for Sick Children, Toronto, Ontario, Canada, 2 University of Toronto, Toronto, Ontario, Canada
Moreaffordableandportable;requireslessspace
References
1.Wei H, Sawchyn AK, Myers JS, et al. A clinical method to assess the effect of visual loss on the ability to perform activities of daily living. Br J Ophthalmol 2012;96:735–41.
2.Owsley C. Contrast sensitivity. Ophthalmol Clin North Am 2003;16:171–7.
3.Pelli DG, Robson JG, Wilkins AJ. The design of a new letter chart for measuring contrast sensitivity. Clin Vis Sci 1988;2:187–99.
4.Elliott DB, Whitaker D. Clinical contrast sensitivity chart evaluation. Ophthalmic Physiol Opt 1992;12:275–80.
5.Bland JM, Altman DG. Statistical methods for assessing agreement between two methods of clinical measurement. Lancet 1986;1:307–10.
-0.6 -0.4 -0.2 0 0.2 0.4 0.6 0.40.60.811.21.41.61.82 Difference in CS measured by MSSS-II and Pelli-Robson tests (log units) Mean
(log units)
CS measured by MSSS-II and Pelli-Robson tests
A -0.6 -0.4 -0.2 0 0.2 0.4 0.6 0.40.60.811.21.41.61.82 Difference in CS measured by MSSS-II and Pelli-Robson tests (log units) Mean
Patients B
CS measured by MSSS-II and Pelli-Robson tests (log units)
Figure1. Bland-AltmanplotscomparingtheM&SSmartSystemII(MSSS-II)andthePelli-Robsonchartfor(A)visuallynormalparticipantsand(B) patients.CS ¼ contrastsensitivity.
Pelli-RobsonChart
Ophthalmology Volume120,Number10,October2013 2161
Normalvaluesforaclinicaltestofletterrecognitioncontrastthresholds
ArshadM.Khanani,MD,SandraM.Brown,MD,KeTomXu,PhD
Purpose: Toinvestigatethecontrastthresholds(CTs)innormalsubjectsusinga high-luminance,letter-recognitiontaskunderclinicallyrelevanttestingconditions.
Setting: TexasTechUniversityHealthSciencesSystem,Lubbock,Texas,USA.
Methods: Sixtynormalsubjectsaged20to49yearswithabestcorrectedvisual acuityof20/20orbetterinbotheyesparticipated.M&S Technologiessoftware wasusedtodisplayblack-on-whiteSloanlettersatcontrastlevelsof25%,20%, 15%,12%,and10%through1%in1%decrements.Theeffectsofage,sex,optotypesize,eyedominance,ambientilluminationlevel(bright 625 630lux; dim 3lux),anddirectionofapproachtothresholdwereanalyzedusingamultivariate,ordinary,least-squaresanalysis.
Results: AgeandsexdidnotinfluenceCTs.Ascendingversusdescendingtestingwasnotstatisticallysignificant(P .5).Theeffectsofroomilluminationand eyedominanceweresignificant(P .01).Significantdifferenceswerefoundbetween20/30and20/50,20/30and20/70,and20/50and20/70optotypesizes (P .01forallcomparisons).
Conclusions: Acommerciallyavailable,computer-basedtestofCTswaseasyto administerandapparentlyeasyforinexperiencedsubjectstoperform.Theresults suggestcriteriafordetectingvisualproblemsconcernedwithfamiliarbutcomplex spatial-imageshapes.Thisinformationmightbeusedtoassesstheeffectsof treatmentssuchaslaserrefractivesurgeryonrecognitioncontrast.Furtherstudy iswarranted.
JCataractRefractSurg2004;30:2377–2382 2004ASCRSandESCRS
letter-recognitiontestrequirestheobservertonotonly
Visionqualitylossafterlaserrefractivesurgery(LRS) detectthepresenceofanobject(s)butalsoperceptually hasraisedawarenessoftheneedforobjectivemeaseparatethespatialcontoursof1objectfromthose suresofvisionfunctionotherthanhigh-contrastvisual belongingtoneighboringobjectsandthentoactually acuity.Contrastthresholdevaluation(CTE)mayprove identifytheobject.Contrastthresholdsmeasuredwith tobeausefulassessment.1–10 AlthoughCTEusingsinesine-wavegratingsaresignificantlylower(better)than wavegratingshasexistedasalaboratorytoolfordecades, thosemeasuredbyletterrecognition,andthisdifference ithasnotpenetratedintoregularclinicalcare,possibly increasesaslettersizedecreases.17 Therefore,apatient duetothepracticaldifficultiesinadministrationand coulddetecttheorientationofasine-wavegratingyet theinabilityofdoctorstoeasilycorrelatetestresults notrecognizeafamiliarshapeofcomparablesizeatthe withpatientcomplaints.7,11 Comparedwithsine-wave samecontrastlevel. grating,aCTEbasedonletterrecognition12–16 evaluates
Thepresentstudyaddressespracticalissuescon- morefunctionallyrelevantaspectsofdailyvision.A cerningaspatial-recognitionCTEthatiscommercially available.Thespecificaimsweretoinvestigatethevalid-
AcceptedforpublicationMarch30,2004. ityofthetest(whetherthetestproducestheexpected
ReprintrequeststoSandraBrown,MD,3601FourthStreetSTOP results),assesswhetherthetestwaseasytoadminister 7217,Lubbock,Texas79430-7217,USA.E-mail:sandra.brown@ ttuhsc.edu. andeasyforatypicalpatienttoperform,andderive
2004ASCRSandESCRS 0886-3350/04/$–seefrontmatter PublishedbyElsevierInc. doi:10.1016/j.jcrs.2004.05.027
Table1. Subjectdemographics.
withmultiplelightmetersandwiththewhitechannelofa
PM2Ldark-roomcoloranalyzer(Beseler)andwerefound
tobeessentiallylinear.Therefore,usingthegrayscale,itis possibletodividetherangeofluminancefromnone(pure
black)topurewhiteinto100/255steps(or0.39%perstep).
Contrastwasdefinedasthegray-scalepixeldensityofthe
11 optotypesrelativetothepixeldensityofthepurewhite background.Inthissystem,1%contrastrepresentsapixel densityof99%ofthewhitevalue.
criteriaforjudgingwhetheracontrastthreshold(CT)
Thesamewindowlessroomwasusedforalltests.The valueshouldbeconsiderednormal. testingdistancewas17feet,andtheoptotypedimensions werecalibratedforthisworkingdistancebythesoftware. Bright-lighttestingwasperformedwithfluorescentceiling
SubjectsandMethods
panellightson(ambientilluminationnearthesubjectof
InstitutionalReviewBoardapprovalwasobtained.Sixty about630luxor59foot-candles[ft-c]).Low-lighttesting normalsubjectsaged20to49yearswereenrolled.Demo- wasperformedincompletedarknessexceptforadimexamgraphicinformationisgiveninTable1.Exclusioncriteria inerworklightplacedbehindthesubject(ambientillumina- wereabestcorrectedvisualacuityworsethan20/20ineither tionnearthesubjectoflessthan3luxor0.3ft-c).The eye;ahistoryofeyeinjury,eyedisease,oreyesurgery;andlack amountoflightfallingonthemonitorwasmeasuredfor offamiliaritywiththeRomanalphabet.Patientsrequiring consistencywithalightmeterpositionedbesidethemonitor. correctionweretestedwithcorrection(glassesorcontact Typicalbright-lightreadingswere950–980lux(88 91 lenses). ft-c),andlow-lightreadingswerelessthan3lux.Thediffer- AsubsetofSloanoptotypesconsideredtohavethesame enceinbrightilluminationnearthesubjectandnearthe difficulty18,19 (ZNHVRKD)wasusedinaletter-recognition monitorwasduetothelocationofthefluorescentceiling test.Thelettersweredisplayedasblackagainstawhiteback- panelsandwasconstantthroughoutthestudy. ground,with5lettersperlinespacedaccordingtoEarly
Subjectsnearingthresholdwereencouragedto“waitfor TreatmentDiabeticRetinopathyStudystandardsandasin- letterstofadein.”Thistypicallyresultedina1%to2% gle-linedisplay.Contrastthreshold,thelowestluminance decreaseinthescoredCTlevel(ie,bettercontrastsensitivity) contrastatwhichthesubjectcouldidentifyatleast3of relativetothefirstlevelthatthepatientperceivedasdifficult. 5letterstwice,wasusedtoquantifytheletter-recognition Thepercentagecontrastdatasetwasconvertedtolog10 values. performance.Contrastthresholdsweredeterminedbidirec- Amultivariate,ordinary,least-squaresanalysiswasusedto tionally(ie,ascendingfromunseentoseenanddescending determinewhichconditionswouldsignificantlyinfluenceCT fromseentounseen).Testingwasperformedindominant givenotherfactorsandcontrollingforintrasubjectcorrelation andnondominanteyesinbright-lightandlow-lightcondi- acrossdifferenttestconditions.TheCTwasthenregressed tions.Theoptotypesizeswerealwaysdecreasedstepwiseusing oversubjects’age,sex,eyedominance(dominanteyeversus 20/70,20/50,and20/30.Twenty-fourtestswereperformed nondominanteye),ambientillumination(brightlightversus persubject. lowlight),directionofapproachtothreshold(decreasing
TheoptotypesweregeneratedbyM&S Technologies versusincreasing),andoptotypesize(20/50and20/70versus SmartSystemII2020,usingcontrastlevelsinpercentiledec- 20/30). rementsof25,20,15,10,9,8,7,6,5,4,3,2,and1.The
Thesignificantconditions(P .05)wereusedasstrati- monitorwasaPhillipsProfessionalSeriesmodel107P20flat fyingvariablestoestablishcategoriesindicatingdifferent screen,aperturegrill-displaytype.Ithasa0.25mmhorizontal combinationsofthetestsettings.Themeanofnonsignificant dotpitch,withtheresolutionsetto1280 1024.The settingswasusedforeachsubjectineachcategory.Forexam- monitorluminancewasmatchedtotheAmericanNational ple,ifeyedominance,ambientillumination,andoptotype StandardsInstitute(ANSI)reflectancelevelforwhiteboard sizeweresignificantanddirectionofapproachtothreshold chartsbymeasuringtheemittedlightasifitwerereflected. wasnot,theCTmeanobtainedfromascendinganddescend- TheANSIstandardis85candelas(cd)/m2.Whenmeasured ingapproacheswasusedforagivensubjectinthecategory withaTekroniixJ16digitalphotometerwithacd/m2 probe, ofdominanteye/brightlight/optotypesize20/30andthe themonitor“reflected”95cd/m2 (averagedoveritsentire other11possiblecategorycombinations.Foreachcategory, area),aclosematch. adistributionwasconstructedforthe60subjectsusingthe Thismonitorhasacolortemperatureof5300Kelvin meansofthesettingsthatwerenotstatisticallysignificantin (testedwithaMinoltaColorMeterIIIF)andiscapableof themultivariateanalysis.Themeanandtheuppervalue producing65millioncolorsand255shadesofpuregray(in ofthe95%confidenceintervals(CIs)werecalculatedfor whichthered,green,andbluechannelsareequal).The luminancevaluesofsuccessiveshadesofgrayweremeasuredeachcombination.
NORMALVALUESOFLETTER-RECOGNITIONCONTRASTTHRESHOLDS
Age(Years)NumberMaleFemale
20–29 20 6 14
30–39 20 6 14
40–49 20 9
JCATARACTREFRACTSURG—VOL30,NOVEMBER2004 2378
Table2. MeansofthedistributionsofCTsforvariousconditions.
Valuesarepercentagecontrastrounded(upordown)tothenearestclinicallymeasurablevalue;valuesinparenthesesarethelog10 of percentagecontrast.
CT contrastthreshold
Tovalidatetheappropriatenessofthisapproach,Sha- lowerCTsthanlow-lightambience.Dominanteyeshad piro-WilkandShapiro-FranciaWtestsfornormalityassump- lowerCTsthannondominanteyes,andlargeroptotypes tionswereperformedforalldistributions. producedlowerCTsthansmalleroptotypes.Table3 showstheupperlimitofthe95%CIsofthemeans.
Results
Forexample,theresultsindicatethatforadominant eyeunderbright-lightambiencewithanoptotypesize
Resultswereobtainedfromallsubjectsrecruited of20/30,aCTof6%orlesscanbeconsiderednormal. forthestudy.Onaverage,subjectscompletedthe24Thefactthateyedominanceandambientillumination measurementtestinabout30minutes. affectedthepopulationresultisevidentfromthelog
Table1showstheageandsexdistributionofthe60 values,butthemagnitudeismodest.Whentestinga subjects.Resultsofthemultivariateanalysisshowedthat particularsubject,thepercentagecontrastvaluesforthe age(P .97)andsex(P .38)didnotinfluencethe meanandupper95%CIforallconditionsareidentical CTs.Thedifferencesbetweendominanteyeandnondominanteye,bright-lightandlow-lightambience,andopto- atagivenoptotypesizewith1exception(20/30,low typesizeswerestatisticallysignificant(all P .01).The light,dominanteye). directionofapproachtothresholdwasnotstatistically significant(P .28).
Basedonthemultivariateanalysisresults,12catego-
Discussion
TheLRSindustryhasrekindledinterestinpractical rieswereconstructedunderdifferentcombinationsof officeCTE,20 asubjectivetestthatdiffersfromhigh- eyedominance(2),ambientillumination(2),andoptocontrastvisualacuityinthatitcharacterizeshowwell typesize(3).TheShapiro-WilkandShapiro-Francia thevisualsystemperformsinacomplexenvironment Wtestscouldnotrejectthenullhypothesisthatthe composedofawiderangeoftargetsizesandluminance distributionsoftheCTswerenormalforallcombinalevels.Contrastthresholdevaluationdiffersfromobjec- tionsexceptthecombinationofdominanteye/lowlight/ tivetestssuchaswavefrontanalysisinthattheentire optotype20/50at .05. visualpathwayistested,includingtheopticalcompo-
Table2showsthemeanvaluesunderdifferent conditions.Overall,bright-lightambienceproducednentsoftheeye(corneaandlens)andthesensory
Table3.
BrightLight
LowLight
Valuesarepercentagecontrastrounded(upordown)tothenearestclinicallymeasurablevalue;valuesinparenthesesarethelog10 of percentagecontrast.
NORMALVALUESOFLETTER-RECOGNITIONCONTRASTTHRESHOLDS
Dominant Nondominant Dominant Nondominant Optotype Eye Eye Eye Eye 20/30 6%( 1.26) 6%( 1.24) 6%( 1.22) 6%( 1.20) 20/50 3%( 1.55) 3%( 1.55) 3%( 1.55) 3%( 1.52) 20/70 2%( 1.69) 2%( 1.65) 2%( 1.66) 2%( 1.64)
BrightLight LowLight
Upper95%CIlimitofthedistributionsofCTsforvariousconditions.
Dominant Nondominant Dominant Nondominant Optotype Eye Eye Eye Eye 20/30 6%( 1.24) 6%( 1.22) 6%( 1.20) 7%( 1.18) 20/50 3%( 1.54) 3%( 1.53) 3%( 1.56) 3%( 1.50) 20/70 2%( 1.67) 2%( 1.63) 2%( 1.64) 2%( 1.61)
CT contrastthreshold JCATARACTREFRACTSURG—VOL30,NOVEMBER2004 2379
NORMALVALUESOFLETTER-RECOGNITIONCONTRASTTHRESHOLDS
pathways(retina,opticnerve,opticradiations,andvi-a20/600orlargeroptotypeandmaintainthestandard displayrequirementof1optotypewidthofsurrounding sualcortex).Higher-orderopticalaberrationsinduced bythecornealablationthatdonotsignificantlydegradebackgroundonamonitorofpracticalsize.
Ghaithetal.4 concludethatCTsdonotcorrelate thepatient’sopticalperformancewouldalsonotaffect CTs.Maedaetal.21 reportthatlettercontrastsensitivitywithpatients’self-reportedsatisfactionafterLRS.They usedsine-wavegratingandlow-frequency(20/640)let- couldbepredictedbycornealtopographyregularity indiceswhennormalpatientsandpatientswithkerato-ters.Theirresultsmayindicatethatlow-frequency,letterrecognitionCTsaremeasuringapsychovisualfunction conuswhohad20/20bestcorrectedvisualacuitywere compared.Rabinandcoauthor22,23 believethatsmall-thathaslittledirectcorrelationwithsubjectivevision qualityafterLRS.Wethinkthatusingsmalleroptotypes letterCTEmightbeamorediscriminatingtestofvisual resolutionthanhigh-contrastvisualacuity.Rabin24 ismorerepresentativeofvisuallychallengingtaskssuch asreadingroadsignsatdusk.Forexample,a9.0cm demonstratedthatsmall-letterCTEwassensitiveto subtleamountsofopticaldefocus,makingitapoten-letter(35 8 inches)onastreetsign,whenviewedat200 feet(aboutonethirdofatypicalcityblock),wouldbe tiallyvaluablequantitativetoolforassessingvisionqualityafterrefractivesurgery. roughlyequivalenttoa20/20optotype.
AllourCTtestingwasphotopicbecausethemoni- Wedeterminednormalletter-recognitionCTsusingacommerciallyavailablevisiontestthatwasstraight-torluminancewashighandremainedconstantthroughoutthestudy.Wemeasuredlightfallingonthecomputer forwardtoadministerandeasyfornormalsubjects toperform,asevidencedby100%testabilityandthemonitortoensurethatthedegreeofmonitorglarefrom ambientroomlightswasconsistent.However,contrast amountoftimerequiredtocompletetheexperimental testsequenceof24measurements.Measurablediffer-testingcanbeconductedatotherlevelsofbackground luminance.Usingsine-wavegratingsonareflectingchart encesintheCTsvariedintheexpecteddirectionfor thevariouslettersizes(Table2).17,25 High-luminance,thatwasilluminatedatanintermediatelevel,Monte ´ sMico ´ andcoauthors9 foundastatisticallysignificant low-contrastvisualacuitytestingusingfront-illuminatedboardchartsshowsnoage-relateddeclineuntildecreaseinmesopiccontrastsensitivity6monthsafter laserinsitukeratomileusis(LASIK)forgratingfrequen- thesixthdecade.26 Althoughourstudydidnotattempt tomeasurelow-contrastvisualacuitythresholds,thatciesof12and18cyclesperdegree(cpd)(equivalent to20/50and20/32optotypes)butnotfor1.5,3,and wefoundnoage-relateddifferencesinCTatsmall optotypesizesisconsistentwiththisresearch.6cpd(equivalentto20/400,20/200,and20/100). UsingtheSKILLCard26 (alow-luminance,low-contrast Webelievethisisthefirststudytoinvestigatethe differenceinCTbetweendominantandnondominanttestwithblacklettersonadimgraybackground),young observersgenerallyloseabout3linesofvisualacuity eyes,whichwefoundtobeslight(differenceofthe meansbeing0.00to0.04logunitsbetterinthedomi-comparedwithhigh-contrast,high-luminanceacuity. Intermediate-andlow-luminanceletter-contrasttests nanteye)butstatisticallysignificantacrossanormal population.Thisfindingrequiresfurtherinvestigation.couldbegenereatedbyprogrammingtheeffectivemonitorluminancetospecificreducedlevelsandmaypro- Withsine-wavetesting,theregionofmaximum contrastsensitivityisfoundatlowgratingfrequenciesvideadditionalusefulinformationaboutCTchanges afterLRS. equivalenttooptotypesizesof20/200to20/600.However,undertypicalclinicalworkingdistances(distanceForLRS-relatedtestingbasedonourdata,theissue ofambientlightingdeservesadditionalcomment.Some betweenthepatientandthechart),usingthisletter-size rangewouldallowonly1or2optotypesperpresenta-commonlyusedtermstodescribelightlevelshavespecificmeaningsinpsychovisualtesting. Illuminance refers tiononacomputermonitororwouldrequireadjustmentoftheworkingdistancetolessthanthetypicaltotheamountoflightfallingonasurface. Luminance inthiscasereferstotheamountoflightcomingtoward minimumdistance;thismayinfluencelow-lightpupil diameter,aconcernwhichwillbeaddressedfurther.theeyefromasource;whenthesourceisaboardchart, thislightisviareflectancefromthechartsurface.For Formirroredexaminationroomsinwhichthedisplay isatopticalinfinity,itwouldbeimpossibletocreatethisreason,whenusingboardcharts,illumination,back-
JCATARACTREFRACTSURG—VOL30,NOVEMBER2004 2380
NORMALVALUESOFLETTER-RECOGNITIONCONTRASTTHRESHOLDS
groundcolor,workingdistance,andcleanlinessmustproachtothresholdwasnotsignificant,clinicaltesttime canbereducedby50%comparedtotheexperimental bestandardizedsoluminanceisconsistent.Forbackilluminatedchartsusinglightboxes,luminanceisdeter-protocolbytestinginthecustomarydirection(seento notseen)only;forpresumablynormalsubjects,testing minedbythelightbox,thetransmissionpropertiesof thechart,andtheworkingdistance.Clinicallyimpor-canbeginat10%contrastorlower,whichwillalso shortenthedurationoftheexamination.
tantvariationinhigh-contrastvisualacuitycanbe inducedwhenback-illuminatedchartsofvaryinglumi-Thisstudyusedonlyyoung,normalsubjectsand wasnotdesignedtodeterminethesensitivityorspecific- nanceareused;thisproblemmaybeexacerbatedin patientswhohavehadrefractivesurgeryproceduresityofthetestfordiseaseorpostoperativestates.Anecdotally,1individualwhohadhadLRSwasinadvertently (S.M.B.,personalobservation).
Whenconsideringtheentirestudypopulation,weenrolledandtested.Duringthetestingsequence,itwas quicklyevidentthattheresultswereatypicalandthe foundastatisticallysignificantincreaseinmeanCT underlow-lightillumination(Table2,parentheticallogsubjectwasquestioned,atwhichpointahistoryof LASIKwasobtained.(Thesubjectdidnotconsider values).However,clinicallythedifferencewaslessthan LASIKtobe“eyesurgery.”) 1%forallcategories,whichisunlikelytobefunctionally
Insummary,wehavedeterminednormalvalues relevantineverydaylife.Sincethedifferenceinlight foracommerciallyavailable,computer-basedtestof reflectedoffthemonitorwasprobablytrivialataworkhigh-luminance,small-optotype,letter-recognitionCTs. ingdistanceof17feet,thisincreaseislikelydueto Thetestwaseasytounderstandandperformbyinexpe- somechangeintheeye,possiblypupildiameterand/ riencedsubjects.Comparedwiththedetection-onlytask orthestateofretinaladaptation.25 Althoughwedidnot forsinusoidalgratingCTE,letter-recognitionCTEre- useastandardizeddark-adaptationroutineormeasure quiresdetectionplusperceptualseparationandthen pupildiameter,lowlight20/30testingwasperformed recognition.Itmaymorecomprehensivelyrepresentthe afterabout10minutesinthedark,whichissufficient functionofcontrastsensitivityineverydaylife.Cur- toelicitmaximumpupildilation.27 rently,noinformationonchangesinletter-recognition
PupilsizemayhaveagreatereffectonCTsin CTsafterLRSandtheirrelationshiptopatientvisual patientsafterLRSbecauseoflightscatterfromthe functionorsatisfactionexists.Suchstudiesareindi- blendzoneortheunablatedcornea.3,7 Itisrecognized cated,andwehopetheywillbeconductedwiththe thatlight-boxtestinginwhichdifferentchartshave introductionofthisfacilemethodofcontrast-sensitiv- unequalluminancelevelsmayconfoundinter-testand itytesting. inter-studycomparison,possiblybyintroducingpupil sizeasanunrecognizedbias7 (particularlywithshorter testingdistances).Monte ´ s-Mico ´ andcoauthors9 mea-
References
1.Monte ´ s-Mico ´ R,CharmanWN.Mesopiccontrastsensilevelsofmesopicluminance6monthsafterLASIK;a tivityfunctionafterexcimerlaserphotorefractivekeratectomy.JRefractSurg2002;18:9–13 5-minuteadaptationperiodwasperformedbeforeeach
suredsine-waveCTunderphotopicluminanceand3
2.Monte ´ s-Mico ´ R,CharmanWN.Choiceofspatialfre- measurement.Themeanpupildiametersvariedasexquencyforcontrastsensitivityevaluationaftercorneal pected;3.5mmforphotopicluminanceand6.1mm refractivesurgery.JRefractSurg2001;17:646–651 atthelowestluminance.High-frequencygratingcon-
3.HolladayJT,DudejaDR,ChangJ.Functionalvision trastwasreducedundermesopicconditions,whichthe andcornealchangesafterlaserinsitukeratomileusis authorsattributedtothegreaterdegreeofhigher-order determinedbycontrastsensitivity,glaretesting,andcoropticalaberrationspresentatlargerpupildiameters. nealtopography.JCataractRefractSurg1999;25: 663–669
Wesuggestthatbright-lightandlow-lighttesting
4.GhaithAA,DanielJ,StultingRD,etal.Contrastsensi- beperformedonLRSpatientswhoarefollowedlongitu- tivityandglaredisabilityafterradialkeratotomyand dinallywithCTE.Testdistanceandambientillumina- photorefractivekeratectomy.ArchOphthalmol1998; tionlevelsmustbestandardized,withadequatetime 116:12–18 allowedforretinaldarkadaptationandpupildilation
5.O’DayD.CommentonarticlebyGhaithAA,Daniel J,StultingRD,etal.Contrastsensitivityandglaredis- beforelow-lightmeasurements.Sincetheorderofap-
JCATARACTREFRACTSURG—VOL30,NOVEMBER2004 2381
NORMALVALUESOFLETTER-RECOGNITIONCONTRASTTHRESHOLDS
abilityafterradialkeratotomyandphotorefractivekera-ETDRScharts.InvestOphthalmolVisSci2001;42: 1226–1231 tectomy.JRefractSurg1998;14:361
19.FerrisFLIII,FreidlinV,KassoffA,etal.Relativeletter
7.BoxerWachlerBS,DurrieDS,AssilKK,KruegerRR.
6.Pe ´ rez-SantonjaJJ,SaklaHF,Alio ´ JL.Contrastsensitivity andpositiondifficultyonvisualacuitychartsfromthe afterlaserinsitukeratomileusis.JCataractRefractSurg EarlyTreatmentDiabeticRetinopathyStudy.AmJ 1998;24:183–189 Ophthalmol1993;116:735–740
20.HoffmanRS,PackerM,FineIH.Contrastsensitivity Roleofclearanceandtreatmentzonesincontrastsensiandlaserinsitukeratomileusis.IntOphthalmolClin tivity:significanceinrefractivesurgery.JCataractRefract 2003;43(2):93–100 Surg1999;25:16–23
21.MaedaN,SatoS,WatanabeH,etal.Predictionofletter
8.ChanJWW,EdwardsMH,WooGC,WooVCP.Con- contrastsensitivityusingvideokeratographicindices.Am trastsensitivityafterlaserinsitukeratomileusis;one-year JOphthalmol2000;129:759–763 follow-up.JCataractRefractSurg2002;28:1774–1779
22.RabinJ.Smalllettercontrastsensitivity:analternative
9.Monte ´ s-Mico ´ R,Espan ˜ aE,MenezoJL.Mesopiccontrast measureofvisualresolutionforaviationcandidates.Aviat sensitivityfunctionafterlaserinsitukeratomileusis. SpaceEnvironMed1995;66:56–58 JRefractSurg2003;19:353–356
23.RabinJ,WicksJ.Measuringresolutioninthecontrast
10.MutyalaS,McDonaldMB,ScheinblumKA,etal.Con- domain:thesmalllettercontrasttest.OptomVisSci trastsensitivityevaluationafterlaserinsitukeratomileu- 1996;73:398–403
24.RabinJ.Opticaldefocus:differentialeffectsonsizeand sis.Ophthalmology2000;107:1864–1867 contrastletterrecognitionthresholds.InvestOphthal-
11.BoxerWachlerBS,KruegerRR.Normalizedcontrast molVisSci1994;35:646–648 sensitivityvalues.JRefractSurg1998;14:463–466
25.BlommaertFJJ,TimmersH.Letterrecognitionatlow
12.Ma ¨ ntyja ¨ rviM,LaitinenT.NormalvaluesforthePellicontrastlevels:effectsoflettersize.Perception1987; Robsoncontrastsensitivitytest.JCataractRefractSurg 16:421–432 2001;27:261–266
26.EnochJM,WernerJS,Haegerstrom-PortnoyG,etal.
13.PelliDG,RobsonJG,WilkinsAJ.Thedesignofanew Foreveryoung:visualfunctionsnotaffectedorminimally letterchartformeasuringcontrastsensitivity.ClinVis affectedbyaging:areview.JGerontolABiolSciMed Sci1988;2:187–199 Sci1999;54:B336–B351
14.ReganD,GiaschiDE,FrescoBB.Measurementofglare
27.BrownSM,KhananiAM,XuKT.Daytodayvariability susceptibilityusinglow-contrastlettercharts.Optom ofthedark-adaptedpupildiameter.JCataractRefract VisSci1993;70:969–975 Surg2004;30:639–644
15.ReganD,NeimaD.Low-contrastletterchartsasatest ofvisualfunction.Ophthalmology1983;90:1192–1200
FromtheDepartmentofOphthalmologyandVisualSciences(Khanani, Brown)andtheDepartmentofHealthServicesResearchandManage-
16.ZhangL,PelliDG,RobsonJG.Theeffectsoflumiment(Xu),TexasTechUniversityHealthSciencesCenter,Lubbock, nance,distance,anddefocusoncontrastsensitivityas Texas,USA. measuredbythePelli-Robsonchart.Abstract58.Invest OphthalmolVisSci1989;30:406
17.GinsburgAP.VisualInformationProcessingBasedon partnerinM&S Technologies,USA. SpatialFiltersConstrainedbyBiologicalData.WrightPattersonAirForceBase,AirForceAerospaceMedical
SupportedbyagrantfromM&S Technologies,Chicago,Illinois, USA.SoftwaredesignedbyStevenNordstrom.Mr.Nordstromisa
Mr.Khananireceivedaresearchstipendattheconclusionofthestudy. Noauthorhasacommercialorproprietaryinterestinanyproductmen- ResearchLaboratory,1978 tioned.
18.CampariniM,CassinariP,FerrignoL,MacalusoC. ETDRS-Fast:implementingpsychophysicaladaptive RockefellerYoung,PhD,assistedwiththestudydesign,interimstatistical analysis,andmanuscriptreview. methodstostandardizedvisualacuitymeasurementwith
JCATARACTREFRACTSURG—VOL30,NOVEMBER2004 2382
M&SSmartSystemContrastSensitivityMeasurements ComparedWithStandardVisualFunctionMeasurements inPrimaryOpen-AngleGlaucomaPatients
JessicaL.Liu,BA,*w J.JasonMcAnany,PhD,* JacobT.Wilensky,MD,* AhmadA.Aref,MD,* andThasaratS.Vajaranant,MD*
Purpose: Toevaluatethenatureandextentoflettercontrastsensitivity(CS)deficitsinglaucomapatientsusingacommercially availablecomputer-basedsystem(M&SSmartSystemII)andto comparetheletterCSmeasurementstostandardclinicalmeasures ofvisualfunction.
Methods: Ninety-foursubjectswithprimaryopen-angleglaucoma participated.Eachsubjectunderwentvisualacuity,letterCS,and standardautomatedperimetrytesting(HumphreySITA24-2).All subjectshadabest-correctedvisualacuity(BCVA)of0.3logMAR (20/40Snellenequivalent)orbetterandreliablestandardautomated perimetry(fixationlosses,falsepositives,andfalsenegatives <33%).CSfunctionswereestimatedfromtheletterCSandBCVA measurements.TheareaundertheCSfunction(AUCSF),whichisa combinedindexofCSandBCVA,wasderivedandanalyzed.
Results: Themean(±SD)BCVAwas0.08±0.10logMAR (B20/25Snellenequivalent),themeanCSwas1.38±0.17,andthe meanHumphreyVisualFieldmeandeviation(HVFMD)was 7.22±8.10dB.LetterCSandHVFMDcorrelatedsignificantly (r =0.51, P <0.001).BCVAcorrelatedsignificantlywithletterCS (r = 0.22, P =0.03),butnotwithHVFMD(r = 0.12, P =0.26).Asubsetofthesubjectsample(B20%)hadmoderateto nofieldloss(r 6dBMD)andminimaltonoBCVAloss(r0.3 logMAR),buthadpoorletterCS.AUCSFwascorrelatedsignificantlywithHVFMD(r =0.46, P <0.001).
Conclusions: ThepresentstudyisthefirsttoevaluateletterCSin glaucomausingthedigitalM&SSmartSystemIIdisplay.Letter CScorrelatedsignificantlywithstandardHVFMDmeasurements, suggestingthatletterCSmayprovideausefuladjuncttestofvisual functionforglaucomapatients.Inaddition,thesignificantcorrelationbetweenHVFMDandthecombinedindexofCSand BCVA(AUCSF)suggeststhatthismeasuremayalsobeusefulfor quantifyingvisualdysfunctioninglaucomapatients.
KeyWords: contrastsensitivity(CS),primaryopen-angleglaucoma (POAG),areaundercontrastsensitivityfunction(AUCSF),M&S SmartSystemII(MSSS-II)
(JGlaucoma 2017;26:528–533)
ReceivedforpublicationSeptember2,2016;acceptedFebruary22, 2017.
Fromthe*DepartmentofOphthalmologyandVisualSciences, UniversityofIllinoisatChicago,Chicago,IL;and wSaintLouis University,St.Louis,MO.
SupportedbyNIHgrantsK23EY022949(T.S.V.)andEY001792 (UICDepartmentofOphthalmology).Komarek-Hyde-McQueen GlaucomaResearchFund.ADollyGreenSpecialScholarAward (J.J.M.)andanunrestricteddepartmentalawardfromResearchto PreventBlindness.
Disclosure:Theauthorsdeclarenoconflictofinterest.
Reprints:J.JasonMcAnany,PhD,DepartmentofOphthalmologyand VisualSciences,UniversityofIllinoisatChicago,1855WTaylorSt, Chicago,IL60612(e-mail:jmcana1@uic.edu).
Copyright r 2017WoltersKluwerHealth,Inc.Allrightsreserved. DOI:10.1097/IJG.0000000000000659
Glaucomaisaleadingcauseofirreversibleblindness.It isaninsidiousdiseasethatdamagesretinalganglion cells,whichresultsincharacteristicopticnerveandvisual fieldchanges.Itisestimatedthat B80millionindividuals willbeaffectedbyglaucomaby2020.Ofthose, B11million areexpectedtobebilaterallyblindfromglaucomaby 2020.1 Giventhesignificantlimitationsthatadvanceddiseaseplacesonindividualsandtheirqualityoflife,2–6 early detectionofglaucomaiscriticalsothattimelyinterventions canbemade.Althoughstandardclinicaltechniquesare routinelyusedtoassessvisualdysfunctioninpatientswho haveglaucoma,thereisaneedformoresensitivemethods toquantifyfunctionalabnormalities.Currently,standard automatedperimetry(SAP)ismostcommonlyusedinthe clinictoassessvisualfunction.Thereare,however,a numberoflimitationstoSAP.Forexample,thetest requiresconsiderablecooperationfromthesubject,as constantattentionandmaintainedfixationareneeded throughouttherelativelylengthytest.Lapsesofattention andfixationinstabilitycontributetohightest-retest variability.
Contrastsensitivity(CS),whichistheabilitytodetect smalldifferencesinluminance,isanessentialcomponentof visualfunctionanditiscorrelatedwithoverallqualityof life,7–12 targetidentificationinnaturalimages,13 driving, walking,andtheabilitytorecognizefaces.14 Ithasbeen suggestedthatfunctionalcomplaintsinsomeglaucoma patientswhohaverelativelygoodvisualacuity(VA)and minimalvisualfielddeficitsmayberelatedtocentralvisual fieldCSloss.15 MeasurementofCSusinglettertargetsisa promising,butunderutilized,approachtoassessingvisual functioninglaucoma.Previousreportshavedocumented CSlossesinglaucomapatients,eveninindividualswho haverelativelygoodVA.16 Furthermore,ourpreviouswork hasshownthatletterCSandSAPvisualfieldsensitivityare correlated,15 whichmaybeexpectedsincebothtestsassess CS.Thus,CScanbeausefulmeasureforquantifyingvisual functioninpatientswhohaveglaucoma.
MeasurementsofletterCSaremostcommonlyperformedwiththePelli-RobsonletterCSchart.17 Althoughthe Pelli-Robsoncharthasreceivedconsiderableuseby researchers,ithasnotbeenwidelyadoptedforroutineclinical use.Thereareanumberofpracticalreasonsforitslimited use,suchastherelativelylargesizeofthechart,whichmakes itdifficulttoilluminateevenlybystandardoverheadlighting. Furthermore,thechartfadesovertimeanditcanbedifficult tokeepcleanandfreeofdefects.Recently,M&STechnologiesInc.(Niles,IL)hasintroducedtheM&SSmart SystemII(MSSS-II)thatincludesacomputer-basedletterCS test.Thissystemhasthepotentialtoovercomesomeofthe limitationsofthePelli-Robsonchart,makingitmore
Copyright r 2017WoltersKluwerHealth,Inc.Allrightsreserved.
ORIGINAL STUDY 528 | www.glaucomajournal.com JGlaucoma Volume26,Number6,June2017
attractiveforregularclinicaluse.Forexample,thetestis conductedinadarkroomusingawall-mountedvideodisplay,whichlargelyobviatesroomlightinglimitations.Asthe samedisplayisusedforVAandCSmeasurements,thereisno needtochangedevicesorrelocatethesubjectduringtesting. Importantly,CSmeasurementswiththissystemhaveshown goodagreementwiththePelli-Robsonchart.4
Thus,thepurposeofthepresentstudywastodeterminetherelationshipsamongletterCS,assessedbythe MSSS-II,androutinemeasuresofvisualfunctionincluding VAandSAPinpatientswhohaveglaucoma.IfletterCS andSAPprovidesimilarinformationregardingfunctional lossesinglaucoma,thenCSmaybeusefulasasurrogate measureofvisualfunctionforglaucomapatientswho cannotreliablyperformSAP.Inaddition,theCSfunction (CSF),whichrelatesCStolettersize,wasapproximated fromtheletterCSandVAmeasurementsandthearea undertheCSF(AUCSF)wasderivedandcomparedwith SAPmeasurements.TheAUCSFhasbeenshowntobea useful1-numbermetric18 thatisjointlydependentonVA andlargeletterCS;however,toourknowledge,AUCSF hasnotbeenreportedinpatientswhohaveglaucoma.
Participants
METHODS
Thisprospectivestudyincludedsubjectswithadiagnosisofprimaryopen-angleglaucoma(POAG)whopresentedtotheIllinoisEyeandEarInfirmaryGlaucoma Service.TheeyewiththehighestHumphreyVisualField meandeviation(HVFMD)scorewasselectedfortesting (the“better-seeing”eye).POAGwasdefinedbythepresenceofopticnervedamageand/orvisualfieldlosswithout secondarycauses.Allsubjectswerenotedtohaveopen anglesongonioscopy.Eachsubjectvoluntarilyprovided informedwrittenconsentandthestudywasapprovedbyan InstitutionalReviewBoardattheUniversityofIllinoisat Chicago.
Allsubjectswere Z 18yearsofageandhadthe abilitytounderstandtheproceduresandawillingnessto complywiththestudy.Inclusioncriteriaincluded:(1) best-correctedVAof0.3logMARorbetter(equivalent to20/40orbetterSnellen);(2)pupils>4mm;(3)awellcontrolledIOP;(4)norecentophthalmicsurgerywithin 6months;and(5)areliableSAPtest(Humphrey24-2) withinthepast6months(fixationlosses,falsepositives, andfalsenegatives<33%).Thelensofeachsubjectwas gradedbyslitlampexaminationusingasubjectiveclinical scalethatrangedfromclearto4+.Subjectswithnuclear sclerotic,posteriorsubcapsular,orcorticallensopacities >1+,whichcorrespondstominimalcataract,were excluded.Inaddition,nosubjecthaddiabeticretinopathy, age-relatedmaculardegeneration,opticnervediseaseother thanglaucoma,evidenceofinfection,inflammation,or otherocularorsystemicconditionsknowntoaffectvisual function.
TestingProceduresandAnalysis
Eachpatientunderwentbest-correctedVA(BCVA) andCStestingonthesamedayusingtheMSSS-IIin accordancewiththeinstructionsprovidedbythemanufacturer.VAwasmeasuredbypresentingasingleletter fromtheSloansetanddecreasingthelettersizeaccording tothelogMARscale(0.1logunitsteps).ForCSmeasurements,thelettersizewassetto20/600,whichis
equivalenttothesizeofthelettersonthePelli-Robson chart.AsingleletterfromtheSloansetwasselectedat random,presented,andthesubjectwasaskedtoverbally identifytheletter.Thefirstletterpresentedwasatthe highestcontrastproducedbythedisplay(100%)andthe contrastwasdecreasedfollowingeachcorrectresponse (B0.1logunitsteps)untilthesubjectcouldnolonger correctlyidentifytheletterpresented.Ifasubjectanswered incorrectly,thecontrastwasincreasedby0.3logunitsto confirmacorrectanswerandthenthesubjectwastested againbyreducingthecontrastin B0.1logunitstepsuntil thesubjectansweredincorrectlyasecondtime.Thecontrastvalueforthelastcorrectresponsewasrecordedas contrastthreshold.
TheluminanceoftheMSSS-IIsystemwascalibrated usingaMinoltaLS-110luminancemeter(KonicaMinolta). Thedisplayluminancewassetto85cd/m2 andtheluminanceofthelettertargetswasmeasured.Contrastwas definedasWebercontrast:
ðLletter Lbackground Þ/Lbackground ð1Þ Lletter istheluminanceoftheletterand Lbackground isthe luminanceofthebackground.CSwasdefinedasthelogof 1/lettercontrastthreshold.Fortheparticulardisplayused inthepresentstudy,the g valuewassetto1.4throughthe softwareinterface,whichprovidedagoodcorrespondence betweenthenominalcontrastreportedbytheMSSS-IIand thecontrastderivedfromtheluminancemeasurements.
VisualfieldperimetrywasperformedusingtheHVF analyzerSITA24-2standardalgorithm(Humphrey InstrumentsInc.,CA).Thepresentanalysisutilizedthe meandeviation(MD)valuetogroupthesubjectsaccording totheseverityofthefieldloss:mild(MD Z 6dB)and advanced(MD< 6dB).19 TheeyewiththebetterHVF MDscorewasselectedforfurtherCStesting.Subjectswere alsosubdividedintosmallergroupsforanalysisbasedon theirHVFMDscores:1to 3, 3to 6, 6to 12, and 12to 32dB(nominally:no,mild,moderate,and severefieldloss,respectively).
TheCSFwasapproximatedbasedonthelargeletter CSvalueandtheBCVAvalueobtainedwiththeMSSS-II. Toaccomplishthis,amodeloftheCSFobtainedfrom previousresearchwasused.20 Thismodelassumesthatthe CSFmeasuredwithletterstimulihasthesamelow-pass shapeforallsubjects.Specifically,themodelpredictsthat CSisrelatedtolettersizebythefollowingfunction:
CS ¼ Af n e pf ð2Þ CS isthecontrastsensitivityatlettersize f(1/MAR), n governstheCSattenuationlowspatialfrequencies,and A and p areverticalandhorizontalscalingparameters.Inthe presentstudy, A and p werefreeparametersand n wasset to0.1,basedonpreviousfindings.20 ThisCSFmodelwas shiftedverticallyandhorizontallyonlog-logcoordinates (adjustingparameters A and p)tominimizethemeansquarederrorbetweenthemodelCSFandthemeasured datapoints(largeletterCSandBCVA).Theareaunder thiscurve(AUCSF)wasthenderived,asdescribedelsewhere.18 TheAUCSFisausefulsingle-numbermetricthat isjointlydependentonthesubject’slargeletterCSand BCVA.
RESULTS
Theanalysisincluded94eyesof94subjectswitha diagnosisofPOAG.Themeanageofthesubjectswas
JGlaucoma � Volume26,Number6,June2017 M&SSmartSystemContrastSensitivityMeasurement Copyright r 2017WoltersKluwerHealth,Inc.Allrightsreserved. www.glaucomajournal.com | 529 Copyright r 2017WoltersKluwerHealth,Inc.Allrightsreserved.
65years(range,38to88y).Fifty-onesubjects(54.3%)were AfricanAmerican,18(19.1%)werewhite,12(12.8%)were Hispanicand13(13.8%)wereclassifiedas“other”(the majorityofwhomwereAsian).Fifty-ninesubjects(63%) wereclassifiedashavingmildglaucoma(HVFMDloss <6dB)and35(37%)hadadvancedglaucoma(HVFMD loss>6dB).
Giventheinclusioncriteria,allsubjectsinoursamplehad BCVAof0.3logMAR(20/40Snellenequivalent)orbetter. Themean(±SD)BCVAforthesubjectsamplewas 0.08±0.10logMAR(approximateSnellenequivalentof20/ 25),themeanCSwas1.38±0.17,andthemeanHVFMD was 7.22±8.10dB.BCVAandlargeletterCSwerecorrelatedsignificantly(r = 0.22, P =0.03),butBCVAwasnot correlatedsignificantlywithHVFMD(r = 0.12, P =0.26).
Figure1AshowstheHVFMDvalueasafunctionof logletterCSforeachsubject.Theblacktrianglesrepresent subjectswithMDvaluesbetterthan 6dBandthered squaresrepresentsubjectswithMDvaluesworsethan 6dB;solidlinesarelinearregressionfitstothedata.The grayregionrepresentstheexpectedrangeofnormal,based
onpreviousfindings.4 Figure1Ashowsthattherangeof letterCSspannedafactorof B10(logCSvaluesof0.8to 1.8),whereastherangeofHVFMDwasmuchlarger, spanningafactorof>1000(1to 32dB).These2measureswerecorrelatedsignificantlywhencomparedforall subjects(r =0.51, P <0.001)andalsowhensubdivided intosubjectswithHVFMD Z 6dB(r =0.32, P =0.01) andHVFMD< 6dB(r =0.41, P =0.01).
Asanadditionalapproachtoexaminetherelationship betweenHVFMDandlargeletterCS,thesubjectswere furthersubdividedbasedonMDvaluesinto4groupsthat hadprogressivelygreaterfieldloss.Figure1Bshowsthe relationshipbetweenHVFMDandlogletterCSforthese4 groups.Linearregressionanalysiswasperformedforeach group,buttheslopeswerenotsignificantlydifferentfrom0. Consequently,regressionlineswithaslopeconstrainedto0 werefittoeachdataset(horizontalsolidlines).Theresults indicatethattherewerenosignificantcorrelationsbetween HVFMDandlargeletterCSwithinthesesubgroups. Greencircleswithinthewhitearea(totheleftofthegray normalrange)representsubjectswhohadrelativelygood VA(0.3logMARorbetter),minimaltonofieldloss (<3dB),buthadlowletterCS.
CSFsestimatedfromthelargeletterCSandVAmeasurementsareshowninFigure2.Inthisfigure,logCSis plottedasafunctionofloglettersize,withlettersize decreasingfromlefttoright.Theblacktriangles(Fig.2A) representthemeanCSFforsubjectswithMDloss<6dB, whereastheredsquaresrepresentthemeanCSFforsubjects withMDloss>6dB.Thefunctionsfittothedatarepresent themodeltemplatefortheletterCSF(Equation2).20 These meanCSFsshowthatthe2groupshaddifferentlargeletter CSvalues(leftdatapoints),despitesimilarVAvalues(right datapoints).Figure2BshowstheCSFsforthesubjects subdividedinto4groups,basedonHVFMD,asdiscussed above.ConsistentwiththepatternshowninFigure2A,the largeletterCSdecreasedsystematicallyastheHVFMDvalue decreased(greaterfieldloss),whereastheVAvaluesshowed greatersimilarityamongthe4groups.
FIGURE1. HVFMDasafunctionoflogletterCS.Dataareshown forsubjectswhohaveaHVFMDloss<6dB(triangles)andfor subjectswhohaveaHVFMDloss>6dB(squares)inpanelA.The linesrepresentlinearregressionfitstothedataasdescribedinthe text.PanelBreplotsthedatainAforsubjectsseparatedinto4 groups.ThelinesinBrepresentlinearregressionfitstothedata withslopesconstrainedto0,asdescribedinthetext.Thegray regioninbothpanelsrepresentsthenormalrangebasedon previousdata.CSindicatescontrastsensitivity;HVFMD,HumphreyVisualFieldmeandeviation.Figure1canbeviewedin coloronlineatwww.glaucomajournal.com.

Onthebasisofeachsubject’sCSF,theAUCSFwas derived.Figure3AshowstheHVFMDvalueasafunction oftheAUCSF.Overall,theAUCSFwascorrelatedsignificantlywithHVFMD(r =0.46, P <0.001).Thesubjects weregroupedintothosewhohadMDloss<6dB(black triangles)andthosewhohadMDloss>6dB(redsquares). TheAUCSFwasfoundtobecorrelatedsignificantlywith HVFMDforsubjectswhohada<6dBMDloss(r =0.38, P <0.01),butnotforsubjectswhohada>6dBHVFMD loss(r =0.23, P =0.18).Asinthepreviousplots,thesubjects werefurthersubdividedinto4groupsbasedontheirHVF MDvalues,whichwereplottedasafunctionofAUCSF inFigure3B.Linearregressionanalysiswasperformedfor eachgroupandtheslopeswerenotsignificantlydifferentfrom 0.Consequently,regressionlineswithaslopeconstrainedto0 werefittoeachdataset(horizontalsolidlines).Theresults indicatethattherewerenosignificantcorrelationsbetween HVFMDandAUCSFwithinthesesubgroups.
DISCUSSION
Thisstudyquantifiedtherelationshipsamongletter CS,assessedbytheMSSS-II,androutinemeasuresof visualfunctionincludingVAandSAPinsubjectswith glaucoma.AlthoughpreviousworkhasexaminedCSin glaucomapatientsusingavarietyoftests,15,21–23 thepresent
Liuetal JGlaucoma Volume26,Number6,June2017 530 | www.glaucomajournal.com Copyright r 2017WoltersKluwerHealth,Inc.Allrightsreserved. Copyright r 2017WoltersKluwerHealth,Inc.Allrightsreserved.
FIGURE2. EstimatedCSfunctions(CSFs)areshownforsubjects whohaveaHVFMDloss<6dB(triangles)andforsubjectswho haveaHVFMDloss>6dB(squares)inpanelA.TheCSFswere derivedfromapreviousmodel,asdescribedinthetext.PanelB showstheCSFsforsubjectsdividedinto4groupsbasedontheir HVFMDvalues.CSindicatescontrastsensitivity;HVFMD, HumphreyVisualFieldmeandeviation.Figure2canbeviewedin coloronlineatwww.glaucomajournal.com.

reportisthefirsttoevaluateCSusingthedigitalMSSS-II displaythathasrecentlybecomecommerciallyavailable.
WeshowthatthelargeletterCSmeasurementsassessed withtheMSSS-IIarecorrelatedsignificantlywithstandard HVFMDmeasurements,suggestingthatlargeletterCS maybeausefuladjuncttestofvisualfunctioninglaucoma patients.Inaddition,acombinedindexoftheVAandletter CSmeasurements(AUCSF)wasderivedandshownto correlatewithHVFMD.
TheMSSS-IIhasadvantagesoverstandardchartbasedCStests.Forexample,thedisplayisself-luminous, whichobviatesthedependenceonroomillumination.The MSSS-IIalsopermitsVAandCStobeassessedwiththe samedeviceataconstanttestdistance,whichreducestest
FIGURE3. HVFMDasafunctionofAUCSF.Conventionsareas inFigure1.AUCSFindicatesareaundercontrastsensitivityfunction;HVFMD,HumphreyVisualFieldmeandeviation.Figure3 canbeviewedincoloronlineatwww.glaucomajournal.com.
timeandincreasestheeaseofuse.Wenote,however,that calibrationisanimportantconsiderationintheuseof theMSSS-II.Althoughthedisplayiscalibratedbythe manufacturerfortestdistancetoensureaccurateVA measurements,luminancecalibrationtoensureaccurate CSmeasurementsisnotaseasilyachieved.Specifically, adjustmentofthedisplay’s g functionandmeasurementof letterandscreenluminancewithaphotometerwasrequired toensurethatthenominalcontrastvaluesreportedbythe displaywereaccurate.Furthermore,informaltestingwith differentMSSS-IIdisplaysindicatedthatthegamma adjustmentrequiredtobestmatchthenominalandmeasuredcontrastvaluesmayvaryamongdisplays.Nevertheless,whenproperlycalibrated,wefoundtheMSSS-IIto beauseful,easilyimplementedtestofletterCS.
RoutineCSmeasurementmaybeofvalueinassessing visualfunctioninglaucomapatients,giventhefindingof lowCSinpatientswhootherwisehadminimalornofield loss(<3dB)andrelativelygoodVA(0.3logMARor better).Althoughglaucomahastraditionallybeenthought toaffectperipheralvisualfunctioninitsearlystages,there isevidenceofalteredfoveal/parafovealfunctionas well.15,23,24 ReducedcentralfieldCSmay,atleastinpart, accountforsomeofthesubjectivecomplaintsofglaucoma patientswhohaveminimalfieldlossandrelativelygood VA.ThisspeculationisconsistentwiththefindingthatCS isbetterrelatedto“real-world”functionthanVAin patientswithearlystagesofglaucoma.25 LargeletterCS

JGlaucoma Volume26,Number6,June2017 M&SSmartSystemContrastSensitivityMeasurement Copyright r 2017WoltersKluwerHealth,Inc.Allrightsreserved. www.glaucomajournal.com | 531 Copyright r 2017WoltersKluwerHealth,Inc.Allrightsreserved.
measurementsmayalsobeofvalueincaseswherereliable HVFmeasurescannotbeobtained.HVFmeasurementis heavilydependentonpatientalertnessandcooperation. LargeletterCStestingsuchasvisualfieldperimetry,isa subjectivetestofvisualfunction,butletterCStestscanbe completedquicklyandmaybemorepatient-friendlythan visualfieldperimetry.
DespitetherelativeeaseofletterCStestingandits significantcorrelationwithHVFMD,letterCStestingmay notbeanidealapproachforearlydetectionofglaucoma. Thatis,patientswhohadgoodletterCShadHVFMD valuesthatrangedfrom0to 30dB.Conversely,patients whohadlowletterCScouldhavenormal(ornearlynormal)HVFMDvalues.Thissuggeststhatthesensitivityand specificityofletterCSfordetectingearlyglaucomawould berelativelypoor,consistentwiththefindingsofWoodand Lovie-Kitchin.26 Nevertheless,letterCSmeasurementsmay beusefulfor:(1)patientswhohavesubjectivecomplaintsof poorvisionandminimaltonoVAorHVFMDloss;(2) patientswhocannotreliablyperformSAP,asthereisa significantcorrelationbetweenHVFMDandletterCS, despitethevariation.
OneimportantlimitationofstandardletterCStestingis aninabilitytoprovideinformationaboutsensitivitylosses localizedtotheperipheralvisualfield,asletterCSistypicallya functionaltestofthecentralmacula.Similarly,theuseofHVF MDmaynotbeanidealmetricforquantifyingglaucomatous fieldloss,asthismeasurecanalso ignorelocalized defects.The goodcorrespondencebetweenCSand“real-world”function,25 notedabove,suggeststhatthereisvalueinCSmeasurementin glaucomapatients.Asecondlimitationtoconsideristhatboth letterCSandSAPcanbeaffectedbyfactorssuchasmedia opacity,pupilsize,andage.Toavoidpossibleeffectsofmedia opacity,subjectswhohadsignificantcataractswereexcluded fromthepresentstudy.Furthermore,asubanalysisshowedno significantdifferencesinletterCS(F =2.46, P =0.07)orHVF MD(F =1.47, P =0.23)amongpatientswhohaddifferent levelsoflensopacity(pseudophakic,clear,trace,1+).The effectsofpupilsizeonletterCSarealsolikelytobenegligiblein oursample,astherewasnosignificantcorrelationbetweenlog letterCSandpupildiameter(r =0.09, P =0.40)orHVFMD andpupildiameter(r =0.20, P =0.06).Similarly,agewasnot significantlycorrelatedwithletterCS(r = 0.18, P =0.07)or HVFMD(r = 0.03, P =0.75)inthissampleofsubjects.
TheMSSS-IIprovidesmeasuresofVAinaddition largeletterCS,whichpermitstheCSF,andtheAUCSF,to beestimated.Inthepresentstudy,theAUCSFwasfound tobecorrelatedwithHVFMDforsubjectswhohad moderatetonofieldloss(<6dBloss).VAandlargeletter CSwerealsosignificantlycorrelatedwithHVFMDfor thesesubjects,sothefindingthatAUCSFiscorrelatedwith HVFMDisexpected,asAUCSFisjointlydependenton VAandlargeletterCS.Conversely,forsubjectswith markedvisualfieldloss(HVFMDreductionof>6dB), AUCSFwasnotcorrelatedwithHVFMD.VAwasalso notcorrelatedwithHVFMDforthesesubjects,which likelyattributedtothenonsignificantrelationshipbetween HVFMDandAUCSF.Theglaucomasubjectsinour sampleallhadVAbetterthan0.3logMAR,whichlimited thepossibleamountofvariationinVAamongthesubjects. Itwouldbeofinteresttoevaluatetherelationshipbetween AUCSFandHVFMDinglaucomapatientswhohave largerVAlosses.Itwouldalsobeofinteresttoderivethe completeCSFusingtheMSSS-IIinpatientswhohave glaucomaandvaryingdiseasestages.TheAUCSFderived
inthepresentstudyisdependentontheassumptionthatthe shapeoftheCSFissimilarforallpatients.Althoughthis likelytobeareasonableassumption,themethodtoderive theAUCSFinthepresentstudywouldnotbesensitiveto selectivedeficits(“notches”)atspecificlettersizes.Future workisneededtocompletelydefinetheshapeoftheletter CSFinpatientswhohavedifferentstagesofglaucoma.
CONCLUSIONS
CStestingusingtheMSSS-IIcanbeperformed quickly,islessdemandingthanvisualfieldperimetry,and canbeeasilyincorporatedintoabusyclinicalpractice. Furthermore,forglaucomatouseyeswithVAof20/40or better,largeletterCSassessedwiththeMSSS-IIcorrelated significantlywithvisualfieldloss.Assuch,letterCStesting mayprovideausefulsupplementarymeasureofvisual function,particularlyforpatientsfromwhomreliablevisualfieldmeasurementscannotbeobtained.Futureworkis neededtodeterminetheextenttowhichlargeletterCSand theAUCSFareusefulforearlydetectionofglaucomaand forquantifyingtheprogressionoffunctionallosses.
REFERENCES
1.QuigleyHA,BromanAT.Thenumberofpeoplewith glaucomaworldwidein2010and2020. BrJOphthalmol.2006; 90:262–267.
2.GutierrezP,WilsonMR,JohnsonC,etal.Influenceof glaucomatousvisualfieldlossonhealth-relatedqualityoflife. ArchOphthalmol.1997;115:777–784.
3.ParrishRKII,GeddeSJ,ScottIU,etal.Visualfunctionand qualityoflifeamongpatientswithglaucoma. ArchOphthalmol.1997;115:1447–1455.
4.ChandrakumarM,ColpaL,ReginaldY,etal.Measuring ContrastSensitivityusingtheM&SSmartSystemIIversusthe Pelli-RobsonChart. Ophthalmology.2013;10:2160–2161.
5.ViswanathanAC,McNaughtAI,PoinoosawmyD,etal. Severityandstabilityofglaucoma:patientperceptioncomparedwithobjectivemeasurement. ArchOphthalmol.1999;117: 450–454.
6.OdbergT,JakobsenJE,HultgrenSJ,etal.Theimpactof glaucomaonthequalityoflifeofpatientsinNorway,II: patientresponsecorrelatedtoobjectivedata. ActaOphthalmol Scand.2001;79:121–124.
7.OwsleyC.Contrastsensitivity. OphthalmolClinNorthAm 2003;16:171–177.
8.MillsRP,JanzNK,WrenPA,etal.Correlationofvisualfield withquality-of-lifemeasuresatdiagnosisintheCollaborative InitialGlaucomaTreatmentStudy(CIGTS). JGlaucoma.2001; 10:192–198.
9.NelsonP,AspinallP,PapasouliotisO,etal.Qualityoflifein glaucomaanditsrelationshipwithvisualfunction. JGlaucoma.2003;12:139–150.
10.RossJE,BronAJ,ClarkeDD.Contrastsensitivityandvisual disabilityinchronicsimpleglaucoma. BrJOphthalmol.1984; 68:821–827.
11.JampelHD,SchwartzA,PollackI,etal.Glaucomapatients’ assessmentoftheirvisualfunctionandqualityoflife. JGlaucoma.2002;11:154–163.
12.RichmanJ,LorenzanaLL,LankaranianD,etal.Relationshipsinglaucomapatientsbetweenstandardvisiontests, qualityoflife,andabilitytoperformdailyactivities. OphthalmicEpidemiol.2010;17:144–151.
13.OwsleyC,SloaneME.Contrastsensitivity,acuity,andthe perceptionof“real-world”targets. BrJOphthalmol.1987;71: 791–796.
14.RubinGS,NgESW,Bandeen-RocheK,etal.Aprospective, population-basedstudyoftheroleofvisualimpairmentin
Liuetal JGlaucoma Volume26,Number6,June2017 532 | www.glaucomajournal.com Copyright r 2017WoltersKluwerHealth,Inc.Allrightsreserved. Copyright r 2017WoltersKluwerHealth,Inc.Allrightsreserved.
motorvehiclecrashesamongolderdrivers:theSEEstudy. InvestOphthalmolVisSci.2007;48:1483–1491.
15.WilenskyJ,HawkinsA.Comparisonofcontrastsensitivity, visualacuity,andHumphreyVisualFieldtestingpatientswith glaucoma. JGlaucoma.2003;12:134–138.
16.RichmanJ,LorenzanaLL,LankaranianD,etal.Importance ofvisualacuityandcontrastsensitivityinpatientswith glaucoma. ArchOphthalmol.2010;128:1576–1582.
17.PelliDG,RobsonJG,WilkinsAJ.Thedesignofanewletter chartformeasuringcontrastsensitivity. ClinVisSci. 1988;2: 187–199.
18.ApplegateRA,HilmantelG,HowlandHC.Areaunderlog contrastsensitivityfunction:Aconcisemethodoffollowing changesinvisualperformance.VisionScienceandIts Applications. TechnicalDigestSeries.1997;1:98–101.
19.HodappE,RichardK,ParrishII,etal. ClinicalDecisionsin Glaucoma.St.Louis,MO:Mosby;1993.
20.McAnanyJJ,AlexanderKR.Contrastsensitivityforletter optotypesvs.gratingsunderconditionsbiasedtowardparvocellularandmagnocellularpathways. VisionRes.2006;46:1574–1584.
21.ArdenGB,JacobsonJJ.Asimplegratingtestforcontrast sensitivity:preliminaryresultsindicatevalueinscreeningfor glaucoma. InvestOphthalmolVisualSci.1978;17:23–32.
22.PomeranceGN,EvansDW.Test-retestreliabilityoftheCSV1000contrasttestanditsrelationshiptoglaucomatherapy. InvestOphthalmolVisSci.1994;35:3357–3361.
23.LahavK,Levkovitch-VerbinH,BelkinM,etal.Reduced mesopicandphotopicfovealcontrastsensitivityinglaucoma. ArchOphthalmol.2011;129:16–22.
24.MarxMS,Bodis-WollnerI,LustgartenJS,etal.Electrophysiologicalevidencethatearlyglaucomaaffectsfoveal vision. DocOphthalmol.1987;67:281–301.
25.SzlykJP,TagliaDP,PaligaJ,etal.Drivingperformancein patientswithmildtomoderateglaucomatousclinicalvision changes. JRehabilResDev.2002;39:467–482.
26.WoodJM,Lovie-KitchinJE.Contrastsensitivitymeasurement inthedetectionofprimaryopenangleglaucoma.In:MillsRP, HeijlA,eds. PerimetryUpdate1990/1991Proceedingsofthe IXthInternationalPerimetricSocietyMeeting,June1990 Malmo,Sweden;1991.
JGlaucoma Volume26,Number6,June2017 M&SSmartSystemContrastSensitivityMeasurement Copyright r 2017WoltersKluwerHealth,Inc.Allrightsreserved. www.glaucomajournal.com | 533 Copyright r 2017WoltersKluwerHealth,Inc.Allrightsreserved.
RepeatabilityofanautomatedETDRScontrastthreshold measurement
YiPang1 ,LaurenSparschu1 andJingyunWang2
1IllinoisCollegeofOptometry,Chicago,Illinois,USA,and 2SUNYCollegeofOptometry,NewYork,NewYork,USA
Citationinformation: PangY,SparschuL,&WangJ.RepeatabilityofanautomatedETDRScontrastthresholdmeasurement. OphthalmicPhysiol Opt.2021.https://doi.org/10.1111/opo.12829
Keywords: contrastsensitivity,repeatability
Correspondence:JingyunWang
E-mailaddress:jwang@sunyopt.edu
Received:15September2020;
Accepted:5March2021
Abstract
ThistechnicalreportpresentstherepeatabilityofanautomatedEarly TreatmentDiabeticRetinopathyStudy(ETDRS)contrastthreshold(ETDRSCT)testinparticipants(N = 40)withnormalvisionaswellasinsubjects withreducedvisualacuity.TheautomatedETDRS-CTtestshowedgoodtestretestrepeatabilitybetweenthetwoadministrationsinbothnormaland reducedvisionparticipants.Measurementattheretestyielded0.05loghigher contrastsensitivitythanatthefirstmeasurement,whichmightbeduetoa learningeffectamongparticipants.
Introduction
Withrecentadvancesintechnology,computerisedtestsare commonlyusedtomeasurevisualfunction.Iftestdistance, luminanceandcontrastofthetestscreenarecarefullycalibratedandexternalglareislimited,computerisedequipmentcangenerateresultssimilartogoldstandardcharts.1 Severalcomputer-basedautomatedcontrastsensitivitytests havebecomeavailablecommercially,includingtheFreiburgVisualAcuityandContrastTest,2 theiPadtestoflettercontrastsensitivity,3 asmartphone-basedPeekContrast Sensitivitytest,4 andtheSpaeth/RichmanContrastSensitivityTest.5
ThecommerciallyavailableautomatedEarlyTreatment DiabeticRetinopathyStudycontrastthreshold(ETDRSCT)testisoneofthenewercomputerisedtests.Previously, wevalidatedanEDTRSlow-contrastletteracuitytest.6 The purposeofthisstudywastodeterminetherepeatabilityof anETDRS-CTtestinparticipantswithnormalvisionas wellasinsubjectswithreducedvisualacuity.
Methods
Thisresearchprotocolandtheinformedconsentforms wereapprovedbytheInstitutionalReviewBoardoftheIllinoisCollegeofOptometry(Chicago,Illinois,USA).The HealthInsurancePortabilityandAccountabilityAct(1996, USA)ruleswerefollowedduringthisstudy.

Participants
Participantswereenrolledfromanurbaneyeclinic,theIllinoisEyeInstitute(Chicago,Illinois,USA),whichprovides bothprimaryandsecondary/tertiaryeyecare.Informed consentwasobtainedfromallparticipants.
Eligibilityinclusioncriteria:(1)NormalGroup:high contrastbest-correctedvisualacuityof6/7.5orbetterin eacheye.(2)Reduced-visionGroup:highcontrastbestcorrectedvisualacuitybetween6/9and6/30inatleastone eye.Allparticipantswerecognitivecompetentadults.
Procedures
TheautomatedETDRS-CTtest(bothhardwareandsoftware,M&STechnologies,mstech-eyes.com)includesa laptopcomputerwithahigh-resolution33cm(13inch) displayandawirelesscontroltabletfortheexaminer.6 Thesystemiscalibratedforboththedistancetothesubjectandthenumberofpixelsperinch.Thecomputer screenwasauto-calibratedtoaluminancelevelof85candles/m2 withaphotometerforalltests.Thesizeofthe testletterswas6/30andthelettersweredarkerthanthe background.Thecontraststartedat10%anddecreased by0.1logunitsperstepwiththelowesttestedcontrast at0.4%.Participantswereencouragedtoreadthetestletterswithoutatimelimit.Iftheparticipantscouldnot readthelettersat10%contrastlevel,thenthetest
TECHNICALNOTE
© 2021TheAuthorsOphthalmicandPhysiologicalOptics © 2021TheCollegeofOptometrists 1 OphthalmicandPhysiologicalOpticsISSN0275-5408
increasedthecontrastby0.3logunitsuntiltheycould readthemtoobtainthestartinglevel.Thesameprotocol wasfollowedbydecreasingcontrastat0.1logunitsper step.Theendpointoffivetotalerrorshasbeenusedin previousstudies.7 Whentheparticipantswereunableto readanylettersonalinecorrectlyorwhenlowercontrastwasnotavailable,thetestwasstopped.Aftercompletionofthemeasurement,thetestoutcomeswere displayedonthecomputerwiththefollowingparameters: rightorlefteye,testdistance,contrastthresholdscoreas apercentage,contrastsensitivity(CS)inlogequivalent.
AllautomatedETDRS-CTtestswereconductedbythe sameexaminerinthesameroomat3mwhileparticipants woretheirhabitualrefractivecorrection.Contrastthresholdwasmeasuredintherighteyeofnormalvisionparticipants;inthereduced-visionsubjects,therighteyewas testedunlessvisualacuitylayoutsidetheenrolmentcriteria,inwhichcasethelefteye(N = 6)wastested.After45
( 15)minutes,allparticipantswereretestedwiththesame procedurebythesameexaminer.
Statisticalanalysis
Thecontrastscoreasapercentagewasconvertedtolog (1/contrastscore)(log(CS))units.Apairedt-testwasused tocomparetestandretest.Therepeatabilitybetweenthe twoautomatedETDRS-CTtestswasevaluatedwithBlandAltmananalysis,usingthe95%limitsofagreement,which correspondsto 1.96 * standarddeviationofthedifferencesbetweenadministrations.8 Thedifferencebetweenthe scoresforeachadministrationwascalculatedforeachparticipant.Thedistributionofthesedifferenceswasdescribed bythemean,standarddeviationandthe95%limitsof agreement(namely,thecoefficientofrepeatability).The breadthofthe95%limitsofagreementindicatesthe repeatabilityofthetest.Thenarrowerthelimitsofagreement,themorerepeatablethetest.Theaveragedifference betweentestandretestindicatestheaccuracyofthetest. Thecloserthebiastozero,themoreaccuratethetest.8 An independent t-testwasusedtocomparethemeancontrast scoreofthetestandretestbetweenthetwogroups.APearsoncorrelationbetweenthefirstcontrastthresholdtestand habitualvisualacuitythroughthehabitualrefractivecorrectionwasalsocalculated.Dataanalysiswasperformed usingR3.5.0statisticssoftware,including“blandr”and “irr”packages.(RFoundationforStatisticalComputing, R-project.org).
wereAfricanAmerican;80%ofparticipantswerefemale. Reducedvisionresultedfromuncorrectedrefractiveerror (N = 8),degenerativemyopia(N = 3),opticatrophy (N = 3),cystoidmacularoedema(N = 1),diabetic retinopathy(N = 1),oculocutaneousalbinism(N = 1), wetage-relatedmaculardegeneration(N = 1),primary openangleglaucoma(N = 1),Stargardtdisease(N = 1)or strabismicamblyopia(N = 1).Thetimetotestoneeyevariedbetween3and10mininthisgroup.
TherepeatabilityoftheETDRS-CTtestisshownin Figure1,wherethetest-retestdifferenceisplottedasafunctionofthemeanoftwoadministrationsusingtheBlandAltmanmethod.Themean(SD)firstandsecondETDRSCTtestresultswere1.18 0.46log(CS)and1.23 0.44 log(CS),respectively.Theaveragedifferencebetweentest andretestwas 0.05log(CS),i.e.,halfalineor2.5letters betteronretest,withastatisticallysignificantdifference (paired t-test: t = 3.27,df = 39, p = 0.002).The95% limitsofagreementbetweentestandretest,orthecoefficientofrepeatability(CoR),was 0.18log(CS). Figure1 showscomparisonbetweenthenormalandreduced-vision groupasaBland-Altmanplot.Therewasasignificantdifferencebetweenthetwogroups(Normal:1.52 0.17, Reducedvision:0.91 0.43log(CS), t = 5.97,df = 27, p < 0.001).Additionally,therewasasignificantcorrelation betweenthefirstETDRS-CTtestresultinlogunitsandthe habitualvisualacuity(0.20 0.25logMAR)(R = 0.86, t = 10.36, df = 38, p < 0.001).
Discussion
Tothebestofourknowledge,thisisthefirststudytoinvestigatetherepeatabilityoftheETDRS-CTtest.Wefound
Table1. Demographiccharacteristicsoftheparticipants(N = 40)
Results
Atotalof40participantsweretested,including21inthe reduced-visiongroupand19inthenormalgroup. Table1 showsthebasiccharacteristicsoftheparticipants.Overhalf
NumberofParticipants(%) VisualAcuity Normal(6/7.5orbetter) 19(48) ReducedVision(6/9to6/30) 21(52) Range(logMAR) 0to0.7 Mean(StandardDeviation,logMAR)0.2(0.3) Gender Female 32(80) Male 8(20) Race Black 22(55) Hispanic 7(18) White 8(20) Asian 3(8) Age(years) Range 22.2–75.0 Mean(StandardDeviation) 47.6(13.8) © 2021TheAuthorsOphthalmicandPhysiologicalOptics © 2021TheCollegeofOptometrists 2 AutomatedETDRScontrastthreshold YPang etal
thatthistesthadgoodrepeatabilitywith95%limitsof agreementof 0.18inbothnormalandreducedvision participants.Inaddition,contrastsensitivitytestedwith ETDRS-CTcorrelatedsignificantlywithhabitualvisual acuity.
Kollbaum etal.reportedthatboththeiPadandFreiburg computerisedtestsdemonstratedbettercontrastsensitivity valuesthanthePelli-Robsonchart.3 Theycomparedthe iPad,Pelli-RobsonandFreiburgtests,finding95%limitsof agreementof 0.24, 0.23and 0.21,respectively.3 Habtamu etal.reported95%limitsofagreementforthesmartphone-basedPeekContrastSensitivitytestof 0.30.4 The 95%limitsofagreementinthepresentstudywas 0.18, whichisslightlybetterthantheseprevioustwoinvestigations.Dougherty etal.reportedgoodrepeatabilityofthe MarsLetterContrastSensitivityTest(95%LoAof 0.20) andexcellentagreementwiththePelli-Robsontest(95% LoAof 0.21).9 Theirresultiscomparabletothefindings ofthisinvestigation,whichindicatethattheETDRS-CT testisarelativelypreciseautomatedtest.Retestingofthe ETDRS-CTyieldedmeanfindings0.05log(CS)higher(2.5 lettersmore)thanthefirsttest.Similarly,theiPadretest resultswere0.04log(CS)higherthanthefirsttest.3 Kollbaum etal.reportedthatachangeof0.25log(CS)wasclinicallymeaningfulfortheiPadtestofcontrastsensitivity basedontheir95%limitsofagreement.3 Ourfindingsindicatedthatachangeof0.20log(CS)couldberegardedas beingclinicallymeaningfulfortheautomatedETDRS-CT testbasedonthe95%limitsofagreement.
Previously,wereportedthatpatientswithamblyopia associatedwithmyopicanisometropiahadsignificantly reducedcontrastsensitivityatthemiddleandhigherspatial frequencies.10 Althoughacontrastsensitivityfunctiontest measuresanindividual’scontrastsensitivitythoroughly,it
isalongprocedurewhichmaypresentsomeobstaclesin routineclinicalapplication.TheautomatedETDRS-CT test,whichrequiresminimumeffortfromtheparticipants andlessclinicaltestingtimemayhaveabroaderapplicationinbothclinicalcareandexperimentaltrials.
Limitations
Thereareatleastfourlimitations:(1)Ourstudyemployed monoculartestingonly.Afuturestudyiswarrantedto measurerepeatabilityoftheautomatedETDRS-CTtest binocularly.(2)Anyagerelationshipwithtestingwasnot investigatedduetoalimitednumberofparticipantsindifferentagecategories.(3)Duetothesizelimitationofthe computerscreenandEDTRStestprotocol(5lettersina row),thelargestlettersizepossibleis6/30.Forindividuals withvisualacuitypoorerthanthisvalue,ashortenedtest distancemustbeusedtodeterminetheCSthreshold.(4) WedidnotcomparetheETDRS-CTtestwiththePelliRobsonchartbecausetheyarenotdirectlycomparable basedontestdistanceandlettersize.ThePelli-Robson chartisdesignedtobeusedat1mwithlettersizeof1/34 (6/204),whiletheautomatedETDRS-CTtestwasdesigned tobeusedat3mwithlettersizeof6/30.
Significance
TheautomatedETDRS-CTtesthasseveraladvantages: consistentluminance,reducedchanceofindividualsmemorisingtestlettersandconvenientandaccuratecontrast thresholdreportingfunctionstoavoidhumanrecording errors.AlthoughtheautomatedETDRS-CTtestmight reportaslightlyhighercontrastsensitivityvalueatretest (halfalineor2.5lettersbetter),thischangeisnotclinically
firstadministration(secondminusfirst,inblack)ofeachindividualisplottedagainstthemeanofthetwotests,while 1.96SDisplottedinblue.CoR ( 0.18)ismarked.Theblacktrianglesindicatethenormalsubjects,whiletheredcirclesymbolsindicatethereducedvisiongroupparticipants.The finedashedlinesshowthe95%CIforthemeanandSD,respectively.Onedarkersymbolindicatesrepeateddatafromtwoindividuals.
© 2021TheAuthorsOphthalmicandPhysiologicalOptics © 2021TheCollegeofOptometrists 3 YPang etal AutomatedETDRScontrastthreshold
Figure1. RepeatabilityoftheautomatedcontrastthresholdtestshownasaBland-Altmanplot.Themeandifferencebetweenthesecondandthe
significantandmayduetoalearningeffect.Itisstillcontroversialwhetherthelearningeffectinfunctionaltestsis significant,withstudiesreportingalearningeffectinautomatedperimetry11,12 whileothersreportingnolearning effectinpulsarperimetry.13 Consideringitsadvantages,this testmaybeaviablealternativetothePelli-Robsonchartin bothclinicalpracticeandresearch.
Conclusion
TheautomatedETDRScontrastthresholdtestshowed goodtest-retestrepeatabilitybetweentwoadministrations inbothnormalandreducedvisionparticipants.Measurementattheretestyielded0.05log(CS)highercontrastsensitivitythanatthefirstmeasurement,whichmightbedue toalearningeffectamongstparticipants.
Funding
ThisstudywassupportedbyM&STechnologies(M&S Technologiesprovideresearchequipmentandcompensationtostudysubjects).
Conflictofinterest
Theauthorsreportnoconflictsofinterestandhavenoproprietaryinterestinanyofthematerialsmentionedinthis article.
Authorcontributions
YiPang: Conceptualization(lead);Datacuration(equal); Formalanalysis(supporting);Fundingacquisition(equal); Investigation(equal);Methodology(equal);Projectadministration(equal);Resources(equal);Software(equal); Supervision(equal);Validation(equal);Visualization (equal);Writing-originaldraft(supporting);Writing-review&editing(supporting). LaurenSparschu: Datacuration(lead);Investigation(equal);Methodology(equal); Projectadministration(equal);Validation(equal);Writing-originaldraft(supporting). JingyunWang: Conceptualization(supporting);Formalanalysis(lead);Investigation (equal);Methodology(supporting);Software(equal);Visualization(lead);Writing-originaldraft(lead);Writing-review&editing(lead).
References
1.PangY,SparschuL&NylinE.ValidationofanautomatedETDRSnearandintermediatevisualacuitymeasurement. ClinExpOptom 2019;103:663–667.
2.BachM.TheFreiburgvisualacuitytest-automaticmeasurementofvisualacuity. OptomVisSci 1996;73:49–53.
3.KollbaumPS,JansenME,KollbaumEJ&BullimoreMA. ValidationofaniPadtestoflettercontrastsensitivity. OptomVisSci 2014;91:291–296.
4.HabtamuE,BastawrousA,BolsterNM etal.Development andvalidationofasmartphone-basedcontrastsensitivity test. TranslVisSciTechnol 2019;8:13.Availableat:https:// tvst.arvojournals.org/article.aspx?articleid=2751399. AccessedApril15,2021
5.FariaBM,DumanF,ZhengCX etal.Evaluatingcontrast sensitivityinage-relatedmaculardegenerationusinganovel computer-basedtest,theSpaeth/Richmancontrastsensitivitytest. Retina 2015;35:1465–1473.
6.PangY,SparschuL,NylinE&WangJ.Validationofan automatedearlytreatmentdiabeticretinopathystudylowcontrastletteracuitytest. OptomVisSci 2020;97:370–376.
7.RavikumarA,MarsackJD,BedellHE etal.Changeinvisual acuityiswellcorrelatedwithchangeinimage-qualitymetricsforbothnormalandKeratoconicWavefronterrors. J Vis 2013;13:28.Availableat:https://jov.arvojournals.org/ article.aspx?articleid=2193847.AccessedApril15,2021
8.BlandJM&AltmanDG.Statisticalmethodsforassessing agreementbetweentwomethodsofclinicalmeasurement. Lancet 1986;1:307–310.
9.DoughertyBE,FlomRE&BullimoreMA.Anevaluationof theMarslettercontrastsensitivitytest. OptomVisSci 2005; 82:970–975.
10.PangY,AllenM,RobinsonJ&FrantzKA.Contrastsensitivityofamblyopiceyesinchildrenwithmyopicanisometropia. ClinExpOptom 2019;102:57–62.
11.AydinA,KocakI,AykanU etal.TheinfluenceofthelearningeffectonautomatedperimetryinaTurkishpopulation. JFrOphtalmol 2015;38:628–632.
12.WildJM,Dengler-HarlesM,SearleAE etal.Theinfluence ofthelearningeffectonautomatedperimetryinpatients withsuspectedglaucoma. ActaOphthalmol(Copenh) 1989; 67:537–545.
13.SalvetatML,ZeppieriM,ParisiL etal.Learningeffectand test-retestvariabilityofpulsarperimetry. JGlaucoma 2013; 22:230–237.
© 2021TheAuthorsOphthalmicandPhysiologicalOptics © 2021TheCollegeofOptometrists 4 AutomatedETDRScontrastthreshold YPang etal
THANK YOU For more information please call 1-847-763-0500
