


2022 – 2025 Mountain Health Network Community Health Needs Assessment RESILIENCY RELIABILITY RELATIONSHIPS


Our Commitment to Community Health 5
Executive Summary 6
CHNA Leadership 6
Community Engagement 6
Methodology 6
Community Health Priorities 7
Board Approval 7
Mountain Health Network Service Area 8 Service Area Population Statistics 9
A Closer Look at Health Statistics 21
Social Determinants of Health 26
Understanding Health Equity 27
Food Insecurity 31 Housing 33 Digital Divide 38
Illuminating Health Inequities 39
Life Expectancy 45
Community Building Activities 47
COVID-19 Impact on Communities 50
Evaluation of Health Impact 2019-2022 Community Health
Improvement Plan Progress 62
2022-2025 Priority Health Needs 68
Behavioral Health 71 Substance Use Disorder 78


CHH Evaluation of Health Impact 2019-2022 86
CHH Evaluation of Health Impact 2019-2022
SMMC Evaluation of Health Impact 2019-2022 90
2022-2025 Community Health Improvement Plan 93 Behavioral Health 93 Substance Use Disorder 94 2022-2025 Priority Health Needs Chronic Disease Prevention and Management 96 Obesity and Diabetes 98 Heart Disease 102 Cancer 104 Respiratory Disease 106 Aging Population 107 Food Insecurity 111
CHH Evaluation of Health Impact 2019-2022 112 SMMC Evaluation of Health Impact 2019-2022 115 2022-2025 Community Health Improvement Plan 118
Chronic Disease Prevention and Management 118 Aging Population 119 Food Insecurity 120
Appendix A: Key Informant Survey 122
Appendix B: Community Survey 136

Appendix C: Focus Groups 142
Appendix D: Public Health Secondary Data References 150


Appendix E: 2022-2025 Community Health Improvement Plan: MHN Implementation Strategy 152
TABLE OF CONTENTS MHN Implementation Strategy 152
2022-2025 MOUNTAIN HEALTH NETWORK COMMUNITY HEALTH NEEDS ASSESSMENT 3
MOUNTAIN HEALTH NETWORK


OUR MISSION
To improve the well-being of all we serve through understanding, respecting and meeting their health needs.

OUR VISION
To create a world-class health system that delivers compassionate and innovative care enhanced by education, research and technology.
4 2022-2025 MOUNTAIN HEALTH NETWORK COMMUNITY HEALTH NEEDS ASSESSMENT
OUR COMMITMENT TO COMMUNITY HEALTH


I am proud to call this community home. I grew up here, attended school here and continue to practice medicine here. One of the things I have always appreciated about our community is its resilience. The last two years have tested our resilence.
But when fighting a global pandemic like nothing we had ever seen before, that resilience went to an entirely new level. I am inspired by the Mountain Health Network team as it overcame every COVID-19 challenge. Each day staff put their personal concerns aside to provide medical treatment and compassion to patients.

We knew our community was counting on us during the pandemic. And we responded, providing testing, vaccines, treatments, information, and other resources. But being a highly reliable health care organization means responding to the greatest health care needs of our community every day and not just during a pandemic. We were there during COVID-19 and we continue to be here addressing our region’s most important health issues. Community health priorities like behavioral health, substance use disorder and chronic disease prevention and management require a renewed focus, as COVID-19 wanes.
But we cannot do this alone. Relationships with key community organizations form the backbone of our efforts, and so we are very thankful for others who share our commitment to the health of the people of our region. Working together, we can make a true difference in the lives of those we serve.
As part of our efforts, I am pleased to share with you the 2022-2025 Community Health Needs Assessment (CHNA). A comprehensive look at our three-state service area, the CHNA acts as our guide to help us align our priorities with our community’s greatest health care needs. A tremendous amount of work went into the following pages, and I thank everyone, including our partners in the community, who participated in the process.


While this assessment is completed, we are just beginning. We will remain resilient to our commitment to improve the health and well-being of all we serve; we will continually assess our services to provide high quality care on which the region can rely; and we will continue to build important partnerships. All these things we will do to strengthen the most important relationship we have — the one with our community. We look forward to working together to improve the quality of life for our entire region.
Sincerely,

 Kevin Yingling, RPh, MD, FACP

 CEO, MHN and President, CHH and SMMC
2022-2025 MOUNTAIN HEALTH NETWORK COMMUNITY HEALTH NEEDS ASSESSMENT 5
2022 CHNA EXECUTIVE SUMMARY


CHNA Leadership
The 2022 CHNA was conducted as a collaborative effort between Cabell Huntington Hospital (CHH) and St. Mary’s Medical Center (SMMC), with wide representation of local and regional partners. The goal of this collaboration was to identify common and unique challenges across the service area and align health improvement strategies.

The 2022 CHNA was overseen by a planning committee of representatives of CHH and SMMC. These individuals served as liaisons to their organizations and the communities served by their entities.
Our Research Partner


Mountain Health Network (MHN) contracted with Community Research Consulting to conduct the CHNA. CRC is a woman-owned business that specializes in conducting stakeholder research to illuminate disparities and underlying inequities and transform data into practical and impactful strategies to advance health and social equity. CRS’s interdisciplinary team of researchers and planners have worked with hundreds of health and human service providers and their partners to reimagine policies and achieve measurable impact. Learn more about that work at buildcommunity.com.


Community Engagement

Community engagement is a key component of assessing and responding to community health needs. CHNA research included participation by representatives from the Cabell-Huntington Health Department, health and social service providers, advocacy agencies, business community representatives, and other community partners. These individuals provided wide perspectives on health trends, expertise about existing community resources available to meet those needs, and insights into service delivery gaps that contribute to health disparities.
Methodology
The 2022 CHNA research was conducted from September 2021 to May 2022 and included quantitative research methods and community conversations to determine health trends and disparities affecting residents. Through a comprehensive view of statistical health indicators and community stakeholder feedback, a profile of priority areas was determined. The findings will guide health care services and health improvement efforts, as well as serve as a community resource for grant making, advocacy, and to support the many programs provided by health and social service partners.
2019-2022 Mountain Health Network Community Health Needs Assessment Sunrise on the Ohio River6 2022-2025 MOUNTAIN HEALTH NETWORK COMMUNITY HEALTH NEEDS ASSESSMENT
The following research methods were used to determine community health needs:


• An analysis of existing secondary data sources, including public health statistics, demographic and social measures, and health care utilization
• An online Key Informant Survey with community representatives to solicit information about local health needs and opportunities for improvement
• An online Community Survey with patients and community residents to better understand health care access barriers and experiences
• Focus groups with residents and health and social service partners to explore social determinants of health and COVID-19 impacts on the community and identify opportunities to advance collaborative health improvement initiatives
Board Approval
The 2022 CHNA was conducted in a timeline to comply with IRS Tax Code 501(r) requirements to conduct a CHNA and develop a corresponding Community Health Improvement Plan (CHIP) every three years as set forth by the Affordable Care Act (ACA). The research findings and plan will be used to guide community benefit initiatives for MHN and engage local partners to collectively address identified health needs.
MHN is committed to advancing initiatives and community collaboration to support the issues identified through the CHNA. The 2022 CHNA report and CHIP were presented to the MHN Board of Directors and approved in September 2022.

Following the Board’s approval, the CHNA report and CHIP were made available to the public via the hospital websites cabellhuntington.org, st-marys.org and mountainhealthnetwork.org
Community Health Priorities
It is imperative to prioritize resources and activities toward the most pressing and cross-cutting health needs within our community. In determining the issues on which to focus efforts over the next three-year cycle, MHN collected feedback from community partners and sought to align with community initiatives. MHN will focus efforts on the following community health priorities over the next three-year cycle:
• Behavioral health


• Substance use disorder
• Chronic disease prevention and management

• Aging population
• Food insecurity
Underlying these priorities are the cross-cutting issues of social determinants of health and disparities in access to care. In developing the 2022-2025 Implementation Plan, MHN sought to prioritize strategies that address these underlying issues to promote an upstream, preventive approach to community health improvement.
The goal of this collaboration was to identify common and unique challenges across the service area and align health improvement strategies.
2022-2025 MOUNTAIN HEALTH NETWORK COMMUNITY HEALTH NEEDS ASSESSMENT 7
MHN SERVICE AREA DESCRIPTION
Mountain Health Network is a West Virginia-based not-for-profit health delivery system that includes two hospital locations: Cabell Huntington Hospital, a 303-bed teaching hospital for Marshall University Schools of Medicine, Pharmacy, and Nursing, and St. Mary’s Medical Center, a 393-bed teaching hospital that operates St. Mary’s Schools of Nursing, Respiratory Care, and Medical Imaging.


The two hospitals primarily serve residents in 20 counties spanning West Virginia, southern Ohio, and eastern Kentucky, as shown in the map to the right. For purposes of the CHNA, MHN further defined primary service area zip codes based on inpatient volumes for both CHH and SMMC. The zip code service area includes 49 zip codes in and around Huntington, West Virginia, the location of both medical facilities.
Service Area Counties
West Virginia: Cabell, Wayne, Lincoln, Mason, Putnam, Kanawha, Mingo, Logan, Boone, and Raleigh

Kentucky: Boyd, Carter, Greenup, Johnson, Lawrence, and Martin
Ohio: Lawrence, Gallia, Meigs, and Scioto


 Mountain Health Network Primary & Secondary Service Area
8 2022-2025 MOUNTAIN HEALTH NETWORK COMMUNITY HEALTH NEEDS ASSESSMENT
Demographics
& HEALTH STATISTICS


Service Area Population Statistics
7.4% in the U.S. overall. West Virginia also saw population decline of 3.2%, while Kentucky moderate population growth of approximately 2-4%. Within the MHN service area, Putnam West Virginia and Lawrence County in Kentucky were the only counties to see population estimated at 3.5% and 2.7% respectively.
Demographics
SERVICE AREA POPULATION STATISTICS
2020 Total Population Total Population Percent Change Since 2010
MHN Service Area 914,756 5.3%
Since 2010, the MHN service area saw population decline of 5.3% compared 7.4% in the U.S. overall. West Virginia also saw population decline of 3.2%, moderate population growth of approximately 2 4%. Within the MHN service West Virginia and Lawrence County in Kentucky were the only counties to estimated at 3.5% and 2.7% respectively.
Kentucky 4,505,836 +3.8%
Ohio 11,799,448 +2.3%
Since 2010, the MHN service area saw population decline 5.3% compared to population growth of 7.4% in the US overall. West Virginia also saw population decline of 3.2%, while Kentucky and Ohio saw moderate population growth of approximately 2-4%. Within the MHN service area, Putnam County in West Virginia and Lawrence County in Kentucky were the only counties to see population growth, estimated at 3.5% and 2.7% respectively.
West Virginia 1,793,716 3.2%
2020 Total Population Total Population Percent Change Since 2010
United States 331,449,281 +7.4%
MHN Service Area 914,756 5.3%


Source: US Census Bureau, Decennial Census
Kentucky 4,505,836 +3.8%
Ohio 11,799,448 +2.3%
West Virginia 1,793,716 3.2%


Consistent with state and national benchmarks, population growth within the MHN service area occurred exclusively among non-White individuals.
From 2010 to 2020, the White population declined 8.3%. The largest population growth was seen among multiracial (+22,703 people) and other race (+2,505 people) individuals. Despite increasing diversity, the MHN service area and the Tri-State region overall continue to reflect a majority White population. Of note, the Black/African American population also declined in the MHN service area, contrary to state and national trends.
When viewed at the county-level, the most diverse communities within the MHN service area include Kanawha and Raleigh counties in West Virginia, where 12% of residents identify as non-White.

Many Roads Lead to Home
The MHN service area and the Tri-State region are home to proportionately fewer immigrants than the nation overall. Nearly 99% of service area residents were born in the US compared to a national average of 85%. Consistent with this finding, few service area residents speak a primary language other than English. Additionally, fewer than 1% of households in any county are considered linguistically isolated. Linguistically isolated households are defined as persons who cannot speak English at least ”very well” or who do not live in a household where an adult speaks English ”very well.”
United States 331,449,281 +7.4%


2010-2020 Population Change by County
Source: US Census Bureau, Decennial Census
Source: US Census Bureau, Decennial Census
2010-2020 Population Change by County
2010-2020 Population Change by County
Lawrence
Consistent with state and national benchmarks, population growth within the MHN
Putnam
Lawrence
2022-2025 MOUNTAIN HEALTH NETWORK COMMUNITY HEALTH NEEDS ASSESSMENT 9
SERVICE AREA DESCRIPTION
Consistent with state and national benchmarks, population growth within
overall
2020 Population by


Age


Health needs change as individuals age. Therefore, the age distribution of a community impacts its social and health care needs. The age distribution and median age of the MHN service area is similar to West Virginia overall and older than the nation. Approximately 19% of service area residents are aged 65 or older compared to 15.6% nationwide.

The proportion of older adult residents increased across the MHN service area, Tri-State region and the nation. Nationally, among older adults aged 65 or older, the 65-74 age category is the fastest growing demographic, largely due to the aging of the baby boomer generation.

While the older adult population increased in the MHN service area, youth under age 18 comprise nearly 1 in 4 residents. This finding reinforces the potential impact of upstream, preventive initiatives.

10 2022-2025 MOUNTAIN HEALTH NETWORK COMMUNITY HEALTH NEEDS ASSESSMENT
Mountain Health Network 2022 CHNA 3
continue to reflect a majority White population. Of note, the Black/African American population also declined in the MHN service area, contrary to state and national trends. When viewed at the county level, the most diverse communities within the MHN service area include Kanawha and Raleigh counties in West Virginia, where 12% of residents identify as non White.
Race and Ethnicity White Black or African American Asian American Indian / Alaska Native Native Hawaiian / Pacific Islander Other Race Two or More Races Latinx origin (any race) MHN Service Area 90.9% 3.6% 0.7% 0.2% 0.0% 0.5% 4.0% 1.3% Kentucky 82.4% 8.0% 1.7% 0.3% 0.1% 2.1% 5.4% 4.6% Ohio 77.0% 12.5% 2.5% 0.3% 0.0% 1.9% 5.8% 4.4% West Virginia 89.8% 3.7% 0.8% 0.2% 0.0% 0.7% 4.7% 1.9% United States 61.6% 12.4% 6.0% 1.1% 0.2% 8.4% 10.2% 18.7% Source: US Census Bureau, Decennial Census Population Change among Prominent Racial and Ethnic Groups, 2010 to 2020 White Black or African American Asian Other Race Two or More Races Latinx origin (any race) MHN Service Area 8.3% 4.9% +15.9% +108.0% +163.9% +29.7% Kentucky 2.6% +7.4% +52.1% +73.6% +225.6% +56.5% Ohio 4.8% +5.1% +55.3% +72.5% +186.6% +47.0% West Virginia 7.4% +4.3% +21.8% +111.1% +213.0% +56.4% United States 8.6% +5.6% +35.5% +46.1% +275.7% +23.0% Source: US Census Bureau, Decennial Census 2015-2019 Non-White Population by County Source: US Census Bureau, Decennial Census Mountain Health Network 2022 CHNA 3 overall continue to reflect a majority White population. Of note, the Black/African American population also declined in the MHN service area, contrary to state and national trends. When viewed at the county level, the most diverse communities within the MHN service area include Kanawha and Raleigh counties in West Virginia, where 12% of residents identify as non White. 2020 Population by Race and Ethnicity White Black or African American Asian American Indian / Alaska Native Native Hawaiian / Pacific Islander Other Race Two or More Races Latinx origin (any race) MHN Service Area 90.9% 3.6% 0.7% 0.2% 0.0% 0.5% 4.0% 1.3% Kentucky 82.4% 8.0% 1.7% 0.3% 0.1% 2.1% 5.4% 4.6% Ohio 77.0% 12.5% 2.5% 0.3% 0.0% 1.9% 5.8% 4.4% West Virginia 89.8% 3.7% 0.8% 0.2% 0.0% 0.7% 4.7% 1.9% United States 61.6% 12.4% 6.0% 1.1% 0.2% 8.4% 10.2% 18.7% Source: US Census Bureau, Decennial Census Population Change among Prominent Racial and Ethnic Groups, 2010 to 2020 White Black or African American Asian Other Race Two or More Races Latinx origin (any race) MHN Service Area 8.3% 4.9% +15.9% +108.0% +163.9% +29.7% Kentucky 2.6% +7.4% +52.1% +73.6% +225.6% +56.5% Ohio 4.8% +5.1% +55.3% +72.5% +186.6% +47.0% West Virginia 7.4% +4.3% +21.8% +111.1% +213.0% +56.4% United States 8.6% +5.6% +35.5% +46.1% +275.7% +23.0% Source: US Census Bureau, Decennial Census 2015-2019 Non-White Population by County Source: US Census Bureau, Decennial Census
Source:
SERVICE AREA DESCRIPTION & HEALTH STATISTICS
Census Bureau,
Source:
MHN Service


Census Bureau,


Population
15.6%

2022-2025 MOUNTAIN HEALTH NETWORK COMMUNITY HEALTH NEEDS ASSESSMENT 11
Mountain Health Network 2022 CHNA 2 Ohio 22.4% 6.8% 13.1% 11.9% 13.0% 13.8% 16.7% 39.4 West Virginia 20.3% 6.4% 11.8% 12.1% 13.1% 14.5% 19.4% 42.5 United States 22.6% 9.4% 13.9% 12.6% 13.0% 12.9% 15.6% 38.1
US
American Community Survey *The MHN service area median age reflects an average of the county median ages.
US
American Community Survey 16.9% 17.4% 18.0% 18.5% 19.0% 14.4% 14.8% 15.2% 15.6% 16.0% 15.1% 15.5% 15.9% 16.3% 16.7% 17.2% 17.8% 18.3% 18.8% 19.4% 14.1% 14.5% 14.9% 15.2%
10.0% 12.0% 14.0% 16.0% 18.0% 20.0% 2011-20152012-20162013-20172014-20182015-2019
Aged 65 and older
Area Kentucky Ohio West Virginia United States Source: US Census Bureau, American Community Survey 2015 2019 Population by Age Gen Z/ Gen C Gen Z Millennial Millennial/ Gen X Gen X Boomers Boomers/ Silent Median AgeUnder 18 years 18 24 years 25 34 years 35 44 years 45 54 years 55 64 years 65 years and over MHN Service Area 21.2% 8.1% 11.9% 12.4% 13.0% 14.4% 19.0% 42.2* Kentucky 22.7% 6.6% 13.0% 12.4% 13.1% 13.3% 16.0% 38.9 Ohio 22.4% 6.8% 13.1% 11.9% 13.0% 13.8% 16.7% 39.4 West Virginia 20.3% 6.4% 11.8% 12.1% 13.1% 14.5% 19.4% 42.5 United States 22.6% 9.4% 13.9% 12.6% 13.0% 12.9% 15.6% 38.1 Source: US Census Bureau, American Community Survey *The MHN service area median age reflects an average of the county median ages. 16.9% 17.4% 18.0% 18.5% 19.0% 14.4% 14.8% 15.2% 15.6% 16.0% 15.1% 15.5% 15.9% 16.3% 16.7% 17.2% 17.8% 18.3% 18.8% 19.4% 14.5% 14.9% 15.2% 15.6% 14.0% 16.0% 18.0% 20.0% Population Aged 65 and older Source: US Census Bureau, American Community Survey *The MHN service area median age reflects an average of the county median ages.
Birth Rate and Maternal and Infant Health
Consistent with the nation, the birth rate declined across the tri state region from the 2019 CHNA. The region has s a similar or lower rate of birth than the nation, with the highest rate of birth in Kentucky.
Consistent maternal and infant health needs across the tri-state region include teen births and smoking during pregnancy, although both have declined since 2015. The teen birth rate is higher in all three states compared to the nation, and 50% higher in Kentucky and West Virginia. All three states also have a higher proportion of people who smoke during pregnancy, with the highest proportion in West Virginia (23%).
Consistent with racial and ethnic population trends, Black/African Americans and Latinx generally have a higher rate of birth than Whites.
Birth Rate and Maternal and Infant Health

Kentucky
West Virginia
United States


West Virginia also experiences disparate outcomes for premature and low birth weight births relative to other states in the region and the nation overall. While both White and Black/African American residents of West Virginia experience higher rates of premature birth and low birth weight, these outcomes disproportionately affect Black/African Americans. Nearly 1 in 5 Black/African American infants in West Virginia are born premature and/or with low birth weight compared to approximately 1 in 10 White infants. It is worth noting that these disparities exist despite overall positive prenatal care access among pregnant people. The state overall has a high proportion of pregnant people receiving first trimester prenatal care (79.6%), and a similar proportion of Black/African American (77.4%) and Whites (80.3%) receiving prenatal care.
Source: Centers for Disease Control and Prevention


2019 Maternal and Infant Health Indicators by Race and Ethnicity

Consistent maternal and infant health needs across the tri-state region include teen births and smoking during pregnancy, although both have declined since 2015. The teen birth rate is higher in all three states compared to the nation, and 50% higher in Kentucky and West Virginia. All three states also have a higher proportion of people who smoke during pregnancy, with the highest proportion in West Virginia (23%).
West Virginia also experiences disparate outcomes for premature and low birth weight births relative to other states in the region and the nation overall. While both White and Black/African American residents of West Virginia experience higher rates of premature birth and low birth weight, these outcomes disproportionately affect Black/African Americans. Nearly 1 in 5 Black/African American infants in West Virginia are born premature and/or with low birth weight compared to approximately 1 in 10 White infants. It is worth
Mountain Health

that


Consistent with the nation, the birth rate declined across the Tri-State region. The region has a similar or lower rate of birth than the nation, with the highest rate of birth in Kentucky. Consistent with racial and ethnic population trends, Black/ African Americans and Latinx generally have a higher rate of birth than Whites.
Consistent maternal and infant health needs across the Tri-State region include teen births and smoking during pregnancy, although both have declined since 2015. The teen birth rate is higher in all three states compared to the nation, and 50% higher in Kentucky and West Virginia. All three states also have a higher proportion of people who smoke during pregnancy, with the highest proportion in West Virginia (23%).

West Virginia also experiences disparate outcomes for premature and low birth weight births relative to other states in the region and the nation overall. While both White and Black/African American residents of West Virginia experience higher rates of premature birth and low birth weight, these outcomes disproportionately affect Black/African Americans. Nearly 1 in 5 Black/African American infants in West Virginia are born premature and/or with low birth weight compared to approximately 1 in 10 White infants. It is worth noting that these disparities exist despite overall positive prenatal care access among pregnant people. The state overall has a high proportion of pregnant people receiving first trimester prenatal care (79.6%), and a similar proportion of Black/African American (77.4%) and Whites (80.3%) receiving prenatal care.

12 2022-2025 MOUNTAIN HEALTH NETWORK COMMUNITY HEALTH NEEDS ASSESSMENT
Mountain Health Network 2022 CHNA 3
2019 Births and Birth Rate per 1,000 Population by Race and Ethnicity Total Births Birth Rate per 1,000 White, Non Hispanic Birth Rate Black/African American, Non Hispanic Birth Rate Latinx Birth Rate
53,069 11.9 11.2 13.7 19.7 Ohio 134,461 11.5 10.4 15.2 16.4
18,136 10.1 10.0 9.9 12.3
3,747,540 11.4 9.8 13.4 14.6
noting
these disparities exist despite overall positive prenatal care access among pregnant people. The state overall has a high proportion of pregnant people receiving first trimester prenatal care (79.6%), and a similar proportion of Black/African American (77.4%) and Whites (80.3%) receiving prenatal care. 2019 Maternal and Infant Health Indicators by Race and Ethnicity Teen (15 19) Birth Rate per 1,000 First Trimester Prenatal Care Premature Births Low Birth Weight Births Non Smoking during Pregnancy Kentucky 24.9 78.9% 11.3% 8.7% 84.7% White, Non Hispanic 23.9 81.2% 11.2% 8.1% 82.6% Black/African American, Non Hispanic 26.7 70.1% 13.5% 14.5% 90.6% Latinx (any origin) 40.7 65.6% 9.8% 7.2% 97.0% Ohio 18.8 77.0% 10.5% 8.6% 88.2% White, Non Hispanic 14.5 80.3% 9.6% 7.2% 86.6%
Network 2022 CHNA 3
Teen (15 19) Birth Rate per 1,000 First Trimester Prenatal Care Premature Births Low Birth Weight Births Non Smoking during Pregnancy Kentucky 24.9 78.9% 11.3% 8.7% 84.7% White, Non Hispanic 23.9 81.2% 11.2% 8.1% 82.6% Black/African American, Non Hispanic 26.7 70.1% 13.5% 14.5% 90.6% Latinx (any origin) 40.7 65.6% 9.8% 7.2% 97.0% Ohio 18.8 77.0% 10.5% 8.6% 88.2% White, Non Hispanic 14.5 80.3% 9.6% 7.2% 86.6% Black/African American, Non Hispanic 35.5 67.4% 14.1% 13.9% 91.5% Latinx (any origin) 30.6 67.7% 10.5% 7.8% 94.5% West Virginia 25.2 79.6% 12.6% 9.8% 77.0% White, Non Hispanic 25.2 80.3% 12.5% 9.5% 76.7% Black/African American, Non Hispanic 25.9 77.4% 17.6% 17.1% 80.5% Latinx (any origin) 20.0 67.1% 8.4% 6.8% 88.3% United States 16.7 77.6% 10.2% 8.3% 94.0% White, Non Hispanic 11.4 82.8% 9.3% 6.9% 91.2% Black/African American, Non Hispanic 25.8 67.6% 14.4% 14.2% 95.2% Latinx (any origin) 25.3 72.1% 10.0% 7.6% 98.5% HP2030 Goal NA 80.5% 9.4% NA 95.7% Source: Centers for Disease Control and Prevention 32.4 30.9 29.0 27.3 24.923.3 31.9 29.3 27.1 25.4 25.2 25.0 30.0 35.0 Teen (age 15-19) Birth Rate per 1,000 Source: Centers for Disease Control and Prevention, 2019 Births and Birth Rate per 1,000 Population by Race and Ethnicity Source: Centers for Disease Control and Prevention, 2019 Maternal and Infant Health Indicators by Race and Ethnicity


2022-2025 MOUNTAIN HEALTH NETWORK COMMUNITY HEALTH NEEDS ASSESSMENT 13 SERVICE AREA DESCRIPTION & HEALTH STATISTICS
Source: Centers for Disease Control and Prevention, National Vital Statistics
Source: Centers for Disease Control and Prevention, National Vital Statistics
2016,
Source: Centers for Disease Control and Prevention, National Vital Statistics
*In 2016, the US universally
Kentucky Ohio
United
Premature Births
11.3%
10.8%
14 2022-2025 MOUNTAIN HEALTH NETWORK COMMUNITY HEALTH NEEDS ASSESSMENT Mountain Health Network 2022 CHNA 4 Non Hispanic 25.9 77.4% 17.6% 17.1% 80.5% Latinx (any origin) 20.0 67.1% 8.4% 6.8% 88.3% United States 16.7 77.6% 10.2% 8.3% 94.0% White, Non Hispanic 11.4 82.8% 9.3% 6.9% 91.2% Black/African American, Non Hispanic 25.8 67.6% 14.4% 14.2% 95.2% Latinx (any origin) 25.3 72.1% 10.0% 7.6% 98.5% HP2030 Goal NA 80.5% 9.4% NA 95.7% Source: Centers for Disease Control and Prevention Source: Centers for Disease Control and Prevention, National Vital Statistics 32.4 30.9 29.0 27.3 24.923.3 21.8 20.8 18.9 18.8 31.9 29.3 27.1 25.4 25.2 22.3 20.3 18.8 17.4 16.7 10.0 15.0 20.0 25.0 30.0 35.0 2015 2016 2017 2018 2019 Teen (age 15-19) Birth Rate per 1,000 Kentucky Ohio West Virginia United States Source: Centers for Disease Control and Prevention, National Vital Statistics *In 2016, the US universally adopted the 2003 US Certificate of Live Birth, providing national indicators. 78.8% 79.0% 78.9% 79.0% 78.9% 75.3% 75.4% 75.6% 76.6% 77.0% 78.2% 79.2% 77.5% 78.8% 79.6% 77.1% 77.3% 77.5% 77.6% 70.0% 75.0% 80.0% 85.0% 2015 2016 2017 2018 2019 First Trimester Prenatal Care Kentucky Ohio West Virginia United States 10.8% 11.4% 11.1% 11.3% 11.3% 10.3% 10.4% 10.4% 10.3% 10.5% 11.3% 11.8% 12.0% 11.8% 12.6% 9.6% 9.9% 9.9% 10.0% 10.2% 9.5% 10.0% 10.5% 11.0% 11.5% 12.0% 12.5% 13.0% Premature Births 9.0%
75.4% 70.0% 2015 2016 2017 2018 2019 Low Birth Weight Births
11.4% 11.1% 11.3% 11.3% 10.3% 10.4% 10.4% 10.3% 10.5%
11.8% 12.0% 11.8% 12.6% 9.6% 9.9% 9.9% 10.0% 10.2% 8.0% 8.5% 9.0% 9.5% 10.0% 10.5% 11.0% 11.5% 12.0% 12.5% 13.0%
Source: Centers for Disease Control and Prevention, National Vital Statistics
Source: Centers for Disease Control and Prevention, National Vital Statistics
adopted the 2003 US Certificate of Live Birth, providing national indicators. 10.0%

Mountain
Kentucky Ohio West Virginia United States
8.5%
8.0%
7.5%
2015 2016 2017 2018 2019 Source: Centers for Disease Control and Prevention, National Vital Statistics


8.6%
West Virginia Kentucky Ohio West Virginia United States
Source: Centers for Disease Control and Prevention, National Vital Statistics
States 100.0%

9.1% 8.8% 8.9% 8.7% 8.5% 8.7% 8.7% 8.5% 8.6%
Health Network 2022 CHNA 5 9.5%


9.6% 9.7% 9.5% 9.4% 9.8% 8.1% 8.2% 8.3% 8.3% 8.3% 7.0%
Non-Smoking During Pregnancy


2015 2016 2017 2018 2019
80.5% 81.5% 82.1% 82.9% 84.7%84.8% 85.6% 86.2% 86.8% 88.2% 74.7% 74.6% 75.3% 76.1% 77.0% 92.8% 93.1% 93.5% 94.0% 60.0% 65.0% 70.0% 75.0% 80.0% 85.0% 90.0% 95.0%
*In
the US universally adopted the 2003 US Certificate of Live Birth, providing national indicators
Source: Centers for Disease Control and Prevention, National Vital Statistics
Non-Smoking During Pregnancy


Kentucky Ohio West Virginia United States
Source: Centers for Disease Control and Prevention, National Vital Statistics

*In 2016, the US universally adopted the 2003 US Certificate of Live Birth, providing national indicators
Source: Centers for Disease Control and Prevention, National Vital Statistics *In 2016, the US universally adopted the 2003 US Certificate of Live Birth, providing national indicators.
Infant Death Rate
The tri state region has a similar overall infant death rate as the nation, but consistent with the nation, the infant death rate is more than 50% higher for Black/African Americans than Whites. This disparity is most prevalent in Ohio, where Black/African Americans have an infant death rate that is nearly three times higher than the death rate for Whites living in the same state, and nearly 40% higher than the national Black/African American death rate. Reports by the Ohio Department of Health show that while the White infant death rate has improved, the Black/African American death rate has not significantly
The Tri-State region has a similar overall infant death rate as the nation, but consistent with the nation, the infant death rate is more than 50% higher for Black/African Americans than Whites. This disparity is most prevalent in Ohio, where Black/African Americans have an infant death rate (14.3/1,000 live births) that is nearly three times higher than the death rate for Whites living (5.1/1,000) in the same state, and nearly 40% higher than the national Black/African American death rate (10.6/1,000). Reports by the Ohio Department of Health show that while the White infant death rate has improved, the Black/African American death rate has not significantly changed. Similar disparities are seen in the maternal death rate nationwide. In 2019, the US maternal death rate was twice as high for Black/ African Americans than Whites (5.4/1,000). The Healthy People 2030 goal (10.6/1,000) is 5.0/1,000.
Mountain Health Network 2022 CHNA 6
Sources: Centers for Disease Control and Prevention, OH Department of Health


2022-2025 MOUNTAIN HEALTH NETWORK COMMUNITY HEALTH NEEDS ASSESSMENT 15 SERVICE AREA DESCRIPTION & HEALTH STATISTICS
8.5% 8.5% 8.6% 8.1% 8.2% 8.3% 8.3% 8.3% 7.0% 7.5% 8.0% 8.5% 2015 2016 2017 2018 2019 Kentucky Ohio West Virginia United States 80.5% 81.5% 82.1% 82.9% 84.7%84.8% 85.6% 86.2% 86.8% 88.2% 74.7% 74.6% 75.3% 76.1% 77.0% 92.8% 93.1% 93.5% 94.0% 60.0% 65.0% 70.0% 75.0% 80.0% 85.0% 90.0% 95.0% 100.0% 2015 2016 2017 2018 2019
Unemployment


Note, income and poverty data reflect pre-COVID-19 findings and likely do not demonstrate economic hardship experienced by individuals and families during the pandemic. Unemployment and food insecurity data for 2020 and 2021 provide insight into the economic impact of the pandemic. COVID-19 had a significant impact on unemployment rates across the nation. By the end of 2020, average unemployment for the US was approximately double what it was at the beginning of the year. The MHN service area had higher unemployment before than pandemic, and 2020 average unemployment exceeded state and national benchmarks. Unemployment in the service area has since declined, falling below pre-pandemic levels and the national average, however, potential economic and social impacts from higher unemployment during the pandemic should continue to be monitored.
Income and Poverty


A higher proportion of MHN service area residents live in poverty when compared to the Tri-State region and the nation. Poverty within the MHN service area has been stable over the past five years, contrary to declines seen nationally and in Kentucky and Ohio. Poverty across West Virginia has also been stable, but it is lower than the MHN service area.
Children are disproportionately affected by poverty, and nearly 27% of children in the MHN service area live in poverty compared to 18.5% nationally. Approximately 1 in 10 older adults also live in poverty, a finding of note due to the large and growing proportion of residents aged 65 or older.


Within the MHN service area, all counties except Putnam in West Virginia have poverty levels that exceed 15%. The highest poverty levels are seen in Lawrence (26.5%) and Carter (25.3%) counties in Kentucky and Mingo (28.7%) and Logan (25.4%) counties in West Virginia. In Cabell County, the home county of CHH and SMMC, 22.3% of all residents and 26% of children live in poverty.


Across the MHN service area, Tri-State region and the nation, people of color continue to have disproportionately lower incomes and higher poverty than Whites. Within the MHN service area, approximately one-third of Black/African American, other race, and multiracial residents and one-quarter of Latinx residents live in poverty compared to 19% of White residents.

16 2022-2025 MOUNTAIN HEALTH NETWORK COMMUNITY HEALTH NEEDS ASSESSMENT
Economic Indicators
Income


 Carter Mingo

 Logan
Logan


Source: US Census Bureau, American Community Survey & US Bureau of Labor Statistics
*The MHN service area median household income reflects an average of the county median household incomes. ** Supplemental Nutrition Assistance Program.


Source:
Education
Census

Source: US Census Bureau, American Community Survey
High school graduation is one of the strongest predictors of longevity and economic stability. Adult residents of the MHN service
2022-2025 MOUNTAIN HEALTH NETWORK COMMUNITY HEALTH NEEDS ASSESSMENT 17 SERVICE AREA DESCRIPTION & HEALTH STATISTICS declined, falling below pre potential economic and social impacts from higher unemployment should continue to be monitored. United States 2015-2019 People in Poverty among Prominent Racial and Ethnic Groups

less likely to complete high school or pursue higher education when compared to the tri state region and the nation. Approximately 18.7% of MHN service area adults have a bachelor’s degree or higher compared to 32.2% nationwide. Consistent with state and national trends, MHN service area adults of Asian descent are the most likely of any other population group to attain higher education. MHN service area adults identifying as White, Black/African American, and multiracial are less likely to attain higher education when compared to


 Lawrence
and Poverty (2015 Median household income $62,843 People in poverty 13.4% Children in poverty 18.5% Older adults (65+) in poverty 9.3% Households with SNAP** Benefits 11.7% Unemployment January 2020 4.0% 2020 average 8.1% September 2021 5.7% Source: US Census Bureau, American Community Survey & US Bureau of Labor Statistics *The MHN service area median county median household incomes. **Supplemental Nutrition Assistance Program. Source: US Census Bureau, American Community Survey 19.6% 19.5% 19.8% 20.0% 19.8% 18.9% 18.8% 18.3% 17.9% 17.3% 15.8% 15.4% 14.9% 14.5% 14.0% 18.0% 17.7% 17.8% 17.8% 17.6% 15.5% 15.1% 14.6% 14.1% 13.4% 12.0% 14.0% 16.0% 18.0% 20.0% 22.0% 2011-2015 2012-2016 2013-2017 2014-2018 2015-2019 People in Poverty, Trended MHN Service Area Kentucky Ohio West Virginia United States 2015-2019 Population in Poverty by County 2015 2019 People in Poverty among Prominent Racial and Ethnic Groups White Black / African American Asian Other Race Two or More Races Latinx origin (any race) MHN Service Area 19.1% 31.3% 16.2% 39.6% 32.32.5% 24.5% Kentucky 16.0% 27.8% 14.2% 31.2% 26.6% 26.8% Ohio 11.1% 29.6% 13.2% 26.0% 26.1% 24.7% West Virginia 16.9% 29.2% 16.8% 31.3% 25.5% 21.5% United States 11.1% 23.0% 10.9% 21.0% 16.7% 19.6%
US
Bureau, American Community Survey
area are
Unemployment
January 2020
2020 average
Source: US Census Bureau, American Community Survey & US Bureau of Labor Statistics

September 2021


*The MHN service area median household income reflects an average of the county median household incomes. **Supplemental Nutrition Assistance Program.
6.2% 4.1% 4.5% 5.0% 4.0% 18.0%
8.8% 6.6% 8.1% 8.3% 8.1% 20.0%
People in Poverty, Trended


19.6% 19.5% 19.8% 20.0% 19.8% 18.9% 18.8% 18.3% 17.9% 17.3% 15.8% 15.4% 14.9% 14.5% 14.0%
18.0% 17.7% 17.8% 17.8% 17.6% 15.5% 15.1% 14.6% 14.1% 13.4% 12.0%
4.2% 4.3% 5.4% 4.6% 5.7% 22.0% 2011-20152012-20162013-20172014-20182015-2019
14.0%
MHN Service Area Kentucky Ohio West Virginia United States
Source: US Census Bureau, American Community Survey
Source: US Census Bureau, American Community Survey
18 2022-2025 MOUNTAIN HEALTH NETWORK COMMUNITY HEALTH NEEDS ASSESSMENT 16.0%


Mountain Health Network 2022 CHNA 14


SERVICE AREA DESCRIPTION & HEALTH STATISTICS

Education


High school graduation is one of the strongest predictors of longevity and economic stability. Adult residents of the MHN service area are less likely to complete high school or pursue higher education when compared to the Tri-State region and the nation. Approximately 18.7% of MHN service area adults have a bachelor’s degree or higher compared to 32.2% nationwide. Consistent with state and national trends, MHN service area adults of Asian descent are the most likely of any other population group to attain higher education. MHN service area adults identifying as White, Black/African American, and multiracial are less likely to attain higher education when compared to their peers statewide and nationally. Consistent with disparate poverty levels, Black/African Americans are the least likely to attain higher education compared to other population groups in the service area.


When viewed at the county-level, educational disparities are most prominent in the southern portion of the service area. Approximately 1 in 4 adults in Lawrence and Martin counties in Kentucky and Mingo County in West Virginia have not completed high school. Lawrence and Mingo counties also have among the highest rates of poverty and food insecurity in the service area.

2022-2025 MOUNTAIN HEALTH NETWORK COMMUNITY HEALTH NEEDS ASSESSMENT 19
2015-2019 Population with No High School Diploma by County


Educational Attainment


Population with No High School Diploma (Age 25+), Percent by County, ACS 2015-19
Source: US Census Bureau, American Community Survey, 2019

2015-2019 Population with a Bachelor’s Degree by Prominent Racial and Ethnic Group
White Black / African American Asian Other Race Two or More Races Latinx origin (any race)


MHN Service Area 18.5% 13.7% 63.8% 16.1% 21.3% 22.4% Kentucky 24.5% 17.1% 52.4% 12.1% 25.9% 18.9% Ohio 29.2% 17.2% 60.8% 15.0% 24.8% 19.2% West Virginia 20.4% 15.2% 62.0% 23.5% 25.2% 22.0%
United States 33.5% 21.6% 54.3% 12.0% 31.9% 16.4%
Source: US Census Bureau, American Community Survey, 2015-2019
20 2022-2025 MOUNTAIN HEALTH NETWORK COMMUNITY HEALTH NEEDS ASSESSMENT Population with a Bachelor’s Degree by Prominent Racial and Ethnic Group


Source: US Census Bureau, American Community Survey


A CLOSER LOOK AT HEALTH STATISTICS


Access to Health Care


The MHN service area continues to have a lower percentage of uninsured residents than the nation and meets the Healthy People 2030 (HP2030)* goal of 92.1% insured residents. This finding is consistent across reported age groups. The percentage of uninsured residents in the MHN service area declined more than five percentage points over the past five years.
Among insured MHN service area residents, approximately half have employer-based insurance, a slightly lower proportion than the Tri-State region and the nation overall. Nearly 30% of service area residents have Medicaid insurance (alone or in combination with other insurance) compared to 20% nationally. Consistent with age demographics of the service area, a higher proportion of residents are Medicare-insured than the nation.
The MHN service area has low uninsured percentages across all reported racial and ethnic groups, excluding Asians. The percentage of uninsured Asian residents (8.1%) is consistent with the Tri-State region, but slightly higher than the national average (6.7%). Individuals identifying as other race, Latinx, and/or Black/African American are more likely to be insured than their peers nationally, but less likely to be insured than White residents living in the same community.


*Healthy People 2030 sets data-driven national objectives to improve health and well-being over the next decade. To learn more, visit health.gov/healthypeople.

2022-2025 MOUNTAIN HEALTH NETWORK COMMUNITY HEALTH NEEDS ASSESSMENT 21 SERVICE AREA DESCRIPTION & HEALTH STATISTICS
Among insured MHN service area residents,
half have employer
slightly lower proportion than the tri state region and the nation overall. Nearly 30% of service area residents have Medicaid insurance (alone or in combination with other insurance) compared to 20% nationally. Consistent with age demographics of the service area, a higher proportion of residents are Medicare insured than the nation.
The MHN service area has low uninsured percentages across all reported racial and ethnic groups, excluding Asians. The percentage of uninsured Asian residents (8.1%) is consistent with the tri state region, but slightly higher than the nation average (6.7%). Individuals identifying as other race, Latinx, and/or Black/African American are more likely to be in sured than their peers nationally, but less likely to be insured than White residents living in the same community.
Total
9.0% 10.0%
6.0%
MHN Service
States
16.0%
Total Population Uninsured by Age
Under 6 years 6-18 years19-25 years26-44 years45-64 years
MHN Service Area 3.2%3.7%12.3%11.9%8.0%0.2%

Kentucky 3.5%3.9%9.7%9.9%5.5%0.3%
Kentucky
Ohio
4.3%4.4%10.0%10.0%6.4%0.5%
West Virgina 2.6%3.2%11.0%10.7%7.1%0.3%
United
United States 4.1%5.5%14.7%14.8%9.3%0.8%
Bureau,

Source: US Census Bureau, American Community Survey
Source: US Census Bureau, American Community Survey
Source: US Census Bureau,
Mountain Health Network 2022 CHNA 18
5.3%6.4%8.8%34.1%5.4%22.5% Ohio 5.7%7.7%6.4%19.5%6.7%15.1% West Virgina
United States

Source: US Census Bureau,
Community Survey,


Cabell
Insured Population by Coverage Type (alone or
Insured Population by Coverage
combination)
Kentucky
Ohio
West Virginia
Source: US Census Bureau, American Community Survey
Source: US Census Bureau,
Survey,


22 2022-2025 MOUNTAIN HEALTH NETWORK COMMUNITY HEALTH NEEDS ASSESSMENT
approximately
based insurance, a
11.5% 9.8% 8.2% 6.7% 6.3% 9.6% 7.9% 6.1% 5.7% 11.4% 8.5% 7.4% 6.1% 8.0% 6.5% 6.0% 13.0% 11.7% 10.5% 9.4% 8.8% 4.0% 5.0%
7.0% 8.0%
11.0% 12.0% 13.0% 14.0% 2011-20152012-20162013-20172014-20182015-2019
Uninsured Population
Area Kentucky Ohio West Virgina United
65 years or over
Ohio
0.0% 2.0% 4.0% 6.0% 8.0% 10.0% 12.0% 14.0%
EmployerBased Directpurchased Medicare Medicaid Tricare VA Healthcare MHN 51.1% 9.6% 23.6% 29.9% 1.9% 3.4%
53.6% 12.2% 19.5% 26.2% 2.9% 2.8%
59.4% 11.9% 18.5% 20.6% 1.6% 2.3%
53.8% 10.6% 23.2% 26.9% 2.3% 3.7% United States 55.2% 13.6% 17.3% 20.2% 2.7% 2.3% 0.0% 10.0% 20.0% 30.0% 40.0% 50.0% 60.0%
in
Source: US Census Bureau, American Community Survey Availability of health care providers also impacts access to care and health outcomes. The MHN service area overall has more primary care providers than the nation, as indicated by the rate of primary care physicians per 100,000 population. However, the provider rate is skewed by higher availability in
County (home of MHN) and Kanawha County. The majority of service area counties have a lower primary care provider rate than the nation, and 15 counties, shown in the map on the following page, are Health Professional Shortage Areas (HPSAs) for low income populations. The tri state region overall has fewer dentists than the nation and generally fewer adults receiving White Black Asian Other Race Two or More Races Latinx (any race) MHN Service Area 6.2%9.3%8.1%16.1%5.7%11.3% Kentucky
5.9%8.6%9.7%10.7%4.3%10.4%
7.9%10.1%6.7%19.9%7.7%18.2% 0.0% 5.0% 10.0% 15.0% 20.0% 25.0% 30.0% 35.0% 40.0% Uninsured Population by Race and Ethnicity Source: US Census
American Community Survey, 2015-2019 Under 6 years 6-18 years 19-25 years 26-44 years 45-64 years or MHN Service Area 3.2% 3.7% 12.3% 11.9% 8.0% 0.2%
3.5% 3.9% 9.7% 9.9% 5.5% 0.3%
4.3% 4.4% 10.0% 10.0% 6.4% 0.5% West 2.6% 3.2% 11.0% 10.7% 7.1% 0.3%
States 4.1% 5.5% 14.7% 14.8% 9.3% 0.8% 0.0% 2.0% 4.0% 12.0% 16.0% Employer- Directpurchased MedicareMedicaid MHN 51.1%9.6%23.6%29.9%1.9%3.4% Kentucky 53.6%12.2%19.5%26.2%2.9%2.8% Ohio 59.4%11.9%18.5%20.6%1.6%2.3% West 53.8%10.6%23.2%26.9%2.3%3.7% United States 55.2%13.6%17.3%20.2%2.7%2.3% 0.0% 10.0% 20.0% 30.0% 40.0%
Type (alone or in combination)
American Community
2015-2019
American
2015-2019
American Community Survey
SERVICE

DESCRIPTION


STATISTICS
COVID-19 had a significant impact on access to care. Individuals nationwide delayed regular preventive and maintenance care due to fear of contracting COVID-19 in a health care setting and new financial constraints, among other concerns.


Availability of health care providers also impacts access to care and health outcomes. The MHN service area overall has more primary care providers than the nation, as indicated by the rate of primary care physicians per 100,000 population. However, the provider rate is skewed by higher availability in Cabell County (home of MHN) and Kanawha County. The majority of service area counties have a lower primary care provider rate than the nation, and most are Health Professional Shortage Areas (HPSAs) for low-income populations.
COVID-19 had a significant impact on access to care. Individuals nationwide delayed regular preventive and maintenance care due to fear of contracting COVID-19 in a health care setting and new financial constraints, among other concerns. Nationally, the percentage of adults receiving a routine physical checkup declined from 77.6% in 2019 to 76% in 2020. Within the Tri-State region, Kentucky adults also experienced delayed care acces with 74% of adults receiving a routine physical checkup in 2020, compared to 79.1% in 2019. Note: County-level data for 2020 are not yet available.
Read more about COVID impact on pages 50-67.
2022-2025 MOUNTAIN HEALTH NETWORK COMMUNITY HEALTH NEEDS ASSESSMENT 23
AREA
& HEALTH
Primary and Dental Provider Rates and Adult Health Care Access


Care


Source: Health Resources and Services Administration & Centers for Disease Control and Prevention, PLACES & BRFSS *Data are reported as age adjusted percentages.

Source: Health Resources and Services Administration & Centers for Disease Control and Prevention, PLACES & BRFS *Data are repoted as age-adjusted percentages.
The Tri-State region overall has fewer dentists than the nation and generally fewer adults receiving regular dental care. The MHN service area has a lower rate of dental providers than the region and every county except Putnam is a dental HPSA. Lincoln and Mingo counties in West Virginia and Martin County in Kentucky are considered high needs HPSAs. All other counties are dental HPSAs for low-income individuals.

Primary Care Health Professional Shortage Areas for Low-Income Individuals (shown in yellow)

Source: Health Resources and Services Administration

As part of the 2022 CHNA, focus groups were conducted with residents and health and social service partners representing communities across MHN’s service area. Key discussion takeaways from the focus

24 2022-2025 MOUNTAIN HEALTH NETWORK COMMUNITY HEALTH NEEDS ASSESSMENT
Primary
Dental Care Physicians per 100,000 Population (2018) Routine Checkup within Past Year (2019)* Dentists per 100,000 Population (2019) Dental Visit within Past Year (2018)* MHN Service Area 89.5 NA 52.3 NA Kentucky 65.7 79.1% 64.8 62.2% Ohio 76.6 76.2% 62.1 67.4% West Virginia 78.2 77.6% 56.8 56.0% United States 75.8 75.0% 71.4 66.2%
SERVICE AREA DESCRIPTION & HEALTH STATISTICS
Voice of Community
As part of the 2022 CHNA, focus groups were conducted with residents and health and social service partners representing communities across MHN’s service area.*
The sustained delivery of health and social services will require addressing workforce shortages. (Key takeaways related to health professional shortages include:)
Community Comments

• “A good economy equates to good health. We can only grow as much as the capacity allows, and the capacity is limited.”
• “Educational outcomes of our youth are a barrier to businesses coming here, but it’s not curriculum that we need. It’s addressing the social needs and trauma of children.”
• “Health care workers were not treated well during the pandemic so fewer young people want to enter these fields.”
Insights
• Available programs, like the MHN Tuition Assistance Program and career advancement for patient care assistants, help recruit students to the profession.


• Social barriers to workforce participation include lack of child care.
• Internship and mentoring opportunities for youth can foster interest in health care professions.
• Encourage new graduates to work in the region, and draw new professionals to the area via online learning programs.


• Crisis and PTSD services are programs and resources that respond to the health and social needs of current employees.

*Key discussion takeaways from the focus groups are included in the Appendix.

2022-2025 MOUNTAIN HEALTH NETWORK COMMUNITY HEALTH NEEDS ASSESSMENT 25
Social Determinants of Health: The connection between our communities and our health

SOCIAL DETERMINANTS OF HEALTH:


THE CONNECTION BETWEEN OUR COMMUNITIES AND OUR HEALTH
Social determinants of health (SDoH) are the conditions in the environments where people are born, live, learn, work, play, worship, and age that affect a wide range of health risks and outcomes. Healthy People 2030, the national benchmark of the U.S. Centers for Disease Control and Prevention (CDC) for health, recognizes SDoH as central to its framework, naming “social and physical environments that promote good health for all” as one of the four overarching goals for the decade. Healthy People 2030 outlines five key areas of SDoH: economic stability, education access and quality, health care access and quality, neighborhood and built environment, and social and community context.
Social determinants of health (SDoH) are the conditions in the environments where people are born, live, learn, work, play, worship, and age that affect a wide range of health risks and outcomes. Healthy People 2030, the national benchmark of the US Centers for Disease Control and Prevention (CDC) for health, recognizes SDoH as central to its framework, naming “social and physical environments that promote good health for all” as one of the four overarching goals for the decade. Healthy People 2030 outlines five key areas of SDoH: economic stability, education access and quality, health care access and quality, neighborhood and built environment, and social and community context.
The mix of ingredients that influence each person’s overall health profile includes individual behaviors, clinical care, environmental factors, and social circumstance. While health improvementefforts have historically targeted health behaviors and clinical care, public health agencies, including the CDC, widely hold that at least 50% of a person’s health profile is determined by SDoH.


circumstance. While health improvement efforts have historically targeted health behaviors and clinical care, public health agencies, including the CDC, widely hold that at least 50% of a person’s health profile is determined by SDoH.


The mix of ingredients that influence each person’s overall health profile includes individual behaviors, clinical care, environmental factors, and social


Addressing SDoH is a primary approach to achieving health equity. Health equity encompasses a wide range of social, economic, and health measures but can be simply defined as “a fair opportunity for every person to be as healthy as possible.” To achieve health equity, we need to look beyond the health care system to dismantle systematic inequities born through discrimination, like power and wealth distribution, education attainment, job opportunities, housing, and safe environments, to build a healthier community for all people now and in the future.
Addressing SDoH is a primary approach to achieving health equity. Health equity encompasses a wide range of social, economic, and health measures but can be simply defined as “a fair opportunity for every person to be as healthy as possible.” To achieve health equity, we need to look beyond the health care system to dismantle systematic inequities born through discrimination, like power and wealth distribution, education attainment, job opportunities, housing, and safe environments, to build a healthier community for all people now and in the future.
26 2022-2025 MOUNTAIN HEALTH NETWORK COMMUNITY HEALTH NEEDS ASSESSMENT
Mountain Health Network 2022 CHNA 23
SOCIAL DETERMINANTS OF HEALTH: THE CONNECTIONS BETWEEN OUR COMMUNITIES AND OUR HEALTH

Understanding Health Equity


Regardless of sharing the same community, not all residents share in the same opportunities for optimal health and wellness. MHN service area residents experience disparate health outcomes, largely rooted in socioeconomic differences. A higher proportion of residents live in poverty than the Tri-State region overall, and contrary to national declines, poverty levels have been stable in recent years. Approximately 14-15% of residents are food insecure compared to 12% nationally. These findings were reinforced by community representatives. Among Key Informant Survey participants, resources to promote food security and overall economic stability were among the top identified community needs.
Within the MHN service area, a closer look at health and socioeconomic indicators by population illuminates wide disparities among those with lower incomes, racial and ethnic groups, and in rural communities. The data illustrate the critical importance of SDoH as root causes of health disparities.


In the MHN service area, issues of health and social inequities are most evident in downtown Huntington, the southern portion of Wayne County and northern portion of Mingo County in West Virginia, and neighboring Lawrence County in Kentucky. These inequities are demonstrated by metrics such as the Area Deprivation Index (ADI). The ADI provides a census block group measure of socioeconomic disadvantage based on income, education, employment, and housing quality. See Index on page 42.

2022-2025 MOUNTAIN HEALTH NETWORK COMMUNITY HEALTH NEEDS ASSESSMENT 27
Understanding Health Equity Continued


The following table illustrates socioeconomic disadvantages in distinct communities in Cabell, Wayne, Mingo, and Lawrence counties. In downtown Huntington, nearly 60% of all residents and children in zip code 25703 live in poverty and 12% have not completed high school and/or are without health insurance. The downstream impact of these factors is demonstrated in overall life expectancy. In the census tracts comprising Huntington zip code 25703, life expectancy is as low as 68.1 years compared to a statewide average of 74.8. Further discussed on pages 45-46.
are without health insurance. The downstream impact of these factors is demonstrated in overall life expectancy. In the census tracts comprising Huntington zip code 25703, life expectancy is as low as 68.1 years compared to a statewide average of 74.8.
Comparing health indicators with population statistics demonstrates the adverse impact of social determinants onpopulations that historically and continually experience inequities, particularly Black/African Americans. While the MHN service area is less racially diverse overall, communities experiencing more socioeconomic barriers are among the most diverse in the region. In this way, we can begin to see how inequities perpetuate persistent disparities in health and social outcomes.
Comparing health indicators with population statistics demonstrates the adverse impact of social determinants on populations that historically and continually experience inequities, particularly Black/ African Americans. While the MHN service area is less racially diverse overall, communities experiencing more socioeconomic barriers are among the most diverse in the region. In this way, we can begin to see how inequities perpetuate persistent disparities in health and social outcomes.
2015-2019 Social Determinants of Health & Racial Demographics by Geography
(County)


25703, Huntington (Cabell) 57.1% 57.7% 12.0% 11.5% 27.9% 25661, Williamson (Mingo) 31.9% 38.5% 18.3% 3.3% 14.0% 25701, Huntington (Cabell) 27.1% 36.2% 10.9% 9.0% 13.2% 25514, Fort Gay (Wayne) 24.1% 28.4% 19.7% 10.2% 0.5% 25570, Wayne (Wayne) 30.7% 46.0% 20.6% 9.8% 0.2% 25702, Huntington (Cabell) 29.9% 39.1% 19.5% 7.9% 5.0% 41230, Louisa (Lawrence, KY) 24.6% 35.0% 22.6% 8.6% 1.2% 25511, Dunlow (Wayne) 31.9% 38.9% 38.9% 3.1% 2.4% 25512, East Lynn (Wayne) 21.8% 46.5% 41.2% 0.0% 0.0% 25674, Kermit (Mingo) 38.1% 58.3% 30.6% 10.4% 0.1% 25704, Huntington (Wayne) 23.3% 33.2% 18.9% 7.9% 5.5% 25517, Genoa (Wayne) 32.6% 46.1% 41.0% 8.3% 0.0%
Kentucky 17.3% 23.5% 5.6% 5.7% 13.0% Ohio 14.0% 19.9% 7.2% 6.1% 18.7%
West Virginia 17.6% 23.8% 13.1% 6.0% 6.9%
United States 13.4% 18.5% 12.0% 8.8% 27.5%

Source: US Census Bureau, American Community Survey

Source: US Census Bureau,
Survey, 2015-2019

Key Informant Survey – Social Determinants of Health Findings


28 2022-2025 MOUNTAIN HEALTH NETWORK COMMUNITY HEALTH NEEDS ASSESSMENT Social Determinants of Health & Racial Demographics by Geography


ZIP Code
Population in Poverty Children in Poverty No High School Diploma No Health Insurance Non White Population
Approximately 45.7% (n=95) of informants stated that their organization currently screens clients, patients, constituents, etc., for the needs related to SDoH. Informants were asked to rate the quality of SDoH in the community their organization serves using a scale of (1) very poor to (5) excellent. The
American Community
SOCIAL DETERMINANTS OF HEALTH: THE CONNECTIONS BETWEEN OUR COMMUNITIES AND OUR HEALTH

Ranking of Social Determinants of Health in Descending Order by Mean Score
Key Informant Survey – Social Determinants of Health Findings


Approximately 45.7% (n=95) of informants stated that their organization currently screens clients, patients, constituents, etc., for the needs related to SDoH. Informants were asked to rate the quality of SDoH in the community their organization serves using a scale of (1) very poor to (5) excellent. The mean score for each SDoH area is listed in the table to the right in rank order, followed by a graph showing the scoring frequency. Mean scores were between 2.51 and 3.09, with most respondents rating the listed areas as fair. Consistent with 2019 CHNA findings, health and health care was seen as the strongest community SDoH, with 33.8% of informants rating it as good or excellent. Economic stability was seen as the weakest SDoH, with 54.3% rating it as very poor or poor.
Mean Score


Health and Health care (e.g., access to health care, access to primary care, health literacy) 3.09
Education (e.g., high school graduation, enrollment in higher education, language and literacy, early childhood education and development) 2.91


Social and Community Context (e.g., sense of community, civic participation, perceptions of discrimination and equity, incarceration/institutionalization) 2.87
Food Security (consider access to affordable, healthy foods) 2.86
Neighborhood and Built Environment (e.g., access to healthy foods, quality of housing, crime and violence, environmental conditions, transportation) 2.75

Economic Stability (e.g., poverty, employment, food security, housing stability) 2.51

of


Social Determinants of


Determinants of Health

2022-2025 MOUNTAIN HEALTH NETWORK COMMUNITY HEALTH NEEDS ASSESSMENT 29
Social
} “Allow more women health care workers to participate in health care again by providing day care services for young children. Such services are difficult to obtain, and many women health care workers are not working because child care is needed.” 29.8% 22.7% 1.0% 1.0% 2.9% 1.5% 3.9% 5.8% 100.0% Quality
Community
Health
Key Informant Survey Comments


•“Allow more women health care workers to participate in health care again by providing day care services for young children. Such services are difficult to obtain, and many women health care workers are not working because child care is needed.”

• “Healthy food bank for patients with diabetes, hypertension and heart failure; on-site dietitian for patient education at time of appointment; telehealth dietitian appointments.”


• “Mountain Health could set up community gardens and find ways to share natural, healthy foods - not the packaged foods loaded with sugars that we see even in the hospital setting; MHN could set up community exercise on neighborhood corners every morning and encourage people to come together for age-appropriate exercise and smelling the roses together; communities coming to labor together to care for each other. Our seniors are incredibly isolated. What if the MHN set up a program to connect seniors with younger families for touching base and finding meaning and purpose for both sides.”


• “The single greatest thing you could do is to ensure persons living in deep poverty are well-treated when they visit the hospital system.”

30 2022-2025 MOUNTAIN HEALTH NETWORK COMMUNITY HEALTH NEEDS ASSESSMENT
SOCIAL DETERMINANTS OF HEALTH: THE CONNECTIONS BETWEEN OUR COMMUNITIES AND OUR HEALTH


Food Insecurity


Food insecurity is defined as not having reliable access to enough nutritious, affordable food. Food insecurity is associated with lower household income and poverty, as well as poorer overall health status. COVID-19 had a profound impact on food insecurity, particularly among children. From 2019 to 2020, the percentage of food insecure children was projected to increase 3-5 percentage points across the Tri-State region and the US. Prior to 2020, food insecurity among all residents and children was declining. Projected food insecurity declined in 2021 but continues to be slightly higher than pre-pandemic years.
When viewed at the county level, areas of higher child food insecurity largely align with counties with higher reported poverty, including Mingo (34%) and Logan (30%) counties. In Cabell County, approximately 16% of all residents and 20% of children were projected to be food insecure.


2022-2025 MOUNTAIN HEALTH NETWORK COMMUNITY HEALTH NEEDS ASSESSMENT 31


32 2022-2025 MOUNTAIN HEALTH NETWORK COMMUNITY HEALTH NEEDS ASSESSMENT
SOCIAL DETERMINANTS OF HEALTH: THE CONNECTIONS BETWEEN OUR COMMUNITIES AND OUR HEALTH


Housing


Housing is the largest single expense for most households and should represent 30% of a household’s monthly income. The median home value for the MHN service area is less expensive than the median home values for the Tri-State region or US overall. MHN service area residents are more likely to own their home, and fewer homeowners are considered housing cost burdened compared to the US benchmark.
The median rent in the MHN service area is also lower than state and national medians, but more renters are considered housing cost burdened. Approximately 49% of renters in the MHN service area are considered cost burdened, a higher proportion than the Tri-State region and a similar proportion as the nation overall.


Housing Indicators

Source: US Census Bureau, American Community Survey, 2015-2019
*Defined as spending 30% or more of household income on rent or mortgage expenses.


**The MHN service area median housing costs reflect an average of the county median housing costs.

2022-2025 MOUNTAIN HEALTH NETWORK COMMUNITY HEALTH NEEDS ASSESSMENT 33


34 2022-2025 MOUNTAIN HEALTH NETWORK COMMUNITY HEALTH NEEDS ASSESSMENT
SOCIAL DETERMINANTS OF HEALTH: THE CONNECTIONS BETWEEN OUR COMMUNITIES AND OUR HEALTH
Quality housing has a direct impact on health. Unhealthy including lead poisoning, asthma, injury and other chronic contain lead paint and other hazardous materials like asbestos.
Quality housing has a direct impact on health. Unhealthy housing puts including lead poisoning, asthma, injury and other chronic diseases. contain lead paint and other hazardous materials like asbestos.
Quality housing has a direct impact on health. Unhealthy housing puts residents including lead poisoning, asthma, injury and other chronic diseases. Housing built contain lead paint and other hazardous materials like asbestos.
Housing
Quality housing has a direct impact on health. Unhealthy housing puts residents at risk of health including lead poisoning, asthma, injury and other chronic diseases. Housing built before 1979 contain lead paint and other hazardous materials like asbestos.
Quality housing has a direct impact on health. Unhealthy housing puts residents at risk of including lead poisoning, asthma, injury and other chronic diseases. Housing built before contain lead paint and other hazardous materials like asbestos.
Quality housing has a direct impact on health. Unhealthy housing puts residents at risk of health including lead poisoning, asthma, injury and other chronic diseases. Housing built before 1979 may contain lead paint and other hazardous materials like asbestos.
Asthma


Severely cost-burdened households are defined as households with housing costs that exceed 50% of household income. The map at the right depicts the percentage of severely cost-burdened households by census tract within the MHN service area. While pockets of severe housing cost burden exist across the service area, it is worth noting that 15% or more households in and around downtown Huntington in Cabell County are severely housing cost-burdened.
Residents of the tri state region have a higher prevalence 2019, 9.4% of Kentucky, 11.3% of Ohio, and 11.6% of West asthma diagnosis compared to 8.9% nationally. Within asthma, with the highest proportion in Mingo County

Residents of the tri state region have a higher prevalence of asthma 2019, 9.4% of Kentucky, 11.3% of Ohio, and 11.6% of West Virgini a asthma diagnosis compared to 8.9% nationally. Within the MHN service asthma, with the highest proportion in Mingo County (12.2%).

Residents of the tri-state region have a higher prevalence of asthma than their peers nationwide.
Residents of the tri state region have a higher prevalence of asthma than their peers nationwide.
Residents of the tri-state region have a higher prevalence of asthma than their 2019, 9.4% of Kentucky, 11.3% of Ohio, and 11.6% of West Virgini a adults reported asthma diagnosis compared to 8.9% nationally. Within the MHN service area, 10% asthma, with the highest proportion in Mingo County (12.2%).

Residents of the tri-state region have a higher prevalence of asthma than their peers nationwide.
2019, 9.4% of Kentucky, 11.3% of Ohio, and 11.6% of West Virgini a adults reported having a current asthma diagnosis compared to 8.9% nationally. Within the MHN service area, 10%-12% of adults asthma, with the highest proportion in Mingo County (12.2%).
The Tri-State region overall, excluding Kentucky, has older housing stock than the nation. Within the MHN service area, 3.4% of housing units were built after 2009 compared to 5.2% nationally. Approximately 61% of housing units in the service area were built before 1980.
Quality housing has a direct impact on health. Unhealthy housing puts residents at risk of health issues including lead poisoning, asthma, injury, and other chronic diseases. Housing built before 1979 may contain lead paint and other hazardous materials like asbestos.
2019, 9.4% of Kentucky, 11.3% of Ohio, and 11.6% of West Virgini a adults reported having asthma diagnosis compared to 8.9% nationally. Within the MHN service area, 10% 12% of asthma, with the highest proportion in Mingo County (12.2%).
2019 Age-Adjusted Adult Asthma
2019 Age-Adjusted Adult Asthma Prevalence
2019, 9.4% of Kentucky, 11.3% of Ohio, and 11.6% of West Virgini a adults reported having a current asthma diagnosis compared to 8.9% nationally. Within the MHN service area, 10%-12% of adults asthma, with the highest proportion in Mingo County (12.2%).
2019 Age-Adjusted Adult Asthma Prevalence by
2019 Age-Adjusted Adult Asthma Prevalence by
2019 Age-Adjusted
2019 Age Adjusted Adult Asthma Prevalence by

2022-2025 MOUNTAIN HEALTH NETWORK COMMUNITY HEALTH NEEDS ASSESSMENT 35 Residents of the Tri-State region have a higher prevalence of asthma than their peers nationwide. As of 2019, 9.4% of Kentucky, 11.3% of Ohio, and 11.6% of West Virginia adults reported having a current asthma diagnosis compared to 8.9% nationally. Within the MHN service area, 10%-12% of adults have asthma, with the highest proportion in Mingo County (12.2%).

Asthma is the most common chronic condition among children, and and school absenteeism. In 2019, approximately 1 in 4 children in the diagnosed with asthma, a slightly higher proportion than the nation
Asthma is the most common chronic condition among children, and a leading cause of hospitalization and school absenteeism. In 2019, approximately 1 in 4 children in the tri state region had ever been
Asthma is the most common chronic condition among children, and a leading cause of hospitalization and school absenteeism. In 2019, approximately 1 in 4 children in the tri state region had
Asthma is the most common chronic condition among children, and school absenteeism. In 2019, approximately 1 in 4 diagnosed with asthma, a slightly higher proportion than American and

Asthma is the most common chronic condition among children, and a leading cause of hospitalization and school absenteeism. In 2019, approximately 1 in 4 children in the tri -state region had ever
Asthma is the most common chronic condition among children, and a leading cause and school absenteeism. In 2019, approximately 1 in 4 children in the tri -state diagnosed with asthma, a slightly higher proportion than the nation overall. Nationally,
children
Latinx
are more likely to live in rented
Mountain Health Network 2022 CHNA 29 service area, it is worth nothing that 15% or more households in and around downtown Huntington in Cabell County are severely housing cost burdened. 2015-2019 Severely Cost Burdened Households by Census Tract The tri-state region overall, excluding Kentucky, has older housing stock than the nation. Within the MHN service area, 3.4% of housing units were built after 2009 compared to 5.2% nationally. Approximately 61% of housing units in the service area were built before 1980. 2015 2019 Housing by Year Built Before 1980 1980-1999 2000-2009 2010-2013 2014 or Later MHN Service Area 61.0% 25.8% 9.8% 2.3% 1.2% Kentucky 50.5% 29.6% 14.7% 2.9% 2.2% Ohio 66.7% 20.8% 9.5% 1.6% 1.4% West Virginia 59.0% 25.9% 11.7% 2.1% 1.2% United States 53.6% 27.3% 14.0% 2.7% 2.5% Source: US Census Bureau, American Community SurveySource: US Census Bureau, American Community Survey, 2015-2019 Housing by Year Built
Asthma Continued
Asthma is the most common chronic condition among children, and a leading cause of hospitalization and school absenteeism. In 2019, approximately 1 in 4 children in the Tri-State region had ever been diagnosed with asthma, a slightly higher proportion than the nation overall. Nationally, Black/African American and Latinx children are more likely to live in rented households and areas with older housing.

These trends, coupled with other social determinants of health barriers, contribute to a disproportionately higher prevalence of asthma compared to Whites and other races. A similar trend is also seen in Kentucky among Black/ African American children.
These trends, coupled with other social determinants of health barriers, contribute to a disproportionately higher prevalence of asthma compared to Whites and other races. A similar trend is also seen in Kentucky among Black/African American children.


2019 High School Students Ever Diagnosed with Asthma
Kentucky Ohio West Virginia United States

Total 23.9% 24.3% 22.7% 21.8%
Black or African American
White 22.3%

Source: Centers for Disease Control and Prevention, YRBS
Source: Centers for Disease Control and Prevention, YRBS, 2019
Point-in-Time
N/A 29.2%
22.0% 19.8% Latinx origin (any race) 22.4% 29.9% N/A 21.0%
The Point in Time (PIT) count is a count of sheltered and unsheltered people experiencing homelessness required by the United States Department of Housing and Urban Development (HUD) for communities that participate in its Continuum of Care (CoC) program. The count is usually conducted in the last 10 days of January each year. Sheltered locations include emergency shelters and transitional housing. Unsheltered locations include cars, streets, parks, etc.
The Point-in-Time (PIT) count is a count of sheltered and unsheltered people experiencing homelessness required by the United States Department of Housing and Urban Development (HUD) for communities that participate in its Continuum of Care (CoC) program. The count is usually conducted in the last 10 days of January each year. Sheltered locations include emergency shelters and transitional housing. Unsheltered locations include cars, streets, parks, etc.
The HUD CoC program is designed to provide the services and resources needed to assist individuals and families experiencing homelessness. As part of their planning responsibility, each CoC entity must conduct a PIT count of homeless persons at least biennially. The following table depicts aggregate 2020 PIT homeless counts for CoCs located across Kentucky, Ohio, and West Virginia, as well as the count for the CoC serving the Huntington area, including Cabell and Wayne counties.
As of 2020, a total of 1,341 people in West Virginia were experiencing homelessness and 194 or 14.5% were within the Huntington/Cabell & Wayne counties CoC. Within the Huntington/Cabell & Wayne counties CoC, nearly 1 in 10 individuals experiencing homelessness were youth under age 18 or veterans. Black/African Americans were disproportionately represented among individuals experiencing

36 2022-2025 MOUNTAIN HEALTH NETWORK COMMUNITY HEALTH NEEDS ASSESSMENT High School Students Ever Diagnosed with Asthma


The HUD CoC program is designed to provide the services and resources needed to assist individuals and families experiencing homelessness. As part of their planning responsibility, each CoC entity must conduct a PIT count of homeless persons at least biennially. The table on page 39 depicts aggregate 2020 PIT homeless counts for CoCs located across Kentucky, Ohio, and West Virginia, as well as the count for the CoC serving the Huntington area, including Cabell and Wayne counties.

37.4% 24.6%
24.2%
homelessness Black/African American represent 4.9% of the total population in Cabell County and
SOCIAL DETERMINANTS OF HEALTH: THE CONNECTIONS BETWEEN OUR COMMUNITIES AND OUR HEALTH

2020 Point in Time Homeless Count by Continuum of Care (CoC) Program Huntington/ Cabell & Wayne Counties CoC Kentucky Ohio West Virginia
Total 194 4,011 10,655 1,341

As of 2020, a total of 1,341 people in West Virginia were experiencing homelessness and 194 or 14.5% were within the Huntington/Cabell & Wayne counties CoC. Within the Huntington/Cabell & Wayne counties
Chronically
Individuals 166 3,116 7,636 1,156
Under
Families 28 895 3,019 185
1,999 122


104
Chronically homeless 4 666 753 174
White 146 2,826 5,350 1,097
Under age 18 17 581 1,999 122
Veterans 15 399 730 104
Black/African American 41 996 4,662 181
CoC, nearly 1 in 10 individuals experiencing homelessness were youth under age 18 or veterans. Black/African Americans were disproportionately represented among individuals experiencing homelessness. Black/African Americans represent 4.9% of the total population in Cabell County and 0.9% of the total population in Wayne County, but 21.1% of individuals experiencing homelessness in the Huntington/Cabell & Wayne counties CoC.
Other race 7 189 643 63
Source: US Department of Housing
White 146 2,826 5,350 1,097


Hispanic/Latinx 5 136 487 30
Black/African American 41 996 4,662 181
Source: US Department of Housing and Urban Development
10000

8000
6000
4000
2000
Urban Development
Other race 7 189 643 63
Hispanic/Latinx 5 136 487 30
Persons Experiencing Homelessness
0

Veterans 15 399 730 11182 10404 10095 10249 10345 10655
Persons Experiencing Homelessness
homeless 4 666 753 174 4538
age 18 17 581 4011
4538 4237 4025 3688 2079
and 1341
11182 10404 10095 10249 10345 10655 1835 1387 1309 1243 1397 1341

12000 2015 2016 2017 2018 2019 2020
The number of people experiencing homelessness is anticipated to have increased in 2021 due to economic hardships resulting from the COVID-19 pandemic. The 2021 PIT count is pending release and results should be interpreted with caution as many CoC programs did not conduct an unsheltered homeless count due to pandemic restrictions.


4011
Source: US Department
of Housing and Urban Development 0
Kentucky Ohio West Virginia
Kentucky Ohio West Virginia
is access to computers and internet service. Termed the "digital divide," there is a growing gap between the underprivileged members of society especially poor, rural, elderly, and disabled populations—who do not have access to computers or the internet and the wealthy, middle class, and young Americans living in urban and suburban areas 12000
Related to housing concerns
2020 Point-in-Time Homeless Count by Continuum of Care (CoC) Program Huntington/ Cabell & Wayne Counties CoC Kentucky Ohio West Virginia Total 194 4,011 10,655 1,341 Individuals 166 3,116 7,636 1,156 Families 28 895 3,019 185 Related to housing concerns is access to computers and internet service. Termed the "digital divide," there is a growing gap between the underprivileged members of society especially poor, rural, elderly, and disabled populations—who do not have access to computers or the internet and the wealthy, middle class, and young Americans living in urban and suburban areas who have access.
2022-2025 MOUNTAIN HEALTH NETWORK COMMUNITY HEALTH NEEDS ASSESSMENT 37 Source: US Department of Housing and Urban Development
who have access.
4237 4025 3688 2079
1835 1387 1309 1243 1397
2000 4000 6000 8000 10000
2015 2016 2017 2018 2019 2020
Digital Divide


Related to housing concerns is access to computers and internet service. Termed the “digital divide,” there is a growing gap between the underprivileged members of society — especially poor, rural, elderly, and disabled populations — who do not have access to computers or the internet and the wealthy, middle-class, and young Americans living in urban and suburban areas who have access.
The MHN service area overall has lower digital access than the Tri-State region or the nation. Approximately 83% of households have a computer device and less than 67% have a desktop or laptop. Approximately three-quarters of households have an internet subscription, including broadband internet access.


38 2022-2025 MOUNTAIN HEALTH NETWORK COMMUNITY HEALTH NEEDS ASSESSMENT The MHN service area overall has lower digital access than the tri state region or the nation. Approximately 83% of households have a computer device and less than 67% have a desktop or laptop. Approximately three quarters of households have an internet subscription, including broadband internet access.
2015-2019 Households by Digital Access With Computer Access With Internet Access Computer Device Desktop / Laptop Smartphone Internet Subscription Broadband Internet MHN Service Area 83.2% 66.4% 68.8% 74.8% 74.3% Kentucky 86.4% 70.9% 75.1% 78.8% 78.4% Ohio 89.1% 75.5% 77.1% 82.4% 82.0% West Virginia 84.2% 68.7% 68.9% 76.4% 76.0% United States 90.3% 77.8% 79.9% 83.0% 82.7% Source: US Census Bureau, American Community SurveySource: US Census Bureau, American Community Survey, 2015-2019 Households by Digital Access
SOCIAL DETERMINANTS OF HEALTH: THE CONNECTIONS BETWEEN OUR COMMUNITIES AND OUR HEALTH

Illuminating Health Inequities


A host of indexes are available to illustrate the potential for health disparities and inequities at the community-level based on SDoH. A description of each index is provided below, followed by data visualizations of each tool that show how well MHN service area communities fare compared to state and national benchmarks.

Tools for Identifying Disparity


The following data visualizations illustrate the potential for health disparities and inequities at the community level based on SDoH barriers. A description of each data visualization tool is provided below:


Community Need Index (CNI): The CNI is a zip code-based index of community socioeconomic need calculated nationwide. The CNI scores zip codes on a scale of 1.0 to 5.0, with 1.0 indicating a zip code with the least need and 5.0 indicating a zip code with the most need compared to the US national average of 3.0. The CNI weights, indexes, and scores zip codes by socioeconomic barriers, including income, culture, education, insurance, and housing. For purposes of the CHNA, the CNI analysis focuses on the 49 primary service area zip codes for CHH and SMMC. The zip codes are in and around Huntington, West Virginia, the location of both medical facilities.
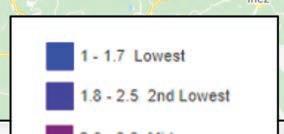


2022-2025 MOUNTAIN HEALTH NETWORK COMMUNITY HEALTH NEEDS ASSESSMENT 39
1 - 1.7 Lowest 1.8 - 2.5 2nd Lowest 2.6 - 3.3 Mid 3.4 - 4.1 2nd Highest 4.2 - 5 Highest


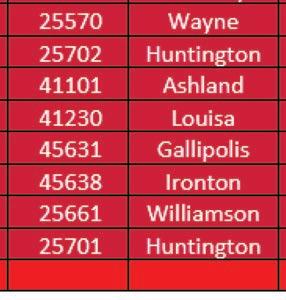


40 2022-2025 MOUNTAIN HEALTH NETWORK COMMUNITY HEALTH NEEDS ASSESSMENT
60% of all residents and children live in poverty and 12% have not completed high school and/or are without health insurance. It is worth nothing that nearly all of downtown Huntington is identified as vulnerable based on high concentrations of people living in poverty and low educational attainment.
SOCIAL DETERMINANTS OF HEALTH: THE CONNECTIONS BETWEEN OUR COMMUNITIES AND OUR HEALTH
Other areas of high need within the MHN service area include the southern portion of Wayne County and northern portion of Mingo County in West Virginia, and neighboring Lawrence County in Kentucky.
Comparing health indicators with population statistics demonstrates the adverse impact of social determinants on populations that historically and continually experience inequities, particularly Black/ African Americans. While the MHN service area is less diverse overall, communities experiencing more socioeconomic barriers are the most diverse in the region. In this way, we can begin to see how inequities perpetuate persistent disparities in health and social outcomes.
Community Need Index Continued

The MHN zip code service area has an average CNI score of 3.2, indicating moderate community need. Of the 49 zip codes comprising the service area, 23 score in high need categories of 3.4 or higher. Consistent with the 2019 CHNA, Huntington zip code 25703 has the highest CNI score, and the score increased from 4.2 to 4.4. Zip code 25703 encompasses a portion of downtown Huntington, which is also identified as an area of disadvantage by the Area Deprivation Index. Within this zip code, nearly 60% of all residents and children live in poverty and 12% have not completed high school and/or are without health insurance. It is worth nothing that nearly all of downtown Huntington is identified as vulnerable based on high concentrations of people living in poverty and low educational attainment.
Other areas of high need within the MHN service area include the southern portion of Wayne County and northern portion of Mingo County in West Virginia, and neighboring Lawrence County in Kentucky.
Comparing health indicators with population statistics demonstrates the adverse impact of social determinants on populations that historically and continually experience inequities, particularly Black/ African Americans. While the MHN service area is less diverse overall, communities experiencing more socioeconomic barriers are the most diverse in the region. In this way, we can begin to see how inequities perpetuate persistent disparities in health and social outcomes.
The following table lists the social determinants that contribute to CNI scores and are often indicative of health disparities. Zip codes with a CNI score of 3.4 or higher are shown, in descending order by score.
The following table lists the social determinants that contribute to CNI scores and are often indicative of health disparities. Zip codes with a CNI score of 3.4 or higher are shown, in descending order by score.
ZIP Code (County)
2015 2019 Social Determinants of Health by Geography
Social Determinants of Health by Geography Red = Higher CNI Score from the 2019 CHNA
Red = Higher CNI Score from the 2019 CHNA
Population in Poverty Children in Poverty
No High School Diploma
No Health Insurance
CHNA CNI Score
CHNA CNI Score


25703, Huntington (Cabell) 57.1% 57.7% 12.0% 11.5% 4.4 4.2 25661, Williamson (Mingo) 31.9% 38.5% 18.3% 3.3% 4.0 3.8 25701, Huntington (Cabell) 27.1% 36.2% 10.9% 9.0% 4.0 3.6 25514, Fort Gay (Wayne) 24.1% 28.4% 19.7% 10.2% 3.8 3.4 25570, Wayne (Wayne) 30.7% 46.0% 20.6% 9.8% 3.8 3.8 25702, Huntington (Cabell) 29.9% 39.1% 19.5% 7.9% 3.8 4.2 41101, Ashland (Boyd) 24.3% 34.9% 12.4% 6.4% 3.8 3.6 41230, Louisa (Lawrence, KY) 24.6% 35.0% 22.6% 8.6% 3.8 3.6 45631, Gallipolis (Gallia) 20.0% 36.7% 13.4% 8.7% 3.8 3.8 45638, Ironton (Lawrence, OH) 21.3% 30.2% 12.5% 6.7% 3.8 3.4 25508, Chapmanville (Logan) 17.7% 18.6% 20.1% 7.1% 3.6 3.2 25511, Dunlow (Wayne) 31.9% 38.9% 38.9% 3.1% 3.6 N/A 25512, East Lynn (Wayne) 21.8% 46.5% 41.2% 0.0% 3.6 3.6 25674, Kermit (Mingo) 38.1% 58.3% 30.6% 10.4% 3.6 3.4 25704, Huntington (Wayne) 23.3% 33.2% 18.9% 7.9% 3.6 3.4 45680, South Point (Lawrence, OH) 22.2% 31.0% 12.6% 4.9% 3.6 3.4 25517, Genoa (Wayne) 32.6% 46.1% 41.0% 8.3% 3.4 3.2 25523, Hamlin (Lincoln) 39.3% 60.9% 20.3% 5.0% 3.4 3.4 25524, Harts (Lincoln) 38.4% 69.0% 25.6% 4.6% 3.4 3.2 25550, Point Pleasant (Mason) 17.7% 30.5% 11.7% 5.5% 3.4 3.4 41143, Grayson (Carter) 20.9% 29.7% 15.3% 6.9% 3.4 3.2 45619, Chesapeake (Lawrence, OH) 13.5% 17.3% 12.7% 5.3% 3.4 3.4 45623, Crown City (Gallia) 17.1% 29.6% 13.6% 6.3% 3.4 3.2
Kentucky 17.3% 23.5% 5.6% 5.7% N/A N/A Ohio 14.0% 19.9% 7.2% 6.1% N/A N/A
West Virginia 17.6% 23.8% 13.1% 6.0% N/A N/A
United States 13.4% 18.5% 12.0% 8.8% N/A N/A
Source: US Census Bureau, American Community Survey, 2015-2019
Source: US Census Bureau, American Community Survey
Mountain
2022-2025 MOUNTAIN HEALTH NETWORK COMMUNITY HEALTH NEEDS ASSESSMENT 41
Health Network 2022 CHNA 37
2022
2019
Area Deprivation Index


Vulnerable Population Footprint: The Vulnerable Population Footprint identifies areas where high concentrations of people living in poverty and people living without a high school diploma overlap. Areas are reported by census tract. Census tracts are statistical subdivisions of a county that have roughly 4,000 inhabitants.


Area Deprivation Index (ADI): The ADI provides a census block group measure of socioeconomic disadvantage based on income, education, employment, and housing quality. ADI scores are displayed at the block group level on a scale from 1 (least disadvantaged) to 10 (most disadvantaged). A block group is a subdivision of a census tract and typically contains between 250 and 550 housing units.
 Vulnerable Population Footprint
Area Deprivation Index (2019), State Decile by Block Group, Neighborhood Atlas 2021
Vulnerable Population Footprint
Area Deprivation Index (2019), State Decile by Block Group, Neighborhood Atlas 2021
42 2022-2025 MOUNTAIN HEALTH NETWORK COMMUNITY HEALTH NEEDS ASSESSMENT
SOCIAL DETERMINANTS OF HEALTH: THE CONNECTIONS BETWEEN OUR COMMUNITIES AND OUR HEALTH
Racial Disparities and Disproportionality Index (RDDI) for WV, KY & OH
Racial Disparities and Disproportionality Index
Source: Corporation for Supportive Housing
*TAY: Transition age youth; DD: Developmental
Source: Corporation for Supportive Housing *TAY: Transition-age youth; DD: Developmental Disability; MH: Mental Health *No DD Residential Data
Source: Corporation for Supportive Housing


*TAY: Transition age youth; DD: Developmental Disability; MH: Mental Health
Racial Disparities and Disproportionality Index (RDDI):

The Racial Disparities and Disproportionality Index was developed by the Corporation for Supportive Housing (CSH toassess unique systems and measure whether a racial and/or ethnic group’s representation in a particular public system is proportionate to, over,or below their representation in the overall population. The index can be viewed as the likelihood of one group experiencing an event, compared to the likelihood of another group experiencing that same event. Results are provided on a state-by-state basis.


The Racial Disparities and Disproportionality Index measures whether a racial group’s representation in a particular public system is proportionate to their representation in the overall population. Public systems include homelessness, veterans, prison/justice systems, child welfare, developmental disabilities, mental health institutions, aging population and substance use.
An index of 1 signifies equal representation; an index below 1 signifies underrepresentation and an index above 1 signifies overrepresentation in a system.


2022-2025 MOUNTAIN HEALTH NETWORK COMMUNITY HEALTH NEEDS ASSESSMENT 43
Chronic Homeless Non Chronic Homeless Veterans Homelss Families Child Welfare Families Unaccompanied TAY Child Welfare TAY Justice Involved TAY Prison Jail DD Waitlist DD Residential DD ICF MH Insstitutional MH Residential Aging Substance Use
Racial Disparities and Disproportionality Index

Racial Disparities and Disproportionality Index (RDDI) for WV, KY & OH


Across the Tri-State region, Black/African Americans have the highest index score of any other population group, ranging from 3.97 in Kentucky to 6.02 in Ohio. This finding indicates overrepresentation in public systems. In all three states, Black/African Americans are overrepresented in prison and justice systems, as well as among people experiencing homelessness. This finding is consistent with systemic issues of racism within the nation’s criminal justice system that lead to disproportionate incarceration and sentencing among people of color.

Source: Corporation for Supportive Housing *TAY: Transition-age youth; DD: Developmental Disability; MH: Mental Health


Source: Corporation for Supportive Housing
*TAY: Transition age youth; DD: Developmental Disability; MH: Mental Health
Source: Corporation for Supportive Housing
*TAY: Transition age youth; DD: Developmental Disability; MH: Mental


Source: Corporation for Supportive Housing


Source:
Transition-age youth;
Developmental Disability; MH: Mental Health


44 2022-2025 MOUNTAIN HEALTH NETWORK COMMUNITY HEALTH NEEDS ASSESSMENT
*TAY:
DD:
Chronic Homeless Non Chronic Homeless Veterans Homelss Families Child Welfare Families Unaccompanied TAY Child Welfare TAY Justice Involved TAY Prison Jail DD Waitlist
Corporation for Supportive Housing *TAY: Transition age youth; DD: Developmental Disability; MH: Mental Health Chronic Homeless Non Chronic Homeless Veterans Homelss Families Child Welfare Families Unaccompanied TAY Child Welfare TAY Justice Involved TAY Prison Jail DD Waitlist DD Residential DD ICF MH Insstitutional MH Residential Aging Substance Use
SOCIAL DETERMINANTS OF HEALTH: THE CONNECTIONS BETWEEN OUR COMMUNITIES AND OUR HEALTH


Life Expectancy

Life expectancy is another measure of the impact of social determinants of health. Within the Tri-State region, there is a 2.2-year difference in life expectancy across the states, with lower life expectancy in West Virginia.
Life expectancy is another measure of the impact of social determinants of health Within the tri state region, there is a 2.2 year difference in life expectancy across the states, with lower life expectancy in West Virginia.
Life expectancy is another measure of the impact of social determinants of health Within the tri state region, there is a 2.2 year difference in life expectancy across the states, with lower life expectancy in West Virginia.
Across all three states, life expectancy is highest for Latinx and Asian residents and lowest for Black/African American residents. Life expectancy disparities among Black/African Americans are most prominent in Ohio, where Black/African Americans live an average of 3.7 years less than Whites. This disparity is also reflected in mortality data presented in this report. In Ohio, Black/African Americans have an all-cause death rate that is more than 150 points higher than the death rate for Whites.
Across all three states, life expectancy is highest for Latinx and Asian residents and lowest for Black/African American residents. Life expectancy disparities among Black/African Americans are most prominent in Ohio, where Black/African Americans live an average of 3.7 years less than Whites. This disparity is also reflected in mortality data presented in this report. In Ohio, Black/African Americans have an all-cause death rate that is more than 150 points higher than the death rate for Whites.
Across all three states, life expectancy is highest for Latinx and Asian residents and lowest for Black/African American residents. Life expectancy disparities among Black/African Americans are most prominent in Ohio, where Black/ African Americans live an average of 3.7 years less than Whites. This disparity is also reflected in mortality data presented in this report. In Ohio, Black/African Americans have an all-cause death rate that is more than 150 points higher than the death rate for Whites.
Expectancy by Race and Ethnicity
Virginia

Vital Statistics System


Source: National Vital Statistics System, 2017-2019

2022-2025 MOUNTAIN HEALTH NETWORK COMMUNITY HEALTH NEEDS ASSESSMENT 45
2017 2019 Life Expectancy by Race and Ethnicity Overall Life Expectancy Asian Black White Latinx origin (any race) Kentucky 75.6 86.5 74.3 75.5 96.3 Ohio 77.0 88.2 73.5 77.2 86.0 West
74.8 88.3 72.7 74.7 102.9 Source: National Vital Statistics System Source: Centers for Disease Control and Prevention Total White (Non-Hispanic) Black/AfricanAmerican (Non-Hispanic) Latinx (Any Race) MHN Service Area 1076.7 1086.1 1110.9 299.6 Kentucky 946.6 957.7 1007.0 366.3 Ohio 860.7 855.8 1014.4 488.9 West Virginia 971.2 979.3 1064.2 269.3 United States 747.6 763.8 925.3 567.7 0.0 200.0 400.0 600.0 800.0 1000.0 1200.0 2016-2020 All Cause Death Rate by Race/Ethnicy per Age-Adjusted 100,000
LIfe
2017 2019 Life Expectancy by Race and Ethnicity Overall Life Expectancy Asian Black White Latinx origin (any race) Kentucky 75.6 86.5 74.3 75.5 96.3 Ohio 77.0 88.2 73.5 77.2 86.0 West Virginia 74.8 88.3 72.7 74.7 102.9 Source: National
Source: Centers for Disease Control and Prevention Total White (Non-Hispanic) Black/AfricanAmerican (Non-Hispanic) Latinx (Any Race) MHN Service Area 1076.7 1086.1 1110.9 299.6 Kentucky 946.6 957.7 1007.0 366.3 Ohio 860.7 855.8 1014.4 488.9 West Virginia 971.2 979.3 1064.2 269.3 United States 747.6 763.8 925.3 567.7 0.0 200.0 400.0 600.0 800.0 1000.0 1200.0 2016-2020 All Cause Death Rate by Race/Ethnicy per Age Adjusted 100,000 Source: Centers for Disease Control and Prevention, 2016 - 2020 All Cause Death Rate by Race/Ethnicity per Age-Adjusted 100,00
The following map shows average life expectancy at the census tract level. Areas of lower life expectancy largely align with areas of socioeconomic disadvantage. In the census tracts comprising Huntington zip code 25703, life expectancy is as low as 68.1 years compared to a statewide average of 74.8. In the downtown Huntington portion of zip code 25704, life expectancy is as low as 62.3 years.


When life expectancy is viewed at a county level, Cabell County overall has lower life expectancy of 71.3 years. Mingo and Logan counties in West Virginia also experience notable life expectancy disparities. Mingo and Logan counties have the highest poverty and child food insecurity rates in the service area and the lowest average life expectancy of 69.7 years and 70.7 years, respectively.


 Life Expectancy At Birth, Years by Tract, CDC and NCHS 2010-15
46 2022-2025 MOUNTAIN HEALTH NETWORK COMMUNITY HEALTH NEEDS ASSESSMENT
SOCIAL DETERMINANTS OF HEALTH: THE CONNECTIONS BETWEEN OUR COMMUNITIES AND OUR HEALTH


Mountain Health Network Community Building Activities


Mountain Health Network (MHN) and its member hospitals, Cabell Huntington Hospital and St. Mary’s Medical Center, serve the Tri-State region and its communities by providing advanced medicine and compassionate care. But our commitment to community health doesn’t end there.

MHN actively engages with regional partners to assess, develop, and implement community health improvement initiatives that strengthens connections. Whenever possible we support and/or co-create initiatives with community-based organizations that address social determinants and help foster and build relationships and improve population health, strengthening the resiliency of the community and the reliability of high-quality health care. This section outlines some of the activities supported and initiatives embarked upon over the past three years.

2022-2025 MOUNTAIN HEALTH NETWORK COMMUNITY HEALTH NEEDS ASSESSMENT 47
on obesity/diabetes and Prevention heart disease, and tobacco use/lung disease.

Mountain Health Network Community Building Activities

Community Building Activities
Mountain Health Network is pleased to support the following agencies that together further our efforts in supporting community health.
Economic Stability

United Way of the River Cities
Alchemy Theatre Troupe Barboursville Fall Fest Barboursville Lion’s Club Barboursville Rotary Huntington Museum of Art Huntington Symphony Orchestra
Ironton in Bloom, Inc.

Ironton Rotary Club
Junior League of Huntington Kiwanis Club of Huntington Lawrence County Chamber of Commerce


Social & Community Context

Keith-Albee Performing Arts Center
A.D. Lewis Community Center
Carter G. Woodson Memorial Foundation, Inc.
MU Foundation WV Minority Health


City of Huntington Mayor’s Diversity LGBTQ+ Advisory Committee
NAACP of Huntington Annual Freedom Fund
National Coal Heritage
Tri-State India Association Diwali Celebration Honor Flight of Huntington
“Community Benefit” standard set by IRS:
• Not-for-Profit Hospitals should engage in spending that promotes Community Health
• Hospitals have a latitude in deciding Social Determinants of Health
48 2022-2025 MOUNTAIN HEALTH NETWORK COMMUNITY HEALTH NEEDS ASSESSMENT
Mountain Health Network 2022 CHNA 42 improve quality of life for people living with chronic disease, with an emphasis
SOCIAL DETERMINANTS OF HEALTH: THE CONNECTIONS BETWEEN OUR COMMUNITIES AND OUR HEALTH
Social Community Context Continued
Veterans’ Home
WV Gold Star Mothers
WV Marine Corps Coordinating Council
Little Victories Animal Rescue
Paramount Arts Center
Scottish Rite Foundation
Neighborhood and Environment
Coalfield Development Community Garden facility
CONTACT Huntington, Inc.


Dress for Succes

Girls on the Run
Cabell-Huntington Coalition for the Homeless/Harmony House
Food
Huntington City Mission Lunch Program
River Cities Ministry
Facing Hunger Foodbank
Ironton aLive Farmers Market
Health Care
Alzheimer’s Association
American Cancer Society
American Heart Association
Arthritis Foundation
Juvenile Diabetes Research
Cabell-Wayne Association of the Blind
Highlands Foundation
Hospice of Huntington Pleasant Valley Hospital
Thomas Health Foundation
Valley Health/WIC WV Physical Therapy Association
Family Medicine Foundation of WV Jose I. Ricard MD Family Medicine & Sports Conference
SMMC Spiritual Care and Mission Training for first responders
Youth
Autism of River Cities
Big Brothers Big Sisters of the Tri-State Brady Steps Foundation (for spina bifida)
Buckskin Council /Boy Scouts of America
Cabell County Fraternal Order of Police
Community Autism Resources & Education Systems (CARE)

Developmental Therapy Center
Greater Huntington Parks
Ronald McDonald House Charities Huntington Team for WV Children
YMCA of Huntington Young Life
West Virginia Futbol Club Youth Soccer Heritage Farm Foundation
Education
Education Alliance Education Summit
Boyd County Public Library
Cabell County Public Library
Ohio University Foundation
Our Lady of Fatima Parish School
Tri-State STEM+M Early College High School
Tri-State Literacy Council/Cabell Co. Library

WV Osteopathic School of Medicine
WVU Foundation
Marshall University

Lifestyle & Behavior
HealthyTristate.org/MU Marathon
Huntington Turkey Trot
Fruth Pharmacy Annual Scholarship Jeannie’s Wish, Inc.


O Such Tri-State Race Planners


Lily’s Place
Prestera Shepherd’s House Recovery Point
Stepping Stones
Veterans Memorial Day 5K
2022-2025 MOUNTAIN HEALTH NETWORK COMMUNITY HEALTH NEEDS ASSESSMENT 49
As the COVID 19 pandemic had a major impact on the MHN service area and many of MHN’s plans to address the health needs of our community, it is important to include COVID-19 data in this CHNA.

As the COVID-19 pandemic had a major impact on the MHN service area and many of MHN’s plans address the health needs of our community, it is important to include COVID 19 data in this CHNA.
COVID-19 IMPACT ON COMMUNITIES
The following map illustrates overall vulnerability to COVID-19 by MHN service area county. Counties with higher vulnerability are highlighted in the map and are defined as having a vulnerability in dex score of 0.6 or higher. This score indicates that these counties are more vulnerable to COVID-19 than 60% of other US counties. For example, Carter County in Kentucky is more vulnerable to COVID 19 than 78% of US counties. Among the factors impacting vulnerability scores is financial insecurity, housing and transportation challenges, older age and underlying health issues, and access to health care. Communities with higher vulnerability have pre existing economic, social, and physical conditions that may make it hard to respond to and recover from a COVID 19 outbreak.


The following map illustrates overall vulnerability to COVID 19 by MHN service area county. Counties with higher vulnerability are highlighted in the map and are defined as having a vulnerability in score of 0.6 or higher. This score indicates that these counties are more vulnerable to COVID-19 60% of other US counties. For example, Carter County in Kentucky is more vulnerable to COVID-19 78% of US counties. Among the factors impacting vulnerability scores is financial insecurity, housing transportation challenges, older age and underlying health issues, and access to health care. Communities with higher vulnerability have pre existing economic, social, and physical conditions may make it hard to respond to and recover from a COVID-19 outbreak.
COVID-19 is the name of the disease caused by the SARS-CoV-2 virus. “CO” stands for corona, “VI” for virus, and “D” for disease. The number “19” refers to the year 2019 when the first case of COVID-19 was identified. COVID-19 has not impacted all people equally. Rather, certain structural issues—population density, low income, crowded workplaces, etc.—contribute to higher levels of spread and worse outcomes from COVID-19 in select communities. Surgo Ventures developed the Community Vulnerability Index to measure how well any community in the US could respond to the health, economic, and social consequences of COVID-19 without intentional response and additional support.

As the COVID-19 pandemic had a major impact on the MHN service area and many of MHN’s plans to address the health needs of our community, it is important to include COVID-19 data in this CHNA.

The following map illustrates overall vulnerability to COVID-19 by MHN service area county. Counties with higher vulnerability are highlighted in the map and are defined as having a vulnerability index score of 0.6 or higher. This score indicates that these counties are more vulnerable to COVID-19 than 60% of other US counties. For example, Carter County in Kentucky is more vulnerable to COVID-19 than 78% of US counties. Among the factors impacting vulnerability scores is financial insecurity, housing and transportation challenges, older age and underlying health issues, and access to health care. Communities with higher vulnerability have pre-existing economic, social, and physical conditions that may make it hard to respond to and recover from a COVID-19 outbreak.
COVID-19 Community Vulnerability Index
COVID-19 Community Vulnerability Index

Ohio Kentucky
Meigs:

Scioto: .78 Lawrence:
Boyd:
West Virginia
Source: COVID Act Now
Source: COVID Act Now

50 2022-2025 MOUNTAIN HEALTH NETWORK COMMUNITY HEALTH NEEDS ASSESSMENT Carter:

47 Martin:

.67
.66
.72
.78
.74
COVID -19 IMPACT ON COMMUNITIES

As of January 6, 2022, the Tri-State region had more than 3 million COVID-19 cases and 47,000 related deaths. Cases and death rates in all three states exceeded national benchmarks. Of note, West Virginia had the highest COVID-19 death rate in the region, despite a similar case rate. This finding may indicate more severe disease incidence, an older population, vaccine hesitancy, and/or delayed care and treatment.

As of January 6, 2022, the tri state region had over 3 million COVID 19 cases and 47,000 related deaths. Cases and death rates in all three states exceeded national benchmarks. Of note, West Virginia had the highest COVID-19 death rate in the region, despite a similar case rate. This finding may indicate more severe disease incidence, an older population, vaccine hesitancy, and/or delayed care and treatment.


COVID-19 Cases and Deaths (as of January 6, 2022)
COVID-19 Cases and Deaths (as of January 6, 2022)


Cases
Total
Kentucky 885,678 19,824 12,255 274 Ohio 2,093,074 17,906 29,674 253
West Virginia 339,679 18,954 5,361 299
United States* 57,190,371 17,255 827,879 250
Source: Center for Disease Control and Prevention
Source: Center for Disease Control and Prevention

*Calculated based on 2020 population count.
*Calculated based on 2020 population count.
The following graph looks at new cases of COVID 19 since the onset of the pandemic. The graph demonstrates the impact of the most recent Omicron variant, particularly in Ohio, where new cases spiked significantly in January 2022 As of January 6, 2022, Ohio had more than 6,000 active COVID 19 hospitalizations and only 15.7% inpatient bed and 14.7% ICU bed capacity across the state.
New Cases of COVID 19 since 10 Average Daily Cases First Recorded (as of January 6, 2022)

2022-2025 MOUNTAIN HEALTH NETWORK COMMUNITY HEALTH NEEDS ASSESSMENT 51
Deaths
Cases Cases per 100,000 Total Deaths Deaths per 100,000
As of January 6, 2022, the tri state region had over 3 million COVID 19 cases and 47,000 related deaths. Cases and death rates in all three states exceeded national benchmarks. Of note, West Virginia had the highest COVID 19 death rate in the region, despite a similar case rate. This finding may indicate more severe disease incidence, an older population, vaccine hesitancy, and/or delayed care and treatment.
COVID 19 Cases and Deaths (as of January 6, 2022)
Cases
Deaths
Total Cases Cases per 100,000 Total Deaths Deaths per 100,000

Kentucky 885,678 19,824 12,255 274 Ohio 2,093,074 17,906 29,674 253 West Virginia 339,679 18,954 5,361 299 United States* 57,190,371 17,255 827,879 250
Source: Center for Disease Control and Prevention *Calculated based on 2020 population count.


The following graph looks at new cases of COVID-19 since the onset of the pandemic. The graph demonstrates the impact of the most recent Omicron variant, particularly in Ohio, where new cases spiked significantly in January 2022. As of January 6, 2022, Ohio had more than 6,000 active COVID-19 hospitalizations and only 15.7% inpatient bed and 14.7% ICU bed capacity across the state.
The following graph looks at new cases of COVID 19 since the onset of the pandemic. The graph demonstrates the impact of the most recent Omicron variant, particularly in Ohio, where new cases spiked significantly in January 2022. As of January 6, 2022, Ohio had more than 6,000 active COVID 19 hospitalizations and only 15.7% inpatient bed and 14.7% ICU bed capacity across the state.
New Cases of COVID 19 since 10 Average Daily Cases First Recorded (as of January 6, 2022)

Source: Center for Disease Control and Prevention
Mountain Health Network 2022 CHNA 48
COVID-19 vaccination will be essential to managing the pandemic. The following table shows the percentage of eligible residents either partially (one vaccine dose) or fully (two-dose series or single dose of Johnson and Johnson vaccine) vaccinated. The Tri-State region has consistent vaccine coverage that is lower than the national average. As of January 6, 2022, approximately two-thirds of eligible residents were partially vaccinated and nearly 60% were fully vaccinated. While vaccine coverage remains lower than the national average, it continues to improve across all three states.
COVID 19 vaccination will be essential to managing the pandemic. The following table shows the percentage of eligible residents either partially (one vaccine dose) or fully (two dose series or single dose of Johnson and Johnson vaccine) vaccinated. The tri state region has consistent vaccine coverage that is lower than the national average. As of January 6, 2022, approximately two thirds of eligible residents were partially vaccinated and nearly 60% were fully vaccinated. While vaccine coverage remains lower than the national average, it continued to improve across all three states.
COVID-19 Vaccination among Population Age 5 or Older (as of January 6, 2022)
COVID-19 Vaccination among Population Age 5 or Older (as of January 6, 2022)


Total


Partially

Kentucky 66.9% 58.0% Ohio 64.6% 59.0% West Virginia 65.6% 58.3% United States* 78.5% 66.2%
Source: Center for Disease Control and Prevention
Source: Center for Disease Control and Prevention
The CDC has prioritized vaccine equity, defined as preferential access and administration to those who have been most affected by COVID 19, including racial and ethnic minorities. Across the nation and the tri state region, there is ongoing opportunity to ensure vaccination for populations that historically and continually experience inequities, particularly Black/African Americans. Although, of note, vaccine coverage among Black/African Americans in West Virginia is higher than their White counterparts.


Population that has Received at Least One COVID 19 Vaccine Dose by Race and Ethnicity (as of December 13, 2021)
Kentucky Ohio West Virginia United States
Asian 72.0% 84.0% NA 77.0%
Black or African American 50.0% 48.0% 66.0% 51.0%
White 54.0% 57.0% 58.0% 58.0%


Latinx (any race) NA 56.0% NA 56.0%
Source: Kaiser Family Foundation
COVID-19 Demonstrated Inequities
The COVID 19 pandemic both highlighted and deepened socioeconomic and health inequities. Unemployment increased more than 40% across the MHN service area in 2020. Child food insecurity was projected to have increased approximately 20% across the tri state region. While both indicators declined in 2021, the potential long term economic and social impacts from these experiences should continue to be monitored. Communities experiencing socioeconomic disparity before the pandemic
52 2022-2025 MOUNTAIN HEALTH NETWORK COMMUNITY HEALTH NEEDS ASSESSMENT
Vaccinated
Vaccinated Fully Vaccinated
COVID -19 IMPACT ON COMMUNITIES


The CDC has prioritized vaccine equity, defined as preferential access and administration to those who have been most affected by COVID-19, including racial and ethnic minorities. Across the nation and the Tri-State region, there is ongoing opportunity to ensure vaccination for populations that historically and continually experience inequities, particularly Black/African Americans. Although, of note, vaccine coverage among Black/African Americans in West Virginia is higher(66%) than their White counterparts(58%).


COVID-19 Demonstrated Inequities


The COVID-19 pandemic both highlighted and deepened socioeconomic and health inequities. Unemployment increased more than 40% across the MHN service area in 2020. Child food insecurity was projected to have increased approximately 20% across the Tri-State region. While both indicators declined in 2021, the potential long-term economic and social impacts from these experiences should continue to be monitored. Communities experiencing socioeconomic disparity before the pandemic were the most vulnerable to COVID-19 disparities and will likely require more time to fully recover.
As of January 6, 2022, the Tri-State region had over 3 million COVID-19 cases and 47,000 related deaths. Cases and death rates in Kentucky and West Virginia exceeded national benchmarks, and negative health outcomes disproportionately affected unvaccinated individuals Across West Virginia on January 6, 2022, there were 758 active COVID-19 hospitalizations and 78.1% of patients were unvaccinated. Approximately 60% of eligible residents across the Tri-State region were fully vaccinated compared to 66% nationally.


2022-2025 MOUNTAIN HEALTH NETWORK COMMUNITY HEALTH NEEDS ASSESSMENT 53
Key Informant Survey – COVID-19 Insights and Perspectives


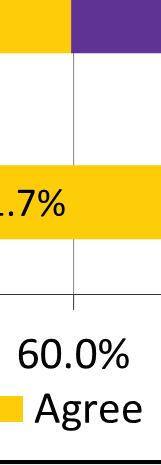


Nearly 91% of key informants agreed or strongly agreed that COVID-19 had a negative impact on the health and well-being of the people their organization serves. Thinking about these individuals, informants were asked to rate their level of agreement with a variety of statements about COVID-19, including access to testing, vaccination, and reliable information; susceptibility to misinformation; and likeliness to follow recommended safety protocols. Their responses are shown in the following graph.


54 2022-2025 MOUNTAIN HEALTH NETWORK COMMUNITY HEALTH NEEDS ASSESSMENT
COVID


IMPACT ON COMMUNITIES
Most key informants agreed or strongly agreed that the people their organization serves received COVID-19 testing, vaccination, and/or reliable information. Testing was seen as the most accessible resource, with 77.6% of informants agreeing or strongly agreeing that individuals received it when they needed it. These findings indicate widespread community availability of COVID-19 resources.

It is worth noting that despite wide access to COVID-19 resources, approximately 12% of informants indicated individuals did not receive vaccination and 22% were undecided (neither agreed nor disagreed). Additionally, 72.5% agreed or strongly agreed that individuals were susceptible to misinformation about COVID-19, and 20% disagreed or strongly disagreed that individuals wore recommended PPE to protect themselves and others. These findings indicate potential lack of trust in or adherence to recommended safety protocols.


Key informants were asked about the likeliness of the people their organization serves to be influenced by health care leaders, including local providers and health department representatives, to follow COVID-19 safety protocols like masking and vaccination. Approximately 70.6% agreed or strongly agreed that health care leaders influenced individuals to follow safety protocols, but health care organizations overall were less likely to be a top source of information for COVID-19.

Key informants were asked to identify the most likely sources of COVID-19 information for the people their organization serves. Key informants ranked up to three responses with #1 the most likely source for information. An option to “write in” any source not included on the list was provided.


Social media was perceived as the top source of COVID-19 information, with 29.1% of informants selecting it as the No. 1 source and 55.1% selecting it as a top three source. Friends and family were also a top source of information. Local or state health departments and the CDC were seen as the No. 1 source for information by about 1 in 10 informants.
Key informants were less likely to identify political leadership or community influencer as the top source for COVID-19 information. Approximately 57.6% of key informants agreed or strongly agreed that elected officials and political leadership influenced individuals to follow COVID-19 safety protocols. Approximately 1 in 10 informants identified political leadership as a top 3 source of information.
2022-2025 MOUNTAIN HEALTH NETWORK COMMUNITY HEALTH NEEDS ASSESSMENT 55
-19
Key Informants were asked to share recommendations for how the community can build or enhance confidence in reliable sources of public health information (e.g., CDC, health departments, health care providers, etc.) in light of COVID-19. Comments largely identified the need for clear language that is consistently presented across community providers, available where individuals frequent, and targeted to the intended audience. Select verbatim comments by informants are included below.
• “A person’s private physician should be the best source for applying reliable information to each individual person’s health status and condition. Encourage everyone to talk to her/his primary care provider.”
• “All public health organizations, hospitals and health care providers should be sending out accurate and consistent messages and trying to dispel myths about COVID.”

• “Be more present in the rural areas and smaller communities.”


• “Engage in more small, town hall/local assembly contexts. In-person informing and face-to-face dissemination of facts most effective.”
• “Greater sensitivity to the cultural environments in which the people are receiving the messaging live. How they think, communicate, what they believe. Who they trust and don’t trust.”


• “Have local physicians and even local patients share their stories and information.”


56 2022-2025 MOUNTAIN HEALTH NETWORK COMMUNITY HEALTH NEEDS ASSESSMENT
COVID -19 IMPACT ON COMMUNITIES
• “Having a greater social media presence presenting the facts about COVID-19. So many people get on social media spreading rumors and myths about the virus that a reliable source needs to step in and provide the facts.
• “Having individuals from the specific community be liaisons and help others hear information that is reliable and accurate.”
• “Identify community leaders, including faith leaders, civic group leaders, doctors whom people trust.”


• “Many of the churches I have visited believe God/faith will protect them. We need pastors to talk about the love of doing our part to protect our neighbors – even if they don’t believe the masks are going to stop the spread, it at least sends a love message.”
• “Meet people where they are, go to their churches, events, make it as easy as possible to get tested/vaccinated (24 hours/7 days a week) and feel safe.”
• “Our clients are stigmatized by health care providers in our community, meaning they won’t trust them when conveying public health information.”
• “Speak with unified voice – denoted, this message supported by.......”
• “Transparency in # of patients, beds, and number of staff available to serve them (vs # of staff needed) in plain language will help community members know when the hospital is strained, which is a good indicator that COVID infection is high and more precautions are needed. Plain language of how many local residents are vaccinated, or received boosters, will help folks understand how to reach a goal.
For instance: ”15,389 residents of Huntington WV are vaccinated, and our goal is to reach 49,987 by XXXX date. Are you ready to help us stop the spread?” Stopping the spread was a useful slogan early on. It was everywhere. And finally, nurses, doctors and all health care personnel have an opinion about COVID vax, and that info is not necessarily factual. Present all staff with the science, ask them to share that info with others. Please use those teaching moments to discredit their doubts (if appropriate) and give them statistics to use. If they walk out saying to others “there’s only a 1000th of a chance of a reaction to this vax... or... the chance of a negative reaction is X as likely as taking an MMR vax” it is a better message than medical staff saying random stuff they heard off interwebs.”
2022-2025 MOUNTAIN HEALTH NETWORK COMMUNITY HEALTH NEEDS ASSESSMENT 57
Community Focus Group: COVID-19 Pandemic Key Take-aways


As part of the 2022 CHNA, focus groups were conducted with residents and health and social service partners representing communities across MHN’s service area. The objectives of the focus groups were to explore individual experiences and perceptions of social determinants of health; assess COVID-19 impact on the needs of the community and recovery efforts; and identify opportunities to advance collaborative initiatives with partners and foster new relationships to address health and social needs.* Key takeaways related to COVID include:
The pandemic had a negative impact on mental health and isolation, particularly for older adults and youth. This concern has been exacerbated by a lack of support services.
Community Comments

• “Being an older person during a pandemic is not an asset. Even if you’ve tried to be healthy all your life, you’re now labeled high-risk and warned of risk of death. The mental strain has been hard.”
• “Mental health for kids was not good before and it’s worse now.”


• “Older adults suffered a great deal of isolation, particularly in nursing homes. They had setbacks in dementia and trusted relationships.”
• “There’s a lot more stress, people stretched beyond their capacity. Parents are stressed in their lives, stressed in their jobs. They were having to work, care for their kids, have their kids home.”
• “We’ve seen such an incredible increase in use for EAP (Employee Assistance Program) for mental health for employees and the community.”
Community Insights
• Awareness of mental health concerns and available resources could be raised through existing programs such as the Compass Project and Veterans resiliency workshops.
• Senior centers are trusted community resources that, with additional support, may serve as partners in providing pandemic recovery services and ongoing health and social support.
• Support arts and other creative opportunities as a form of mental health therapy and alternative to substance use.
• The pandemic highlighted new ways of engaging and communicating across the community (e.g., virtual programming, telehealth, hybrid work settings). These methods can also be used to promote work-life balance and prioritization of self-care.
*Key discussion takeaways from the focus groups are included in the Appendix.
58 2022-2025 MOUNTAIN HEALTH NETWORK COMMUNITY HEALTH NEEDS ASSESSMENT
COVID


IMPACT ON COMMUNITIES
The pandemic interrupted child learning and development, including social emotional learning.

Community Comments
• “Child development losses were huge, as was growth in abuse. Sometimes the only caring adult for a child was in the classroom. Not surprised law enforcement calls went down.”
• “Screen time among youth worsened during the pandemic. It’s nothing for them to have 11-14 hours per day. They’re still going to school, but with less sleep.”
• “We barely had enough professionals to meet the needs of children with special needs before the pandemic, and now the need is compounded. There are more children coming into the system with special needs.”
Community Insights
• Social emotional learning losses were compounded by social determinants of health barriers experienced by families (e.g., poverty) and increased substance use during the pandemic. Post-Pandemic there is a need for greater awareness of community resources to address these issues and community navigators to bridge connections.
• Incorporate social emotional learning and relationship-building into activities that already engage with youth.
Residents delayed preventive care during the pandemic, contributing to higher demand for services now and higher acuity conditions.
Community Comments


“When cases started falling, it was a rush to get everything… weeks of medical, dental appointments. I practically took a week off of work just to get caught up.”
Community Insights


• Telehealth can increase medical capacity and address access barriers like transportation.

“Telehealth was the bright side of the pandemic. It made it more mainstream and prevalent. It’s so much easier to handle an appointment via telehealth.”
• Primary care offices could identify individuals who were not seen for care during the last one to two years and schedule them for appointments.

2022-2025 MOUNTAIN HEALTH NETWORK COMMUNITY HEALTH NEEDS ASSESSMENT 59
-19
Mixed messaging and misinformation about COVID eroded public trust in health care and public health entities.
Community Comments
• “COVID was a messaging failure, communication broke down between professionals and lay individuals.”


• “People were stigmatized for masking, their vaccination status, if they socialized in groups.”
• “Public health has been so stigmatized. Moving forward will require the seperation of public health and politics.”
Community Insights

• Pandemic communication to older adults was perceived as lacking dignity. “We need a balance of talking with at-risk populations while still fostering autonomy.”
• West Virginia residents overall were seen as more likely to adhere to COVID-19 safety recommendations due to statewide leadership and local efforts “The Governor was plain spoken and relatable versus national guidelines” This feedback can inform ongoing pandemic communication and other public health messaging post-pandemic.
The pandemic exacerbated economic disparities and social service agencies are struggling to meet increased demand.
Community Comments


• “At the onset, there were options (stimulus, school lunch pickup). We saw fewer people coming to the food pantry because they had income. When that went away, it was a sea of people coming in.”
• “Even with stimulus, there was still need. It did not address poverty, particularly given inflation and rising costs and loss of child tax credits.”
• “Prior to the pandemic, we (Huntington City Mission) served 116,000 meals. In 2021, we served 185,000 meals. We’re on track to serve 220,000 meals in 2022.”
• “The number of homeless in the community has doubled in the last year.”
• “The top needs we’re seeing are rental, mortgage, and utility assistance. The problem now is responding; programs are running out of money.”
• “We have people who ride their lawn mower to the food pantry because they don’t have transportation.”
60 2022-2025 MOUNTAIN HEALTH NETWORK COMMUNITY HEALTH NEEDS ASSESSMENT
COVID -19 IMPACT ON COMMUNITIES


Community Insights


• Education on insurance-covered services (e.g., caregiver housing for hospitalized Medicare patients, transportation) is needed.


• Volunteering fell sharply in the pandemic, creating financial burden for the organizations that have long depended on them.
2022-2025 MOUNTAIN HEALTH NETWORK COMMUNITY HEALTH NEEDS ASSESSMENT 61
EVALUATION OF HEALTH IMPACT: 2019-2022 COMMUNITY HEALTH IMPROVEMENT PLAN PROGRESS
How do we create a culture of health in our communities? MHN hospitals identified and prioritized significant community health needs in 2019 to guide community benefit and population health improvement activities across our service area. The plan built upon earlier successes and led to the development of goals and objectives to address behavioral health and substance use disorder, including Neonatal Abstinence Syndrome (NAS) and chronic disease prevention and management, with a focus on diabetes, heart disease and tobacco use/lung disease.
Within six months of the release of the Implementation Plan, the COVID-19 pandemic shifted the priorities of our community and MHN adapted our work to respond to the emergent needs of residents.
Prior to the pandemic, MHN hospitals participated in health fairs throughout the service area. These events provided free flu shots and free screenings for health issues, such as cholesterol, blood sugar, diabetic foot screenings, and osteoporosis. Education about stroke, joint replacement surgery, and risk factors for diabetes and other health issues was also provided. These services often targeted the senior population.
The following sections outline our work to impact the priority health needs and respond to COVID-19 in our communities.
COVID-19 Pandemic


The first case of COVID-19 was confirmed in the United States on Jan. 21, 2020, with West Virginia reporting its first case March 17, 2020. Despite the challenges of the unknown, MHN and its hospitals were able to provide a robust response to the pandemic, working in partnership with other key community agencies.


Communication


MHN Communications quickly established the health system as a trusted resource for accurate,up-to-date information on COVID-19. MHN shared important facts about the disease through advertising, social media and a dedicated COVID-19 website.


MHN also joined the Cabell-Huntington Health Department (CHHD), Cabell County EMS, the City of Huntington, Marshall University, and Cabell County Schools to form a Joint Information Center to share information about how COVID-19 was affecting the respective entities and to jointly handle media requests.
MHN admitted its first COVID+ patient at CHH on March 20, 2020, but the system had already taken several steps to prepare in order to keep patients, visitors, and staff safer. Visitation guidelines were changed to reflect changes in community spread, public entrances were reduced and manned by COVID screeners, and construction updates were made to better isolate COVID+ patients. MHN made additional physical changes to adjust to fluctuations in community spread throughout the pandemic.
62 2022-2025 MOUNTAIN HEALTH NETWORK COMMUNITY HEALTH NEEDS ASSESSMENT


2022-2025 MOUNTAIN HEALTH NETWORK COMMUNITY HEALTH NEEDS ASSESSMENT 63 COVID -19 IMPACT ON COMMUNITIES
TIMELINE


COVID-19

2020
West Virginia, the last U.S. state without a case of COVID-19, reports its rst occurrence of the disease.


MHN admits its rst COVID+ patient at CHH, a Gallia County resident.


CHH and SMMC defer all elective operative procedures. Both CHH and SMMC begin new entrance policies, restricting public access
West Virginia
Gov. Jim Justice issues a stay-at-home executive order.
Cabell County has its rst con rmed resident with COVID-19.
Businesses and individuals in the community begin donating personal protective equipment (PPE), meals and other needed items to MHN facilities across the Tri-State More than 1,511 meals were donated to CHH and SMMC through the My Huntington Cares Fund established by the Foundation for the Tri-State Community.
MHN enacts a no visitation policy at both CHH and SMMC.
Furloughs begin for MHN employees who work in departments a ected by service shutdowns due to COVID-19.
Gov. Justice issues an executive order prohibiting all elective medical procedures in the state The West Virginia order follows a similar order in Ohio, e ective March 18, which ended elective surgeries at Three Gables Surgery Center.
CHH and SMMC are approved to resume urgent elective medical procedures by the West Virginia O ce of Health Facility Licensure and Certi cation (OHFLAC). These procedures resume ve days later.

CHH and SMMC begin administering monoclonal antibody treatments to COVID patients after the FDA gives Emergency Use Authorization to Regeneron’s antibody therapy bamlanivimab.


The rst COVID-19 vaccines are administered to frontline workers at CHH and SMMC after the FDA gives Emergency Use Authorization to the P zer-BioNTech vaccine.
MHN once again restricts visitation by allowing inpatients only one visitor per day and reducing visiting hours.

The WV National Guard begins its deployment at CHH and SMMC to help deal with the COVID surge. The Guard were deployed at hospitals across the state to assist with sta ng challenges. The Guard’s deployment ended March 8, 2022.
MHN returns to a no visitation policy in response to increased community spread of COVID-19.
MHN hospitals reach their peak in COVID+ patients with 109 at CHH and SMMC combined.
CHH and SMMC return to restricted visitation, once again allowing inpatients to have one visitor per day.
MHN hospitals reach another peak in COVID+ patients with 214 at CHH and SMMC combined.
MHN once again allows inpatients to have two visitors per day and returns visiting hours to 8 a.m. to 8 p.m.
 The CDC con rms the rst case of COVID-19 in the United States.
CHH and SMMC begin restrictions on inpatient visitation. Restrictions are expanded to outpatient clinics and emergency rooms ve days later.
Furloughed MHN employees begin returning to work.
MHN receives 185 vials of Remdesivir, which has been authorized by the FDA for emergency treatment of COVID-19 illness.
CHH and SMMC resume their restricted visitation policies, allowing each inpatient one visitor per day. Clinical rotations also begin to be phased back into the hospitals.
Nickie Swain from Mercerville, Ohio, returns home after spending four months at SMMC battling COVID-19 (Stor y appeared in Leading Edge Summer 2020).
The CDC con rms the rst case of COVID-19 in the United States.
CHH and SMMC begin restrictions on inpatient visitation. Restrictions are expanded to outpatient clinics and emergency rooms ve days later.
Furloughed MHN employees begin returning to work.
MHN receives 185 vials of Remdesivir, which has been authorized by the FDA for emergency treatment of COVID-19 illness.
CHH and SMMC resume their restricted visitation policies, allowing each inpatient one visitor per day. Clinical rotations also begin to be phased back into the hospitals.
Nickie Swain from Mercerville, Ohio, returns home after spending four months at SMMC battling COVID-19 (Stor y appeared in Leading Edge Summer 2020).
64 2022-2025 MOUNTAIN HEALTH NETWORK COMMUNITY HEALTH NEEDS ASSESSMENT
2020 2020 2020 2020
20202022 2020 2020 2021 20212022 2022 2020 2020
2020 2020 2020 2020 2020 2020 2020 2020 2020 23
COVID -19 IMPACT ON COMMUNITIES
Testing


An important component to the fight against COVID-19 is access to community testing. CHH partnered with Marshall Health to provide a drivethru testing site outside of the hospital. The site administered 13,204 tests in FY 2020 (October 1, 2019 – September 30, 2020) and 36,008 tests in FY 2021 (October 1, 2020 – September 30, 2021). MHN also partnered with the CHHD to provide a location for CHHD testing and to share information about other CHHD sites.
Vaccination
When the COVID-19 vaccine became available, MHN partnered with the CHHD to help make it available to all approved groups, offering locations for vaccination sites and offering resources to open the COVID-19 Vaccine Center at the Huntington Mall. The site at Huntington Internal Medicine Group (HIMG) administered 1,602 vaccines and the Vaccine Center administered 51,561 vaccines in FY 2021. MHN Communications shared information about the vaccine through several outlets including advertising, social media and the dedicated COVID-19 website, encouraging the community to get vaccinated when eligible. That information included addressing myths regarding the vaccine, as well as testimonials from frontline workers and trusted physicians.
Treatments
MHN’s hospitals were leaders in the community in COVID-19 treatments. CHH became a regional hub for the distribution of the drug, Remdesivir, in May 2020. When monoclonal antibody treatments were approved for use


by the FDA in Nov. 2020, MHN hospitals were able to offer them at three different sites, including HIMG. Hoops Family Children’s Hospital at CHH became the first facility in West Virginia to offer a dedicated space for pediatric monoclonal antibody treatments.The COVID-19 pandemic is ever changing and MHN made and continues to make the necessary adjustments to provide high quality care to the community while prioritizing the safety of patients, visitors, and staff.
Community Building
Despite many programs being affected by COVID-19, MHN participated in a number of community-building activities to promote wellness and help enrich the lives of people in the region. As one example, CHH hosted blood drives at the hospital in May and September 2020 and SMMC hosted drives in February, June and July 2021. The drives were promoted to hospital employees to assist in the severe blood shortage faced by the American Red Cross.
During six months of the COVID-19 pandemic when local school systems were holding classes virtually, MHN employees with school-age children reported having access issues with virtual school learning at home. Due to cell tower and broadband limitations in the region we live, accessing the internet is not always an option depending on where someone’s home is located. To respond to this community need, MHN partnered with Cabell County Schools to create a virtual school at its Center for Education location. This allowed employees to drop off their children each day to connect online and attend their school. MHN hired three Cabell County school teachers to assist the children with their school assignments. In FY 2021 (October 1, 2020 – March 31, 2021), 568 children attended the virtual school program held by MHN.
2022-2025 MOUNTAIN HEALTH NETWORK COMMUNITY HEALTH NEEDS ASSESSMENT 65
A Story of Surviving


The evening of March 29, 2020, Lynn Swain knew something was wrong. She and her husband, Nickie, had both experienced flu-like symptoms, but she had quickly recovered. However, Nickie had not and had become incoherent.


Coronavirus Disease 2019 (COVID-19) was just starting to make local headlines, so it was in the back of Lynn’s mind when she took her husband to the emergency room at St. Mary’s Medical Center (SMMC). But at age 67, Nickie was retired and didn’t go many places. The couple lived in rural Gallia County, Ohio, in the small, tight-knit community of Mercerville, just north of Crown City. COVID-19 couldn’t really happen to them, she thought.


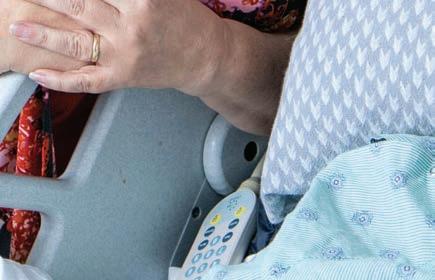


But happen it did. Even before Nickie’s COVID-19 test result came back positive; he began losing oxygen and was placed on a ventilator. “He came in with mild confusion and weakness and didn’t look that ill,” said William R. Beam, MD, medical director of the critical care unit at SMMC and a pulmonologist at HIMG. “But then he deteriorated quickly.”
Nickie spent the next 60 days in the SMMC Cardiovascular Intensive Care Unit (CVICU). The list of conditions he developed as COVID-19 ravaged his body is lengthy and includes Acute Respiratory Distress Syndrome (ARDS), bacterial pneumonia and renal failure. His diabetes became difficult to control and he developed multisystem organ failure. His chance of survival went as low as 20%. “I just didn’t know how it could get that bad,” Lynn said. Remdesivir (an anti-viral medication) and convalescent plasma were not available at the time, so Dr. Beam tried a number of the early suggested therapeutics, but nothing worked. The turning point, according to Dr. Beam, was when the decision was made to treat Nickie with anticoagulation and dexamethasone, a corticosteroid.

How St. Mary’s Medical Center helped a local man stare down and defeat the deadly virus 66 2022-2025 MOUNTAIN HEALTH NETWORK COMMUNITY HEALTH NEEDS ASSESSMENT
Surviving COVID-19


“It was a small decision with a big impact,” Dr. Beam said. “That’s what critical care medicine is. It’s the sum of small decisions that address and anticipate complications and minimize additional organ injury.” Due to COVID-19 safety restrictions, Lynn was unable to visit her husband. But she said the nursing staff in the SMMC CVICU cared for Nickie as well as treated her and her loved ones like family. Beam said Nickie is alive because of that exceptional nursing care.
Jessica Merrick, RN, one of the CVICU nurses who treated Nickie, said she is incredibly proud of how she and her fellow nurses stepped up to the challenge of caring for a patient with this new, unknown disease. “We were in this battle with him,” Merrick said. “Since his family couldn’t be by his side in those hardest moments to hold his hand and encourage him, we were there for both him and his family.”
“We were in this battle with him,”


“Since his family couldn’t be by his side in those hardest moments to hold his hand and encourage him, we were there for both him and his family.”
Kelli Yahr, RN, took care of Nickie many nights. She remembers the worst of those nights when it looked like he wasn’t going to make it. “We were certain his time was coming,” she said. “I remember holding his hand that night and telling him that this wasn’t how he was going out. I remember praying so many times that night.”
Exactly one week later, Dr. Beam called Lynn to tell her Nickie was going to make it. “It was the biggest moment,” she said. “I tried to keep my composure, but I was praising the Lord all over my kitchen.” “The next time I saw him, I walked past his room and saw that he was smiling,” Yahr said. “It brought tears to my eyes. I was truly blessed to be a small part of his journey.”
Dr. Beam said Nickie’s case became very personal for his entire care team. “We were invested in his survival. It was a big victory for him, his wife and the nursing staff to see him wheeled out of the CVICU.” Nickie said he remembers very little about being sick and has no idea how he contracted COVID-19, which he calls the “meanest thing he’s ever dealt with.” He also remembers very little about the care he received. But Lynn will always remember and has nothing but glowing reviews for the staff at St. Mary’s. “We have excellent medical facilities right here in our community, and we should be very thankful for that,” she said. “The effort his medical team put into his care, I don’t have enough words to express my gratitude. I can never thank them or repay them.”
Today Merrick is back home in Mercerville, spending time with Lynn, their four children and seven grandchildren. “I thank God every day that I have him,” Lynn said. “Something like this makes you realize just how precious people and relationships are to you.”

COVID -19 IMPACT ON COMMUNITIES
2022-2025 MOUNTAIN HEALTH NETWORK COMMUNITY HEALTH NEEDS ASSESSMENT 67
2022-2025 PRIORITY HEALTH NEEDS
The region is home to engaged community partners who are actively collaborating to address health needs and promote quality of life for residents.
It is imperative to prioritize resources and activities toward the most pressing and cross-cutting health needs within our community. In determining the issues on which to focus efforts over the next three-year cycle, MHN collected feedback from community partners and sought to align with community initiatives. MHN will focus efforts on the following community health priorities over the next three-year cycle:
• Behavioral health


- Adult and youth
• Substance use disorder
- Adult and youth
• Chronic disease prevention and management


• Aging population
• Food insecurity
The region is home to engaged community partners who are actively collaborating to address health needs and promote quality of life for residents.
Underlying these priorities are the cross-cutting issues of social determinants of health and disparities in access to care. In developing the 2022-2025 Implementation Plan, MHN sought to prioritize strategies that address these underlying issues to promote an upstream, preventive approach to community health improvement.
The CHNA data illuminate significant health disparities for MHN service area residents, and often miss the community’s strengths and commitment to a healthier and thriving region. As one focus group participant stated, “The City of Huntington is seen nationally as a city of solutions.”
68 2022-2025 MOUNTAIN HEALTH NETWORK COMMUNITY HEALTH NEEDS ASSESSMENT
PRIORITY HEALTH NEEDS


2022-2025 MOUNTAIN HEALTH NETWORK COMMUNITY HEALTH NEEDS ASSESSMENT 69
In the past, this collaboration has led to national models in obesity reduction and opioid addiction solutions. Over 10 years ago, the CDC named the city of Huntington as the most obese city in America, affecting about 45% of the area’s adults. Through various efforts, Huntington has cut its obesity rate by nearly 15 percentage points. Past successes in these areas lend hope and a framework to replicate.
Community Health Survey


Overall, respondents believe that obesity (65%) and COVID-19 (65%) are the biggest health issues in their community.


The 2022-2025 Implementation Plan will continue to build on community partnerships and successes to address the community’s top health needs.

In addition to the Key Informant Survey, as part of the 2022 CHNA, MHN contracted with NRC Health to conduct an online survey of patients and community residents to better understand the community’s needs around health care access, as well as how it affects respondents personally. The community survey results are reported in full in the Appendix.
Community survey findings showed respondents were thinking about obesity, COVID-19, substance abuse and mental health in January 2022, when asked what the biggest health needs within their community were.
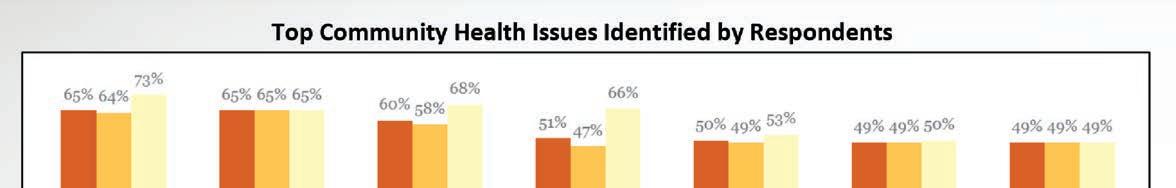
70 2022-2025 MOUNTAIN HEALTH NETWORK COMMUNITY HEALTH NEEDS ASSESSMENT
PRIORITY HEALTH NEEDS


Behavioral Health


The MHN service area overall has comparable access to behavioral health providers compared to the nation, and the rate of providers increased more than 70% from 2016 to 2020. Despite increasing provider availability, all counties in the service area, except Putnam, are mental Health Professional Shortage Areas (HPSAs). Nearly all HPSAs are designated for either low-income or high-needs residents, defined as having high levels of poverty and/or more vulnerable populations (e.g., youth, older adults).
Among Community Survey respondents, 51% identified mental health as the biggest health need within their community, and 54% identified mental health services as a needed community resource. Across the three states, adults report an average of 5-6 poor mental health days per month, see chart on page 74 Additionally, approximately 20% or more of adults residing in the MHN service area report frequent mental distress compared to a national average of 13.9%. Adults in Boone, Lincoln, Logan, and Mingo counties in West Virginia report the highest prevalence of mental distress at approximately 24% of adults. See map on page 74.
2022-2025 MOUNTAIN HEALTH NETWORK COMMUNITY HEALTH NEEDS ASSESSMENT 71
Access to behavioral mental health providers is improving nationally and across the Tri-State region. Within the MHN service area, the rate of mental health providers increased more than 70% from 2016 to 2020. The MHN service area overall has a similar rate of mental health providers as the nation, however, the provider rate is skewed by higher availability in select counties, including Boyd in Kentucky, Scioto in Ohio, and Cabell and Kanawha in West Virginia. All counties except Putnam are HPSAs for mental health care. The western, southern, and northern portions of the service area are high-needs HPSAs (highlighted in red in the map below). Most West Virginia counties are HPSAs for low-income populations (highlighted in yellow in the map to the right).


Note: The mental health provider rate includes psychiatrists, psychologists, licensed clinical social workers, counselors, and mental health providers that treat alcohol and other drug abuse, among others. It does not account for potential shortages in specific provider types.


72 2022-2025 MOUNTAIN HEALTH NETWORK COMMUNITY HEALTH NEEDS ASSESSMENT
PRIORITY HEALTH NEEDS


Mental Health Care Health Professional Shortage Areas


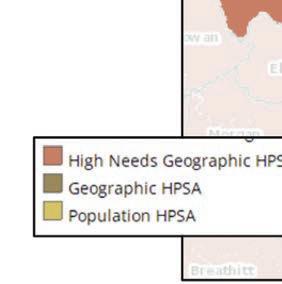


2022-2025 MOUNTAIN HEALTH NETWORK COMMUNITY HEALTH NEEDS ASSESSMENT 73
Source: Health Resources and Services Administration, 2021 *Population HPSA locations affect low-income populations
2019 Age-Adjusted Prevalence of Frequent Mental Distress among Adults by County


 Poor Mental Health, Prevalance Among Adults Age 18+ by County, CDC BRFSS PLACES Project 2019
Source: Center for Disease Control and Prevention, BRFSS
Poor Mental Health, Prevalance Among Adults Age 18+ by County, CDC BRFSS PLACES Project 2019
Source: Center for Disease Control and Prevention, BRFSS
74 2022-2025 MOUNTAIN HEALTH NETWORK COMMUNITY HEALTH NEEDS ASSESSMENT 2018 Age-Adjusted Adult (Age 18+) Poor Mental Health Days
PRIORITY HEALTH NEEDS


Frequent mental distress is a risk factor for suicide. The MHN service area has historically had a higher suicide death rate than the nation, following a similar trend as West Virginia, although the death rate declined in 2019 and 2020. In 2020, the service area saw a total of 163 suicide deaths.

An analysis of demographic characteristics for suicide deaths occurring from 2016 to 2020 within the MHN service area suggests that males are more than five times as likely to die by suicide than females. Suicide deaths are also more likely among young- to middle-age adults and White residents.


Source: Center for Disease Control and Prevention
Source: Center for Disease Control and Prevention
Source: Center for Disease Control and Prevention

*Rates are not age-adjusted


2022-2025 MOUNTAIN HEALTH NETWORK COMMUNITY HEALTH NEEDS ASSESSMENT 75
Behavioral Health


Youth Health

Consistent with reported mental health concerns, the MHN service area has historically had a higher suicide death rate than the nation, although the death rate declined in 2019 and 2020. Youth are particularly vulnerable for mental health problems and suicidal ideation, and West Virginia youth have historically been at higher risk than youth across the nation. In 2019, more than 11% of West Virginia high school students reported an attempted suicide, an increase from 7.5% in 2013. The proportion of students feeling consistently sad or hopeless increased nearly 10 percentage points from 27.5% to 36.4% during the same time period.


The COVID-19 pandemic exacerbated mental health concerns for many residents, particularly youth. An analysis of MHN behavioral health-related Emergency Department (ED) visits in 2020 and 2021 found that at SMMC, suicide and intentional self-inflicted injury was the top behavioral health diagnosis. An analysis of patient age demographics found that of the 963 visits due to suicide and intentional self-inflicted injury, 166 or 17.2% were among youth under age 18. Approximately 41.4% were among young adults aged 18-34.
Source: Centers for Disease Control and Prevention, YRBS *Data for Ohio are not reported for 2015-2017

76 2022-2025 MOUNTAIN HEALTH NETWORK COMMUNITY HEALTH NEEDS ASSESSMENT
PRIORITY HEALTH NEEDS


West Virginia students have also historically reported more suicide attempts compared to other states in the region and the nation overall, and the percentage increased through 2019. In 2019, more than 11% of West Virginia high school students reported an attempted suicide, an increase from 7.5% in 2013. Consistent with the nation, suicide attempts were more likely among females and students identifying as LGBTQIA+.


Suicide attempts among youth may be due in part to consistent feelings of sadness or hopelessness. The proportion of students feeling consistently sad or hopeless increased in all three states from 2013 to 2019; in West Virginia, it increased nearly 10 points from 27.5% to 36.4%.


High School Students Reporting an Attempted Suicide

Source: Center for Disease Control and Prevention, YRBS
Source: Center for Disease Control and Prevention, YRBS, 2019
 High School Students Reporting an Attempted Suicide
2022-2025 MOUNTAIN HEALTH NETWORK COMMUNITY HEALTH NEEDS ASSESSMENT 77
Substance Use Disorder


Substance use disorder was identified as the most pressing concern for residents by Key Informant Survey participants (for survey results, see Appendix). The MHN service area was among the hardest hit by the opioid epidemic and has historically seen higher death rates due to accidental drug overdose. Provisional data released by the CDC predicts that 2020 and 2021 brought the highest number of overdose deaths ever in the US due to pandemic-related stress and health care interruptions.
Substance use disorder affects a person’s brain and behaviors and leads to an inability to control the use of substances which include alcohol, marijuana, and opioids, among others. Alcohol use disorder is the most prevalent addictive substance used among adults.

Across the Tri-State region, adults report binge drinking at a similar or lower proportion as the nation. Binge drinking includes males having five or more drinks on one occasion and females having four or more drinks on one occasion. Of note, Ohio has the highest proportion of adults who report binge drinking, and a higher proportion of driving deaths due to alcohol impairment than the nation.


Alcohol Use Disorder Indicators


Source: Centers for Disease Control and Prevention, BRFSS
Provisional data released by the CDC predicts that 2020 and 2021 brought the highest number of overdose deaths ever in the US. The MHN service area overall has historically had more drug overdose deaths than the nation and saw a significant increase in deaths in 2020.

Source: Centers for Disease Control and Prevention

78 2022-2025 MOUNTAIN HEALTH NETWORK COMMUNITY HEALTH NEEDS ASSESSMENT
PRIORITY HEALTH NEEDS


From 2019 to 2020, the number of accidental overdose deaths occurring within the MHN service area increased 47%. The rate of death for the service area was more than four times higher than the national rate of death and exceeded the Tri-State region overall. Deaths continued to be higher among males and middle-age adults. When viewed by county, Logan County in West Virginia had the highest rate of death per 100,000 at 160.9, followed by Cabell County at 150.5.

Nationally, accidental overdose deaths have increased among Black/ African Americans. This trend has been linked to inequities in access to addiction treatment and prevention efforts. Studies conducted by the National Institutes of Health have found that Black/African Americans are less likely to be prescribed medications for opioid use disorder, or to have access to life saving antidote drugs like naloxone. Within the MHN service area, it is worth noting that while Black/African Americans account for a small proportion of overdose deaths (5%) they have a similar rate of death as Whites.
 Source: Centers for Disease Control and Prevention
2020 MHN Service Area Counties with Highest Accidental Overdose Death Rate per Age-Adjusted 100,000
Source: Centers for Disease Control and Prevention
*Rates are not age-adjusted
2020 MHN Service Area Accidental Overdose Deaths, Demographic Characteristics
Source: Centers for Disease Control and Prevention
2020 MHN Service Area Counties with Highest Accidental Overdose Death Rate per Age-Adjusted 100,000
Source: Centers for Disease Control and Prevention
*Rates are not age-adjusted
2020 MHN Service Area Accidental Overdose Deaths, Demographic Characteristics
2022-2025 MOUNTAIN HEALTH NETWORK COMMUNITY HEALTH NEEDS ASSESSMENT 79
Substance use disorders affect all ages, including newborns. Neonatal abstinence syndrome (NAS) is defined as an array of withdrawal symptoms that develop soon after birth in newborns exposed to addictive drugs while in the mother’s womb. Although commonly associated with opioid exposure, other substances, including antidepressants and benzodiazepines, can also cause NAS. In addition to difficulties of withdrawal after birth, problems may include premature birth, seizures, respiratory distress, birth defects, poor growth and other developmental problems.


The following table analyzes the occurrence of NAS among newborns within the Tri-State region. The rate of NAS has historically been higher in the Tri-State region, particularly in West Virginia, than the nation. The rate of NAS declined in 2019, but this trend should continue to be monitored in light of accidental overdose death trends reported for 2020.


Source:Agency for Healthcare Research and Quality *2015 values are based on the first three quarters of data using ICD-9-CM coding.


 2019 Neonatal Abstinence Syndrome per 1,000 Newborn Hospitalizations
80 2022-2025 MOUNTAIN HEALTH NETWORK COMMUNITY HEALTH NEEDS ASSESSMENT
Substance Use Disorder


PRIORITY HEALTH NEEDS
Youth Health
The proportion of high school students in the Tri-State region using traditional cigarettes declined from 2013 to 2019, although it remains higher in Kentucky (8.9%) and West Virginia (13.5%) than the nation (6%). Consistent with the nation, high school students in the Tri-State region are more likely to report using e-cigarettes, with approximately one-quarter to one-third of students reporting use in 2019. Reported use was generally higher among white students and students identifying as LGBTQT.


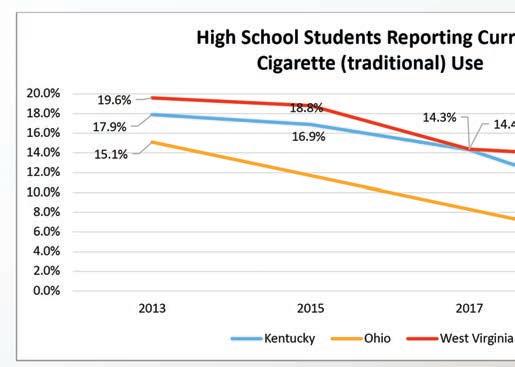
Consistent with the nation, alcohol is the most used substance among high school students in the Tri-State region, although use has generally declined. The exception is a slight increase in both overall alcohol use and binge drinking among West Virginia students in 2019, a trend that should continue to be monitored. Alcohol use is generally higher among females, White, and/or students identifying as LGBTQIA+. Marijuana and prescription drug use have been generally stable and/or declining in states with reportable data.
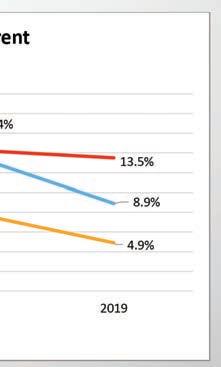
Of note, West Virginia high school students generally report higher use of substances, including traditional cigarettes, e-cigarettes, alcohol, marijuana, and prescription pain medication than their peers across the region and the nation.
High School Students Reporting Current (within past 30 days) E-Cigarette Use
Source: Centers for Disease Control and Prevention, YRBS
Source: Centers for Disease Control and Prevention, YRBS
*Data for Ohio are not reported for 2015 or 2017

Source: Centers for Disease Control and Prevention, YRBS
 2019 High School Students Reporting Current (within past 30 days) E-Cigarette Use
2022-2025 MOUNTAIN HEALTH NETWORK COMMUNITY HEALTH NEEDS ASSESSMENT 81
High School Students Reporting Current (within past 30 days) Alcohol Use


 Source: Centers for Disease Control and Prevention, YRBS
High School Students Reporting Current (within past 30 days) Alcohol Use
Source: Centers for Disease Control and Prevention, YRBS
Source: Centers for Disease Control and Prevention, YRBS
High School Students Reporting Current (within past 30 days) Alcohol Use
Source: Centers for Disease Control and Prevention, YRBS
82 2022-2025 MOUNTAIN HEALTH NETWORK COMMUNITY HEALTH NEEDS ASSESSMENT
Source: Centers for Disease Control and Prevention, YRBS
PRIORITY HEALTH NEEDS


Source: Centers for Disease Control and Prevention, YRBS
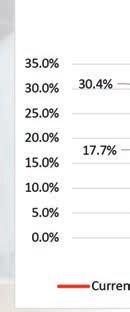

*Data for Ohio are not reported for 2015 or 2017. Approximatley 13.4% of Ohio students reported binge drinking in 2019; prior years of data are not reported. Data for marijuana use and prescription drug use are not reported.


Source: Centers for Disease Control and Prevention, YRBS


2022-2025 MOUNTAIN HEALTH NETWORK COMMUNITY HEALTH NEEDS ASSESSMENT 83
Emergency Department Use


Behavioral health conditions, including mental health and substance use disorders, are most effectively treated in community-based settings outside of the ED, but nationwide, individuals with behavioral health conditions are one of the fastest growing ED patient populations largely due to shortages in community-based services and difficulties navigating the health care system. CHH and SMMC saw a combined 6,350 behavioral health-related ED visits in 2020 and 5,594 visits in the first 10 months of 2021.

The following table depicts the top six behavioral health diagnoses by total ED visits across the two hospitals. It is worth noting that suicide and intentional self-inflicted injury was the top behavioral health diagnosis at SMMC in both 2020 and 2021, totaling 963 visits and accounting for approximately 21% of all behavioral health-related ED visits. An analysis of patient age demographics found that of the 963 visits due to suicide and intentional self-inflicted injury, 166 or 17.2% were among youth under age 18. Approximately 41.4% were among young adults aged 18-34.


84 2022-2025 MOUNTAIN HEALTH NETWORK COMMUNITY HEALTH NEEDS ASSESSMENT
PRIORITY HEALTH NEEDS


Substance-related disorders (excluding alcohol) accounted for approximately 20% of behavioral health-related ED visits at both hospitals in 2020 and 2021. Young adults aged 18-34 comprised the largest proportion of individuals seeking ED services for substance-related disorders, accounting for 35.9% (n=451) of visits at CHH and 48% (n=436) of visits at SMMC.
The following table depicts the top patient zip codes of origin for ED visits due to suicide and intentional self-inflicted injury and substance-related disorders. Approximately 45% of ED visits for these conditions were by patients residing in five zip codes, four within Huntington in Cabell County and one within neighboring Ironton in Lawrence County, Ohio. It is worth noting that CHH and SMMC are located within zip codes 25701 and 25702, respectively, while SMMC has a free-standing ER within zip code 45638. This may drive higher patient volumes from these areas. All zip codes, except 25705, are also areas of socioeconomic disadvantage which can contribute to behavioral health concerns.

2022-2025 MOUNTAIN HEALTH NETWORK COMMUNITY HEALTH NEEDS ASSESSMENT 85
CABELL HUNTINGTON HOSPITAL EVALUATION OF HEALTH IMPACT 2019-2022


BEHAVIORAL HEALTH AND SUBSTANCE USE DISORDER


Cabell Huntington Hospital Evaluation of Health Impact


Health Priority Area: Behavioral Health and Substance Use Disorder Goal: Support substance use disorder (SUD) efforts and improved outcomes in our community for people with a behavioral health and/or substance use disorder and their families, including infants with Neonatal Abstinence Syndrome (NAS).
The city of Huntington, West Virginia, is one of the hardest hit places in the US when it comes to the opioid-substance use epidemic. The crisis clearly hurts not only the people in active addiction, but their families and it can have devastating impacts on unborn babies, newborn babies, and children. Recovery doesn’t happen alone. In Huntington, health care providers, hospitals, Marshall University, community organizations, and grantors all work together to ensure access to the addiction care and treatment people need. The pandemic worsened behavioral health needs in the region, as was seen across the country, but MHN programs continued, as new means of support were used, including telehealth and virtual meetings and classes. The following strategies and programs increased access to care and supported behavior change and lifestyle improvements through referrals.
In 2018, Provider Response Organization for Addiction Care and Treatment (PROACT) was announced as a community- based center and one-stop shop for individuals seeking substance use disorder treatment and recovery services. More than $3 million was committed to support the initiative by diverse community partners, including CHH and SMMC. Combined with other initiatives, like maternal addiction supports and Law Enforcement Assisted Diversion, these efforts led to declines in opioid use and overdose pre-pandemic.
Strategies:
• Provide the Hoops Family Children’s Hospital (HFCH) Child Advocacy Center (CAC), where young victims of abuse and neglect receive services in a child-friendly environment.

The CAC is dedicated to offering children and families compassionate care to reduce the trauma often experienced by children who are victims of abuse. The CAC at HFCH is a safe, child-friendly place for children to speak with trained professionals and medical providers. Thorough evaluations are conducted to identify the appropriate care and services needed for each child. The CAC alleviates the need for a child to tell their traumatic story over and over to doctors, law enforcement, investigators, and others. The CAC at HFCH is the only hospital-based child advocacy center in the Huntington area. The CAC at HFCH was awarded accreditation by National Children’s Alliance in December 2020.
o FY 2020: 207 clients served
o FY 2021: 316 clients served


o FY 2022 June YTD: 197 clients served

86 2022-2025 MOUNTAIN HEALTH NETWORK COMMUNITY HEALTH NEEDS ASSESSMENT
EVALUATION OF IMPACT 2019
• Provide the HFCH Maternal Opioid Medical Support (MOMS) program to provide addiction treatment services, psychological and medical treatment, education, and training to postpartum women, while their babies recover from NAS.
o FY 2020: 381 consults
o FY 2021: 328 consults
o FY 2022 June YTD: 357 consults
Community Testimonials


Healing from addiction takes a network of treatment and resources that focuses on the whole family. The HFCH created the MOMS program to begin once a mother gives birth and provides comprehensive addiction treatment services that promotes the bonding between mother and baby. MOMS provides 100 days of treatment services to postpartum women, not currently in other treatment programs, addressing the specific needs of each mother and covering everything from counseling to occupational rehabilitation with a goal to end the cycle of addiction.
“I am a new mom and I need recovery (MAT) program! I’ve learned that with complete surrender and hard work, anything is possible. I have accomplished goals, (I’m) a better parent, have a better job and a better me.” – Christina Langley, seven months in MOMS
“I came to the MOMS program because I had a child in recovery. I’ve learned how to accept others and since I’ve started, I’ve started to become mature.” – Leigha Evans, three months in MOMS
“I came to the MOMS program for support to stay clean. I’ve learned that I’m not a terrible person or a terrible mom because of my addiction. Now, I am more comfortable in my own skin and confident about life.” –Devan Breeden, six months in MOMS
“I wanted to get clean after having my daughter, so I went to the MOMS program. After being in the MOMS program for a while I realized I’m stronger than I ever believed. I’ve changed the people around me. I’ve learned how to really deal with my stress.”
– Kayla Walters, nine months in MOMS

• Provide the Neonatal Therapeutic Unit (NTU), a specialized unit for infants with NAS, providing a therapeutic environment and medication to treat withdrawal symptoms.
The NTU is the first of its kind in the state of West Virginia and one of the first in the US. Newborns experiencing NAS benefit most from the quiet, supportive hospital setting this unit offers. To provide the babies with the best possible care and opportunity for recovery, NTU staff and physicians involve the mother, father, and extended family in forming healthy habits that will continue beyond the hospital stay.
o FY 2019: 4,837 encounters
o FY 2020: 5,291 encounters
o FY 2021: 3,488 encounters
o FY 2022 April YTD: 1,712 encounters
2022-2025 MOUNTAIN HEALTH NETWORK COMMUNITY HEALTH NEEDS ASSESSMENT 87
- 2022
• Collaborate with Project Hope for Women and Children, an innovative program led by Healthy Connections, the HFCH MOMS Program, and Marshall Health’s Maternal Addiction Recovery Center, to support mothers and their families on the road to addiction recovery.
Project Hope provides a stable and supportive environment for women and their children so they can work toward long-term recovery, developing healthy parenting skills and building safe family relationships. As a comprehensive treatment facility, Project Hope provides onsite peer and residential support, life skills training and mental health services, as well as educational support services, career development, nutrition, exercise support, parenting and relationship courses, spiritual care, and financial education. Project Hope can house up to 18 families at a time in individual single-family units. The average length of stay at Project Hope is up to six months.
o FY 2020: 244 clients served
o FY 2021: 161 clients served
• Coordinate services with Lily’s Place, a non-profit leader in NAS, to care for drug-exposed newborns and their families.

At Lily’s Place, medical care is provided to infants suffering from NAS and non-judgmental support, education and counseling services are given to families and caregivers. While offering short-term care, the staff also connects families with recovery groups. Two follow-up clinics each month, with a pediatric neurologist and social worker, are conducted for parents and infants who’ve graduated from the program.
o FY 2020: 42 patients served
o FY 2021: 26 patients served
o FY 2022 June YTD: 16 patients served
• Coordinate services with Prestera Center for Mental Health Services, a regional provider of support and services for people with behavioral health and substance abuse needs, specializing in helping individuals who have a dual diagnosis.


Prestera Center impacts over 20,000 adults, children, and families across West Virginia each year and has been helping people lead happier, more fulfilling lives since 1967. Prestera specializes in helping individuals who have a dual diagnosis of mental health and substance use needs. As a not-for-profit organization, Prestera offers care and services to everyone who needs it regardless of their ability to pay.
o FY 2020: 56 referrals from CHH ED


o FY 2021: 69 referrals from CHH ED
o FY 2022 June YTD: 44 referrals from CHH ED

88 2022-2025 MOUNTAIN HEALTH NETWORK COMMUNITY HEALTH NEEDS ASSESSMENT
EVALUATION OF IMPACT 2019


• Support Project Engage, an evidence-based practice for individuals with opioid use disorder who seek treatment through the ED or are admitted as an inpatient or to mother/baby.

Project Engage, a proactive program integrated into the EDs and inpatient settings at CHH and SMMC, unifies policies and protocols to increase the likelihood that patients with SUD will be prepared for and choose long-term treatment upon discharge. Additionally, the Marshall University Joan C. Edwards School of Medicine and the Charleston-based non-profit Quality Insights co-developed a program designed to target SUD stigma among health care providers in a hospital setting. Health care workers at CHH and SMMC participate in e-learning on the peer-to-peer influence of positive language about \ and interaction with individuals with SUD.
o FY 2020: 118 referrals to Prestera from Project Engage

o FY 2021: 149 referrals to Prestera from Project Engage
o FY 2022 June YTD: 75 referrals to Prestera from Project Engage
• Explore opportunities to provide support groups and other recovery programs for family members of individuals with behavioral health conditions and/or substance use disorders.
o FY 2019: 10 Perinatal Bereavement Support Groups held; 40 people attended
o FY 2020: Nine Perinatal Bereavement Support Groups held; 28 people attended


o FY 2021: No groups held
o FY 2022, July YTD: Seven support groups held; 10 people attended

• Support the FaithHealth Appalachia (FHA) program which serves the faith-based community and community at large by providing health training, supporting faith-based health improvement efforts and engaging faith leaders in new cooperative efforts for earlier prevention of chronic disease and healthier outcomes.
FaithHealth Appalachia serves as a conduit of connection between social services, faith-based organizations, medical facilities and key leaders in the Huntington community to ensure the various gaps within these systems are filled. By connecting patients in the hospital system with existing community-based organizations that focus on meeting various social determinants of health, a positive impact has been made in the lives of people throughout our region. CHH supports the mission of FHA and employs its Executive Director in the CHH Pastoral Care/ Chaplaincy department.
o FY 2020: Eight community referrals to FHA
o FY 2020: Eight health care referrals to FHA
o FY 2021: 48 community referrals to FHA

o FY 2021: 17 health care referrals to FHA
o FY 2022, May YTD: 45 community referrals to FHA 19 health care referrals to FHA
2022-2025 MOUNTAIN HEALTH NETWORK COMMUNITY HEALTH NEEDS ASSESSMENT 89
- 2022
ST. MARY’S MEDICAL CENTER EVALUATION OF HEALTH IMPACT 2019-2022: BEHAVIORAL HEALTH AND SUBSTANCE USE DISORDER


St. Mary’s Medical Center Evaluation of Health Impact

Health Priority Area: Behavioral Health and Substance Use Disorder


Goal: Support substance use disorder (SUD) efforts in our community, and improved outcomes for people with a behavioral health and/or SUD and their families.
Strategies:


• Continue to provide inpatient behavioral health services and explore opportunities to expand services to meet delivery gaps


o FY 2019: 629 patients
o FY 2020: 525 patients


o FY 2021: 405 patients

o FY 2022, June YTD: 374 patients


• Offer well-being classes and services at a discounted rate, including yoga and massage therapy


o FY 2020: 27 Zumba classes held
o FY 2021: 157 Zumba class participants
o FY 2022: classes canceled due to COVID-19


• Provide a new, free Families Motivating Recovery monthly support group for family members of those struggling with SUD.
SMMC also offers Navigating Grief, a free four-week course, quarterly to help community members who are struggling with loss.
o FY 2020 58 participants

o FY 2021 support groups canceled due to COVID-19
• Provide the St. Mary’s Addiction Recovery Team (SMART), a partnership with Addiction Recovery Care, to provide care coordination for patients with SUD receiving care in the ED, as well as addiction education for providers, and trained peer support specialists and counselors to assess the needs of patients with SUD and connect them with recovery supports.
o FY 2020: 297 patients received peer support/counseling
o FY 2021, October-May: 731 patients received peer support/counseling
o SMMC ER, in conjunction with Project Engage and peer counselors, began distributing Narcan to high-risk patients in 2022.
o As part of this strategy, SMMC also supported the following organizations:


90 2022-2025 MOUNTAIN HEALTH NETWORK COMMUNITY HEALTH NEEDS ASSESSMENT
EVALUATION OF IMPACT 2019
• Shepherd’s House Salt of the World Ministries, Inc. has established Christ-based sober living homes for men and women in Huntington. The ministry opened its first house on August 11, 2009, at 1427 7th Avenue. Many of the housed individuals come with no income and no employment. The program prioritizes affordability and The Shepherd’s Program of Recovery and Transformation, a Christ-based recovery program, including “Celebrate Recovery” groups, meetings, and resources.
• West Virginia Gold Star Mothers is an affiliate of the American Gold Star Mothers who have lost a military son or daughter.
• Recovery Point provides a long-term, residential recovery program based on the social model of recovery. They offer drop-in recovery coaching services and transitional recovery residences through HER Place at Recovery Point programs. Recovery Point WV programs follow the 12-Step model of Alcoholics Anonymous to help clients find lasting recovery, as well as board-recognized Peer Recovery credential training at no cost. Recovery Point WV works to promote hope and recovery across the state.
• Support PROACT (Provider Response Organization for Addiction Care and Treatment) by providing a full-time chaplain beginning in fall 2019. PROACT’s goal is to offer individuals and their families a viable system that provides positive outcomes.
Partner institutions within PROACT include SMMC, CHH, Marshall Health and Thomas Health. The PROACT center, which opened in 2018, was created to address the clinical, behavioral, spiritual, and professional issues of those affected by substance use. It functions as the centralized hub for treatment, recovery, therapy, education, research, workforce opportunities and support for those affected by addiction.
o FY 2020: 2,008 patients served
o FY 2021: 1,857 patients served
o FY 2022, June YTD: 1,252 patients served
2022-2025 MOUNTAIN HEALTH NETWORK COMMUNITY HEALTH NEEDS ASSESSMENT 91
- 2022
2022-2025 COMMUNITY HEALTH IMPROVEMENT PLAN


MHN developed a three-year Community Health Improvement Plan (CHIP) to guide community benefit and population health improvement activities across their service area. The CHIP builds upon previous health improvement activities, while recognizing new health needs identified in the 2022 CHNA, a changing health care environment and the impact of the COVID-19 pandemic.
The plan is supported by systemwide priority areas and goals for health improvement and hospital-level strategies that leverage the strengths and assets of each facility. Individual hospital strategies versus systemwide initiatives are noted throughout the plan.


New Health Equity Approach: While the 2022 priority areas are consistent with those identified in past needs assessments, in developing the CHIP, MHN sought to focus on upstream interventions to address underlying disparities in social determinants of health and access to care, as well as the needs of priority populations, including youth and older adults. This focus is consistent with a health equity approach to look beyond the health care system to build healthier communities for all people now and in the future. New strategies to be explored by MHN, as well as continuing strategies from prior CHIPs, are highlighted throughout the plan. The CHIP aligns with both the broader MHN Health Equity Plan and MHN Strategic Plan.

92 2022-2025 MOUNTAIN HEALTH NETWORK COMMUNITY HEALTH NEEDS ASSESSMENT
Goal: Strengthen and support community initiatives that provide equitable and sustainable access to resources that address the unique behavioral health needs of all residents.
Objectives and Strategies:


Objective: Increase awareness and education to encourage treatment and management of behavioral health issues.
New Strategy:
o In collaboration with community partners, solicit feedback from people with lived experience and their families for a behavioral health services gap analysis.
Continuing Strategies:
o Support, promote and participate in community behavioral health awareness and training efforts.
o Conduct screenings in health care settings to identify individuals with behavioral health conditions.
o Provide free support groups, such as Navigating Grief and Perinatal Bereavement.
Objective: Promote wellness and resilience initiatives that protect from and offset risk factors for behavioral health issues.
New Strategies:
o Explore partnerships with arts and cultural venues to provide youth engagement and social connectivity opportunities.
PLAN
o Strengthen and support community organizations providing youth mentorship, senior programming, relationship-building, and social emotional learning opportunities.
o Develop collaborative arrangements with community organizations to encourage social engagement and self-management skills for individuals with chronic conditions, chronic pain or advancing illness.
Continuing Strategies:
o CHH-specific strategy: Provide the Hoops Family Children’s Hospital Child Advocacy Center, dedicated to offering children and families with compassionate care to reduce the trauma often experienced by children who are victims of abuse.

o SMMC-specific strategy: Support the COMPASS program and City of Huntington first responders with an Employee Assistance Program (EAP) to strengthen the ability of first responders to deal with high-stress situations and build resiliency to process any effects of that stress.
Objective: Improve access to behavioral health services.
New Strategy:
o Expand access to behavioral health services through telehealth applications.


Continuing Strategy:
o CHH-specific strategy: Coordinate service delivery with Prestera Center for Mental Health Services, specializing in helping individuals who have a dual diagnosis of behavioral health and SUD.


2022-2025 COMMUNITY HEALTH IMPROVEMENT
(CHIP)
2022-2025 MOUNTAIN HEALTH NETWORK COMMUNITY HEALTH NEEDS ASSESSMENT 93
Strengthen and support community initiatives that provide equitable and sustainable access to resources that address the substance use disorder (SUD) needs of all residents.
Objectives and Strategies:


Objective: Increase awareness of SUD to reduce stigma and fear of seeking treatment.
New Strategies:
o In collaboration with community partners, solicit feedback from people with lived experience and their families for a SUD services gap analysis.
o Explore providing SUD awareness sensitivity training to MHN employees.
Continuing Strategies:
o Support, promote and participate in community SUD awareness and training efforts.
o Conduct screenings in health care settings to identify individuals with SUD conditions.
o Provide free support groups, such as Families Motivating Recovery.
Objective: Promote wellness and resilience initiatives that protect from and offset risk factors for SUD.
New Strategies:
o Explore partnerships with arts and cultural venues to provide youth engagement and social connectivity opportunities.
o Strengthen and support community organizations providing youth mentorship, senior programming, relationship-building, and social emotional learning opportunities.
Objective: Improve access to SUD treatment and recovery services.
New Strategies:

o Explore mobile unit outreach for services such as mobile medicationassisted treatment (MAT) and Narcan distribution.
o Explore community partnerships to enhance transportation options for SUD treatment and recovery services clients.
o Support efforts to expand telehealth visits.
Continuing Strategies:

o Partner with the City of Huntington, Cabell County EMS, Marshall Health, and other agencies to provide a Quick Response Team to personally visit every patient within 72 hours following an overdose to assess their needs, develop a personalized plan for intervention, and connect them with addiction service providers.

94 2022-2025 MOUNTAIN HEALTH NETWORK COMMUNITY HEALTH NEEDS ASSESSMENT
COMMUNITY
IMPROVEMENT PLAN
o Support Project Engage, an evidence-based practice for individuals with opioid use disorder who seek treatment through the ED, providing peer recovery coaches for support, the option of medication assisted treatment while in the ED, and referrals for community-based treatment and recovery services.


o Support PROACT (Provider Response Organization for Addiction Care and Treatment), a centralized community hub for treatment, recovery, therapy, education, research, workforce opportunities and support for those affected by addiction.

o Participate in“Reverse the Cycle” project at both hospital ERs, in conjunction with Mosaic Consulting and Marshall Health Addiction Medicine division.
• Screening for substance abuse disorder in ER visits with Peer Recovery Specialist follow-up.
• Peer Recovery Specialist outreach to overdose survivors (apart from QRT).


• Prescribing or providing outpatient NARCAN/naloxone to ER patients presenting with overdose.

o CHH-specific strategies

• Provide the HFCH Maternal Opioid Medical Support (MOMS) program to provide addiction treatment services, psychological and medical treatment, education, and training to postpartum women, while their babies recover from Neonatal Abstinence Syndrome (NAS).
• Coordinate service delivery with Lily’s Place, a non-profit leader in NAS, to care for drug-exposed newborns and their families.
• Coordinate service delivery with Prestera Center for Mental Health Services, specializing in helping individuals who have a dual diagnosis of behavioral health and SUD.


• Participate in Healthy Connections, a coalition of health care and social service providers dedicated to evidence-based and inter-agency programming for the treatment of pregnant and parenting families who are struggling with SUD.

2022-2025 MOUNTAIN HEALTH NETWORK COMMUNITY HEALTH NEEDS ASSESSMENT 95 2022-2025
HEALTH
(CHIP)
2022-2025
Chronic Disease Prevention and Management
PRIORITY HEALTH NEEDS
Residents of the MHN service area generally have more health risk factors and higher prevalence and mortality due to chronic disease than their peers across the tri-state region and nation. Outside of Putnam County, approximately 30% or more of adults are physically inactive and 23% or more of adults smoke. Outside of Cabell County, 39% or more of adults have obesity, and across the service area, 10% or more of adults have diabetes.
The MHN service area has a higher rate of death due to heart disease, cancer, and diabetes than the tri-state region and the nation, and the rate of death due to heart disease and diabetes increased in recent years. The diabetes death rate increased nearly 6 points from 2019 to 2020, likely due in part to pandemic-related care interruptions. Increases in diabetes death were also seen nationwide in 2020. Nationally, Black/African Americans continue to experience disproportionate chronic disease death rates compared to other racial or ethnic groups, a disparity largely rooted in socioeconomic inequities.
Consistent with higher smoking rates, all MHN service area counties exceed the nation for Chronic Obstructive Pulmonary Disease (COPD) prevalence. Lawrence County, KY and Mingo County, WV, have the highest smoking rates in the service area and the highest prevalence of COPD. The MHN service area overall also has a higher rate of death due to chronic lower respiratory disease, which includes COPD, than the tri-state region and the nation.
Older adults are among the most likely to experience chronic conditions. Across the tri-state region, approximately 75% of Medicare beneficiaries aged 65 or older have two or more chronic conditions. Older adults in the
MHN service area are more likely to experience multiple chronic conditions than their peers across the region, and of note, approximately one-quarter to one-third manage six or more chronic conditions. Compounding health concerns for older adults is an overall older demographic within the service area and potential social isolation. Approximately 13% of older adults in the MHN service area live alone, an increasing and higher proportion than the nation overall. See additonal information on aging populations (pg. 107-111).
Focus group participants highlighted the negative impact of COVID-19 on older adult health and well-being.
“Being an older person during a pandemic is not an asset. Even if you’ve tried to be healthy all your life, you’re now labeled high-risk and warned of risk of death. The mental strain has been hard.”
“Older adults suffered a great deal of isolation, particularly in nursing homes. They had setbacks in dementia and trusted relationships.”
Access to health care, particularly primary care, impacts chronic disease outcomes. The MHN service area has a lower percentage of uninsured residents than the nation and meets the Office of Disease Prevention and Health Promotion (ODPHP) Health People 2030 goal of 92.1% insured residents. The service area also has better overall access to primary care physicians, as indicated by the rate of providers per 100,000 population. However, provider availability is concentrated in Cabell and Kanawha counties, and 15 of the 20 service counties are HPSAs for low-income individuals.
96 2022-2025 MOUNTAIN HEALTH NETWORK COMMUNITY HEALTH NEEDS ASSESSMENT
PRIORITY HEALTH NEEDS


The challenge of providing health care within the predominantly rural communities of the MHN service area is reflected in a higher rate of ED utilization among older adult Medicare beneficiaries in Kentucky, Ohio, and West Virginia relative to the nation.


Among the top needed community resources identified by Key Informant Survey participants was access to health care, with a focus on affordable and community-based options. Informants identified the need for mobile health care services, particularly in rural communities, neighborhood clinics or “street-based health care”, free or low-cost screenings and affordable insurance and medication options. The need for more providers accepting state-issued coverage like Medicaid and job opportunities that provide both a livable wage and comprehensive, employer-based coverage, was also identified.
Health Risk Factors and Chronic Disease


Residents of the tri-state region have more health risk factors and higher prevalence and mortality due to chronic disease. Adults in MHN service area counties generally have more health risk factors than their peers across the region. For example, outside of Putnam County, approximately 30% or more of adults are physically inactive and 23% or more of adults smoke.

The following report sections further explore health risk factors and chronic disease and their connection to underlying social determinants of health. Social determinants of health not only lead to poorer health outcomes and the onset of disease, but they are also likely to impede disease management and treatment efforts, further exacerbating poorer health outcomes.
 Source: Centers for Disease Control and Prevention, PLACES & BRFSS
2019 Age-Adjusted Adult Health Risk Factors Tri-State Region and MHN Service Counties with Highest Prevalence
Source: Centers for Disease Control and Prevention, PLACES & BRFSS
2019 Age-Adjusted Adult Health Risk Factors Tri-State Region and MHN Service Counties with Highest Prevalence
2022-2025 MOUNTAIN HEALTH NETWORK COMMUNITY HEALTH NEEDS ASSESSMENT 97
Obesity and Diabetes


Adults living in the Tri-State region have historically higher prevalence of obesity and diabetes compared to national benchmarks. Adult obesity prevalence increased in all three states through 2019, while diabetes prevalence was generally stable. As of 2019, more than one-third of adults in the region had obesity and approximately 1 in 10 had diabetes.
Obesity prevalence is generally higher in the MHN service area than the Tri-State region, affecting approximately 40% of adults. It is worth noting that while obesity prevalence in Cabell County remains high at 37.5%, it is among the lowest in the region and lower than West Virginia benchmark of 39.4%.


Adult diabetes prevalence in the MHN service area generally aligns with socioeconomic conditions. Putnam County in West Virginia has the lowest prevalence at 10%, which is higher than the national benchmark of 9.4%. Mingo and Logan counties in West Virginia have the highest prevalence at approximately 14%.
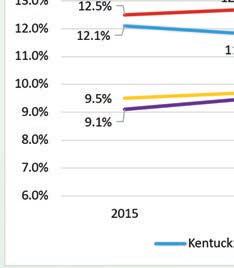

The MHN service area has a higher rate of death due to diabetes than the Tri-State region and the nation, and the rate of death increased notably in 2020, likely due in part to the pandemic. Increases in diabetes death were seen nationwide in 2020 and in all three states except Kentucky. Nationally, the diabetes death rate for Black/African Americans is more than double the death rate for Whites.
Source: Centers for Disease Control and Prevention, BRFSS


Source: Centers for Disease Control and Prevention, BRFSS


98 2022-2025 MOUNTAIN HEALTH NETWORK COMMUNITY HEALTH NEEDS ASSESSMENT
PRIORITY HEALTH NEEDS


 Obese (BMI>= 30), Prevalence Among Adults Age 18+ by County, CDC BRFSS PLACES Project 2019 Diabetes, Prevalance Among Adults Age 18+ by County, CDC BRFSS PLACES Project 2019
Age-Adjusted Adult Obesity
by County
Age-Adjusted Adult Diabetes
by
Obese (BMI>= 30), Prevalence Among Adults Age 18+ by County, CDC BRFSS PLACES Project 2019 Diabetes, Prevalance Among Adults Age 18+ by County, CDC BRFSS PLACES Project 2019
Age-Adjusted Adult Obesity
by County
Age-Adjusted Adult Diabetes
by
2022-2025 MOUNTAIN HEALTH NETWORK COMMUNITY HEALTH NEEDS ASSESSMENT 99
2019
Prevalence
2019
Prevalence
County
Source: Centers for Disease Control and Prevention
Source: Centers for Disease Control and Prevention


100 2022-2025 MOUNTAIN HEALTH NETWORK COMMUNITY HEALTH NEEDS ASSESSMENT
PRIORITY HEALTH NEEDS


Overweight and Obesity
Youth Health


Childhood obesity is a persistent and significant threat to the long-term health of today’s youth. The CDC reports that children who have obesity are more likely to have high blood pressure and high cholesterol; glucose intolerance, insulin resistance, and Type 2 diabetes; breathing problems like asthma and sleep apnea; joint and musculoskeletal problems; and psychological and social problems, such as anxiety, depression, low self-esteem, and bullying; among other concerns.


Within the Tri-State region, it is worth noting that West Virginia high school students have historically higher prevalence of obesity than the nation, and prevalence increased annually since 2013. In 2019, nearly 1 in 4 high school students in West Virginia had obesity. Across all three states and the nation, the most at-risk populations for youth obesity in 2019 were males, Black/African Americans, and students identifying as lesbian, gay, or bisexual (LGB).


 Source: Centers for Disease Control and Prevention, YRBS
Source: Centers for Disease Control and Prevention, YRBS
Source: Centers for Disease Control and Prevention, YRBS
2022-2025 MOUNTAIN HEALTH NETWORK COMMUNITY HEALTH NEEDS ASSESSMENT 101
Heart Disease


Heart disease is the leading cause of death nationally. High blood pressure and high cholesterol are two of the primary causes of heart disease and, in many cases, can be preventable. All MHN service area counties have a higher prevalence of high blood pressure than the national benchmark; all counties except Gallia in Ohio also have a higher prevalence of high cholesterol. Consistent with identified disparities in diabetes prevalence, Mingo and Logan counties in West Virginia have among the highest prevalence of high blood pressure and high cholesterol.


The MHN service area has a higher rate of death due to heart disease than the Tri-State region and nation overall, and the death rate increased gradually since 2015. Across the nation, and in Kentucky and Ohio, heart disease death rates are higher among Black/African Americans than other racial or ethnic groups. The MHN service area and West Virginia differ from other geographies with a similar rate of death among Whites and Black/African Americans. Heart disease death rates increased in 2020 across all reported geographies, although not to the same degree as diabetes death rates.


 Source: Centers for Disease Control and Prevention, PLACES & BRFSS
102 2022-2025 MOUNTAIN HEALTH NETWORK COMMUNITY HEALTH NEEDS ASSESSMENT
Source: Centers for Disease Control and Prevention


PRIORITY HEALTH NEEDS


Source: Centers for Disease Control and Prevention


2022-2025 MOUNTAIN HEALTH NETWORK COMMUNITY HEALTH NEEDS ASSESSMENT 103
Cancer


Cancer is the second leading cause of death nationally. The Tri-State region has higher incidence and death rates due to cancer than the nation overall, although both incidence and death rates generally declined through 2018 and 2019. A slight increase in death rates was seen in 2020 across the MHN service area, as well as Kentucky and West Virginia. Of note, while the MHN service area cancer death rate declined approximately 25 points over the past decade, it remains higher than state benchmarks and does not meet the Healthy People 2030 goal of 122.7 per 100,000.


Nationally, Black/African Americans have disproportionately higher rates of cancer death compared to other racial and ethnic groups. Similar trends are seen in Ohio and West Virginia, although within the MHN service area, the cancer death rate is highest among Whites.

Consistent with having higher smoking rates, the Tri-State region continues to have higher incidence and death rates due to lung cancer than the nation overall. In Kentucky, the lung cancer death rate is more than 50% higher than the national death rate.


Source: Centers for Disease Control and Prevention, United States Cancer Statistics


Source: Centers for Disease Control and Prevention

104 2022-2025 MOUNTAIN HEALTH NETWORK COMMUNITY HEALTH NEEDS ASSESSMENT
Source: Centers for Disease Control and Prevention
PRIORITY HEALTH NEEDS


Source: Centers for Disease Control and Prevention, United States Cancer Statistics


Source: Centers for Disease Control and Prevention

2022-2025 MOUNTAIN HEALTH NETWORK COMMUNITY HEALTH NEEDS ASSESSMENT 105
Respiratory Disease


Chronic lower respiratory disease (CLRD) includes several chronic conditions of the respiratory tract, including chronic obstructive pulmonary disease (COPD). Adults living in the Tri-State region have a higher prevalence of COPD than the nation overall. In West Virginia, where one-quarter of adults smoke, COPD prevalence is nearly double the national average. All MHN service area counties also have a higher prevalence of COPD than the national benchmark. Consistent with having the highest smoking rates, Lawrence County in Kentucky and Mingo County in West Virginia have the highest prevalence of COPD at nearly 13% of adults.
The Tri-State region has a higher rate of death due to CLRD than the nation, while the MHN service area has a higher rate of death than the region. The MHN service area death rate has been variable since 2016, but increased slightly in 2020, a trend that should continue to be monitored. Consistent with past CHNA findings, White service area residents have a higher rate of death than other racial or ethnic groups, reported as 74.6 per 100,000 in 2020.

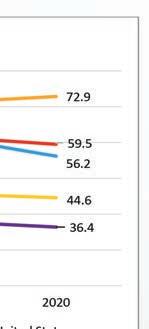

 Source: Centers for Disease Control and Prevention, PLACES & BRFSS
Source: Centers for Disease Control and Prevention
Source: Centers for Disease Control and Prevention, PLACES & BRFSS
Source: Centers for Disease Control and Prevention
106 2022-2025 MOUNTAIN HEALTH NETWORK COMMUNITY HEALTH NEEDS ASSESSMENT
PRIORITY HEALTH NEEDS


The MHN service area is an older community and aging at a faster rate than the nation overall. Older adults residing in the service area are generally less healthy than their peers nationally.


As first stated on pg. 96, across the Tri-State region, approximately three-quarters of residents who are age 65 or older and receive Medicare benefits, have two or more chronic conditions, a slightly higher proportion than the nation overall (70.3%). Within the MHN service area, all counties have a higher proportion of beneficiaries with six or more chronic conditions, and all counties except Carter in Kentucky have a higher proportion of older adult Medicare beneficiaries with two or more chronic conditions. It is worth noting that Cabell County, the home county of MHN, has the third lowest proportion of beneficiaries with two or more chronic conditions, but one-quarter of beneficiaries have six or more chronic conditions.

2022-2025 MOUNTAIN HEALTH NETWORK COMMUNITY HEALTH NEEDS ASSESSMENT 107


 Source: Centers for Medicare & Medicaid Services
108 2022-2025 MOUNTAIN HEALTH NETWORK COMMUNITY HEALTH NEEDS ASSESSMENT
PRIORITY HEALTH NEEDS


Aging Population

In addition to rising chronic disease prevalence, older adults in the MHN service area are more likely to have a disability when compared to state and national benchmarks. Approximately 44% of service area adults report a disability compared to 34.5% nationwide. Consistent with the nation, the most common disability among service area older adults is ambulatory (walking), followed by hearing. Without appropriate support services, disabilities can impede disease management and treatment efforts and further exacerbate poorer health outcomes.

Older adult health care utilization and costs increase significantly with a higher number of reported chronic diseases. Tracking these indicators helps plan allocation of resources to best anticipate and serve needs in the community. When compared to the nation, the Tri-State region overall has lower per capita spending among older adult Medicare beneficiaries. Contrary to this finding, all three states generally have a higher rate of emergency department (ED) visits among beneficiaries.


Source: US Census Bureau, American Community Survey


 Source: US Census Bureau, American Community Survey
Source: Centers for Medicare & Medicaid Services
*Standardized spending takes into account payment factors that are unrelated to the care provided (e.g. geographic variation in Medicare payment amounts).
Source: US Census Bureau, American Community Survey
Source: Centers for Medicare & Medicaid Services
*Standardized spending takes into account payment factors that are unrelated to the care provided (e.g. geographic variation in Medicare payment amounts).
2022-2025 MOUNTAIN HEALTH NETWORK COMMUNITY HEALTH NEEDS ASSESSMENT 109
Aging Population


Nationally, the most common chronic conditions among older adult Medicare beneficiaries, in order of prevalence, are hypertension (high blood pressure), high cholesterol, and arthritis. This finding is consistent across the Tri-State region. Within the region, West Virginia older adult Medicare beneficiaries have a higher prevalence of chronic conditions, with few exceptions. In addition to hypertension, high cholesterol, and arthritis, West Virginia older adult Medicare beneficiaries have a notably higher prevalence of COPD, depression, diabetes, and ischemic heart disease, or heart problems caused by narrowed heart arteries.

Within the Tri-State region, a similar proportion of older adult Medicare beneficiaries have been diagnosed with Alzheimer’s disease as the nation, but death rates vary. Ohio and West Virginia have increasing rates of death that slightly exceed the national death rate. Kentucky has a declining rate of death that is lower than the national benchmark. The MHN service area differs from the Tri-State region with an increasing death rate that is approximately 100 points higher than the national death rate.
The Alzheimer’s disease death rate increased in all reported geographies except Kentucky from 2019 to 2020, likely due in part to the COVID-19 pandemic. A study in the journal, Alzheimer’s & Dementia, found that people with dementia were twice as likely as those without dementia to become infected with COVID-19. For Alzheimer’s patients, vulnerability to COVID-19 was compounded by older age and higher prevalence of comorbidities, such as diabetes, hypertension, heart disease and obesity.


110 2022-2025 MOUNTAIN HEALTH NETWORK COMMUNITY HEALTH NEEDS ASSESSMENT
PRIORITY HEALTH NEEDS


Aging Population


In older adults, chronic illness often leads to diminished quality of life and increased social isolation. Social isolation may also impede effective chronic illness management and accelerate the negative impact of chronic diseases. One indicator of social isolation among older adults is the percentage of adults age 65 or older who live alone. Consistent with the nation, the proportion of older adults living alone increased in the Tri-State region and MHN service area. MHN service area older adults are more likely to live alone when compared to their peers across the US.

 Source: Centers for Medicare & Medicaid Services
Source: Centers for Disease Control and Prevention
Source: US Census Bureau, American Community Survey
Source: Centers for Medicare & Medicaid Services
Source: Centers for Disease Control and Prevention
Source: US Census Bureau, American Community Survey
2022-2025 MOUNTAIN HEALTH NETWORK COMMUNITY HEALTH NEEDS ASSESSMENT 111
Food Insecurity Refer to Social Determinants of Health pages 31-32.
EVALUATION OF HEALTH IMPACT 2019-2022: CHRONIC DISEASE PREVENTION AND MANAGEMENT

Health Priority Area: Chronic Disease Prevention and Management
Goal: Reduce the burden of chronic disease through prevention, detection, and treatment of risk factors, and improve quality of life for people living with chronic disease, with an emphasis on obesity/diabetes and heart disease and tobacco use/lung disease.
Cabell Huntington Hospital
Strategies:
• CHH offered free monthly support groups and educational seminars to the community. Support group availability was affected by COVID-19 restrictions and lack of participation. In-person support group meetings in FY 2020 were only offered the first six months:
o Breastfeeding Support Group
• FY 2019: 12 support groups held; 20 attendees
• FY 2020: 10 support groups held; 28 attendees
• FY 2021: 13 support groups held; 19 attendees
• FY 2022, July YTD: 9 support groups held; 18 attendees
o Sisters of Hope Support Group
• FY 2019: 11 support groups held; 278 attendees
• FY 2020: Five support groups held; 138 attendees
• FY 2021: One support group held; 12 attendees
o Weight Loss Support Group
• FY 2019: 11 support groups held; 328 attendees
• FY 2020: Eight support groups held; 239 attendees
• FY 2021: Nine support groups held; 148 attendees
o Alzheimer’s Support Group
• FY 2019: 23 support groups held; 472 attendees
• FY 2020: 14 support groups held; 201 attendees
• Due to COVID-19, this support group did not meet in FY 2021.


o Surgical Weight Control Educational Seminars


• FY 2019: 13 seminars held; 602 attendees
• FY 2020: 19 seminars held; 510 attendees
• FY 2021: 36 seminars held; 539 attendees
• In partnership with Marshall Health, provide pre- and post-acute home care for homebound patients age 18 or over throughout the Tri-State region.

CHH Home Care Medicine, in partnership with Marshall Health, provides pre- and post-acute care for home-bound patients ages 18 and older throughout the region. A physician referral is not necessary to receive services. CHH Home Care Medicine offers physical examinations, disease management, medication management, coordination of lab and X-ray services and coordination of care (hospice, home health, and hospitalization).
o FY 2020: Home Care Medicine – 610 homebound individuals received care
o FY 2021: Home Care Medicine – 357 homebound individuals received care
o FY 2022, July YTD: Home Care Medicine – 491 homebound individuals received care
112 2022-2025 MOUNTAIN HEALTH NETWORK COMMUNITY HEALTH NEEDS ASSESSMENT
EVALUATION OF IMPACT
• Provide education about healthy lifestyles and chronic disease prevention at Huntington’s Kitchen and at various community events.


Huntington’s Kitchen is a community food center, where people come to learn, cook and experience everything that well-prepared food and healthy living have to offer. The mission of Huntington’s Kitchen is simple: to help prevent and reduce diet-related disease through education about healthy food and healthy cooking. The goal is to share information with everyone, regardless of cooking experience. Classes typically feature activities related to cooking basics, recipes and ingredients, nutrition basics, using local and seasonal food, and shopping on a budget. The facility boasts a fully equipped kitchen that accommodates up to 16 cooking students.
o During the pandemic, the Kitchen offered healthy cooking classes via Facebook Live
• FY 2019 class participants 2,455 (all in-person) and 7,608 in-person community outreach encounters
• FY 2020 class participants 19,414 (863 in-person; 18,551 virtual) –community outreach events were not held due to COVID-19

• FY 2021 class participants 11,023 (744 in-person; 10,279 virtual) –community outreach events were not held due to COVID-19


• FY 2022 June YTD class participants (1,391 in-person) and 2,140 in-person community outreach encounters
o Huntington’s Kitchen offers classes tailored to all ages, with a focus on seniors via Senior Focus Friday classes and a focus on kids via the Junior Chef Academy/Junior Chef Day Camp.
o Huntington’s Kitchen partners with and is the home of Marshall University’s Department of Dietetics. In 2020, Huntington’s Kitchen was invited to join and unanimously accepted into the prestigious Teaching Kitchen Collaborative (TKC), becoming the first TKC member site in West Virginia. TKC is a dynamic, action-oriented network of thought-leading organizations with existing and/or planned teaching kitchens that are capable of shaping nextgeneration strategy and collaborative research on best practices for integrative lifestyle transformation.
o Huntington’s Kitchen partners with the West Virginia Extension office, the Cabell County Drug Rehabilitation Court, and Facing Hunger Foodbank to teach community members how to prepare healthy meals using fresh produce and canned goods typically distributed through food banks.
o Huntington’s Kitchen partners with the Edwards Comprehensive Cancer Center to offer a monthly educational class, open to the public, called Cooking with Cancer. Susan Hale, RDN, CSO, LD, CDE, registered dietitian and nutritionist, provides information regarding nutrition and education for cancer patients and their families. As a certified diabetes educator, she also holds nutritional classes for patients and their families on how to prepare healthy diabetic meals.
• Survivors’ Cooking Class at Huntington’s Kitchen
• FY 2019: Eight classes held; 72 participants
• FY 2020: One class held; nine participants
2022-2025 MOUNTAIN HEALTH NETWORK COMMUNITY HEALTH NEEDS ASSESSMENT 113
2019-2022
o Huntington’s Kitchen class participants are asked to complete a survey at the end of each in-person class.
• More than half of survey respondents reported returning to Huntington’s Kitchen for multiple classes.
• When asked what they would start doing as a result of attending, the most frequent participant answers were: cook more often at home, make better food choices, plan meals ahead, reduce sugar and salt consumption, eat less red meat, exercise more, wear sunscreen outdoors, improve dental hygiene, schedule diagnostic test or screening, and drink more water.
• Collaborate with the Marshall Health Chertow Diabetes Center for diabetes education and services.
CHH collaborates with the Chertow Diabetes Center at Marshall University to provide patient education, a diabetes support group, diabetes exercise center, and other resources for patients with diabetes. The Center, which is accredited by the American Diabetes Association, is staffed by a complete team of endocrinologists, diabetes educators and specialty personnel.
• Provide youth opportunities for physical activity and health education, through support of local parks, playgrounds, fun runs, and community organizations.
o United Way of the River Cities: Envisioning a community where everyone has the tools and opportunity to thrive by connecting our community with resources to reduce poverty and improve lives.
o YMCA of Huntington: Offering senior group fitness classes, personal trainers for light-weighted workouts, yoga, and Zumba.


o Developmental Therapy Center (DTC): Enhancing the quality of life for children and adults with disabilities in our community regardless of age, income, or geographic location. They accomplish their mission by providing access to occupational, physical, speech-language therapy, and special instruction services so that patients can maximize their daily living skills and, ultimately, reach their fullest potential.
• Support Ebenezer Medical Outreach, a full-service medical clinic providing access to free, comprehensive health care to financially eligible clients.

Ebenezer Medical Outreach, Inc. (EMO), provides access to free and affordable comprehensive health care, preventative care, and pharmaceuticals to the Fairfield West community of Huntington and the surrounding areas. EMO recognizes health care as a basic right, and it is their belief that all people are entitled to it.
o FY 2020: $58,336 financial resources/donations provided

o FY 2021: April YTD, $50,004 financial resources/donations provided
o FY 2022, Feb. YTD: April YTD, $20,835
• Launch and promote Mountain teleHealth
o FY 2020: 18,611 clinic service visits
o FY 2021: 13,214 clinic service visits
o FY 2022: 13,425 annualized clinic service visits
114 2022-2025 MOUNTAIN HEALTH NETWORK COMMUNITY HEALTH NEEDS ASSESSMENT
EVALUATION OF IMPACT
Health Priority Area: Chronic Disease Prevention and Management

Goal: Reduce the burden of chronic disease through prevention, detection, and treatment of risk factors, and improve quality of life for people living with chronic disease, with an emphasis on obesity/diabetes and heart disease, and tobacco use/lung disease.
St. Mary’s Medical Center
Strategies:
• Provide support groups for individuals with chronic disease and their families.

o Breast Cancer
• FY 2020: Five support groups held; 55 attendees
• FY 2021: Five support groups held; 31 attendees
o CAN-CERvive
• FY 2019: 11 support groups held; 106 attendees
• FY 2020: Two support groups held; 21 attendees
• FY 2021: Six support groups held; 25 attendees
• FY 2022: Eight support groups held; 15 attendees

o Weight Loss Surgery
• FY 2020: Three support groups held; 25 attendees
• FY 2021: Five support groups held; 34 attendees
• FY 2022, June YTD: Nine support groups held; 100 attendees
o Grief Support Group
• FY 2019: Four support groups held; 21 attendees
• FY 2020: Three support groups held; 261 attendees
• FY 2021: Three support groups held; 526 attendees
• FY 2022,June YTD: Two support groups held; 296 attendees
*YTD = Year to date

• Offer a heart failure clinic for patients who do not have a medical home or who cannot see their primary care doctor within seven days of discharge from the hospital.
o FY 2020: 85 heart failure clinic patients
o FY 2021: 69 heart failure clinic patients
o FY 2022, July YTD: 290 heart failure clinic patients
• Partner with the world-renowned Joslin Diabetes Center at Harvard University in Boston, and the inpatient diabetes educator, to provide education, nutrition counseling and disease management for individuals with diabetes.

o FY 2019: 1,166 patients received education
o FY 2020: 928 patients received education
o FY 2021: 849 patients received education
o FY 2022, August YTD: 817 patients received education
• Provide a smoking cessation program in partnership with St. Mary’s Pulmonary Rehabilitation and the Cabell-Huntington Health Department consisting of three half-hour, confidential counseling sessions provided by a certified tobacco treatment specialist.


o FY 2020: 1,378 patients received education
o FY 2021: 1,487 patients received education
o FY 202, June YTD: 975 patients received education
• Provide nutrition counseling and coaching by a registered dietitian at various community events.
o A dietitian attended all health fairs to provide interpretation of lab results and to make diet suggestions. Follow-up counseling was transferred to the Joslin Diabetes program.
• FY 2020: 610 attendees received nutrition counseling/coaching
• FY 2021: 100 attendees received nutrition counseling/coaching
2022-2025 MOUNTAIN HEALTH NETWORK COMMUNITY HEALTH NEEDS ASSESSMENT 115
– 2019-2022
o St. Mary’s Food Box Program
The Medically Indicated Food Box Program, an initiative of Facing Hunger Foodbank, helps patients in need of meals to support their health by providing boxes of food each month. The boxes have food such as beef, produce, and low- or no-sodium canned food, as well as emergency hunger-relief canned foods. The program is funded through a grant from The Pallottine Foundation. In partnership with the Foodbank, physicians, nurses and staff help distribute the food boxes each month to patients of The Clinic at SMMC, which provides free health care to patients who meet the Federal poverty guidelines. The Foodbank is working to secure additional funding to extend the distribution of boxes.
• Support youth programs and community organizations that encourage healthy lifestyles.
o United Way of the River Cities: Envisioning a community where everyone has the tools and opportunity to thrive by connecting our community with resources to reduce poverty and improve lives.
o YMCA of Huntington: Offering senior group fitness classes, personal trainers for light-weighted workouts, yoga, and Zumba.
o Developmental Therapy Center (DTC): Enhancing the quality of life for children and adults with disabilities in our community regardless of age, income, or geographic location. DTC accomplishes their mission by providing access to occupational, physical, speech-language therapy, and special instruction services so that their patients can maximize their daily living skills and, ultimately, reach their fullest potential.
• Provide free or discounted disease-specific community-based screenings, targeting underserved and at-risk populations.
o The Total Woman is a membership program by SMMC to help empower women to make good health care decisions and take action that will result in better health for themselves and their families. The program which ended in 2020, had more than 5,000 members who participated in health education programs throughout the year.
o Cardiovascular disease is the No. 1 killer of men and women in the Tri-State. St. Mary’s Regional Heart Institute partners with the American Heart Association, the largest voluntary health organization working to prevent, treat, and defeat heart disease, stroke, and other cardiovascular diseases, for two major events each year:
• The annual Go Red for Women Celebration on National Go Red for Women Day. The celebration combines heart disease education and free health screenings with entertainment and a heart healthy lunch. The celebration raises funds for and awareness of the work of the American Heart Association. More than 250 people attend the event each year. There was no event in 2021 or 2022.
• The annual Huntington Heart Walk raises funds and awareness for the American Heart Association. Nearly 800 people attended the 2019 event, while 2020 and 2021 were held virtually, encouraging participants to “walk wherever you are.”
116 2022-2025 MOUNTAIN HEALTH NETWORK COMMUNITY HEALTH NEEDS ASSESSMENT


2022-2025 MOUNTAIN HEALTH NETWORK COMMUNITY HEALTH NEEDS ASSESSMENT 117 EVALUATION OF IMPACT – 2019-2022
2022-2025 COMMUNITY HEALTH IMPROVEMENT PLAN: CHIP MOUNTAIN HEALTH NETWORK (MHN) IMPLEMENTATION STRATEGY

Priority Area: Chronic Disease Prevention and Management
Goal: Achieve equitable life expectancy and quality of life for all people by ensuring residents have the resources they need to maintain their health.
Objectives and Strategies:


Objective: Reduce disparities in chronic disease prevalence and death rates and promote health equity.
New Strategies:
o Align with strategic initiatives by MHN Centers of Excellence in cardiovascular and pediatrics.


o Strengthen and support community organizations addressing key social determinants of health barriers, including food insecurity, housing and utility instability, transportation needs, health literacy, access to care, difficulties in paying for care and medications and personal safety.
o Support early health education opportunities for youth in partnership with afterschool programming and school districts.
o Provide lung nodule screenings for earlier detection of lung cancer.


Continuing Strategies:
o Provide financial counselors to ensure the financial capacity of people who need medical services does not prevent them from seeking or receiving care.
o Utilize the resources of organizations such as FaithHealth Appalachia and Catholic Charities, serving as a connection between social services, faith-based organizations, medical facilities, and other key leaders to meet the social determinants of health needs of patients.
o Support, promote, and participate in community health events, including free or discounted screenings and support groups.
o CHH-specific strategies:
• Collaborate with the Marshall Health Chertow Diabetes Center to provide patient education, a diabetes support group, diabetes exercise center, and other resources for patients with diabetes.
• Provide smoking cessation programming in partnership with CHH Center for Lung Health and Cabell-Huntington Health Department.
o SMMC-specific strategies
• Expand the heart failure clinic for patients who do not have a medical home or who cannot see their primary care doctor within seven days of discharge from the hospital.
• Provide patient diabetes education, nutrition counseling and disease management.
• Provide smoking cessation programming in partnership with St. Mary’s Pulmonary Rehabilitation and Cabell-Huntington Health Department.
118 2022-2025 MOUNTAIN HEALTH NETWORK COMMUNITY HEALTH NEEDS ASSESSMENT
IMPROVEMENT PLAN
Objective: Increase access to traditional and alternative (community- and technology-based) places people can access health care.
New Strategies:
o Expand new primary care site locations across the region, and partnership opportunities with local community-based organizations to co-locate social services.
o Expand equitable access to telehealth visits and provide alternative means of connection for those without access to broadband or smartphone services.
o Explore partnerships with churches and community centers, as well as mobile delivery options, to bring health and social services to rural communities.
o Work with primary care offices to encourage and schedule individuals who delayed preventive care during the pandemic.


o Support broadband efforts to provide access to unserved populations.
o SMMC-specific strategy: Explore providing free screenings for the community at the SMMC Conference Center.

Continuing Strategies:
o Support Ebenezer Medical Outreach, a full-service medical clinic providing access to free, comprehensive health care to financially eligible clients.
o Enhance access to home-based care services through home health, transitional care, and other in-home service arrangements.
o CHH-specific strategy: Partner with Marshall Health via CHH Home Care Medicine to provide pre- and post-acute home care for homebound patients age 18 or over throughout the Tri-State region.


Priority Area: Aging Population
Goal:


Achieve equitable life expectancy and quality of life for all people aged 65+ years by ensuring residents have the resources they need to maintain their health.
Objectives and Strategies: Objective: Promote wellness and resilience initiatives that protect from and offset risk factors for seniors (65+) for behavioral health issues, substance use disorder and chronic health diseases.
New Strategies:
o Explore partnerships with senior centers and other elder service providers to provide older adult engagement and social connectivity opportunities.
o Expand remote access to senior wellness services through telehealth and digital connections.
Objective: Improve access to health care services for the senior population, including behavioral health services, SUD services, wellness visits, primary care visits and other chronic disease prevention and management services.
New Strategies:
o Explore partnership opportunities with senior centers to provide older adult behavioral health services and supports, wellness and senior vitality programs.
o Utilize the resources of organizations such as FaithHealth Appalachia and Catholic Charities, serving as a connection between social services, faithbased organizations, medical facilities, and other key leaders to meet the social determinants of health needs of seniors (65+), such as food insecurity, malnutrition, housing, and transportation needs and social isolation.
2022-2025 MOUNTAIN HEALTH NETWORK COMMUNITY HEALTH NEEDS ASSESSMENT 119 2022-2025 COMMUNITY HEALTH
(CHIP)
Objective: Reduce disparities in chronic disease prevalence and death rates.
New Strategies:
o Align with strategic initiatives by the Center for Healthy Aging.

o Explore Age-Friendly Health Systems and AARP Livable Communities criteria to address the unique care needs of older adults.
Objective: Increase access to traditional and alternative (community- and technology-based) places the 65+ population can access health care.
New Strategies:
o Expand equitable access to telehealth visits and provide alternative means of connection for those without access to broadband or smartphone services.
o Explore opportunities to leverage senior centers and other communitybased partners to augment health care and bridge gaps in social and support services for older adults.
Priority Area: Food Insecurity
Goal:


Enhance food security and encourage and increase healthy eating behaviors across all age groups in the community.
Objectives and Strategies:


Objective: Increase access to healthy foods.
New Strategies:
o Utilize the resources of organizations such as FaithHealth Appalachia and Catholic Charities, serving as a connection between social services, faith-based organizations, medical facilities, and other key leaders to meet the social determinants of health needs of patients, such as food security and appropriate nutrition.
o Expand and enhance use of medically tailored food boxes and ready-to-eat meals with Facing Hunger Foodbank and retail food stores, including providing medically tailored meals at discharge and post-dis charge for high-risk patients who are food insecure or malnourished.
o Support farmers markets and other food access initiatives that provide fresh, locally grown produce for low to moderate income, underserved populations.
o Strengthen and support community organizations addressing key social determinants of health barriers, including food insecurity and access to healthy foods.
o Explore partnerships with grocery stores and corporations to increase food supply, healthier options and reduce food deserts.
o Encourage mobile food drives.
o Engage in demonstration projects with other providers and payers to develop innovative ways to address food insecurity through incentives and supplemental programs.
120 2022-2025 MOUNTAIN HEALTH NETWORK COMMUNITY HEALTH NEEDS ASSESSMENT
COMMUNITY HEALTH IMPROVEMENT PLAN


Objective: Reduce disparities in chronic disease prevalence and death rates.


New Strategies:
o Strengthen and support opportunities for healthy lifestyles, including community gardens and community walkability.


o Partner with community organizations to address underlying drivers of health disparities through education, outreach, and chronic disease management programs.


o Explore community activities that focus on getting families together to learn how to improve quality of food and activity.


o Support wellness and nutrition education events in partnership with community partners.
o Collaborate with nutrition and dietary resources within the system and in the community to integrate nutrition education into chronic disease management programs, including use of tele-nutrition programs.
Continuing Strategies:

o Support programs such as Huntington’s Kitchen, a Teaching Kitchen Collaborative bridging nutrition science, health care, and the culinary arts to induce healthy lifestyle changes and promote food security.

2022-2025 MOUNTAIN HEALTH NETWORK COMMUNITY HEALTH NEEDS ASSESSMENT 121 2022-2025
(CHIP)
KEY INFORMANT SURVEY

Background


An online Key Informant Survey was conducted with community representatives within Mountain Health Network’s (MHN) service area to solicit information about local health needs and opportunities for improvement. Community representatives included health care and social service providers; public health experts; civic, social, and faith-based organizations; policy makers and elected officials; and others representing diverse community populations.
A total of 219 individuals responded to the survey. A list of the represented community organizations and the participants’ respective titles, as provided, is included in Appendix B. Key informant names are withheld for confidentiality.


Key informants served communities and populations across MHN’s service area. More than 90% of informants served Cabell County in West Virginia, the home county of CHH and SMMC. Other geographies served by key informants included all of West Virginia, the City of Huntington in Cabell County, Greenbrier County, West Virginia and worldwide.

More than half of informants served all populations. Among informants who served specific population groups, the most served populations were low-income/poor individuals or families (17.4%), older adults/elderly (17.4%), and young adults (14.2%).

122 2022-2025 MOUNTAIN HEALTH NETWORK COMMUNITY HEALTH NEEDS ASSESSMENT
APPENDIX A: KEY INFORMANT SURVEY


Key informants were asked a series of questions about perceived health priorities, perspectives on emerging health trends, including COVID-19, and recommendations to advance community and population health management strategies. A summary of their responses follows.


2022-2025 MOUNTAIN HEALTH NETWORK COMMUNITY HEALTH NEEDS ASSESSMENT 123
Survey Findings


Health and Quality of Life
Thinking about the people their organization serves, key informants were asked to describe the overall health and well-being of individuals and the most pressing concerns affecting them. Key informants ranked up to five pressing concerns, selecting from a wide-ranging list of issues. An option to write in any issue not included on the list was provided.
Approximately 34% of informants described overall health and well-being as “average.” Nearly 54% of informants described overall health and well-being as “below average” or “poor,” indicating widespread perceptions of opportunity for improvement.
When asked to identify the top pressing concerns affecting the people their organization serves, approximately half of key informants selected substance use disorder and/or overweight/obesity. Financial barriers to health and well-being were also among the top identified concerns, with 41.1% of informants selecting economic stability and/or ability to afford health care. Other commonly selected concerns included mental health conditions and chronic conditions like diabetes and heart disease and stroke.


124 2022-2025 MOUNTAIN HEALTH NETWORK COMMUNITY HEALTH NEEDS ASSESSMENT
APPENDIX A: KEY INFORMANT SURVEY


Social determinants of health (SDoH) are the conditions in the environments where people are born, live, learn, work, play, worship, and age that affect a wide range of health risks and outcomes. Healthy People 2030 outlines five key areas of SDoH: economic stability, education access and quality, health care access and quality, neighborhood and built environment, and social and community context.


Approximately 45.7% (n=95) of informants stated that their organization currently screens clients, patients, constituents, etc., for the needs related to SDoH. Informants were asked to rate the quality of SDoH in the community their organization serves using a scale of (1) very poor to (5) excellent. The mean score for each SDoH area is listed in the table below in rank order, followed by a graph showing the scoring frequency. Mean scores were between 2.51 and 3.09, with most respondents rating the listed areas as fair. Consistent with 2019 CHNA findings, health and health care was seen as the strongest community SDoH, with 33.8% of informants rating it as good or excellent. Economic stability was seen as the weakest SDoH, with 54.3% rating it as very poor or poor.


2022-2025 MOUNTAIN HEALTH NETWORK COMMUNITY HEALTH NEEDS ASSESSMENT 125
COVID-19 Insights and Perspectives


Nearly 91% of key informants agreed or strongly agreed that COVID-19 had a negative impact on the health and well-being of the people their organization serves. Thinking about these individuals, informants were asked to rate their level of agreement with a variety of statements about COVID-19, including access to testing, vaccination, and reliable information; susceptibility to misinformation; and likeliness to follow recommended safety protocols. Their responses are shown in the following graph.
Most key informants agreed or strongly agreed that the people their organization serves received COVID-19 testing, vaccination, and/or reliable information. Testing was seen as the most accessible resource, with 77.6% of informants agreeing or strongly agreeing that individuals received it when they needed it. These findings indicate widespread community availability of COVID-19 resources.


It is worth noting that despite wide access to COVID-19 resources, approximately 12% of informants indicated individuals did not receive vaccination and 22% were undecided (neither agreed nor disagreed). Additionally, 72.5% agreed or strongly agreed that individuals were susceptible to misinformation about COVID-19, and 20% disagreed or strongly disagreed that individuals wore recommended PPE to protect themselves and others. These findings indicate potential lack of trust in or adherence to recommended safety protocols.


Key informants were asked about the likeliness of the people their organization serves to be influenced by health care leaders, including local providers and health department representatives, to follow COVID-19 safety protocols like masking and vaccination. Approximately 70.6% agreed or strongly agreed that health care leaders influenced individuals to follow safety protocols, but health care organizations overall were less likely to be a top source of information for COVID-19.

Key informants were asked to identify the most likely sources of COVID-19 information for the people their organization serves. Key informants rank ordered up to three responses with No. 1 the most likely source for information. An option to “write in” any source not included on the list was provided.
126 2022-2025 MOUNTAIN HEALTH NETWORK COMMUNITY HEALTH NEEDS ASSESSMENT
APPENDIX A: KEY INFORMANT SURVEY


Social media was perceived as the top source of COVID-19 information, with 29.1% of informants selecting it as the No. 1 source and 55.1% selecting it as a top three source. Friends and family were also a top source of information. Local or state health departments and the CDC were seen as the No. 1 source for information by about 1 in 10 informants.


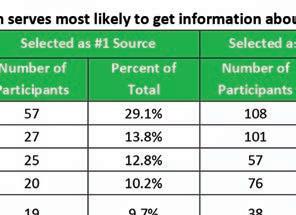


Key informants were less likely to identify political leadership or community influencer as the top source for COVID-19 information. Approximately 57.6% of key informants agreed or strongly agreed that elected officials and political leadership influenced individuals to follow COVID-19 safety protocols. Approximately 1 in 10 informants identified political leadership as a top 3 source of information.


2022-2025 MOUNTAIN HEALTH NETWORK COMMUNITY HEALTH NEEDS ASSESSMENT 127
Key Informants were asked to share recommendations for how the community can build or enhance confidence in reliable sources of public health information (e.g., CDC, health departments, health care providers, etc.) in light of COVID-19.
Comments largely identified the need for clear language that is consistently presented across community providers, available where individuals frequent, and targeted to the intended audience. Select verbatim comments by informants are included below.
• “A person’s private physician should be the best source for applying reliable information to each individual person’s health status and condition. Encourage everyone to talk to her/his primary care provider.”
• “All public health organizations, hospitals and health care providers should be sending out accurate and consistent messages and trying to dispel myths about COVID.”
• “Be more present in the rural areas and smaller communities.”
• “Engage in more small, town hall/local assembly contexts. In-person in forming and face-to-face dissemination of facts are most effective.”
• “Greater sensitivity to the cultural environments in which the people are receiving the messaging live. How they think, communicate, what they believe. Who they trust and don’t trust.”
• “Have local physicians and even local patients share their stories and information.”
• “Having a greater social media presence presenting the facts about
COVID-19. So many people get on social media spreading rumors and myths about the virus that a reliable source needs to step in and provide the facts.
• “Having individuals from the specific community be liaisons and help others hear information that is reliable and accurate.”
• “Identify community leaders, including faith leaders, civic group leaders, doctors whom people trust.”
• “Many of the churches I have visited believe God/faith will protect them. We need pastors to talk about the love of doing our part to protect our neighbors – even if they don’t believe the masks are going to stop the spread, it at least sends a love message.”
• “Meet people where they are, go to their churches, events, make it as easy as possible to get tested/vaccinated (24 hours/7 days a week) and feel safe.”
• “Our clients are stigmatized by health care providers in our community, meaning they won’t trust them when conveying public health information.”
• “Speak with unified voice - denoted, this message supported by.......”
• “Transparency in # of patients, beds, and number of staff available to serve them (vs # of staff needed) in plain language will help community members know when the hospital is strained, which is a good indicator that COVID infection is high and more precautions are needed. Plain language of how many local residents are vaccinated, or received boosters, will help folks understand how to reach a goal. For instance:” 15,389 residents of Huntington WV are vaccinated, and our goal is to reach 49,987 by XXXX
128 2022-2025 MOUNTAIN HEALTH NETWORK COMMUNITY HEALTH NEEDS ASSESSMENT
KEY INFORMANT SURVEY


date. Are you ready to help us stop the spread?” Stopping the spread was a useful slogan early on. It was everywhere. Bring it back. And finally, nurses, doctors and all health care personnel have an opinion about COVID vax, and that info is not necessarily factual. Present all staff with the science, ask them to share that info with others. Please use those teaching moments to discredit their doubts (if appropriate) and give them statistics to use. If they walk out saying to others “there’s only a 1000th of a chance of a reaction to this vax... or... the chance of a negative reaction is X as likely as taking an MMR vax” it is a better message than medical staff saying random stuff they heard on interwebs.”
Community Resources to Impact Health

Key informants were asked to identify missing resources in the community that would help residents optimize their health. Informants’ ranked up to three freeform responses with No. 1 as the top missing resource. A summary of their responses is included below.
Among the top needed resources identified by key informants was access to health care, with a focus on affordable and community-based options. Informants identified the need for mobile health care services, particularly in rural communities; neighborhood clinics, or street-based health care; free or lowcost screenings and affordable insurance and medication options. Related to health insurance concerns was the need for more providers accepting state-issued coverage like Medicaid and job opportunities that provide both a livable wage and comprehensive, employer-based coverage.
Resources to address food insecurity were also among the top needs identified by key informants. Informants identified the need for access to healthy, affordable foods, and to address food insecurities brought on by economic instability and food deserts. One informant recommended, “A food bank to help with food insecurities that also educates the client on healthy eating and nutrition needs.”
The need for resources to promote economic stability and meet the basic needs of residents was a common theme among key informants. One of the primary needs was well-paying employment opportunities. Others included quality and affordable housing and transportation. To better address the social needs of residents, one informant recommended, “Community-based social service agencies with available social workers.”
Consistent with the top concern identified for the region, key informants identified the need for substance use disorder and mental health resources. Needed resources spanned prevention and education efforts among youth to treatment services for affected individuals to supports for family members.
Lastly, several informants spoke to the need for a community-wide focus on health with political and health care leadership support. One informant recommended, “A representative for the city that focuses on the major health issues in the community. They could provide weekly communication on social media platforms to get their message out. Mountain Health could work in tandem with this representative to highlight the service lines we offer that would address those particular topics.” Another informant recommended, “Opportunities to integrate physical and mental wellness activities into social, civic, and religious life.”
2022-2025 MOUNTAIN HEALTH NETWORK COMMUNITY HEALTH NEEDS ASSESSMENT 129 APPENDIX A:
Community Health Improvement Insights
Key informants were asked how community organizations, including Mountain Health Network, can better serve priority populations (Black, indigenous, people of color, older adults, low-income, LGBTQIA+, and others) to achieve health and social equity. Informants were invited to provide freeform comments about the topics. Select verbatim comments are included below.
• “Again, meet people where they are. Identify those places where the people group identified is most likely to gather. Take information there.”
• “Be receptive to the organizations and churches that service those areas.”
• “Build partnerships with non-medical folks in the community, such as religious leaders, civic partners that can be neighborhood liaisons.”
• “By getting involved in the communities, not just providing services there but getting involved with youth leagues, churches, etc. We must build trust within these communities.”
• “Continue to center these groups in their care, work with community groups that are focusing their care in these areas, more focus/awareness on things like social media and events for these groups.”
• “Educational opportunities starting at elementary age to encourage STEM [Science, Technology, Engineering and Mathematics] within the public schools. Provide transportation and child care services to encourage participation.”
• “Engage more in ‘doing with’ rather than ‘doing to’ when determining interventions and plans.”
• “Offer programming specific to these populations. Power up / increase the influence of the Diversity Committee. Integrate their ideas into programming, marketing and direct care as much as possible. If there are certain populations using certain services within MHN, creatively engage the staff of those departments in envisioning their work to be of best impact based on the socio-cultural realities in those populations.”
• “Form a diverse group of community leaders and others to discuss and develop a plan.”
• “Go to those who are serving the most marginalized, like Ebenezer Medical Outreach and Harmony House, and provide the funds and opportunity for ongoing assessment and implementation.”
• “Large health care providers have lost trust with priority populations. One of the primary drivers of this mistrust among the uninsured and underinsured is the lack of accountability and transparency in billing procedures and the cost of health care. When a family lives pay check to pay check, they are likely to overlook health concerns of growing severity because the possibility of incurring a bill that would result in eviction or ruination of credit is only one (often unneeded) test away.”
• “More education for employees on these types of populations; conferences and mandatory in-services to promote understanding.”
• “Stigma-reduction, cultural competency training for staff; LGBTQ+ specific cultural competency, outreach in the community.”
130 2022-2025 MOUNTAIN HEALTH NETWORK COMMUNITY HEALTH NEEDS ASSESSMENT
APPENDIX A: KEY INFORMANT SURVEY
• “The greatest barrier to health inequities is the lack of universal medical insurance. Until all people are equitably insured, there will be inequality in health care.
Lastly, informants were asked for recommendations on how Mountain Health Network can better collaborate with their organization and others to improve the health and well-being of residents. Recommendations were provided as freeform comments. Verbatim comments are included below by overarching theme.
Access to Health Care
• “Always consider the mental health component of all primary care visits and medical illnesses. Without sound mind, patients will never maintain sound body.”
• “Make a list of every organization with what they offer to the community (clothing, food, financial planning) and have it available in doctors’ offices, hospitals and faith communities. Push for state regulations for all substance abuse recovery housing. Mental health professionals more available for homeless individuals.”
• “MHN should continue to partner and expand its collaboration efforts with health professional education organizations in the region and state to ensure development of a competent health care workforce in the future.”
• “Might be helpful to raise the monetary value placed on mental health workers so that we may increase the quantity/quality of providers to meet the needs of West Virginians.”
Community Outreach
• “Help educate workers, students, families on wellness programs available, even for uninsured/underinsured populations. These partnerships could be created with local employers, schools, and religious institutions.
2) Wellness checks for the elderly through partnership with senior citizen organizations in the immediate counties.”
• “Continue strong partnerships with education/youth-oriented organizations. Building youth capacity and resiliency is an important proactive approach.”
• “Continue to invest in and support the missions of organizations with boots on the ground in their communities seeking to improve health and well-being.”
• “Gather more community leaders for the sake of building relational equity among all entities working together.”
2022-2025 MOUNTAIN HEALTH NETWORK COMMUNITY HEALTH NEEDS ASSESSMENT 131
• “Team up with Marshall University and have residents, interns and students in the health field get out into the community more. Utilize the Huntington’s Kitchen space to entice the community to attend and learn more about their health issues/opportunities for improving their own health overall.”
Social Determinants of Health
• “Allow more women health care workers to participate in health care by providing day care services for young children. Such services are difficult to obtain and many women health care workers are not working because child care is needed.”
• “Healthy food bank for patients with diabetes, hypertension and heart failure; on-site dietitian for patient education at time of appointment; telehealth dietitian appointments.”


• “Support community gardens and find ways to share natural, healthy foods - not the packaged foods loaded with sugars that we see even in the hospital setting; Support community exercise on neighborhood corners every morning and encourage people to come together for age-appropriate exercise, and smelling the roses together; communities coming to labor together to care for each other. Our seniors are incredibly isolated. Support a program to connect seniors with younger families for touching base and finding meaning and purpose for both sides.”
• “The single greatest thing you could do is to ensure persons living in deep poverty are well-treated when they visit the hospital system.”
Other


• “Better communication across all levels of care; hospital, assisted living facilities, skilled nursing facilities and home health.”


• “Bring community and post-acute services to the planning and problem solving sessions regularly.”

• “Improved messaging throughout MHN (all employees/departments) about what MHN is doing in the community and how they can help.”


• “We would be open to people from the Mountain Health Network doing a site review of our facility to better understand how we can better work together.”

132 2022-2025 MOUNTAIN HEALTH NETWORK COMMUNITY HEALTH NEEDS ASSESSMENT


2022-2025 MOUNTAIN HEALTH NETWORK COMMUNITY HEALTH NEEDS ASSESSMENT 133 APPENDIX A: KEY INFORMANT SURVEY
Key Informant Survey Participants
• A. D. Lewis Community Center, Director
• American Heart Association, Executive Director
• Autism Service Center, DSS
• Big Brothers Big Sisters of the Tri-State, Executive Director
• Buckskin Council, BSA, District Executive
• Cabell County Public Library, Assistant Director for Youth Services
• Cabell Home Health, Director of Home Health
• Cabell Huntington Hospital, Departmental Manager
• Cabell Huntington Hospital, Manager
• Cabell Huntington Hospital, Pharmacy Manager
• Cabell Huntington Hospital, Physician
• Cabell Huntington Hospital, Physician assistant
• Cabell Huntington Hospital, Program Manager


• Cabell Huntington Hospital Home Care Medicine, Operations Coordinator

• Cabell-Huntington Coalition for the Homeless, Amanda Coleman/Executive Director
• Cabell-Huntington Coalition for the Homeless, Assistant Director
• Carver, Director Clinical Education
• Center for Healthy Aging, Provider/Director
• Central United Methodist Church, Pastor
• Christ Episcopal Church, Vicar
• City of Huntington, Planning Director
• City of Huntington Fire Department, Fire Chief
• Cox Landing & Sunrise United Methodist Churches, Pastor
• Education Alliance, President/CEO
• Edwards Comprehensive Cancer Center, Medical Director of Breast Surgery
• Facing Hunger Foodbank, Inc., Chief Executive Officer
• FaithHealth Appalachia, Board of Directors
• FaithHealth Appalachia, Executive Director
• Grace Christian Fellowship, Senior Pastor
• Hospice of Huntington, Inc., President and CEO
• Huntington 1st Church of the Nazarene, Lead Pastor
• Huntington City Council / So Social LLC / Forest Adventure Co-Op, Councilwoman 3rd District / Founder, Owner / Founder, Director, Co-OP Chair
• Huntington City Mission, Executive Director
• Huntington Internal Medicine Group, Physician


• Huntington Internal Medicine Group Employee


• Interventional Radiology, Physician Assistant
• Ironton In Bloom, Treasurer
• Kanawha-Charleston Health Department, Regional epidemiologist for central WV
• Kindred Communications, Vice President-Associate General Manager

• Lawrence County Chamber of Commerce, Director
• Lawrence Economic Development Corporation, Board Member
• Lawrence Economic Development Corporation, Executive Director
• Marshall Health and Marshall University School of Medicine, Professor
• Marshall Health, Family Physician
• Marshall Health, Gastroenterologist
• Marshall Health, NP
• Marshall Health, Physician
• Marshall Health, Physician
• Marshall Health, Physician
134 2022-2025 MOUNTAIN HEALTH NETWORK COMMUNITY HEALTH NEEDS ASSESSMENT
APPENDIX A: KEY INFORMANT SURVEY
• Marshall Health, Physician
• Marshall Health, Physician
• Marshall Health Division of Addiction Science in Family and Community Medicine- PROACT/Project Hope, Associate Director of Operations
• Marshall University, Assistant Professor
• Marshall University Behavioral Health Clinic, Therapist
• Marshall University OB/GYN, Resident
• Marshall University Pediatrics, Associate Professor, Pediatrics
• Marshall University Joan C. Edwards School of Medicine Family Medicine, MD
• Marshall University School of Pharmacy, Dean
• Marshall University School of Pharmacy, Professor/Dept. Chair
• Martin County Health Department, Director
• Mildred Mitchell Bateman Hospital, CEO
• Mountain Health Network, Patient/Consumer
• Mountain Health Network, Senior Executive
• Mountain Health Network, Senior Executive

• Mountain Health Network, Manager
• Pathways, Inc., Chief Business Development Officer
• PROACT, Nurse Practitioner
• Quality Insights, Chief Executive Officer
• Radiology Inc., Shareholder


• Rome Presbyterian Church, Pastor
• Southern WV Health Systems, Physician

• St. Mary’s Medical Center, Assistant Director
• St. Mary’s Medical Center, Chaplain
• St. Mary’s Medical Center, Chaplain Student
• St. Mary’s Medical Center, Family Nurse Practitioner
• St. Mary’s Medical Center, Heart Failure Nurse Practitioner
• St. Mary’s Medical Center, House Nursing Supervisor
• St. Mary’s Medical Center, Manager
• St. Mary’s Medical Center, Medical Director
• St. Mary’s Medical Center, NP
• St. Mary’s Medical Center, NP
• St. Mary’s Medical Center, Spiritual Care
• St. Mary’s Medical Center, Physician
• St. Mary’s Medical Center, RN
• St. Mary’s Medical Center, RN
• St. Mary’s Medical Center, RN
• St. Mary’s Medical Center, Spiritual Care
• St. Mary’s Medical Center, no title identified
• TEAM for West Virginia Children, Executive Director
• Tenth Avenue Church of God, Lead Pastor
• The Cause, Inc., Coordinator/Founder
• The Center - Youth Opportunity Hub, Case Manager
• The Highlawn Community Alliance, Executive Director
• Transformation Community Church, Lead Pastor
• Tri-State STEM+M Early College High School, Interim Director
• United Way of the River Cities, Director of Resource Development
• Vertical Healthcare, Founder

• West Virginia Department of Health and Human Resources/Bureau of Behavioral Health, Deputy Commissioner
• West Virginia Rural Health Association, Executive Director
• Women Infants and Children (WIC), Nutritionist/Lactation Consultant
• WV FREE, Director
• YMCA of Huntington, CEO
2022-2025 MOUNTAIN HEALTH NETWORK COMMUNITY HEALTH NEEDS ASSESSMENT 135
COMMUNITY SURVEY
Background
As part of the 2022 CHNA, Mountain Health Network (MHN) contracted with NRC Health to conduct an online survey of patients and community residents to better understand the community’s needs around health care access, as well as how it affects respondents personally.
The survey was distributed between January 10-31, 2022. The survey was available to MHN patients who opted-in to the system’s Community Insights survey panel, as well as community residents through an open link distributed by MHN. A total of 506 individuals responded to the survey.
The largest proportion of survey respondents were female (73%), White (97%), married (63%), and age 55 or older (67%). Approximately 54% of respondents had attained a bachelor’s degree or higher. Respondents resided across the MHN service area, with the largest proportion living in and around Huntington in Cabell County, West Virginia.
Survey Findings
Key Takeaways
Obesity, substance misuse and mental health were among the most selected issues (obesity: 65%, substance abuse: 60%, mental health: 51%) by respondents as the biggest health needs within their community, and when asked what informational services or support groups could be of use in their community, those related to mental health (54%), exercise or physical activity (52%), substance use disorder (49%), and nutrition (48%) were most often identified.
When sick, respondents most sought care at a doctor’s office or the emergency room. When presented with nine different medical conditions varying in severity, respondents were more likely to seek care for minor conditions, such as back pain (73%) or frequent or painful urination (71%), at a doctor’s office or clinic. For other typically more serious or immediate conditions, such as chest pain (88%), broken bone (82%), and burns (65%), respondents were more likely to seek care at a hospital’s emergency room. See on pg. 136.
Nearly three-quarters (73%) of respondents reported they always have access to healthy foods around where they live. However, for those who did not have access to healthy foods, key aspects of their life were usually worse. Respondents stated that lack of healthy food options resulted in somewhat or significantly worsened diet (53%), physical health (51%), and/or stress levels (48%). See graphs on pg. 138.
A full summary of Community Survey results follows, grouped by overarching survey theme.
136 2022-2025 MOUNTAIN HEALTH NETWORK COMMUNITY HEALTH NEEDS ASSESSMENT
COMMUNITY SURVEY
Community Health Survey


Overall, respondents believe that obesity (65%) and COVID-19 (65%) are the biggest health issues in their community.
Respondents most often believe that more wellness services (47%) and healthier food (44%) are required to improve the health of their family and neighbors.
A lack of insurance (62%) and being unable to pay co-pays (47%) are the two barriers that respondents believe most often keep people from seeking medical treatment in their community.

When asked about more specific informational resources and support groups needed in their communities, respondents most often selected ones related to mental health (54%) and exercise or physical activity (52%).


2022-2025 MOUNTAIN HEALTH NETWORK COMMUNITY HEALTH NEEDS ASSESSMENT 137 APPENDIX B:
For most of the conditions listed, respondents will most often go to a doctor’s office or clinic. Respondents would go to a hospital’s emergency department for chest pain (88%), a broken bone (82%), and burns (65%).


Survey respondents were invited to provide freeform comments about other community health needs. Select verbatim comments are included below by overarching theme.


Improved Access to Care

• “A walk-in clinic, since we live in a rural area.”
• “Commonly, really sick patients can’t remain at local hospitals because we don’t have the means, the specialists or the equipment to provide the care they need. Patients deserve well trained and experienced health care professionals / community resources / outreach initiatives.”
• “Faster times to get in to see a doctor.”


• “Health fairs to offer free screening services to the public.”
By far, respondents most often get their health information from a doctor or health professional (84%) or from the internet (46%).


• “I feel pop-up clinics in neighborhood schools would be very beneficial to our community.”
• “More caring from health care professionals. Better access to dental care for people who don’t have the means to pay these outrageous fees the dentist charge.”
• “Uncomplicated access to any of these services. Reduced barriers to support.”


138 2022-2025 MOUNTAIN HEALTH NETWORK COMMUNITY HEALTH NEEDS ASSESSMENT
APPENDIX
COMMUNITY SURVEY
Improved Care Services
• “Five-star cancer treatment. So, I don’t have to travel 3 hours to live.”


• “For doctors to truly listen to what a patient has to say and spend more than five minutes on the appointment.”
• “Higher quality hospital care.”


• “Less robotic answering machines at the office and a human that can answer basic questions and direct your call. Most of the time those things don’t work and end up causing hang-ups and frustration.”
Personal Health
Just 35% of respondents rated their overall health as excellent or above average.

Nearly all (93%) of respondents have had a routine physical exam within the last two years.
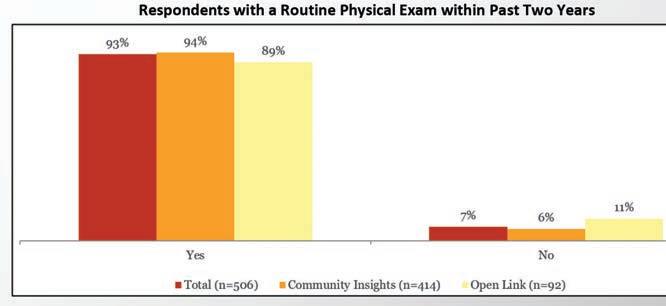
2022-2025 MOUNTAIN HEALTH NETWORK COMMUNITY HEALTH NEEDS ASSESSMENT 139
B:
Personal Health Food Security


• “Access to affordable fresh food, transportation, benefits/insurance education, local specialty physicians.”


• “In Appalachia, people are too far from good food and access to good health care.”


Nearly three-quarters (73%) of respondents believe they have access to healthy foods around where they live.
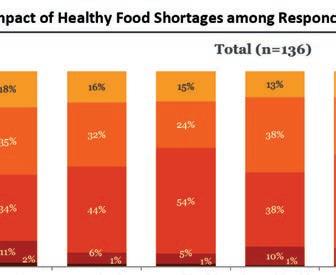


Respondents without access most often believe the lack of healthy food options has resulted in their diet and eating habits (53%), physical health (51%) and stress levels (48%) to be somewhat or significantly worsened.


140 2022-2025 MOUNTAIN HEALTH NETWORK COMMUNITY HEALTH NEEDS ASSESSMENT


2022-2025 MOUNTAIN HEALTH NETWORK COMMUNITY HEALTH NEEDS ASSESSMENT 141 APPENDIX B: COMMUNITY SURVEY
FOCUS GROUPS
Background
As part of the 2022 Community Health Needs Assessment (CHNA), focus groups were conducted with residents and health and social service partners representing communities across Mountain Health Network’s (MHN’s) service area. The objectives of the focus groups were to explore individual experiences and perceptions of social determinants of health; assess COVID-19 impact on the needs of the community and recovery efforts and identify opportunities to advance collaborative initiatives with partners and foster new relationships to address health and social needs.
Focus Group Locations and Attendees
Highlawn Alliance, April 19: Community leaders
Huntington’s Kitchen, April 27: Residents and health and social service partners
St. Mary’s Conference Center, April 28: Health care providers
St. Mary’s Conference Center, April 28: Civic and social service agencies
Huntington’s Kitchen, April 28: Residents and health and social service partners
The following is a summary of key discussion takeaways grouped by overarching community concern and insights MHN will share with community partners. The community’s feedback reflects community insights, not MHN-specific insights. These are actions that the community partners and residents can consider taking to improve health and well-being.
Key Discussion Takeaways
COVID-19 Pandemic
The pandemic had a negative impact on mental health and isolation, particularly for older adults and youth. This concern has been exacerbated by a lack of support services.
Community Comments
“Being an older person during a pandemic is not an asset. Even if you’ve tried to be healthy all your life, you’re now labeled high-risk and warned of risk of death. The mental strain has been hard.”
“Mental health for kids was not good before and it’s worse now.”
“Older adults suffered a great deal of isolation, particularly in nursing homes. They had setbacks in dementia and trusted relationships.”
“There’s a lot more stress, people stretched beyond their capacity. Parents are stressed in their lives, stressed in their jobs. They were having to work, care for their kids, have their kids home.”
“We’ve seen such an incredible increase in use for EAP (Employee Assistance Program) for mental health for employees and the community.”
142 2022-2025 MOUNTAIN HEALTH NETWORK COMMUNITY HEALTH NEEDS ASSESSMENT
APPENDIX C: FOCUS GROUPS
Community Insights
• Advocate for expansion of mental health services covered by health insurance plans.
• Awareness of mental health concerns and available resources could be raised through existing programs such as the Compass project and Veteran’s resiliency workshops.
• Senior centers are trusted community resources that, with additional support, may serve as partners in providing pandemic recovery services and ongoing health and social support.
• Support arts and other creative opportunities as a form of mental health therapy and alternative to substance use.
• The pandemic highlighted new ways of engaging and communicating across the community (e.g., virtual programming, telehealth, hybrid work settings). These methods can also be used to promote work-life balance and prioritization of self-care.
The pandemic interrupted child learning and development, including social emotional learning.
Community Comments
“Child development losses were huge, as was growth in abuse. Sometimes the only caring adult for a child was in the classroom. Not surprised law enforcement calls went down.”
“Screen time among youth worsened during the pandemic. It’s nothing for them to have 11-14 hours per day. They’re still going to school, but with less sleep.”
“We barely had enough professionals to meet the needs of children with special needs before the pandemic, and now the need is compounded. There are more children coming into the system with special needs.”
Community Insights
• Additional training of school professionals could help professionals identify and respond to mental and/or developmental concerns.
• Social emotional learning losses were compounded by social determinants of health barriers experienced by families (e.g., poverty) and increased substance use during the pandemic. Post-pandemic, there is a need for greater awareness of community resources to address these issues and community navigators to bridge connections.
• Incorporate social emotional learning and relationship-building into activities that already engage youth.
2022-2025 MOUNTAIN HEALTH NETWORK COMMUNITY HEALTH NEEDS ASSESSMENT 143
Residents delayed preventive care during the pandemic, contributing to higher demand for services now and higher acuity conditions.
Community Comments
“When cases started falling, it was a rush to get everything… weeks of medical, dental appointments. I practically took a week off work just to get caught up.”
“Telehealth was the bright side of the pandemic. It made it more mainstream and prevalent. It’s so much easier to handle an appointment via telehealth.”
Community Insights
• Telehealth can increase medical capacity and address access barriers like transportation.
• Primary care offices could identify individuals who were not seen for care during the last one to two years and schedule them for appointments.
Mixed messaging and misinformation about COVID eroded public trust in health care and public health entities.
Community Comments
“COVID was a messaging failure, communication broke down between professionals and lay individuals.”
“People were stigmatized for masking, their vaccination status, if they socialized in groups.”
“Public health has been so stigmatized. Moving forward will require the divorce of public health and politics.”
“We need a balance of talking with at-risk populations while still fostering autonomy.”
“The Governor was plain spoken and relatable versus national guidelines that were constantly changing or contradictory.”
Community Insights
• Pandemic communication to older adults was perceived as lacking dignity.
• West Virginia residents overall were seen as more likely to adhere to COVID safety recommendations due to statewide leadership (e.g., daily Governor updates) and local efforts by the Joint Information Collaborative. This feedback can inform ongoing pandemic communication and other public health messaging post-pandemic.
144 2022-2025 MOUNTAIN HEALTH NETWORK COMMUNITY HEALTH NEEDS ASSESSMENT
APPENDIX C: FOCUS GROUPS
The pandemic exacerbated economic disparities and social service agencies are struggling to meet increased demand.
Community Comments
“At the onset, there were options (stimulus, school lunch pickup). We saw fewer people coming to the food pantry because they had income. When that went away, it was a sea of people coming in.”
“Even with stimulus, there was still need. It did not address poverty, particularly given inflation and rising costs and loss of child tax credits.”
“Prior to the pandemic, we (Huntington City Mission) served 116,000 meals. In 2021, we served 185,000 meals. We’re on track to serve 220,000 meals in 2022.”
“The number of homeless in the community has doubled in the last year.”
“The top needs we’re seeing are rental, mortgage, and utility assistance. The problem now is responding; programs are running out of money.”
“We have people who ride their lawn mower to the food pantry because they don’t have transportation.”
Community Insights
• Community members and organizations could partner to bring services directly to residents and address issues of embarrassment in needing or seeking services.
• Education on insurance-covered services (e.g., caregiver housing for hospitalized Medicare patients, transportation) is needed.
• Volunteering fell sharply in the pandemic, creating financial burden for the organizations that have long depended on them.
Advancing Health Improvement
Community navigators were identified as a needed resource to create a “connected community” and facilitate access across health and social services.
Community Comments
“Do the power companies have someone to talk to if you can’t pay your bill this month? A lot of this is having people who can tell you where to find resources.”
“There are underutilized services because people don’t know about them.”
“There is the challenge of people being receptive to opening the door for us, particularly in rural communities. They are more skeptical of health care providers or any ‘outsider.’”
2022-2025 MOUNTAIN HEALTH NETWORK COMMUNITY HEALTH NEEDS ASSESSMENT 145
Community Insights
Churches and libraries are trusted community members that could serve as community health navigators and sites for conducting outreach.
Huntington is seen as a resource-rich area, well served by health and social service agencies. The rural nature of surrounding areas challenges service provision outside of Huntington, particularly for older adults, individuals with low-income and households without internet or digital devices.
Community Comments
“If you’re in Huntington, there are a lot of services. If you live elsewhere, there’s not a lot available; there’s lots of disparities.”
“Individuals from rural communities are often brought to Cabell Huntington Hospital in an emergent situation and they don’t have the time or resources to prepare or get what they need once they’re here.”
“People are sleeping in their car for four nights before security finally catches on and passes on our (Ronald McDonald House) information.”
“They (older adults) call for a service and the answering machine tells them to go to a website. They don’t have a computer or internet.”
Community Insights

• Churches and community centers are prevalent in rural communities and have the potential to serve as partners for extending services into these areas.
• Explore transportation options for medical appointments and prescription pickup.
• Explore mobile health and social service delivery options in rural communities.
• Explore opportunities to place social services at existing or planned primary care and outpatient health centers in rural communities.
New forums are needed to reestablish and build on collaboration and referrals across health and social service agencies.
Community Comments


“People are chomping at the bit for how they can get involved, get engaged with the community.”

“The networking has really changed. I used to know everyone in the health and social service world, now there are new faces. We must reconnect and reestablish relationships. Who do I call when this person needs this?”

146 2022-2025 MOUNTAIN HEALTH NETWORK COMMUNITY HEALTH NEEDS ASSESSMENT
APPENDIX C: FOCUS GROUPS
“During the pandemic, we learned to work better together in partnership to meet community needs – we need to continue to work better together with FaithHealth Appalachia, Faith in Action, Cabell County Senior Services Organization, Catholic Charities, Mountain Health Network, Cabell-Huntington Health Department, etc.”
“We rely heavily on partner organizations, and during the pandemic, we lost track of who those are.”

Community Insights
• A formal coalition of providers does not exist within Huntington and may be helpful to facilitate networking and data and resource sharing.

• Celebrate community success. “We are seen nationally as a city of solutions.”
• Invite diverse community voices (e.g., Black community, businesses, education, senior centers, transportation) as part of ongoing conversations and forums.
• Leverage current excitement and momentum among partners to work together and engage with community.
• Provide opportunities for the individuals being served by agencies to provide feedback and be part of solutions.


Health improvement initiatives should focus on prevention efforts, social determinants of health, and underlying issues of trauma.
Community Comments
“As employers, we have to balance increasing wages with how it will impact access to health care. We want to lift people, but how can we? What are the barriers that we have put in place? Why aren’t we interested in affordable health care?”
“We have people turning down raises because they will lose their benefits. The replacement pay isn’t enough to still feed their kids.”
“When a kid experiences trauma, we have compassion. But when that trauma translates into poor decisions as an adult, we lose that compassion.”
Community Insights
• Build on initiatives like those initiated by the Highlawn Community Alliance, Inc., to further improve the neighborhood’s walkability and to establish community gardens.
• Engage volunteers in social determinants of health work to build awareness and empathy for economic struggles; create experiences of “walking in my shoes.”
• Community agencies like Big Brothers, Big Sisters and Young Life connect youth with trusted mentors and increase capacity for available mentors.
2022-2025 MOUNTAIN HEALTH NETWORK COMMUNITY HEALTH NEEDS ASSESSMENT 147
The sustained delivery of health and social services will require addressing workforce shortages.
Community Comments


“A good economy equates to good health. We can only grow as much as the capacity allows, and the capacity is limited.”


“Educational outcomes of our youth are a barrier to businesses coming here, but it’s not curriculum that we need. It’s addressing the social needs and trauma of children.”
“Health care workers were not treated well during the pandemic so fewer young people want to enter these fields.”
Community Insights

• Available programs, like the MHN Tuition Assistance Program and career advancement for patient care assistants, can help recruit students to the profession.

• Explore social barriers to workforce participation (e.g., lack of child care).
• Explore new internship and mentoring opportunities for youth to foster interest in health care professions.
• Encourage new graduates to work in the region and draw new professionals to the area via online learning programs.

• Crisis and PTSD services to respond to the health and social needs of current employees are needed.

148 2022-2025 MOUNTAIN HEALTH NETWORK COMMUNITY HEALTH NEEDS ASSESSMENT
APPENDIX C: FOCUS


2022-2025 MOUNTAIN HEALTH NETWORK COMMUNITY HEALTH NEEDS ASSESSMENT 149
GROUPS
PUBLIC HEALTH SECONDARY DATA REFERENCES
Agency for Healthcare Research and Quality. (n.d.). Neonatal abstinence syndrome (NAS) among newborn hospitalizations. Retrieved from https:// www.hcup-us.ahrq.gov/faststats/NASMap
America’s Health Rankings. (2021). Health of women and children. Retrieved from https://www.americashealthrankings.org/explore/health-ofwomen-and-children/measure/maternal_mortality_b
Center for Applied Research and Engagement Systems. (2021). Map room. Retrieved from https://careshq.org/map-rooms/
Centers for Disease Control and Prevention. (n.d.). BRFSS prevalence & trends data. Retrieved from http://www.cdc.gov/brfss/brfssprevalence/index.html
Centers for Disease Control and Prevention. (2020). CDC wonder. Retrieved from http://wonder.cdc.gov/
Centers for Disease Control and Prevention. (2020). Youth risk behavior surveillance system. Retrieved from https://www.cdc.gov/healthyyouth/data/yrbs/index.htm
Centers for Disease Control and Prevention. (2021). COVID data tracker. Retrieved from https://covid.cdc.gov/covid-data-tracker/#datatracker-home
Centers for Disease Control and Prevention. (2021). National vital statistics system. Retrieved from https://www.cdc.gov/nchs/nvss/index.htm
Centers for Disease Control and Prevention. (2021). PLACES: Local data for better health. Retrieved from https://www.cdc.gov/places/
Centers for Disease Control and Prevention. (2021). United States cancer statistics: data visualizations. Retrieved from https://gis.cdc.gov/Cancer/ USCS/#/StateCounty/
Centers for Medicare & Medicaid Services. (2021). Chronic conditions. Retrieved from https://www.cms.gov/Research-Statistics-Data-and-Systems/ Statistics-Trends-andReports/Chronic-Conditions/CC_Main.html
Corporation for Supportive Housing. (2020). Racial disparities and disproportionality index. Retrieved from https://www.csh.org/supportive-housing-101/ data/#RDDI
County Health Rankings & Roadmaps. (2021). Rankings data. Retrieved from http://www.countyhealthrankings.org/
Covid Act Now. (2021). US covid risk & vaccine tracker. Retrieved from https://covidactnow.org
Dignity Health. (2021). Community need index. Retrieved from http://cni.dignityhealth.org/
Feeding America. (2021). Food insecurity in the United States. Retrieved from https://map.feedingamerica.org/
150 2022-2025 MOUNTAIN HEALTH NETWORK COMMUNITY HEALTH NEEDS ASSESSMENT
APPENDIX D: PUBLIC HEALTH SECONDARY DATA REFERENCES


Health Resources and Service Administration. (2021). HPSA find. Retrieved from https://data.hrsa.gov/tools/shortage-area/hpsa-find


Kaiser Family Foundation. (2021). Latest data on COVID-19 vaccinations by race/ethnicity. Retrieved from https://www.kff.org/coronavirus-covid-19/ issue-brief/latest-data-on-covid-19-vaccinations-by-race-ethnicity/
Ohio Department of Health. (2021). 2019 infant mortality report. Retrieved from https://odh.ohio.gov/wps/portal/gov/odh/know-ourprograms/infant-and-fetal-mortality/reports
United States Bureau of Labor Statistics. (2021). Local area unemployment statistics. Retrieved from https://www.bls.gov/lau/
United States Census Bureau. (n.d.). American community survey. Retrieved from https://data.census.gov/cedsci/
United States Census Bureau. (2021). Decennial census. Retrieved from https://data.census.gov/cedsci/
United States Department of Health and Human Services. (2010). Healthy people 2030. Retrieved from https://health.gov/healthypeople/ objectives-and-data/browse-objectives


United States Department of Housing and Urban Development. (2021). HUD exchange. Retrieved from https://www.hudexchange.info/

2022-2025 MOUNTAIN HEALTH NETWORK COMMUNITY HEALTH NEEDS ASSESSMENT 151
2022-2025
COMMUNITY HEALTH IMPROVEMENT PLAN: MHN IMPLEMENTATION STRATEGY
MHN developed a three-year Community Health Improvement Plan (CHIP) to guide community benefit and population health improvement activities across their service area. The CHIP builds upon previous health improvement activities, while recognizing new health needs identified in the 2022 CHNA, a changing health care environment and the impact of the COVID-19 pandemic.
The plan is supported by systemwide priority areas and goals for health improvement and hospital-level strategies that leverage the strengths and assets of each facility. Individual hospital strategies versus systemwide initiatives are noted throughout the plan.
New Health Equity Approach: While the 2022 priority areas are consistent with those identified in past needs assessments, in developing the CHIP, MHN sought to focus on upstream interventions to address underlying disparities in social determinants of health and access to care, as well as the needs of priority populations, including youth and older adults. This focus is consistent with a health equity approach to look beyond the health care system to build healthier communities for all people now and in the future. New strategies to be explored by MHN, as well as continuing strategies from prior CHIPs, are highlighted throughout the plan. The CHIP aligns with both the broader MHN Health Equity Plan and MHN Strategic Plan.
Priority Area: Behavioral Health

Goal:


Strengthen and support community initiatives that provide equitable and sustainable access to resources that address the unique behavioral health needs of all residents.
Objectives and Strategies:


Objective: Increase awareness and education to encourage treatment and management of behavioral health issues.
New Strategy:
o In collaboration with community partners, solicit feedback from people with lived experience and their families for a behavioral health services gap analysis.
Continuing Strategies:
o Support, promote and participate in community behavioral health awareness and training efforts.
o Conduct screenings in health care settings to identify individuals with behavioral health conditions.
o Provide free support groups, such as Navigating Grief and Perinatal Bereavement.

152 2022-2025 MOUNTAIN HEALTH NETWORK COMMUNITY HEALTH NEEDS ASSESSMENT
APPENDIX E: COMMUNITY HEALTH NEEDS IMPROVEMENT PLAN 2022-2025
Objective: Promote wellness and resilience initiatives that protect from and offset risk factors for behavioral health issues.
New Strategies:
o Explore partnerships with arts and cultural venues to provide youth engagement and social connectivity opportunities.
o Strengthen and support community organizations providing youth mentorship, senior programming, relationship-building, and social emotional learning opportunities.
o Develop collaborative arrangements with community organizations to encourage social engagement and self-management skills for individuals with chronic conditions, chronic pain or advancing illness.
Continuing Strategies:
o CHH-specific strategy: Provide the Hoops Family Children’s Hospital Child Advocacy Center, dedicated to offering children and families with compassionate care to reduce the trauma often experienced by children who are victims of abuse.

o SMMC-specific strategy: Support the COMPASS program and City of Huntington first responders with an Employee Assistance Program (EAP) to strengthen the ability of first responders to deal with high-stress situations and build resiliency to process any effects of that stress.
Objective: Improve access to behavioral health services.
New Strategy:
o Expand access to behavioral health services through telehealth applications.
Continuing Strategy:
o CHH-specific strategy: Coordinate service delivery with Prestera Center for Mental Health Services, specializing in helping individuals who have a dual diagnosis of behavioral health and SUD.

Priority Area: Substance Use Disorder

Goal:

Strengthen and support community initiatives that provide equitable and sustainable access to resources that address the substance use disorder (SUD) needs of all residents.
Objectives and Strategies:


Objective: Increase awareness of SUD to reduce stigma and fear of seeking treatment.
New Strategies:

o In collaboration with community partners, solicit feedback from people with lived experience and their families for a SUD services gap analysis.
o Explore providing SUD awareness sensitivity training to MHN employees.
Continuing Strategies:
o Support, promote and participate in community SUD awareness and training efforts.
o Conduct screenings in health care settings to identify individuals with SUD conditions.
o Provide free support groups, such as Families Motivating Recovery.
2022-2025 MOUNTAIN HEALTH NETWORK COMMUNITY HEALTH NEEDS ASSESSMENT 153
Objective: Promote wellness and resilience initiatives that protect from and offset risk factors for SUD.
New Strategies:
o Explore partnerships with arts and cultural venues to provide youth engagement and social connectivity opportunities.
o Strengthen and support community organizations providing youth mentorship, senior programming, relationship-building, and social emotional learning opportunities.
Objective: Improve access to SUD treatment and recovery services.
New Strategies:
o Explore mobile unit outreach for services such as mobile medicationassisted treatment (MAT) and Narcan distribution.

o Explore community partnerships to enhance transportation options for SUD treatment and recovery services clients.
o Support efforts to expand telehealth visits.
Continuing Strategies:
o Partner with the City of Huntington, Cabell County EMS, Marshall Health, and other agencies to provide a Quick Response Team to personally visit every patient within 72 hours following an overdose to assess their needs, develop a personalized plan for intervention, and connect them with addiction service providers.
o Support Project Engage, an evidence-based practice for individuals with opioid use disorder who seek treatment through the ED, providing peer recovery coaches for support, the option of medication assisted treatment while in the ED, and referrals for community-based treatment and recovery services.

o Support PROACT (Provider Response Organization for Addiction Care and Treatment), a centralized community hub for treatment, recovery, therapy, education, research, workforce opportunities and support for those affected by addiction.
o Participate in“Reverse the Cycle” project at both hospital ERs, in conjunction with Mosaic Consulting and Marshall Health Addiction Medicine division.
• Screening for substance abuse disorder in ER visits with Peer Recovery Specialist follow-up.
• Peer Recovery Specialist outreach to overdose survivors (apart from QRT).
• Prescribing or providing outpatient NARCAN/naloxone to ER patients presenting with overdose.

o CHH-specific strategies
• Provide the HFCH Maternal Opioid Medical Support (MOMS) program to provide addiction treatment services, psychological and medical treatment, education, and training to postpartum women, while their babies recover from Neonatal Abstinence Syndrome (NAS).
• Coordinate service delivery with Lily’s Place, a non-profit leader in NAS, to care for drug-exposed newborns and their families.
• Coordinate service delivery with Prestera Center for Mental Health Services, specializing in helping individuals who have a dual diagnosis of behavioral health and SUD.


• Participate in Healthy Connections, a coalition of health care and social service providers dedicated to evidence-based and inter-agency programming for the treatment of pregnant and parenting families who are struggling with SUD.

154 2022-2025 MOUNTAIN HEALTH NETWORK COMMUNITY HEALTH NEEDS ASSESSMENT
APPENDIX E: COMMUNITY HEALTH NEEDS IMPROVEMENT PLAN 2022-2025
Priority Area: Chronic Disease Prevention and Management
Goal: Achieve equitable life expectancy and quality of life for all people by ensuring residents have the resources they need to maintain their health.
Objectives and Strategies:

Objective: Reduce disparities in chronic disease prevalence and death rates and promote health equity.
New Strategies:
o Align with strategic initiatives by MHN Centers of Excellence in cardiovascular and pediatrics.

o Strengthen and support community organizations addressing key social determinants of health barriers, including food insecurity, housing and utility instability, transportation needs, health literacy, access to care, difficulties in paying for care and medications and personal safety.
o Support early health education opportunities for youth in partnership with afterschool programming and school districts.
o Provide lung nodule screenings for earlier detection of lung cancer.


Continuing Strategies:
o Provide financial counselors to ensure the financial capacity of people who need medical services does not prevent them from seeking or receiving care.
o Utilize the resources of organizations such as FaithHealth Appalachia and Catholic Charities, serving as a connection between social services, faith-based organizations, medical facilities, and other key leaders to meet the social determinants of health needs of patients.
o Support, promote, and participate in community health events, including free or discounted screenings and support groups.
o CHH-specific strategies:
• Collaborate with the Marshall Health Chertow Diabetes Center to provide patient education, a diabetes support group, diabetes exercise center, and other resources for patients with diabetes.
• Provide smoking cessation programming in partnership with CHH Center for Lung Health and Cabell-Huntington Health Department.

o SMMC-specific strategies

• Expand the heart failure clinic for patients who do not have a medical home or who cannot see their primary care doctor within seven days of discharge from the hospital.
• Provide patient diabetes education, nutrition counseling and disease management.
• Provide smoking cessation programming in partnership with St. Mary’s Pulmonary Rehabilitation and Cabell-Huntington Health Department.
Objective: Increase access to traditional and alternative (community- and technology-based) places people can access health care.
New Strategies:
o Expand new primary care site locations across the region, and partnership opportunities with local community-based organizations to co-locate social services.
o Expand equitable access to telehealth visits and provide alternative means of connection for those without access to broadband or smartphone services.
o Explore partnerships with churches and community centers, as well as mobile delivery options, to bring health and social services to rural communities.
o Work with primary care offices to encourage and schedule individuals who delayed preventive care during the pandemic.

o Support broadband efforts to provide access to unserved populations.

2022-2025 MOUNTAIN HEALTH NETWORK COMMUNITY HEALTH NEEDS ASSESSMENT 155
o SMMC-specific strategy: Explore providing free screenings for the community at the SMMC Conference Center.
Continuing Strategies:
o Support Ebenezer Medical Outreach, a full-service medical clinic providing access to free, comprehensive health care to financially eligible clients.

o Enhance access to home-based care services through home health, transitional care, and other in-home service arrangements.
o CHH-specific strategy: Partner with Marshall Health via CHH Home Care Medicine to provide pre- and post-acute home care for homebound patients age 18 or over throughout the Tri-State region.


Objective: Improve access to health care services for the senior population, including behavioral health services, SUD services, wellness visits, primary care visits and other chronic disease prevention and management services.
New Strategies:
o Explore partnership opportunities with senior centers to provide older adult behavioral health services and supports, wellness and senior vitality programs.
o Utilize the resources of organizations such as FaithHealth Appalachia and Catholic Charities, serving as a connection between social services, faithbased organizations, medical facilities, and other key leaders to meet the social determinants of health needs of seniors (65+), such as food insecurity, malnutrition, housing, and transportation needs and social isolation.
Achieve equitable life expectancy and quality of life for all people aged 65+ years by ensuring residents have the resources they need to maintain their health.
Objectives and Strategies:


Objective: Promote wellness and resilience initiatives that protect from and offset risk factors for seniors (65+) for behavioral health issues, substance use disorder and chronic health diseases.
New Strategies:
o Explore partnerships with senior centers and other elder service providers to provide older adult engagement and social connectivity opportunities.
o Expand remote access to senior wellness services through telehealth and digital connections.
Objective: Reduce disparities in chronic disease prevalence and death rates.
New Strategies:
o Align with strategic initiatives by the Center for Healthy Aging.
o Explore Age-Friendly Health Systems and AARP Livable Communities criteria to address the unique care needs of older adults.
Objective: Increase access to traditional and alternative (community- and technology-based) places the 65+ population can access health care.
New Strategies:
o Expand equitable access to telehealth visits and provide alternative means of connection for those without access to broadband or smartphone services.
o Explore opportunities to leverage senior centers and other communitybased partners to augment health care and bridge gaps in social and support services for older adults.
156 2022-2025 MOUNTAIN HEALTH NETWORK COMMUNITY HEALTH NEEDS ASSESSMENT
APPENDIX E: COMMUNITY HEALTH NEEDS IMPROVEMENT PLAN 2022-2025
Enhance food security and encourage and increase healthy eating behaviors across all age groups in the community.
Objectives and Strategies:


Objective: Increase access to healthy foods.
New Strategies:
o Utilize the resources of organizations such as FaithHealth Appalachia and Catholic Charities, serving as a connection between social services, faith-based organizations, medical facilities, and other key leaders to meet the social determinants of health needs of patients, such as food security and appropriate nutrition.
o Expand and enhance use of medically tailored food boxes and ready-to-eat meals with Facing Hunger Foodbank and retail food stores, including providing medically tailored meals at discharge and post-dis charge for high-risk patients who are food insecure or malnourished.
o Support farmers markets and other food access initiatives that provide fresh, locally grown produce for low to moderate income, underserved populations.
o Strengthen and support community organizations addressing key social determinants of health barriers, including food insecurity and access to healthy foods.
o Explore partnerships with grocery stores and corporations to increase food supply, healthier options and reduce food deserts.
o Encourage mobile food drives.
o Engage in demonstration projects with other providers and payers to develop innovative ways to address food insecurity through incentives and supplemental programs.
Objective: Reduce disparities in chronic disease prevalence and death rates.
New Strategies:
o Strengthen and support opportunities for healthy lifestyles, including community gardens and community walkability.
o Partner with community organizations to address underlying drivers of health disparities through education, outreach, and chronic disease management programs.
o Explore community activities that focus on getting families together to learn how to improve quality of food and activity.
o Support wellness and nutrition education events in partnership with community partners.
o Collaborate with nutrition and dietary resources within the system and in the community to integrate nutrition education into chronic disease management programs, including use of tele-nutrition programs.
Continuing Strategies:
o Support programs such as Huntington’s Kitchen, a Teaching Kitchen Collaborative bridging nutrition science, health care, and the culinary arts to induce healthy lifestyle changes and promote food security.
2022-2025 MOUNTAIN HEALTH NETWORK COMMUNITY HEALTH NEEDS ASSESSMENT 157


 2025 Mountain Health Network Community Health Needs Assessment
2022 –
