
19 minute read
A Closer Look at Health Statistics


Advertisement


60% of all residents and children live in poverty and 12% have not completed high school and/or are without health insurance. It is worth nothing that nearly all of downtown Huntington is identified as SOCIAL DETERMINANTS OF HEALTH: vulnerable based on high concentrations of people living in poverty and low educational attainment. THE CONNECTIONS BETWEEN OUR COMMUNITIES AND OUR HEALTH Other areas of high need within the MHN service area include the southern portion of Wayne County and northern portion of Mingo County in West Virginia, and neighboring Lawrence County in Kentucky. Comparing health indicators with population statistics demonstrates the adverse impact of social determinants on populations that historically and continually experience inequities, particularly Black/ African Americans. While the MHN service area is less diverse overall, communities experiencing more socioeconomic barriers are the most diverse in the region. In this way, we can begin to see how inequities perpetuate persistent disparities in health and social outcomes. The following table lists the social determinants that contribute to CNI scores and are often indicative of health disparities. Zip codes with a CNI score of 3.4 or higher are shown, in descending order by score.
Community Need Index Continued
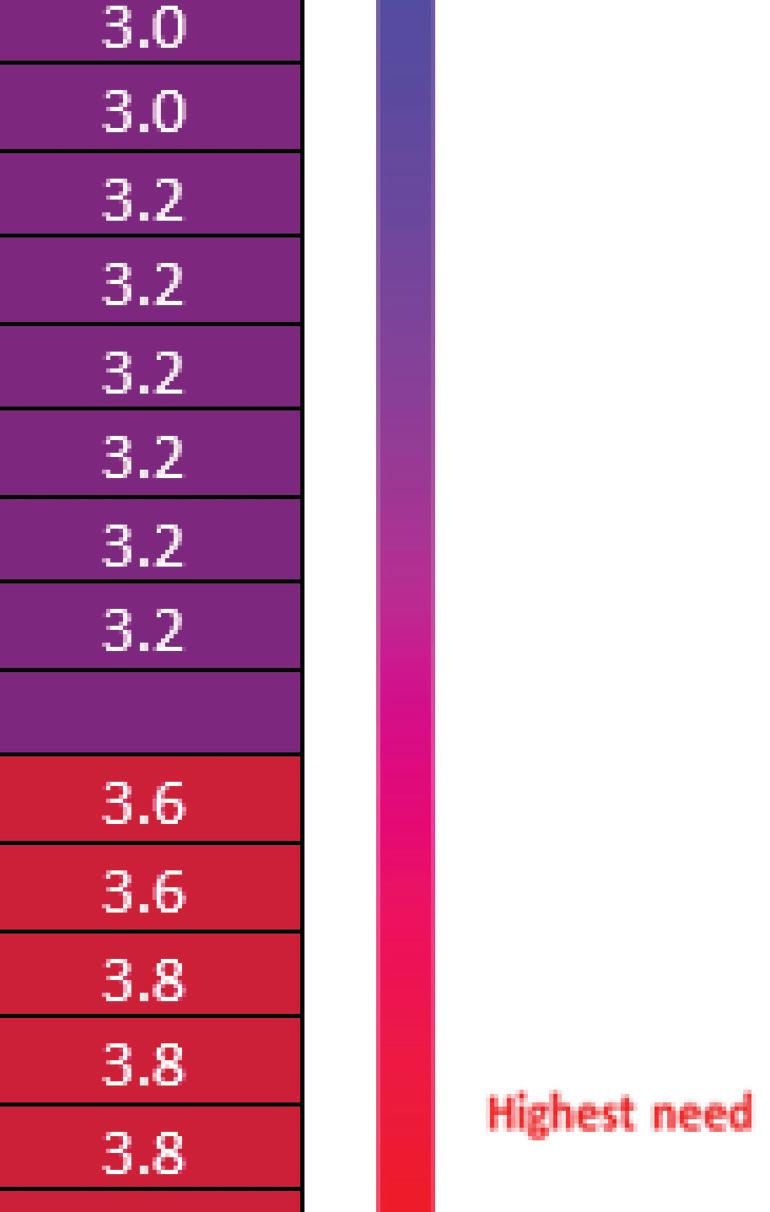
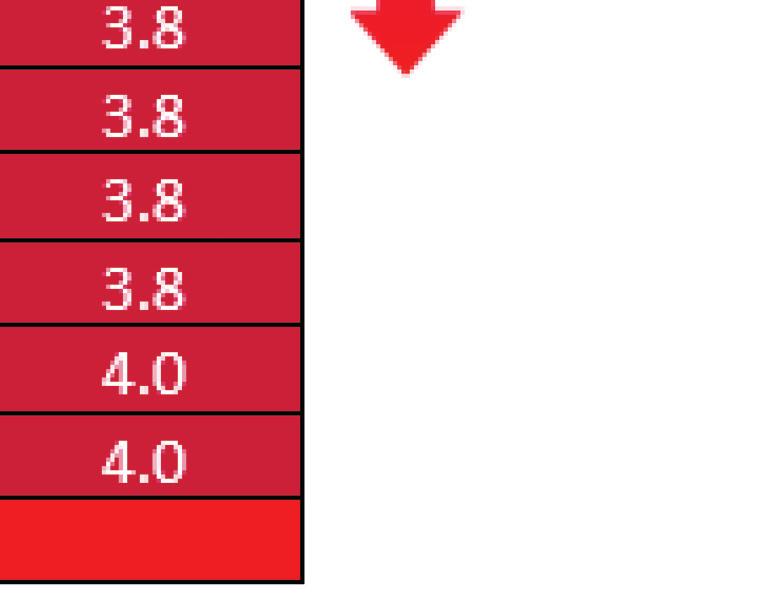
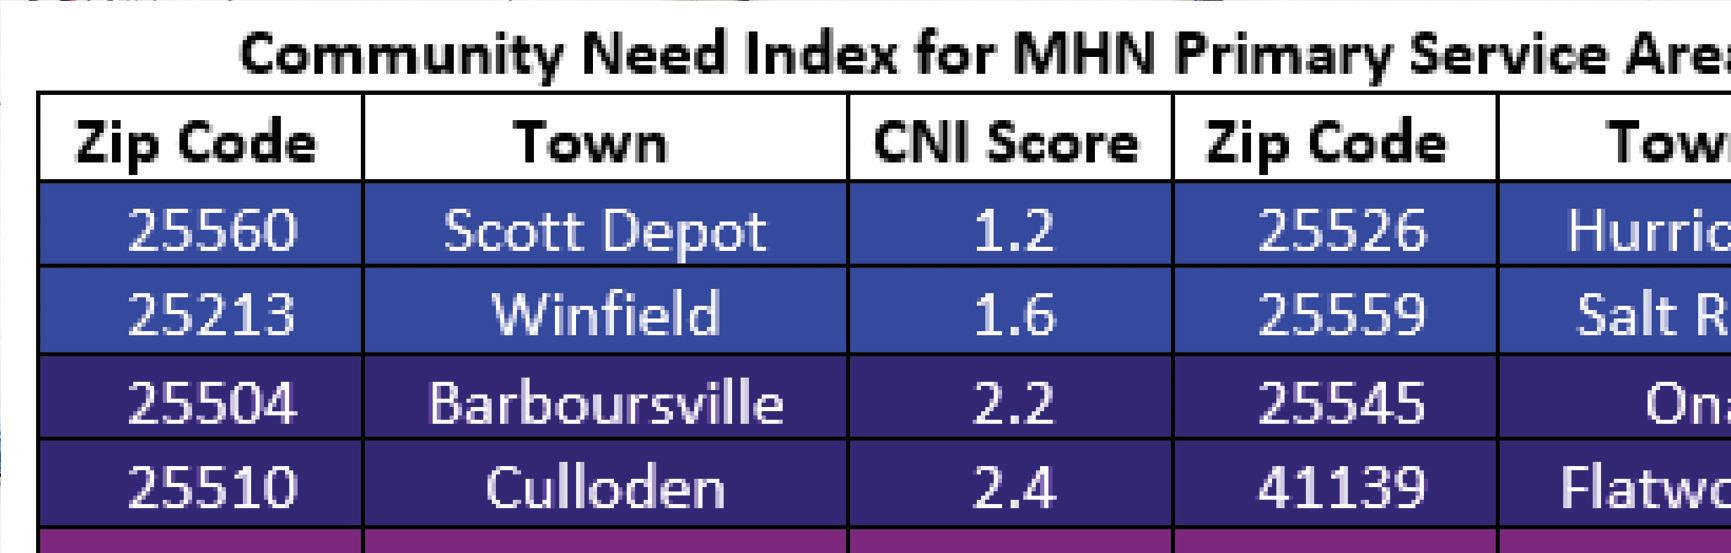
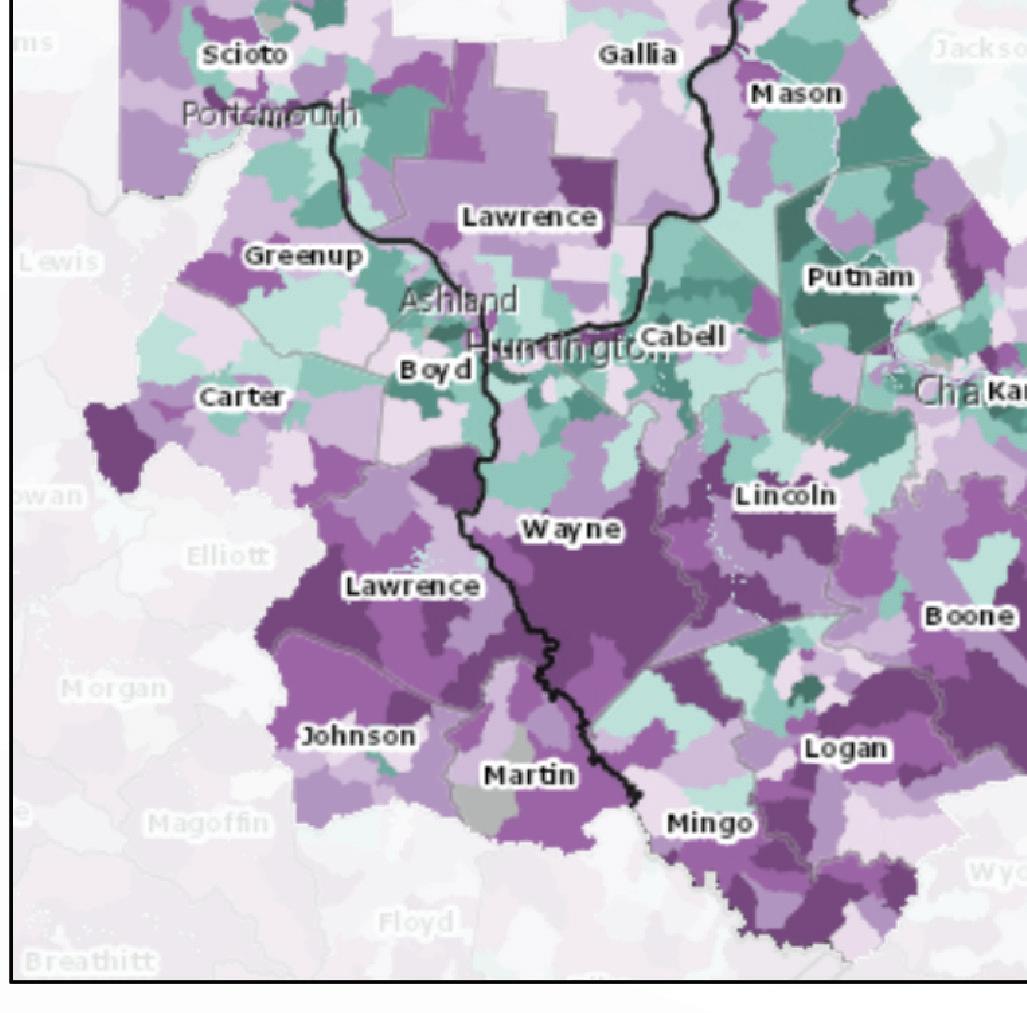
The MHN zip code service area has an average CNI score of 3.2, indicating moderate community need. Of the 49 zip codes comprising the service area, 23 score in high need categories of 3.4 or higher. Consistent with the 2019 CHNA, Huntington zip code 25703 has the highest CNI score, and the score increased from 4.2 to 4.4. Zip code 25703 encompasses a portion of downtown Huntington, which is also identifi ed as an area of disadvantage by the Area Deprivation Index. Within this zip code, nearly 60% of all residents and children live in poverty and 12% have not completed high school and/or are without health insurance. It is worth nothing that nearly all of downtown Huntington is identifi ed as vulnerable based on high concentrations of people living in poverty and low educational attainment.
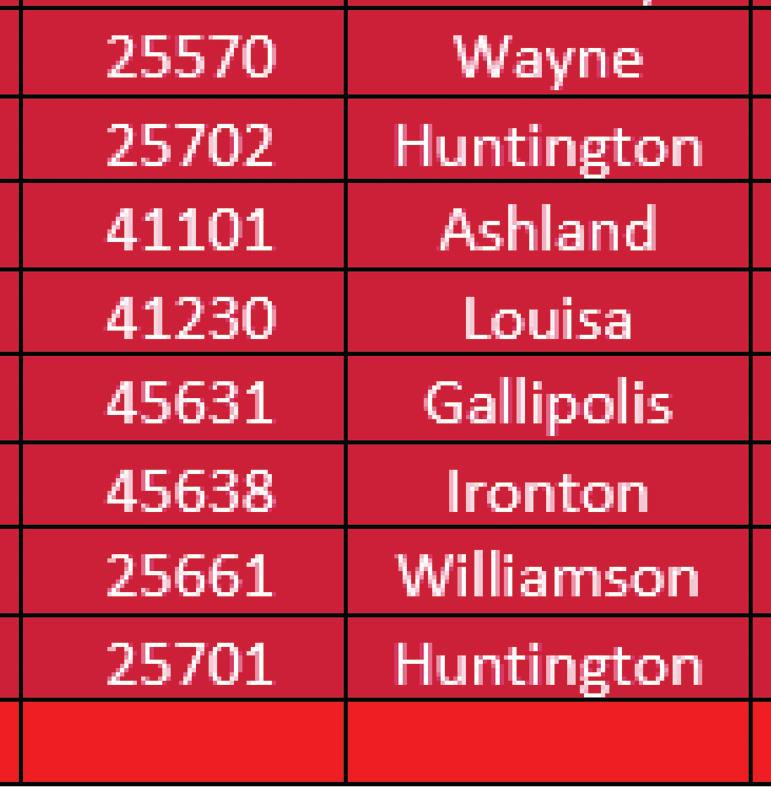
Other areas of high need within the MHN service area include the southern portion of Wayne County and northern portion of Mingo County in West Virginia, and neighboring Lawrence County in Kentucky.
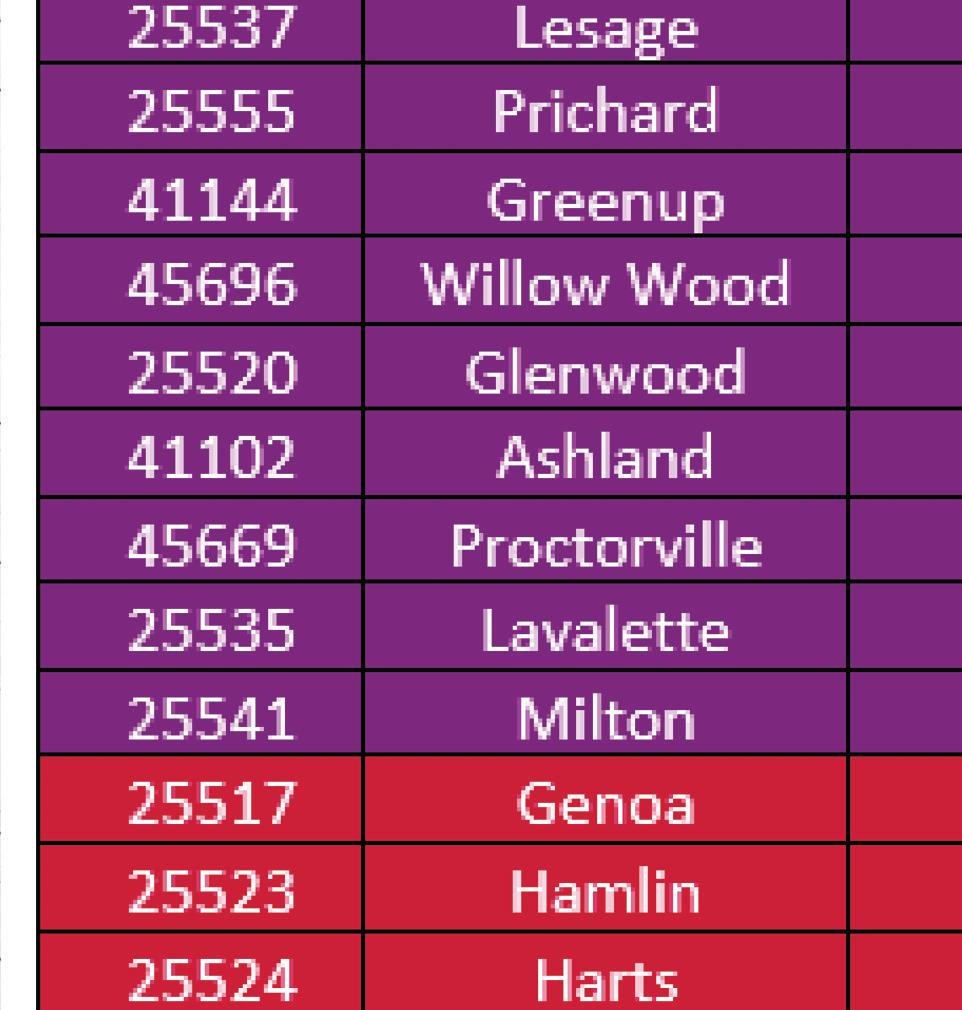
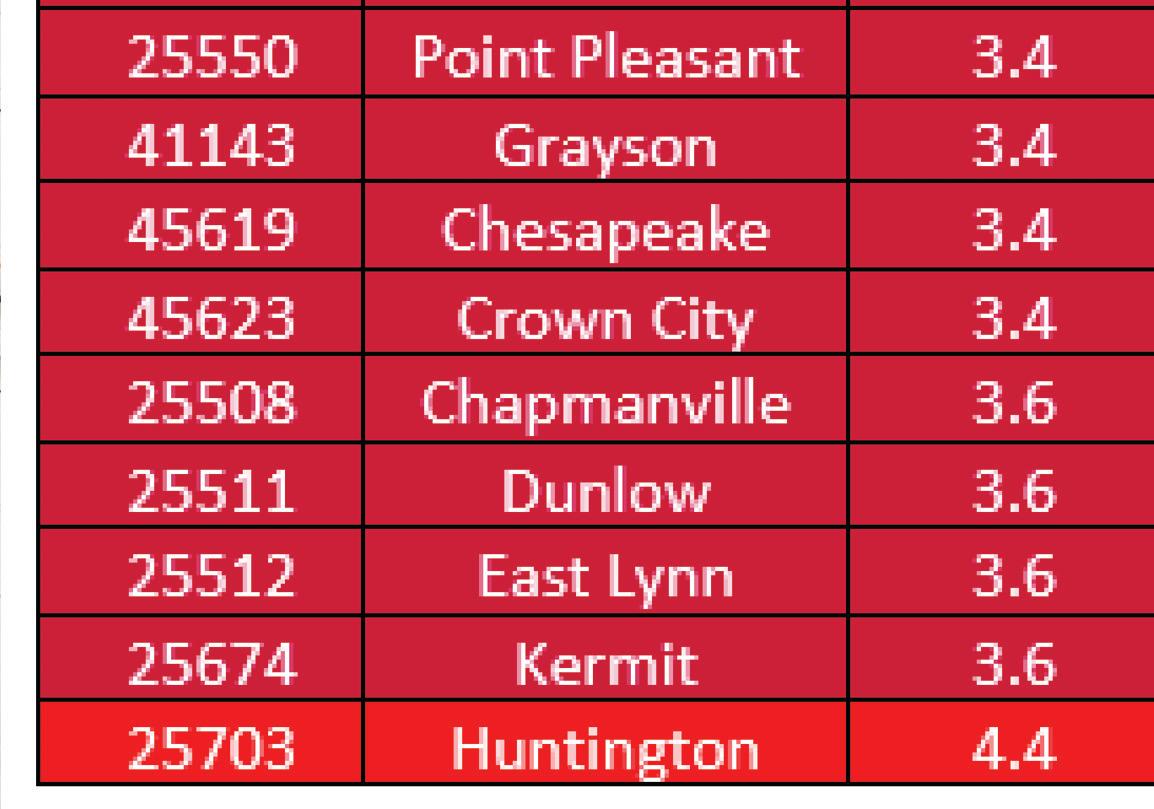
Comparing health indicators with population statistics demonstrates the adverse impact of social determinants on populations that historically and continually experience inequities, particularly Black/ African Americans. While the MHN service area is less diverse overall, communities experiencing more socioeconomic barriers are the most diverse in the region. In this way, we can begin to see how inequities perpetuate persistent disparities in health and social outcomes. The following table lists the social determinants that contribute to CNI scores and are often indicative of health disparities. Zip codes with a CNI score of 3.4 or higher are shown, in descending order by score.
2015-2019 Social Determinants of Health by Geography Red = Higher CNI Score from the 2019 CHNA ZIP Code (County) Population in Poverty Children in Poverty No High School Diploma
Social Determinants of Health by Geography Red = Higher CNI Score from the 2019 CHNA No Health Insurance
25703, Huntington (Cabell) 25661, Williamson (Mingo) 25701, Huntington (Cabell) 25514, Fort Gay (Wayne) 25570, Wayne (Wayne) 25702, Huntington (Cabell) 41101, Ashland (Boyd) 41230, Louisa (Lawrence, KY) 57.1% 57.7% 12.0% 11.5% 4.4 31.9% 38.5% 18.3% 3.3% 4.0 27.1% 36.2% 10.9% 9.0% 4.0 24.1% 28.4% 19.7% 10.2% 3.8 30.7% 46.0% 20.6% 9.8% 3.8 29.9% 39.1% 19.5% 7.9% 3.8 24.3% 34.9% 12.4% 6.4% 3.8 24.6% 35.0% 22.6% 8.6% 3.8
45631, Gallipolis (Gallia)
20.0% 36.7% 13.4% 8.7% 3.8 45638, Ironton (Lawrence, OH) 21.3% 30.2% 12.5% 6.7% 3.8 25508, Chapmanville (Logan) 25511, Dunlow (Wayne) 25512, East Lynn (Wayne) 25674, Kermit (Mingo) 17.7% 18.6% 20.1% 7.1% 3.6
3.2 31.9% 38.9% 38.9% 3.1% 3.6 N/A 21.8% 46.5% 41.2% 0.0% 3.6 3.6
38.1% 58.3% 30.6% 10.4% 3.6 3.4
25704, Huntington (Wayne)
23.3% 33.2% 18.9% 7.9% 3.6 45680, South Point (Lawrence, OH) 22.2% 31.0% 12.6% 4.9% 3.6 25517, Genoa (Wayne) 25523, Hamlin (Lincoln) 32.6% 46.1% 41.0% 8.3% 3.4 39.3% 60.9% 20.3% 5.0% 3.4
25524, Harts (Lincoln)
38.4% 69.0% 25.6% 4.6% 3.4 25550, Point Pleasant (Mason) 17.7% 30.5% 11.7% 5.5% 3.4 41143, Grayson (Carter) 20.9% 29.7% 15.3% 6.9% 3.4 3.2
45619, Chesapeake (Lawrence, OH) 13.5% 17.3% 12.7% 5.3% 3.4 3.4
45623, Crown City (Gallia) Kentucky Ohio 17.1% 29.6% 13.6% 6.3% 3.4
3.2 17.3% 23.5% 5.6% 5.7% N/A N/A 14.0% 19.9% 7.2% 6.1% N/A N/A
West Virginia 17.6% 23.8% 13.1% 6.0% N/A N/A
United States 13.4% 18.5% 12.0% 8.8% N/A N/A Source: US Census Bureau, American Community Survey Source: US Census Bureau, American Community Survey, 2015-2019
Mountain Health Network 2022 CHNA


Vulnerable Population Footprint Area Deprivation Index


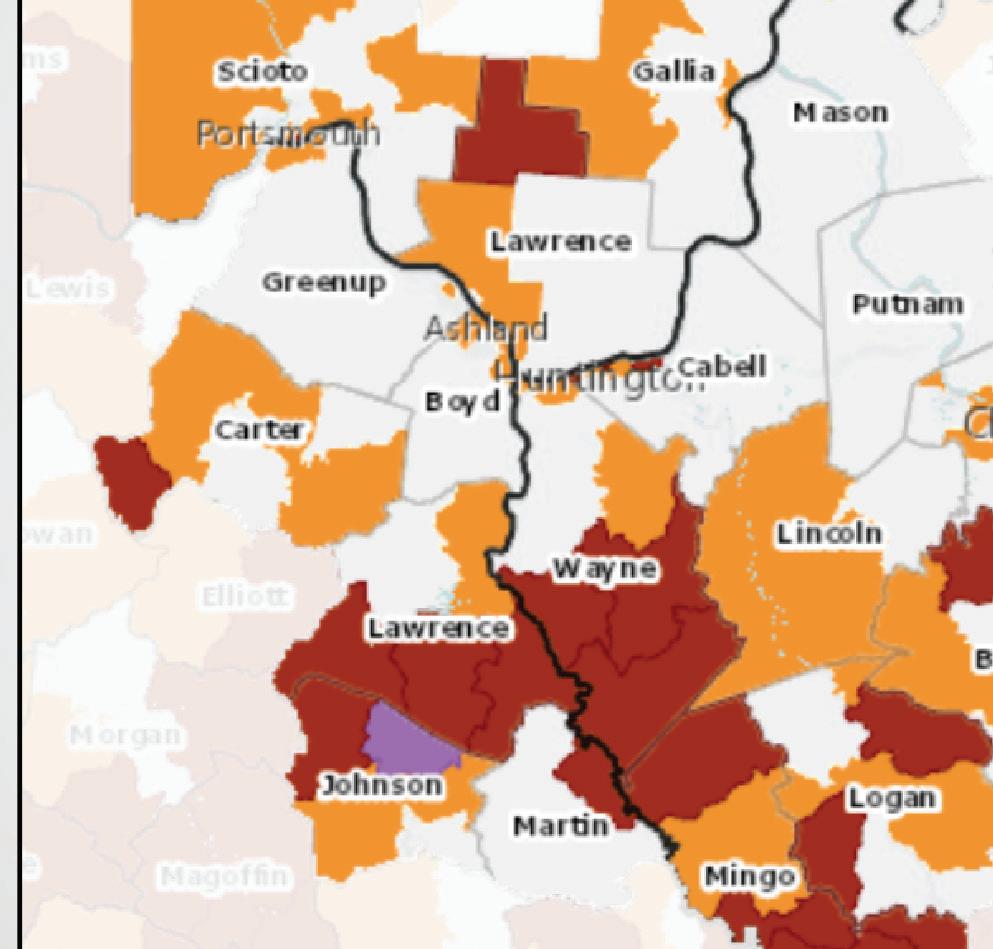
Area Deprivation Index (2019), State Decile by Block Group, Neighborhood Atlas 2021
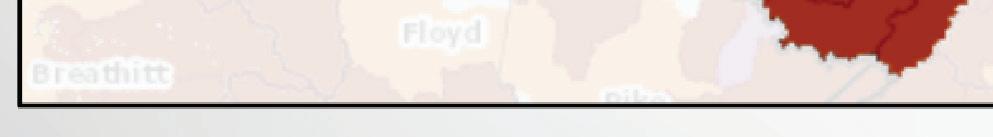
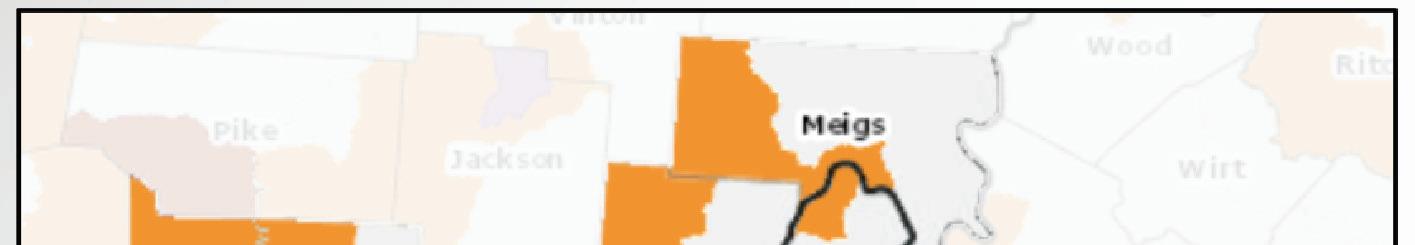
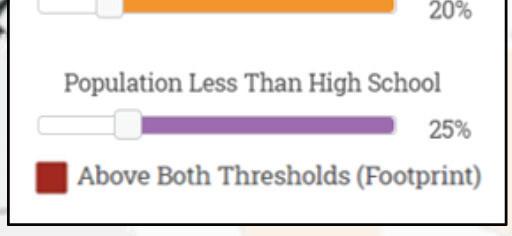
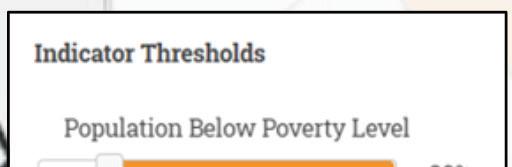

Vulnerable Population Footprint: The Vulnerable Population Footprint identifi es areas where high concentrations of people living in poverty and people living without a high school diploma overlap. Areas are reported by census tract. Census tracts are statistical subdivisions of a county that have roughly 4,000 inhabitants. Area Deprivation Index (ADI): The ADI provides a census block group measure of socioeconomic disadvantage based on income, education, employment, and housing quality. ADI scores are displayed at the block group level on a scale from 1 (least disadvantaged) to 10 (most disadvantaged). A block group is a subdivision of a census tract and typically contains between 250 and 550 housing units.

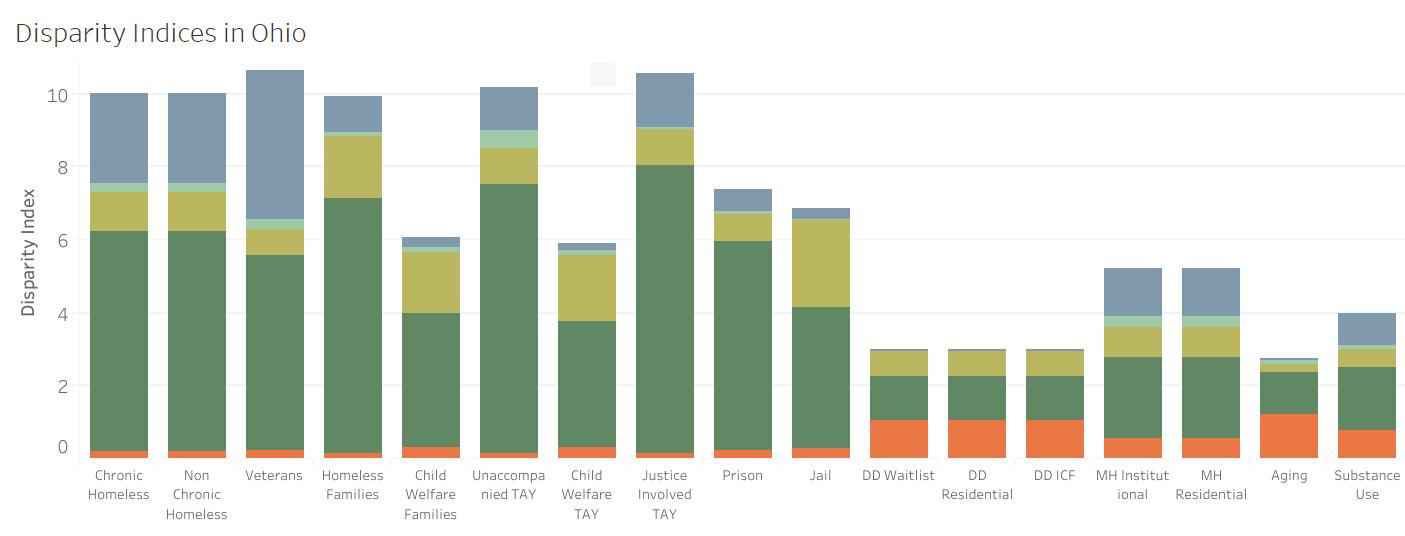
Racial Disparities and Disproportionality Index (RDDI) for WV, KY & OH
Racial Disparities and Disproportionality Index
Chronic Chronic Homeless Homeless
NonNon Chronic Chronic Homeless Homeless Veterans Veterans HomelssHomelss FamiliesFamilies ChildChild Welfare Welfare Families Families UnaccompaUnaccompanied TAY nied TAY ChildChild Welfare Welfare TAYTAY Justice Justice Involved Involved TAY TAY PrisonPrison JailJail DD Waitlist DD Waitlist DD DD Residential Residential DD ICFDD ICF MH InsstituMH Insstitutional tional
MH Residential
MH Residential AgingAging Substance Substance UseUse
Source: Corporation for Supportive Housing *TAY: Transition-age youth; DD: Developmental Disability; MH: Mental Health *No DD Residential Data Source: Corporation for Supportive Housing *TAY: Transition-age youth; DD: Developmental Disability; MH: Mental Health
Racial Disparities and Disproportionality Index (RDDI):
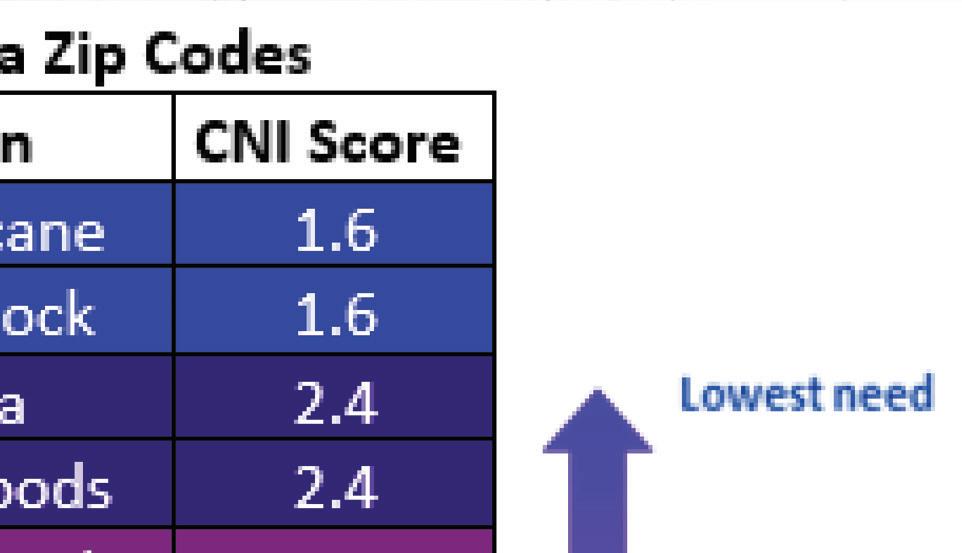
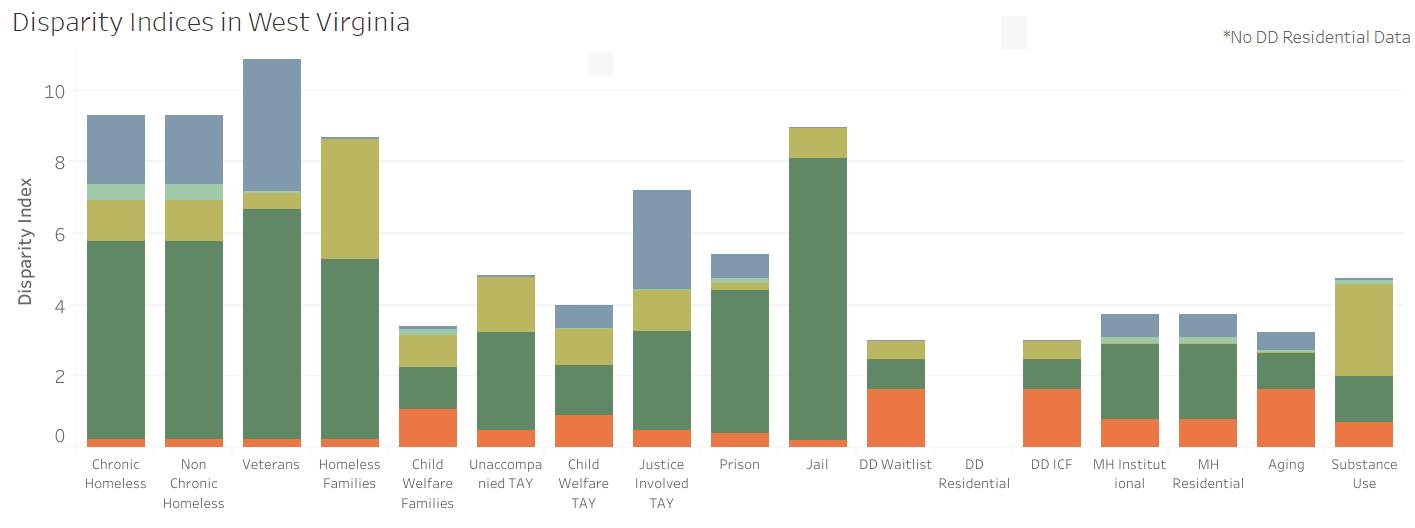
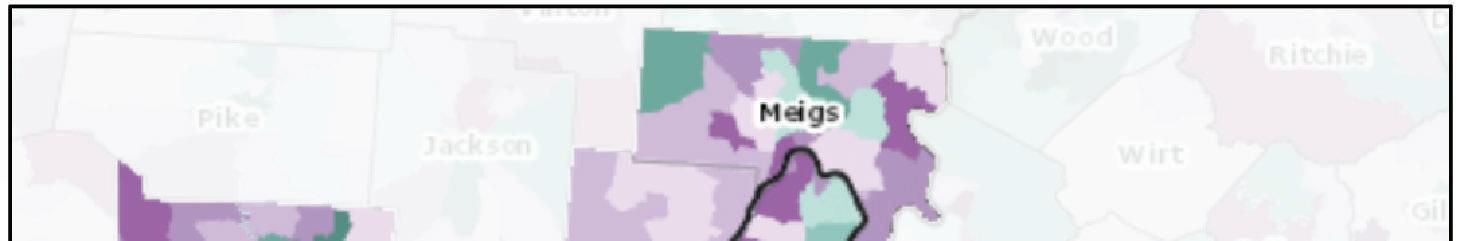
The Racial Disparities and Disproportionality Index was developed by the Corporation for Supportive Housing (CSH toassess unique systems and measure whether a racial and/or ethnic group’s representation in a particular public system is proportionate to, over,or below their representation in the overall population. The index can be viewed as the likelihood of one group experiencing an event, compared to the likelihood of another group experiencing that same event. Results are provided on a state-by-state basis. The Racial Disparities and Disproportionality Index measures whether a racial group’s representation in a particular public system is proportionate to their representation in the overall population. Public systems include homelessness, veterans, prison/justice systems, child welfare, developmental disabilities, mental health institutions, aging population and substance use. An index of 1 signifi es equal representation; an index below 1 signifi es underrepresentation and an index above 1 signifi es overrepresentation in a system.


Racial Disparities and Disproportionality Index


Veterans Homelss Families Child Welfare Families Unaccompanied TAY Child Welfare TAY Justice Involved TAY Prison Jail DD Waitlist DD Residential DD ICF MH Insstitutional
MH Residential Aging Substance Use Source: Corporation for Supportive Housing *TAY: Transition-age youth; DD: Developmental Disability; MH: Mental Health

Across the Tri-State region, Black/African Americans have the highest index score of any other population group, ranging from 3.97 in Kentucky to 6.02 in Ohio. This fi nding indicates overrepresentation in public systems. In all three states, Black/African Americans are overrepresented in prison and justice systems, as well as among people experiencing homelessness. This fi nding is consistent with systemic issues of racism within the nation’s criminal justice system that lead to disproportionate incarceration and sentencing among people of color.
Source: Corporation for Supportive Housing *TAY: Transition-age youth; DD: Developmental Disability; MH: Mental Health Source: Corporation for Supportive Housing *TAY: Transition-age youth; DD: Developmental Disability; MH: Mental Health Source: Corporation for Supportive Housing *TAY: Transition-age youth; DD: Developmental Disability; MH: Mental Health


Veterans Homelss Families Child Welfare Families Unaccompanied TAY Child Welfare TAY Justice Involved TAY Prison Jail DD Waitlist DD Residential DD ICF MH Insstitutional
MH Residential Aging Substance Use
Source: Corporation for Supportive Housing *TAY: Transition-age youth; DD: Developmental Disability; MH: Mental Health Source: Corporation for Supportive Housing *TAY: Transition-age youth; DD: Developmental Disability; MH: Mental Health
Life Expectancy


Life expectancy is another measure of the impact of social determinants of health. Within the Tri-State region, there is a 2.2-year difference in life expectancy across the states, with lower life expectancy in West Virginia.
Life expectancy is another measure of the impact of social determinants of health. Within the tri-state Across all three states, life expectancy is highest for Latinx and Asian residents and lowest for Black/African American residents. Life expectancy disparities region, there is a 2.2-year difference in life expectancy across the states, with lower life expectancy in West Virginia. Life expectancy is another measure of the impact of social determinants of health. Within the tri-state region, there is a 2.2-year difference in life expectancy across the states, with lower life expectancy in West Virginia. among Black/African Americans are most prominent in Ohio, where Black/ Across all three states, life expectancy is highest for Latinx and Asian residents and lowest for Across all three states, life expectancy is highest for Latinx and Asian residents and lowest for African Americans live an average of 3.7 years less than Whites. This disparity is Black/African American residents. Life expectancy disparities among Black/African Americans are most Black/African American residents. Life expectancy disparities among Black/African Americans are most also refl ected in mortality data presented in this report. In Ohio, Black/African prominent in Ohio, where Black/African Americans live an average of 3.7 years less than Whites. This prominent in Ohio, where Black/African Americans live an average of 3.7 years less than Whites. This Americans have an all-cause death rate that is more than 150 points higher than the death rate for Whites. disparity is also reflected in mortality data presented in this report. In Ohio, Black/African Americans have an all-cause death rate that is more than 150 points higher than the death rate for Whites. disparity is also reflected in mortality data presented in this report. In Ohio, Black/African Americans have an all-cause death rate that is more than 150 points higher than the death rate for Whites.
2017-2019 Life Expectancy by Race and Ethnicity LIfe Expectancy by Race and Ethnicity2017-2019 Life Expectancy by Race and Ethnicity
Kentucky Overall Life Expectancy Overall Life Expectancy 75.6 Asian Asian 86.5 Black Black 74.3 White White 75.5 Latinx origin (any race) Latinx origin (any race) 96.3
Kentucky Ohio 75.6 77.0 86.588.2 74.373.5 75.577.2 96.386.0
OhioWest Virginia 77.0 74.8 88.288.3 73.572.7 77.274.7 86.0102.9 West Virginia 74.8 Source: National Vital Statistics System 88.3 72.7 74.7 102.9 Source: National Vital Statistics System Source: National Vital Statistics System, 2017-2019
1200.0 1000.0
2016-2020 All Cause Death Rate by Race/Ethnicy All Cause Death Rate by Race/Ethnicity 2016-2020 All Cause Death Rate by Race/Ethnicy per Age-Adjusted 100,000 per Age-Adjusted 100,00 per Age-Adjusted 100,000
1200.0 800.0 1000.0 600.0
600.0 800.0 0.0 200.0 400.0 400.0 200.0 0.0
Total White (Non-Hispanic) Black/AfricanAmerican (Non-Hispanic) Latinx (Any Race)
Total White (Non-Hispanic) Black/AfricanAmerican (Non-Hispanic)
MHN Service Area Kentucky 1076.7 946.6 1086.1 957.7 1110.9 1007.0 Latinx (Any Race) 299.6 366.3
MHN Service Area Ohio 1076.7 860.7 1086.1 855.8 1110.9 1014.4 299.6 488.9
Kentucky West Virginia United States 946.6 971.2 747.6 957.7 979.3 763.8 1007.0 1064.2 925.3 366.3 269.3 567.7
Ohio 860.7 855.8 1014.4 488.9 West Virginia 971.2 979.3Source: Centers for Disease Control and Prevention Source: Centers for Disease Control and Prevention, 2016 - 2020 1064.2 269.3
United States 747.6 763.8 925.3 567.7 Source: Centers for Disease Control and Prevention


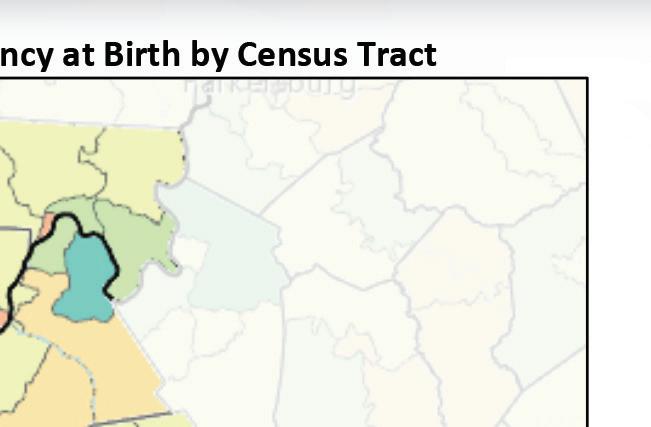


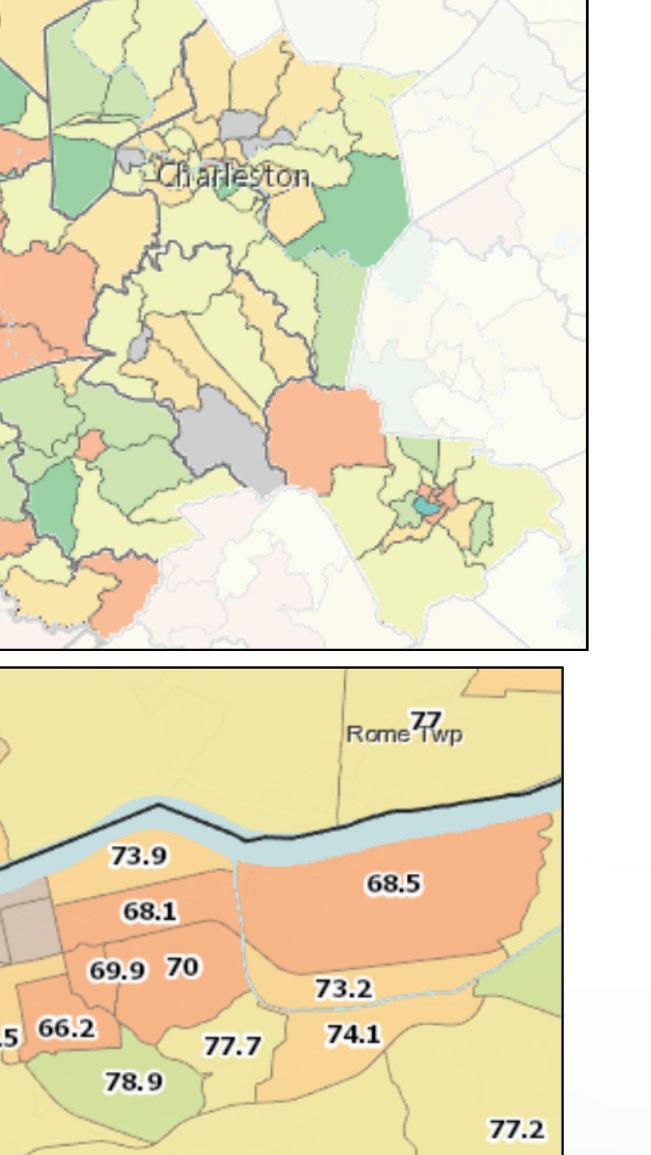
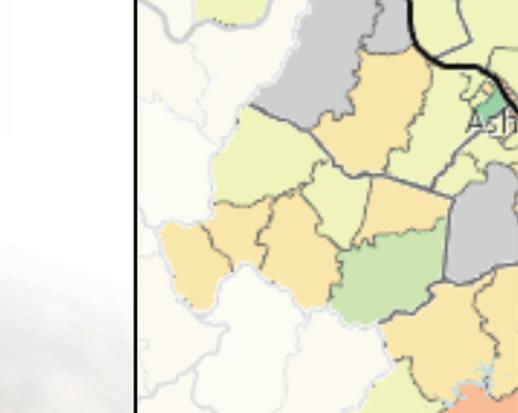
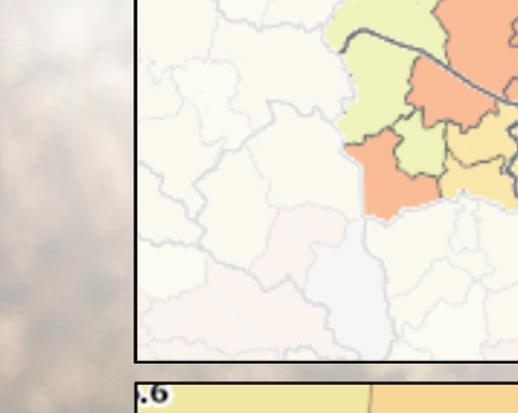
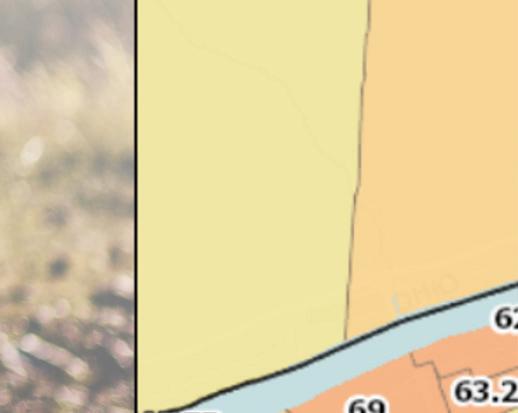
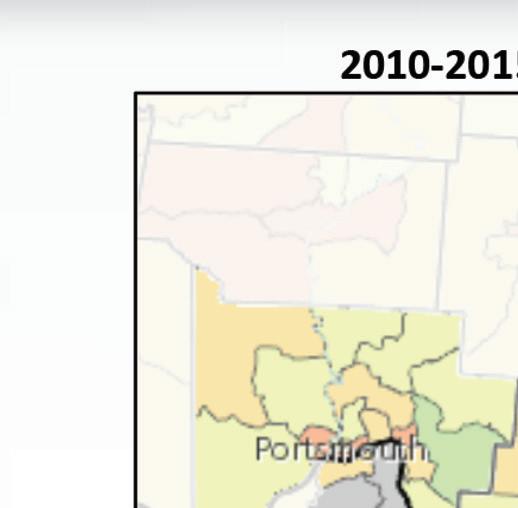
The following map shows average life expectancy at the census tract level. Areas of lower life expectancy largely align with areas of socioeconomic disadvantage. In the census tracts comprising Huntington zip code 25703, life expectancy is as low as 68.1 years compared to a statewide average of 74.8. In the downtown Huntington portion of zip code 25704, life expectancy is as low as 62.3 years.
When life expectancy is viewed at a county level, Cabell County overall has lower life expectancy of 71.3 years. Mingo and Logan counties in West Virginia also experience notable life expectancy disparities. Mingo and Logan counties have the highest poverty and child food insecurity rates in the service area and the lowest average life expectancy of 69.7 years and 70.7 years, respectively.
Life Expectancy At Birth, Years by Tract, CDC and NCHS 2010-15
Mountain Health Network Community Building Activities
Mountain Health Network (MHN) and its member hospitals, Cabell Huntington Hospital and St. Mary’s Medical Center, serve the Tri-State region and its communities by providing advanced medicine and compassionate care. But our commitment to community health doesn’t end there.
MHN actively engages with regional partners to assess, develop, and implement community health improvement initiatives that strengthens connections. Whenever possible we support and/or co-create initiatives with community-based organizations that address social determinants and help foster and build relationships and improve population health, strengthening the resiliency of the community and the reliability of high-quality health care. This section outlines some of the activities supported and initiatives embarked upon over the past three years.


Prevention heart disease, and tobacco use/lung disease.


“Community Benefit” standard set by IRS:
• Not-for-Profit Hospitals should engage in spending that promotes Community Health • Mountain Health Network Community Building Activities Hospitals have a latitude in deciding


Community Building Activities Social Determinants of Health
Mountain Health Network is pleased to support the following agencies that together further our efforts in supporting community health.

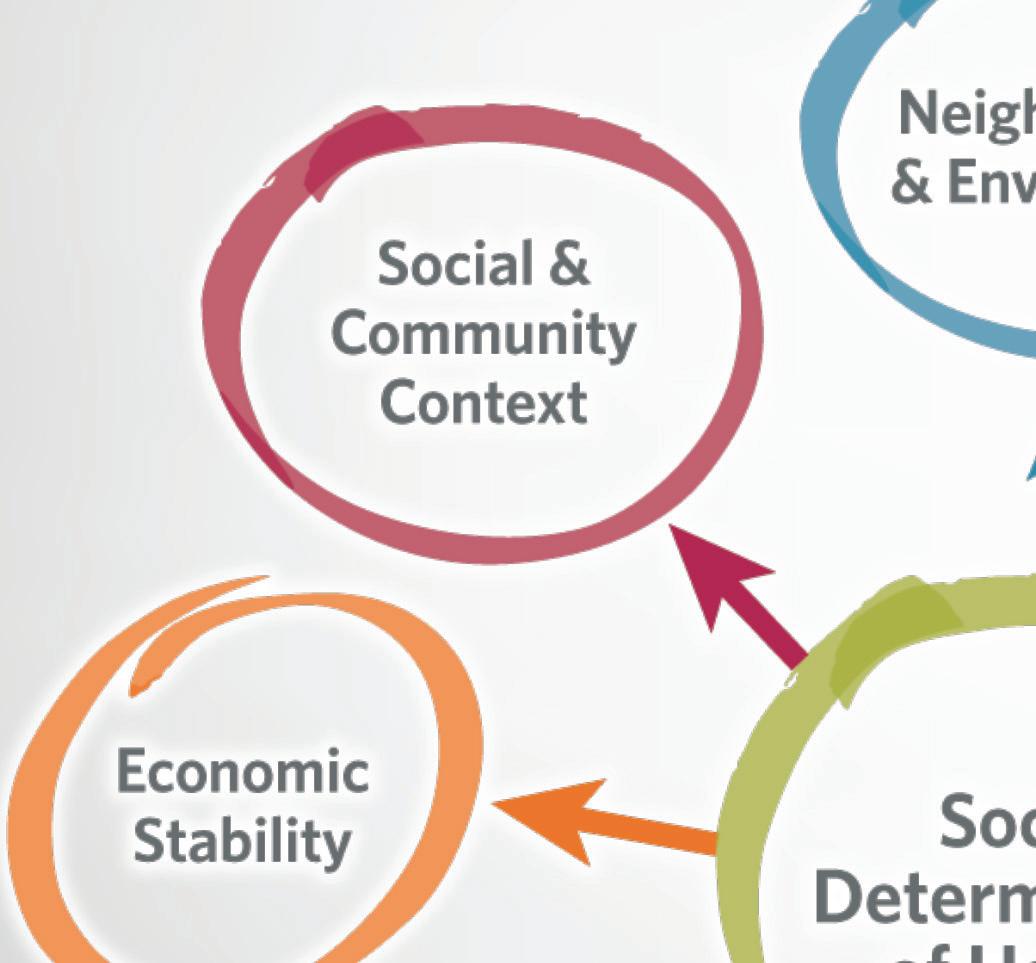


Economic Stability
United Way of the River Cities Alchemy Theatre Troupe Barboursville Fall Fest Barboursville Lion’s Club Barboursville Rotary Huntington Museum of Art Huntington Symphony Orchestra Ironton in Bloom, Inc. Ironton Rotary Club Junior League of Huntington Kiwanis Club of Huntington Lawrence County Chamber of Commerce
Social & Community Context
Keith-Albee Performing Arts Center A.D. Lewis Community Center Carter G. Woodson Memorial Foundation, Inc. MU Foundation WV Minority Health City of Huntington Mayor’s Diversity LGBTQ+ Advisory Committee NAACP of Huntington Annual Freedom Fund National Coal Heritage Tri-State India Association Diwali Celebration Honor Flight of Huntington
Social Community Context Continued
Veterans’ Home WV Gold Star Mothers WV Marine Corps Coordinating Council Little Victories Animal Rescue Paramount Arts Center Scottish Rite Foundation
Neighborhood and Environment
Coalfi eld Development Community Garden facility CONTACT Huntington, Inc. Dress for Succes Girls on the Run Cabell-Huntington Coalition for the Homeless/Harmony House
Food
Huntington City Mission Lunch Program River Cities Ministry Facing Hunger Foodbank Ironton aLive Farmers Market
Health Care
Alzheimer’s Association American Cancer Society American Heart Association Arthritis Foundation Juvenile Diabetes Research Cabell-Wayne Association of the Blind Highlands Foundation Hospice of Huntington Pleasant Valley Hospital Thomas Health Foundation Valley Health/WIC WV Physical Therapy Association Family Medicine Foundation of WV Jose I. Ricard MD Family Medicine & Sports Conference SMMC Spiritual Care and Mission Training for fi rst responders
Youth
Autism of River Cities Big Brothers Big Sisters of the Tri-State Brady Steps Foundation (for spina bifi da) Buckskin Council /Boy Scouts of America Cabell County Fraternal Order of Police Community Autism Resources & Education Systems (CARE) Developmental Therapy Center Greater Huntington Parks Ronald McDonald House Charities Huntington Team for WV Children YMCA of Huntington Young Life West Virginia Futbol Club Youth Soccer Heritage Farm Foundation
Education
Education Alliance Education Summit Boyd County Public Library Cabell County Public Library Ohio University Foundation Our Lady of Fatima Parish School Tri-State STEM+M Early College High School Tri-State Literacy Council/Cabell Co. Library WV Osteopathic School of Medicine WVU Foundation Marshall University
Lifestyle & Behavior
HealthyTristate.org/MU Marathon Huntington Turkey Trot Fruth Pharmacy Annual Scholarship Jeannie’s Wish, Inc. O Such Tri-State Race Planners Lily’s Place Prestera Shepherd’s House Recovery Point Stepping Stones Veterans Memorial Day 5K


