Q1 2024 Market Report
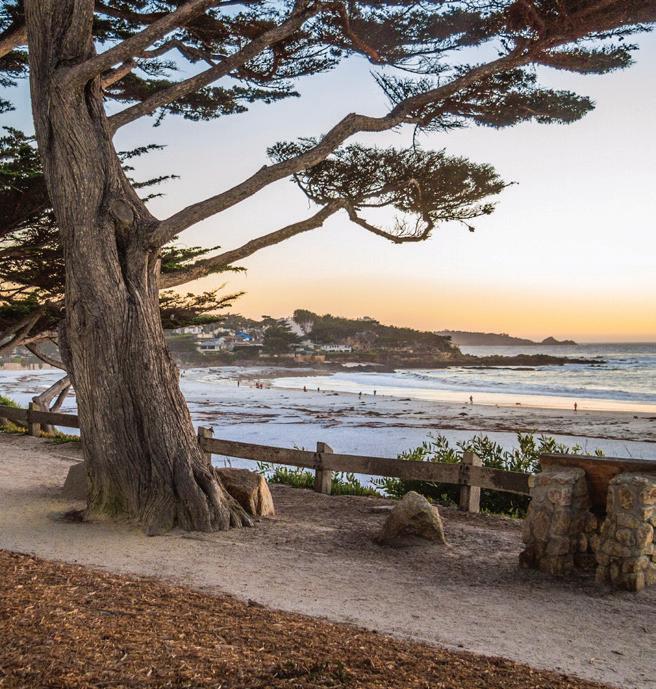
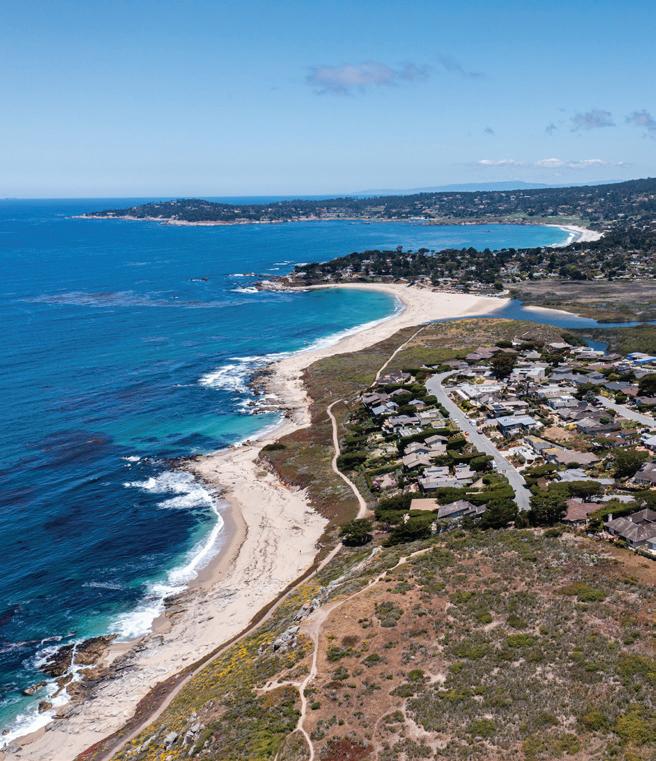
Carmel-by-the-Sea & Carmel Point
• Greater Carmel
• Carmel Valley • Pebble Beach • Carmel Highlands, Big Sur & South Coast
• Monterey & Del Rey Oaks
• Pacific Grove
• Seaside
• Marina & East Garrison
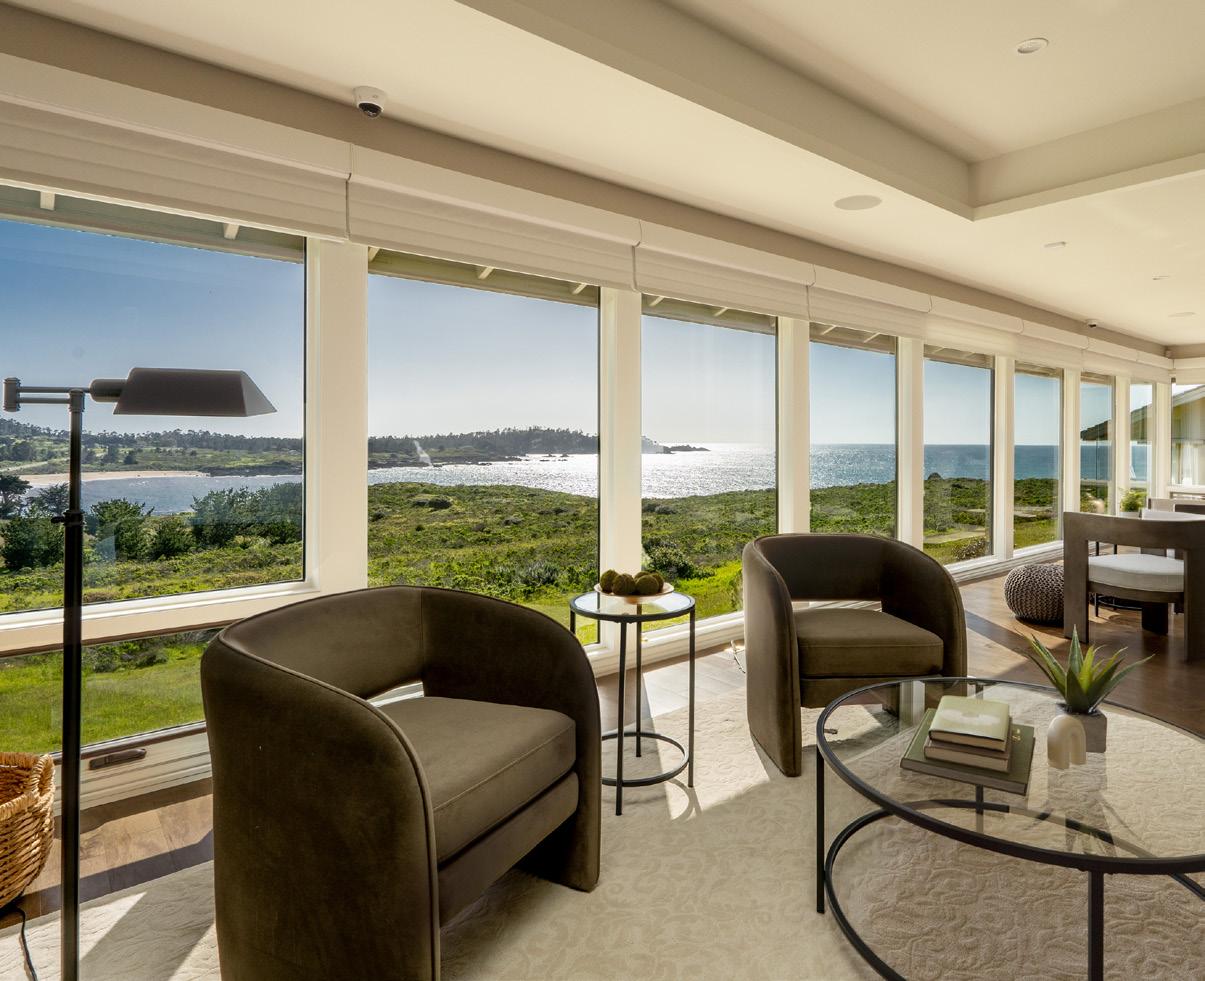
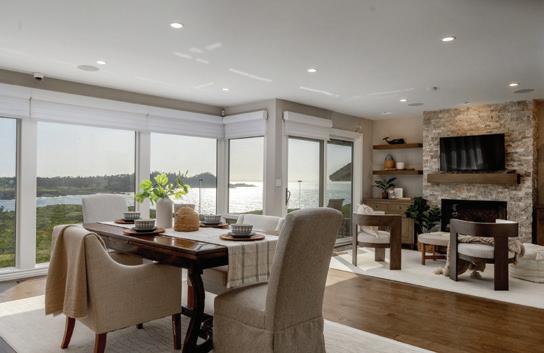


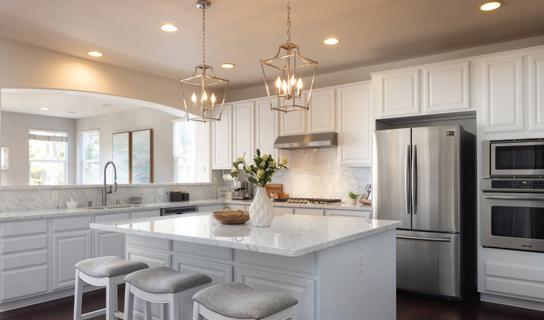


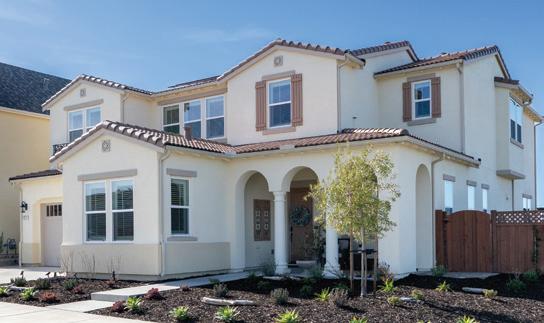
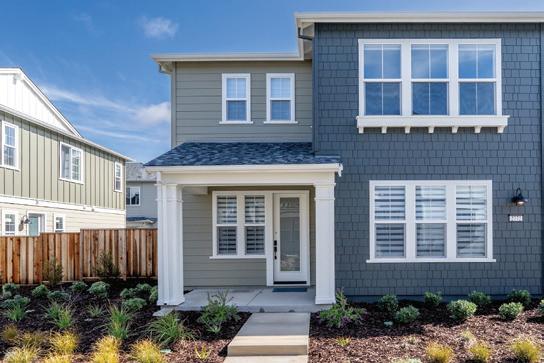
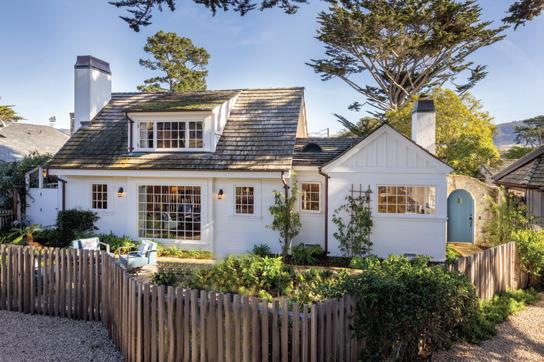
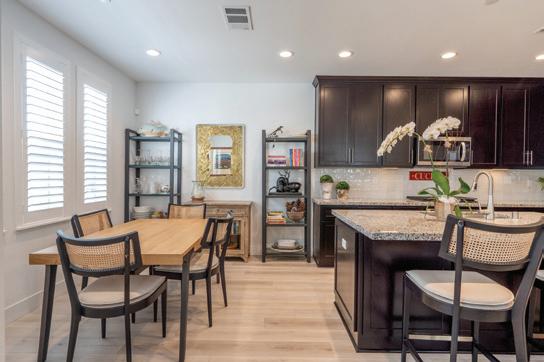
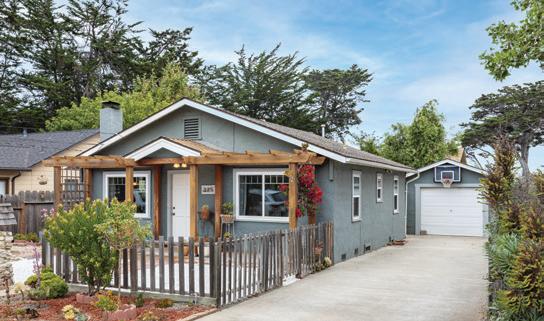
Monterey Coast Realty Our Featured Listings Carmel Meadows Gem with Stunning Views Charming & Elegant Monterey Residence 2932 Cuesta Way • 4 beds, 3.5 baths • $10,475,000 1127 Alta Mesa Road • 3 beds, 3 baths • $3,100,000 Last Remaining Ocean View Lot in Tehama Modern & Private Home in Sea Haven 25540 Via Malpaso • 6.31 acres • $2,750,000 2977 Hayden Way • 5 beds, 4 baths • $1,799,000 Beautifully Updated, Spacious Seaside Home A Sanctuary or Weekend Escape in The Dunes 5030 Peninsula Point Drive • 5 beds, 3 baths • $1,645,000 2772 Telegraph Boulevard • 3 beds, 2.5 baths • $997,000
Get in-depth market updates for key areas across the Monterey Peninsula.
Report Q1 2024 Market Report 02 Market Overview 03 Carmel-by-the-Sea & Carmel Point 05 Greater Carmel 07 Carmel Valley 09 Pebble Beach 11 Carmel Highlands, Big Sur & South Coast 13 Pacific Grove 15 Monterey & Del Rey Oaks 17 Seaside 19 Marina & East Garrison
Q1 2024 Market


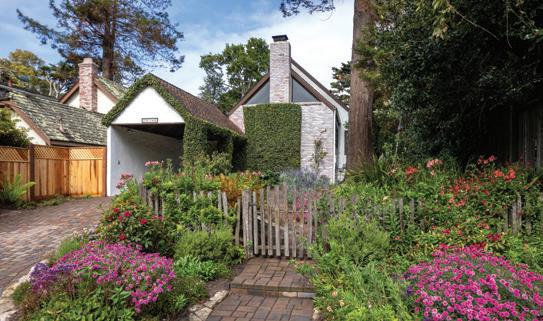
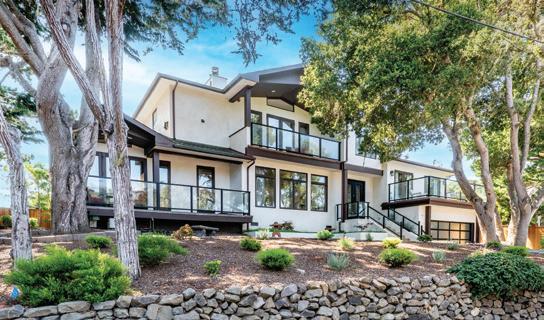
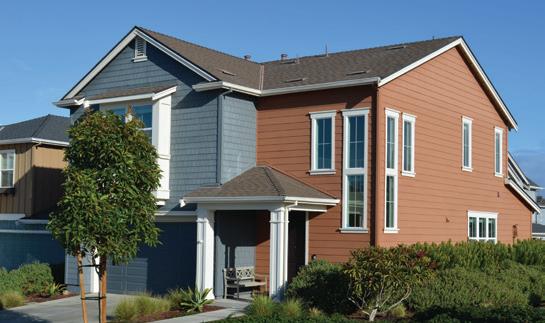


Monterey Coast Realty’s Significant Sales in Q1 2024 Historic Carmel Point Property Beautifully Renovated Carmel Highlands House 26392 Valley View Avenue • LP: $7,400,000 • Rep. Buyer & Seller 9 Sonoma Lane • LP: $2,999,999 • Represented Seller Tranquil Skyline Forest Home in Monterey The Dunes Neighborhood Home in Marina 711 Toyon Drive • LP: $1,299,000 • Represented Seller 2712 Sea Glass Avenue • LP: $1,175,000 • Represented Seller Modern Marina Home in The Dunes Warm & Inviting Monterey Bungalow 2767 Telegraph Boulevard • LP: $989,000 • Represented Seller 325 Hannon Avenue • LP: $895,000 • Represented Seller 01 Q1 2024 Market Report


Q1 2024
Market Overview
Much like the close of 2023, the Monterey Peninsula’s real estate market had a sleepy start to 2024. e typical rainy and windy weather conditions throughout the opening months of the year paired with continued economic pressure on both the entry level and luxury ends of the market led to a slow first two months of the year. e entry level market remained uneasy due to lingering elevated interest rates. e higher end of the market stayed slow over the winter months due to macroeconomic uncertainty, geopolitical concerns, and other distractions that kept most affluent buyers on the sidelines. Luckily, as we moved into March, we felt a surge of activity. After 91 new listings in January and 98 more in February, March saw 152 new listings come to market. is was the highest number of new listings we have seen come on the market in one calendar month since June of 2022.
Looking back, as we have discussed in our recent quarterly updates, the market began its slowdown after its post-pandemic outburst during the second half of 2022. e fourth quarter of 2022 was the first post-pandemic quarter to come short of reaching 300 sales. e market has since failed to reach 300 sales for six consecutive quarters. While just 205 sales closed in Q1 of 2024, like the return of new listings, there was also an increased number of sales in March 2024. After sales numbers of 57 and 60 during January and February, March saw a rise to 88 sales, representing 43% of all sales during the quarter.
As you dive into the specifics of the individual areas across the Peninsula, you will see some consistent trends as well as unique differences in the market between our communities. Sale prices in most areas remain high, with several at or near all-time highs. Conversely, in an area like Pebble Beach, the lack of high-priced sales greatly affected all numbers in the area, as well as the average sale price for the Peninsula as a whole. Pebble Beach saw its lowest number of sales for any threemonth period this century, as well as its lowest average sale price in four years.
Good news exists moving into the Spring season for Pebble Beach, as well as many other areas across the Peninsula. For example, the March surge brought Pebble Beach eleven sales on listings that currently remain in escrow as we move into the second quarter. ese sales alone, if closed in Q2, would double the sales volume seen in the area during Q1.
Overall, demand in our market remains high, and after many buyers decided to sit out during 2023, it seems as if new buyer activity has expanded over the last month and remains strong in April and moving forward this year. Expert local insight alongside quality service can add significant value when demand, product, and pricing is changing rapidly like it is right now. Please reach out to one of our full-time professional agents should you or any of your friends or family be considering a real estate transaction here on the Monterey Peninsula.
We hope you enjoy the following detailed analytic view of our market.
Carmel-by-the-Sea & Carmel Point

$4,661,824
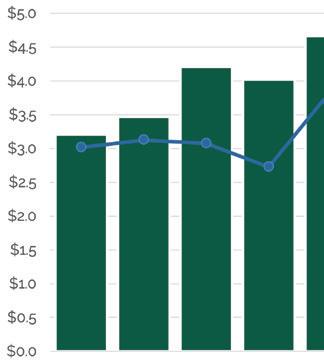
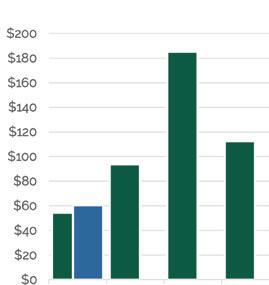
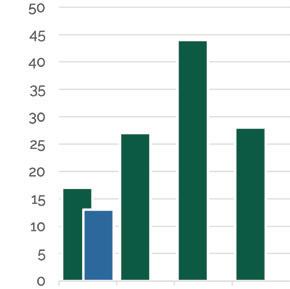
With just 13 sales in the quarter, and three sales over $6M, Carmel-by-the-Sea notched a record high quarterly average sale price, topping $4.66M. e 13 sales in Q1 2024 are the lowest of any quarter dating back to 2000. In fact, over this same period, there has never been any running three-month period with less than 16 sales in the area. After a few years of fast paced sales, the average days to sell of 61 days is right on par with the years 2018-2020. Available inventory sits at just 17 homes on the market to end the quarter, which is down from an average of 55 in the same 20182020 period. Four sales topped $4.95M in Carmel-bythe-Sea in Q1 2024. Monterey Coast Realty and Carmel Realty Company teamed up to double end three of these four high-priced sales during the quarter. Units


$60,603,710

13
Update
Market
Sold
03
Sales Volume
Days on Market
61 Average Selling Price
versus Q4 2023 versus Q4 2023 versus Q4 2023 versus Q4 2023 versus Q1 2023 versus Q1 2023 versus Q1 2023 versus Q1 2023 Q1 2024 Statistics 16% 1.6% 46.2% 53.6% 45.4% 103.3% 11.2% 23.5%
Market Breakdown


Did You Know?
Carmel-by-the-Sea is known for attracting various celebrities and artists. Clint Eastwood served as mayor of the village from 1986-1988. Other notable celebrities, artists and writers who have called Carmel home include Doris Day, John Denver, Ansel Adams and Jack London.
Q1 2024
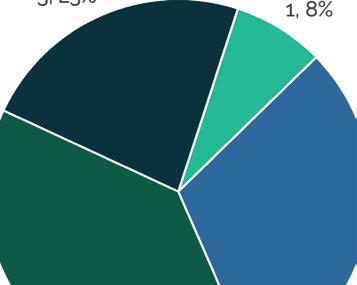
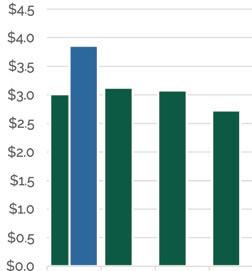
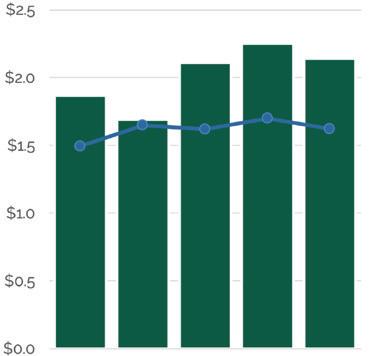
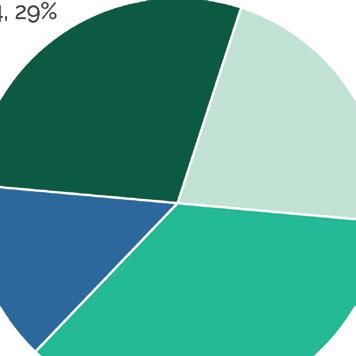
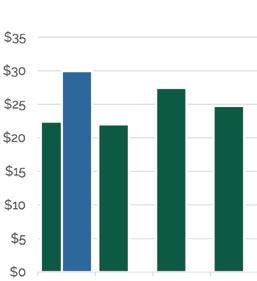
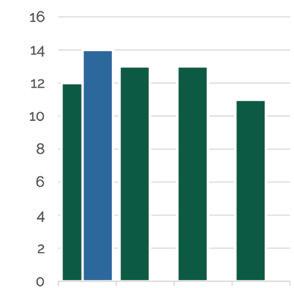
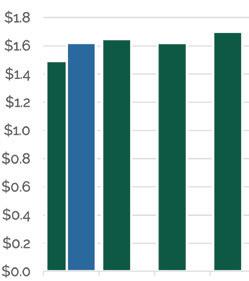
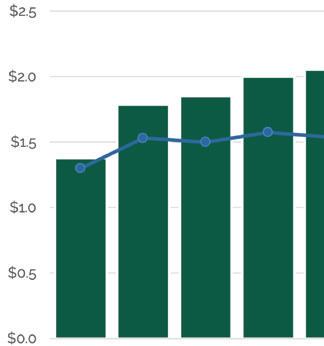
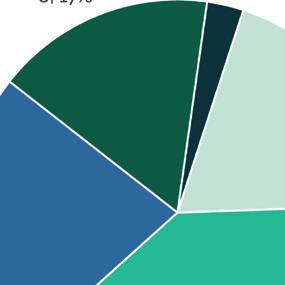
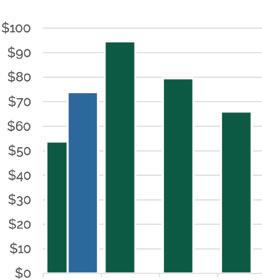
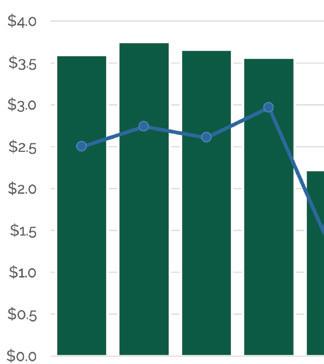
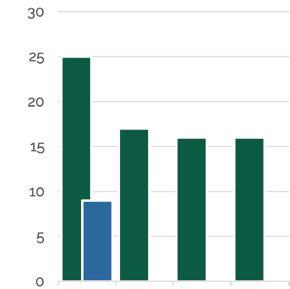
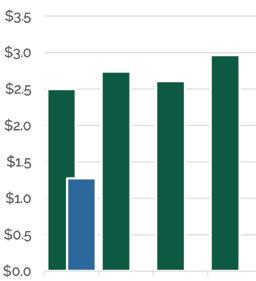
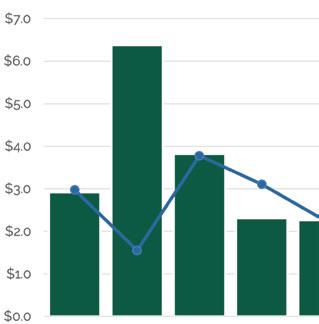
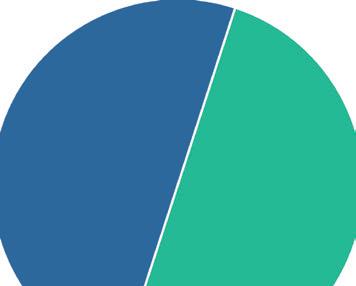
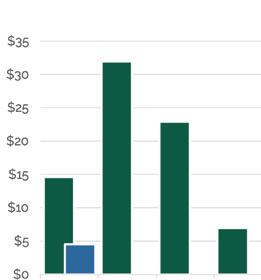
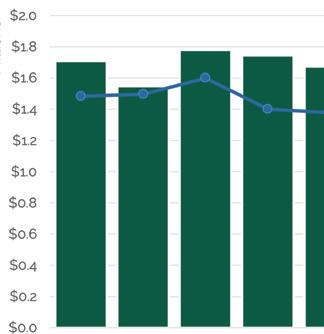
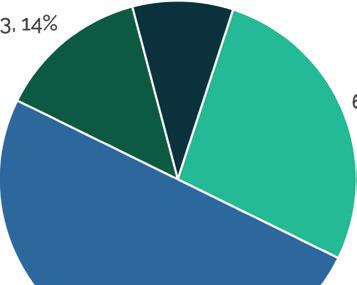
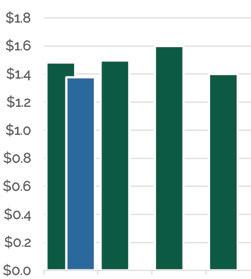
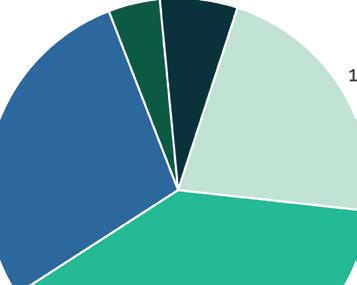
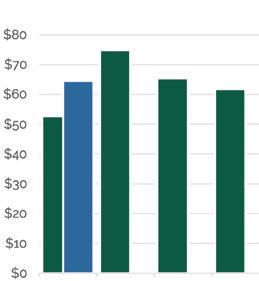
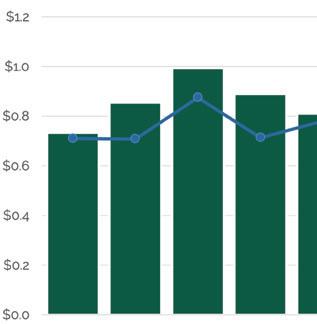
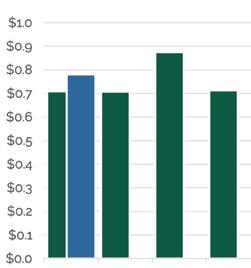
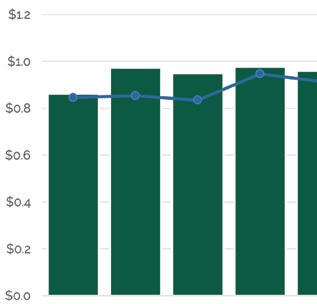
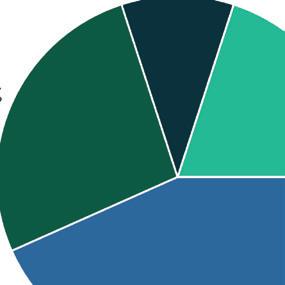
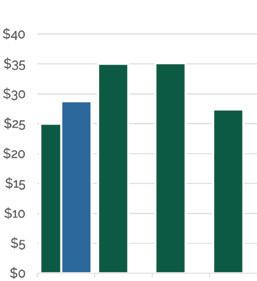
Q1 2024 Market Report < $1m $1m–$2m $2m–$3m $5m+ Q1 2023 Q2 2023 Q3 2023 Q4 2023 Q1 2024 Sales by Segment Closed Sales Volume By Quarter in millions Q1 Q2 Q3 Q4 Number of Closed Sales By Quarter 23% 3 homes 1 home 4 homes 5 homes 8% 31% 38% Q1 Q2 Q3 Q4 Median Average Average vs. Median Sales Price in millions $3m–$5m 2023 2024 2023 2024 2023 2024 Median Sales Price in millions “Monterey County Fun Facts”, Monterey County Convention & Visitors Bureau, 2020 Q1 Q2 Q3 Q4
Greater Carmel
Areas outside of Carmel-by-the-Sea & Carmel Point
e Greater Carmel area’s 14 sales in Q1 2024 were the most in a quarter since Q3 2022. An average sale price topping $2.13M was strong, edging out 2023’s yearly average of $1.97M. Inventory has consistently been low in this area, not having topped 20 homes on the market since 2020, and currently standing at 12 homes on the market. One of the top sales in the quarter was a beautiful $3M home in Carmel Woods, in which a Monterey Coast Realty agent was pleased to bring the buyer.
$2,139,571
$29,954,000
14
Sold
Units
Sales Volume
Days on Market
Average Selling Price
41
Q1 2024 Statistics
Update
Market
05 versus Q4 2023 versus Q1 2023 5% 14.6% versus Q4 2023 versus Q4 2023 versus Q4 2023 versus Q1 2023 versus Q1 2023 versus Q1 2023 18% 20.9% 27.3% 24.1% 33.7% 16.7%
Market Breakdown


Did You Know?
Q1 2024
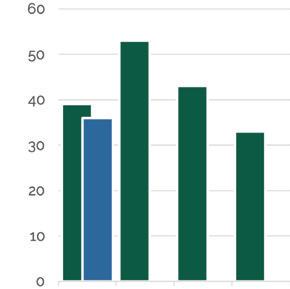
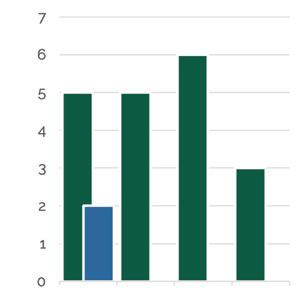
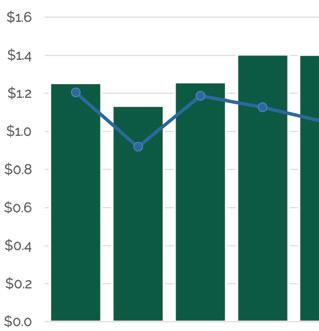
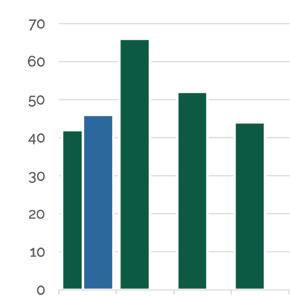
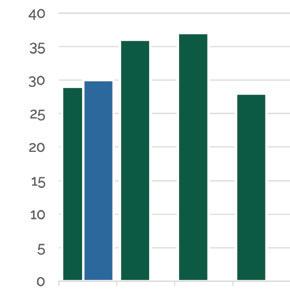
Q1 2024 Market Report < $1m $1m–$2m $2m–$3m $5m+ Q1 2023 Q2 2023 Q3 2023 Q4 2023 Q1 2024 Sales by Segment Closed Sales Volume By Quarter in millions Q1 Q2 Q3 Q4 Number of Closed Sales By Quarter 3 homes 5 homes 2 homes 4 homes 21% 36% 14% 29% Q1 Q2 Q3 Q4 Median Average Average vs. Median Sales Price in millions $3m–$5m 2023 2024 2023 2024 2023 2024 Median Sales Price in millions
County Fun Facts”, Monterey County Convention & Visitors Bureau, 2020 Q1 Q2 Q3 Q4
Robert Louis Stevenson modeled Treasure Island’s Spyglass Hill after Point Lobos State Reserve near Carmel.
“Monterey
Carmel Valley
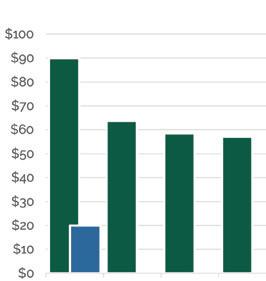
Carmel Valley set a record for average sale price during Q1, coming in at $2.05M. While 36 sales in the quarter was three more than the previous quarter, a healthy number would come closer to 50 sales in the area.
With sale prices being high, total sales volume came in at $73.95M, topping two of the four quarters in 2023. With 51 active listings to begin Q2, there is evidence an uptick in Carmel Valley sales may return as we head into summer.

$2,054,132
$73,948,750
Market Update
07
Sales Volume
Units Sold 36
Days on Market
Average Selling Price
75
Q1 2024 Statistics versus Q4 2023 versus Q4 2023 versus Q4 2023 versus Q4 2023 versus Q1 2023 versus Q1 2023 versus Q1 2023 versus Q1 2023 2.7% 87.5% 12% 9.1% 49% 41.5% 37.6% 7.7%
Market Breakdown


Did You Know?
Monterey County has 349 vineyards, 82 bonded wineries and 65 tasting rooms. The wide range of climates allow Monterey County to grow over 30 different wine grape varietals.
Q1 2024
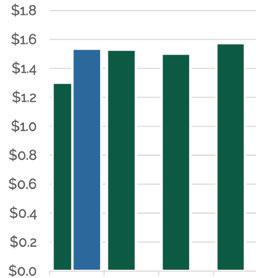
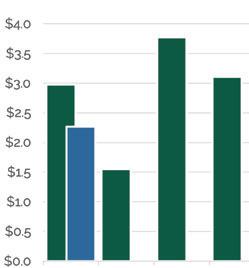
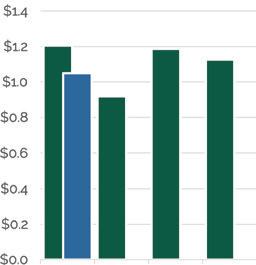
Q1 2024 Market Report < $1m $1m–$2m $2m–$3m $5m+ Q1 2023 Q2 2023 Q3 2023 Q4 2023 Q1 2024 Sales by Segment Closed Sales Volume By Quarter in millions Q1 Q2 Q3 Q4 Number of Closed Sales By Quarter 3% 1 home 7 homes 14 homes 8 homes 6 homes 19% 39% 22% 17% Q1 Q2 Q3 Q4 Median Average Average vs. Median Sales Price in millions $3m–$5m 2023 2024 2023 2024 2023 2024 Median Sales Price in millions
County Fun Facts”, Monterey County Convention & Visitors Bureau, 2020 Q1 Q2 Q3 Q4
“Monterey
Pebble Beach
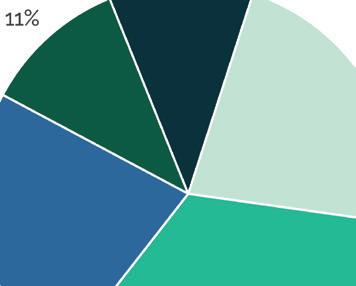
Pebble Beach saw the area’s slowest sales quarter on record with just nine sales over the first three months of the year. In addition, typically an area with 20-30% of sales coming in over $5M in price, Pebble Beach saw just one sale (11%), come in over $5M during Q1 2024. Only one of the other eight closed sales sold for over $3M during the quarter. is brought the quarterly average sale price down to $2.22M, the lowest since Q1 2020. Reasons for optimism do exist in Pebble Beach, as 11 listings are currently in escrow totaling over $38M in list price. If successfully closed in Q2, these 11 listings alone would double Q1’s output. Also, an additional 29 listings remain on the market, which is nearing the most we’ve seen over the past year and a half.
$2,222,132
$19,999,190
Update
Market
09 Units Sold
Sales Volume
9
Days on Market
Average Selling Price
24
Q1 2024 Statistics versus Q4 2023 versus Q4 2023 versus Q4 2023 versus Q4 2023 versus Q1 2023 versus Q1 2023 versus Q1 2023 versus Q1 2023 37.6% 65.7% 64.9% 43.8% 38.2% 29.4% 77.7% 64%
Market Breakdown

Did You Know?
17-Mile Drive through Pebble Beach is one of only nine private toll roads in the country, and the only one west of Mississippi.
Q1 2024
Q1 2024 Market Report < $1m $1m–$2m $2m–$3m $5m+ Q1 2023 Q2 2023 Q3 2023 Q4 2023 Q1 2024 Sales by Segment Closed Sales Volume By Quarter in millions Q1 Q2 Q3 Q4 Number of Closed Sales By Quarter 2 homes 3 homes 2 homes 1 home 1 home 22% 34% 22% 11% 11% Q1 Q2 Q3 Q4 Median Average Average vs. Median Sales Price in millions $3m–$5m 2023 2024 2023 2024 2023 2024 Median Sales Price in millions “Monterey County Fun Facts”, Monterey County Convention & Visitors Bureau, 2020 Q1 Q2 Q3 Q4
Carmel Highlands, Big Sur & South Coast
Just two home sales occurred in Carmel Highlands and Big Sur during Q1 2024. e top sale was 9 Sonoma Lane, listed by a Monterey Coast Realty agent. e area began Q2 with 21 homes on the market, eleven of which are listed over $5M. Five homes are currently in escrow in the area, showing promise for a strong summer.

$2,265,000
$4,530,000
2
Units Sold
Sales Volume
Days on Market 176 Average Selling Price
Q1 2024 Statistics Market Update
11 versus Q4 2023 versus Q4 2023 versus Q4 2023 versus Q4 2023 versus Q1 2023 versus Q1 2023 versus Q1 2023 versus Q1 2023 1.9% 170.8% 34.6% 33.3% 22.4% 64.5% 69% 60%
Market Breakdown


Did You Know?
Local settings from around the Monterey Peninsula have provided the backdrops for more than 180 films and television shows. You’ll recognize many scenes in HBO’s award winning mini-series Big Little Lies in Big Sur and the Carmel Highlands.
Q1 2024
Q1 2024 Market Report < $1m $1m–$2m $2m–$3m $5m+ Q1 2023 Q2 2023 Q3 2023 Q4 2023 Q1 2024
by Segment Closed Sales Volume By Quarter in millions Q1 Q2 Q3 Q4 Number of Closed Sales By Quarter 1 home 50% 1 home 50% Q1 Q2 Q3 Q4 Median Average Average vs. Median Sales Price in millions $3m–$5m 2023 2024 2023 2024 2023 2024 Median Sales Price in millions “Monterey County Fun Facts”, Monterey County Convention & Visitors Bureau, 2020 Q1 Q2 Q3 Q4
Sales
Pacific Grove
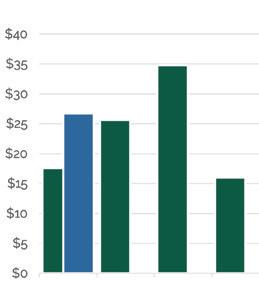
January and February in Pacific Grove were quiet months with just 10 total home sales. March picked up substantially, seeing 12 sales during the month. Still, 22 sales for the quarter were the lowest Pacific Grove has seen since 2009. Average sale price in Q1 came in at $1.67M, just a percentage point below the 2023 yearly average of $1.69M. ere are 30 active listings in Pacific Grove to end the quarter, which is great news as the average days to sell in the area have stayed relatively low at just 45 days.
$1,673,045
$36,807,000
22
Sold
Units
Sales Volume
Days on Market
Average Selling Price
45
Q1 2024 Statistics Market Update
13
versus
versus
versus Q1
versus
versus Q1
4.1% 45.2% 41.4% 38.9% 2.1% 16.7% 28.2% 26.7%
versus Q4 2023
Q4 2023
Q4 2023 versus Q4 2023 versus Q1 2023
2023
Q1 2023
2023


Q1 2024 Market Report < $800k $800k-1.2m $1.2m-2m $2m-3m $3m+ Q1 2023 Q2 2023 Q3 2023 Q4 2023 Q1 2024 Sales by Segment Closed Sales Volume By Quarter in millions Q1 Q2 Q3 Q4 Number of Closed Sales By Quarter 6 homes 11 homes 3 homes 2 homes 27% 50% 14% 9% Q1 Q2 Q3 Q4 Median Average Average vs. Median Sales Price in millions 2023 2024 2023 2024 2023 2024 Median Sales Price in millions “Monterey County Fun Facts”, Monterey County Convention & Visitors Bureau, 2020 Q1 Q2 Q3 Q4
Q1 2024 Market Breakdown Did You Know? Point Pinos Lighthouse in Pacific Grove is the oldest continually operating lighthouse on the West Coast
Monterey & Del Rey Oaks
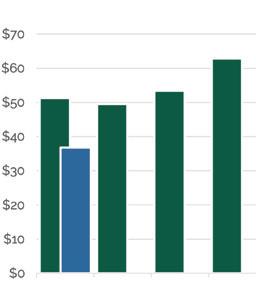
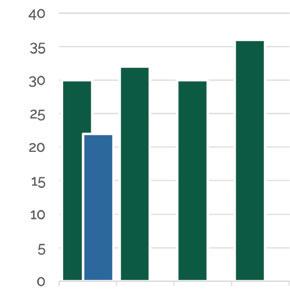
Monterey had a nearly identical Q1 2024 as it had the previous quarter, Q4 2023. e number of sales gently rose from 44 to 46, while average sale price stood still near the record high, $1.40M. Even the average days to sell were similar at 34 days versus the previous quarter’s 33 days. While consistent, Monterey is looking for better times ahead as typical quarters between 2015-2020 display 75-80 sales per quarter. e Monterra area brought the top three sales in Monterey during the quarter, each topping $4.95M.
$1,403,134
$64,544,178
Units Sold
Sales Volume
46
Days on Market 34 Average Selling Price
Q1 2024 Statistics Market Update
15 versus Q4
versus Q4
versus Q4 2023 versus Q4 2023 versus Q1
versus Q1
versus Q1 2023 versus Q1 2023 4.5% 4.4% 3% 0.2% 9.5% 22.5% 41.7% 11.9%
2023
2023
2023
2023
Market Breakdown


Did You Know?
Nearly a quarter million tons of sardines were processed on Cannery Row in 1945, the year John Steinbeck’s Cannery Row was published. Cannery Row was previously named Ocean View Avenue but was renamed to honor John Steinbeck’s well-known novel.
Q1 2024
Q1 2024 Market Report < $800k $800k-1.2m $1.2m-$2m $3m+ Q1 2023 Q2 2023 Q3 2023 Q4 2023 Q1 2024 Closed Sales Volume By Quarter in millions Q1 Q2 Q3 Q4 Number of Closed Sales By Quarter 10 homes 3 homes 18 homes 13 homes 2 homes 22% 7% 39% 28% 4% Q1 Q2 Q3 Q4 Median Average Average vs. Median Sales Price in millions $2m–$3m 2023 2024 2023 2024 2023 2024 Median Sales Price in millions “Monterey County Fun Facts”, Monterey County Convention & Visitors Bureau, 2020 Q1 Q2 Q3 Q4
Seaside
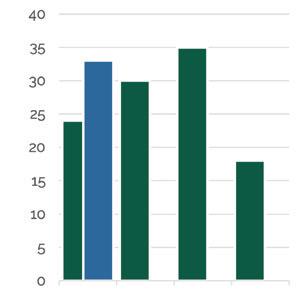
Seaside had a large bounce back in number of sales in Q1 2024 after an extremely difficult end to 2024. Total sales came in at 33 for the quarter after just 18 in a record low Q4 2023. e average sale price did take a 9% dip from the previous two quarters. is is primarily due to the lack of high-priced sales in the area as median sale price rose quarter over quarter. After several homes sold in Seaside Highlands and the newly developed e Enclave at Cypress Grove over the past six months, just one home sold on the market in Seaside Highlands during Q1. Inventory is extremely low in this area, contributing to the smaller number of sales versus previous years. Just 14 homes remain on the market moving into Q2, while typical inventory levels range from the mid20s to mid-30s in this area.
$809,709
$26,720,400 Days
Units Sold
Volume
33 Sales
on Market
Selling Price
30 Average
Q1 2024 Statistics Market Update
17 versus Q4 2023 versus Q4 2023 versus Q4 2023 versus Q4 2023 versus Q1 2023 versus Q1 2023 versus Q1 2023 versus Q1 2023 83.3% 66.8% 23.1% 9% 37.5% 51.9% 6.3% 10.5%
Market Breakdown


Did You Know?
In 1910, as Monterey County Supervisor, Jon Roberts successfully lobbied President Theodore Roosevelt to locate the U.S. Army Base Fort Ord in Seaside. As many as 1.5 million American troops trained at Fort Ord between 1917-1994.
Q1 2024
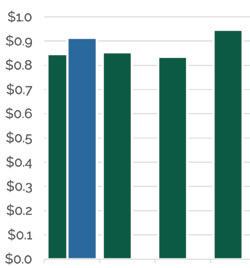
Q1 2024 Market Report < $400k $400k-600k $600k-800k $800k-1m $1m+ Q1 2023 Q2 2023 Q3 2023 Q4 2023 Q1 2024 Closed Sales Volume By Quarter in millions Q1 Q2 Q3 Q4 Number of Closed Sales By Quarter 4 homes 13 homes 13 homes 3 homes 13% 39% 39% 9% Q1 Q2 Q3 Q4 Median Average Average vs. Median Sales Price in millions 2023 2024 2023 2024 2023 2024 Median Sales Price in millions U.S. Department of the Interior - Official Website Q1 Q2 Q3 Q4
Marina & East Garrison
Marina and East Garrison saw its average sale price ($960K) remain consistent and high. is number was just 1.7% below that of the previous quarter, but up over 11% from Q1 2023. Median sale price during Q1 ($914K) stayed above $900K for the second straight quarter, hinting that elevated prices are likely here to stay. With a healthy inventory of 30 listings on the market, home sales have slowed in this area. After 28 sales last quarter, a four-year low, this quarter saw a small rise to 30 sales. Average days to sell during Q1 2024 came in at 59 days, well above the fast pace of sales over the last four years, but also higher than pre-pandemic years.
$960,325
59
$28,809,764
30
Units Sold
Sales Volume
Days on Market
Price
Average Selling
Q1 2024 Statistics Market Update
19 versus Q4 2023 versus Q4 2023 versus Q4 2023 versus Q4 2023 versus Q1 2023 versus Q1 2023 versus Q1 2023 versus Q1 2023 1.7% 20.4% 5.3% 7.1% 11.3% 3.3% 15.1% 3.4%
Market Breakdown


Did You Know?
Monterey Bay Football Club was founded on February 1, 2021 and played its inaugural season in the USL Championship in 2022. The club plays at Cardinale Stadium, a 6,000-seat soccer-specific venue located on the campus of California State University, Monterey Bay.
Q1 2024
Q1 2024 Market Report < $600k $600k-800k $800k-1m Q1 2023 Q2 2023 Q3 2023 Q4 2023 Q1 2024 Closed Sales Volume By Quarter in millions Q1 Q2 Q3 Q4 Number of Closed Sales By Quarter 6 homes 13 homes 8 homes 3 homes 20% 43% 27% 10% Q1 Q2 Q3 Q4 Median Average Average vs. Median Sales Price in millions $1m–$1.2m $1.2m-2m 2023 2024 2023 2024 2023 2024 Median Sales Price in millions MontereyBayFC.com Q1 Q2 Q3 Q4

Scan the Code to Learn More About Our Agents & Team Members MontereyCoastRealty.com • 831.624.2300 • DRE #01871677 The quality of life on the Monterey Peninsula is unmatched. Let us help make it your reality. Monterey Coast Realty represents buyers and sellers of quality properties from cozy cottages to magnificent estates throughout the Monterey Peninsula all the way east to Salinas Valley, through Carmel Valley and south to Big Sur. Locally Owned. Globally Connected. Representing Buyers & Sellers of Quality Properties Across the Monterey Peninsula
