Carmel-by-the-Sea & Carmel Point • Greater Carmel • Carmel Valley • Pebble Beach • Carmel Highlands, Big Sur & South Coast • Monterey & Del Rey Oaks • Pacific Grove • Seaside • Marina & East Garrison
1127 Alta Mesa Road • LP: $3,100,000 • Represented Seller
Tranquil Estate in Las Palmas
19831 Spring Ridge Terrace • LP: $2,699,000 • Represented Seller
Charming Carmel Cottage in the Golden Rectangle
Carmelo 5 SE of 12th Avenue • LP: $3,100,000 • Represented Seller
Beautiful Home with Views in Carmel Highlands
9 Sonoma Lane • LP: $2,999,999 • Represented Seller
2024
Market Overview
It was a great holiday season on the Monterey Peninsula with locals, second homeowners, and visitors enjoying the beautiful landscapes, inspiring outdoor activities, and bustling restaurants and shops our area has to offer. Beginning in the summer and extending into anksgiving, Christmas and New Years, town was busy, vibrant and festive, an indicator that the Monterey Peninsula community is very healthy alongside a healthy real estate market.
e Monterey Peninsula real estate market experienced a strong and resilient performance in 2024, demonstrating overall health despite a notable slowdown at key price points of the business. roughout the year, and certainly closer to the Q4 presidential election, the market experienced a slowing of both inventory and demand. Our company heard from several prospective buyers that they had decided to wait until after the election before making a real estate decision. is clearly had an impact on the number of sales to end the year, but even with this influence, the overall market saw an 8.4% increase in home sales year over year and a small increase in average sales price, leading to a 9.7% rise in total sales dollar volume in 2024 over 2023.
e overall performance of pricing was strong in eight of the nine markets we track. While five areas saw prices go up, only Pebble Beach saw a greater than 2% decline in average sales price, with that decrease coming in at -11.6% year over year. is was much in part to a smaller than average percentage of high-priced sales in the area. While our company set another record by selling the highest priced home in Pebble Beach history this year, a $45M estate on the 18th fairway of Pebble Beach Golf Links, 2024 was still slower than usual at the very high-end ($10M+) of the market. We expect this market to perform much stronger in 2025 as early-stage interest seems to be picking up after the presidential election.
Both Q4 and Q3 saw exactly 283 home sales. Over the course of 2024 there were 1,081 homes sold across the nine markets we track. One of the reasons for the 8.4% increase in sales was expanded inventory, rising to the most homes we have seen on the market since mid-2020. Inventory levels increased from 232 at the end of 2023 (peaking at 411 actives during August) to 279 at the end of 2024. at is an increase of 20.3% in homes available for sale. is influx of inventory combined with continued strong demand positions us to have a very strong market in 2025.
Each of the nine markets we serve experience a constant balancing act between supply, demand and pricing. is makes it essential to have experienced, local, expert representation when buying or selling a home. Our seasoned, informed and connected agents can make a significant difference in the value of your purchase or sale and can also contribute greatly to you finding the right home that will allow you to truly enjoy the lifestyle this community has to offer. Please reach out to one of our full-time professional agents should you and any of your friends or family be considering a real estate transaction here on the Monterey Peninsula.
We hope you enjoy the following detailed analytic view of our market. We wish you and your family a happy and healthy New Year.
Carmel-by-the-Sea & Carmel Point
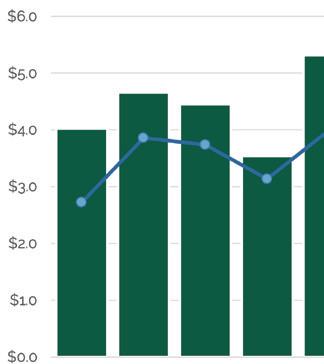
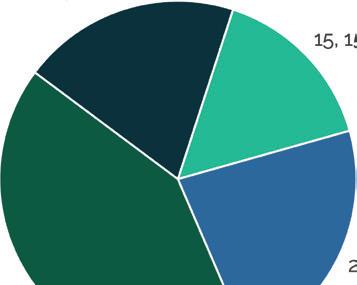
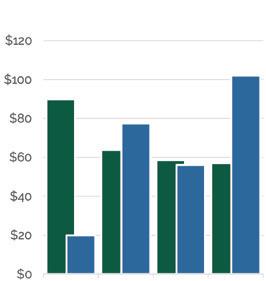
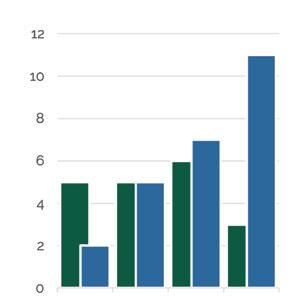
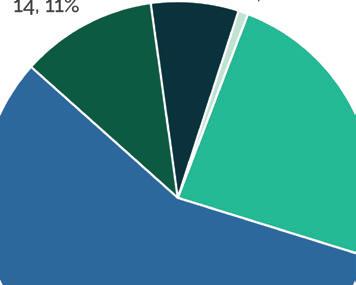
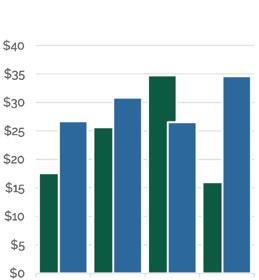
e fourth quarter in Carmel-by-the-Sea saw a low number of home sales with a high average sales price. Just 19 sales occurred during the quarter, down from 32 last quarter, and down from 28 in Q4 of 2023. Average sales price ($5.32M) and median sales price ($3.99M) both set all-time highs in the area during the quarter. ese prices were boosted by two $18M sales along the coast. Carmel Realty Company, Monterey Coast Realty’s sister brokerage, was proud to represent the seller on one of these high-priced sales. Even with the low number of home sales, the total sales volume topped $100M for the quarter. Sales volume for the year was down 6.4% from 2023, but up 1.4% from 2022. While most areas saw a large pullback in the number of listings remaining at the end of the year, Carmel-by-theSea finished the quarter with 31 actives, the same number as three months earlier.
$4,347,314 versus 2023 versus 2023 versus 2023 versus 2023 13.1% 14.0% 6.4% 17.2%
2024 Quarterly Market Breakdown
Did You Know?
Carmel-by-the-Sea is known for attracting various celebrities and artists. Clint Eastwood served as mayor of the village from 1986-1988. Other notable celebrities, artists and writers who have called Carmel home include Doris Day, John Denver, Ansel Adams and Jack London.
Greater Carmel
Areas outside of Carmel-by-the-Sea & Carmel Point
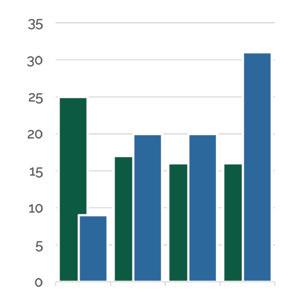
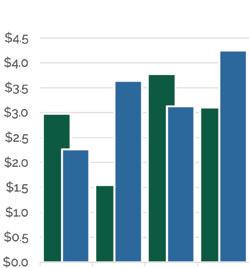
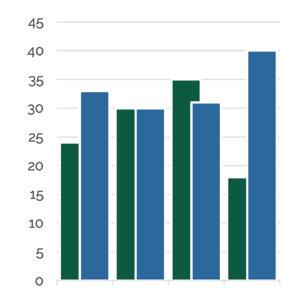
After a dip in the average sales price during Q3, the Greater Carmel region saw the average price come back to $2.22M for Q4. is was similar to the area’s full-year average sales price of $2.15M during 2024. irteen sales during the quarter were similar in number to what the market has seen in previous fourth quarters. e average days on market during Q4 came down to just 31 days after sitting in the forties for each of the previous three quarters, showing high demand in this area. e total sales volume of $128.8M for the year came in 33.2% above 2023’s total. Monterey Coast Realty and Carmel Realty Company collaborated to double end the third highest priced sale in the area during Q4.
$2,145,697 versus 2023
40
60 Sales Volume
$128,741,800
8.7% versus 2023 versus 2023 versus 2023 33.2% 22.4% 16.7%
2024 Quarterly Market Breakdown
Did You Know?
Robert Louis Stevenson modeled Treasure Island’s Spyglass Hill after Point Lobos State Reserve near Carmel.
“Monterey County Fun Facts”, Monterey County Convention & Visitors Bureau, 2020
Carmel Valley
Including the Santa Lucia Preserve
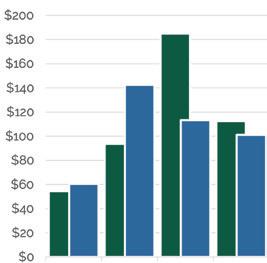
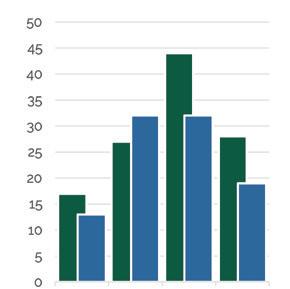
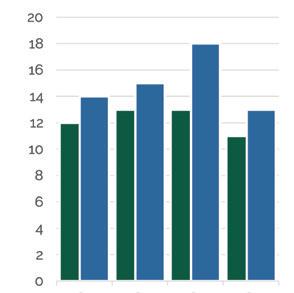
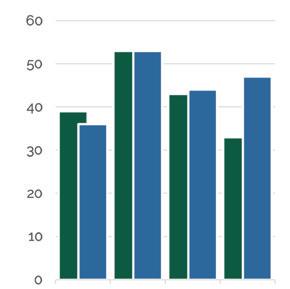
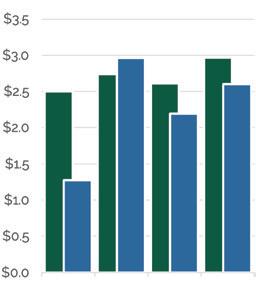
Carmel Valley wrapped up 2024 on a high note, with 47 sales during the quarter, beating Q3’s tally of 44 sales. e average sales price ($2.09M) came in right at the yearly average ($2.08M) in the area. e median sales price came in below average at $1.34M, due in part to 28% of sales during the quarter coming in under $1M. Carmel Valley was one of only two areas across the peninsula in which the 2024 total sales volume ($374.8M) rose above both 2023 and 2022’s number. e number of active listings dropped from 82 down to 54 to end the year. Monterey Coast and Carmel Realty had nine different agents represent sellers and buyers in Carmel Valley during Q4.
$2,082,088
$374,775,803
180
2024 Quarterly Market Breakdown
Did You Know?
Monterey County has 349 vineyards, 82 bonded wineries and 65 tasting rooms. The wide range of climates allow Monterey County to grow over 30 different wine grape varietals.
“Monterey County Fun Facts”, Monterey County Convention & Visitors Bureau, 2020
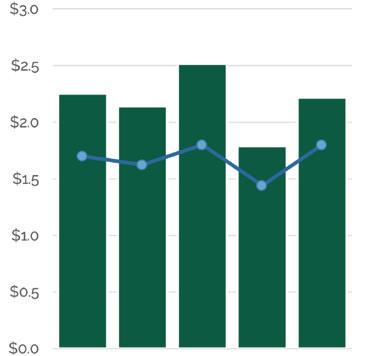
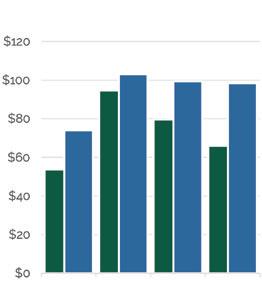
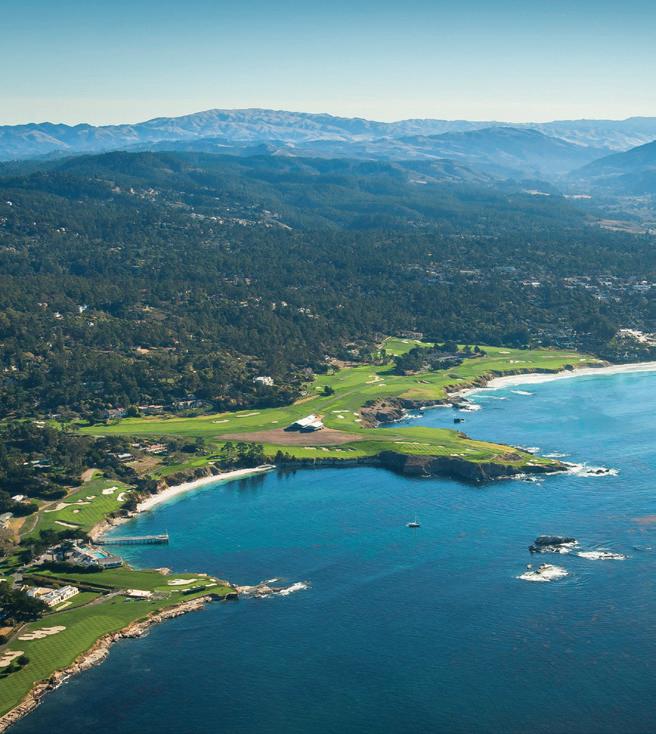
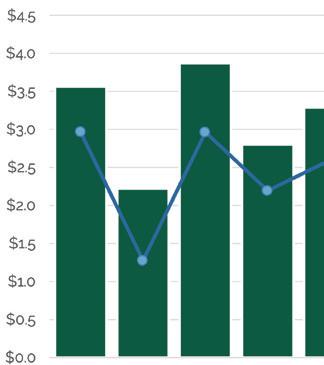
Pebble Beach
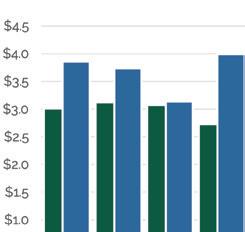
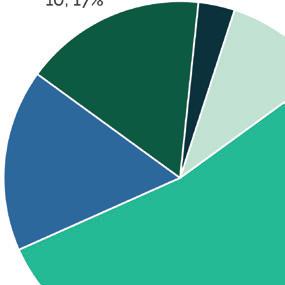
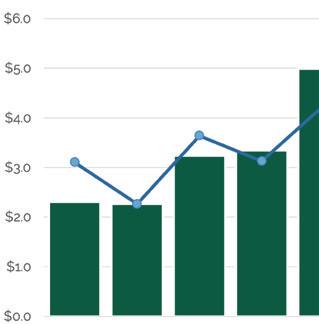
Pebble Beach ended a tough year on a positive note, as the area saw 31 sales close escrow during Q4 2024, the most since Q4 of 2021! Total sales volume topped $100M during Q4, for the first time in a quarter since Q4 of 2022. e average sales price in the area during Q4 was $3.29M, and the average sales price for the full year came in at $3.19M, the lowest yearly average since 2019. is was in large part due to just thirteen sales over $5M occurring in Pebble Beach during 2024. ese high-priced sales made up 16% of all sales in the area. Last year, $5M+ sales made up 20% of total sales and 2022 saw 36% of sales in the area over $5M. e average days on market jumped up to 79 days during Q4, thanks to eight homes that were sitting for over 100 days selling during the quarter. Carmel Realty Company represented the seller on the highest priced sale (and only sale over $10M) of the quarter and represented the buyer on the second highest priced sale during the quarter.
2024 Quarterly Market Breakdown
Did You Know?
17-Mile Drive through Pebble Beach is one of only nine private toll roads in the country, and the only one west of the Mississippi.
Carmel Highlands, Big Sur & South Coast
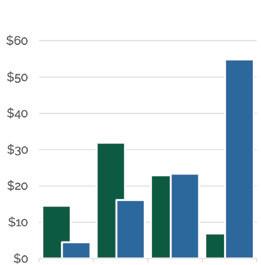
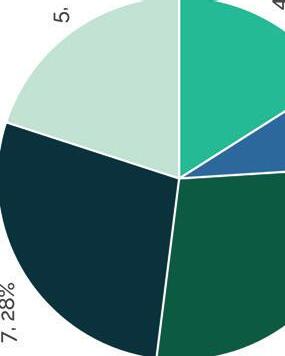
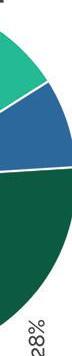
Eleven sales in the area during Q4 were the most since Q1 of 2022. e Carmel Highlands area saw six sales during the quarter, ranging between $2.39M and $7.37M. Carmel Realty Company was proud to represent the buyer for one of these Carmel Highlands homes. Two other big sales of $7.62M and $18.0M occurred further down the Big Sur coast on Highway 1. e fourth quarter’s total sales volume number of $54.8M accounted for over half the year’s total of $98.9M. 28 active listings remain heading into 2025; a healthy number moving into the new year.
Units Sold
25 Sales Volume $98,936,876
31.6%
Average Days on Market 78 Average Selling Price $3,957,475 versus 2023 versus 2023 versus 2023 versus 2023 1.5% 1.3% 29.6%
2024 Quarterly Market Breakdown
Did You Know?
Local settings from around the Monterey Peninsula have provided the backdrops for more than 180 films and television shows. You’ll recognize many scenes in HBO’s award winning mini-series Big Little Lies in Big Sur and the Carmel Highlands.
Pacific Grove
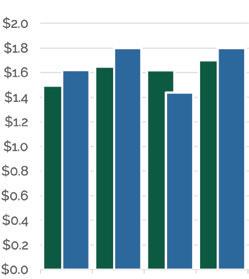
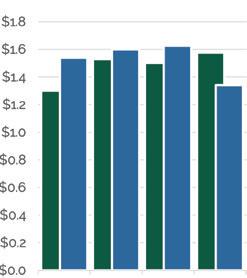
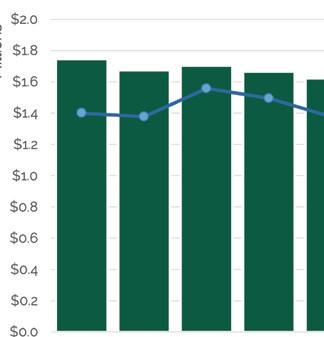
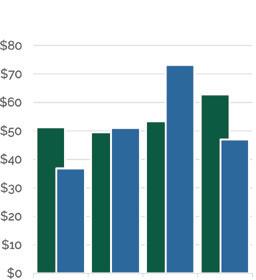
After an outstanding Q3, Q4 fell back to the below average performance the Pacific Grove market has experienced during 2024. e quarterly average sales price saw its lowest mark of the year at $1.62M, bringing the yearly average to $1.67M. Just 29 sales for the quarter marked the second lowest total of the last four years, beating only Q1 of 2024’s sales number of 22. Pacific Grove’s 2024 sales volume came in at $208.2M, which was the lowest since 2019.
Days on Market 43
26.5%
Volume $208,159,455
Selling Price $1,665,276 versus 2023 versus 2023 versus 2023 versus 2023 1.8% 4.1% 2.3%
125
2024 Quarterly Market Breakdown
Did You Know?
Point Pinos Lighthouse in Pacific Grove is the oldest continually operating lighthouse on the West Coast.
“Monterey County Fun Facts”, Monterey County Convention & Visitors Bureau, 2020
Monterey & Del Rey Oaks
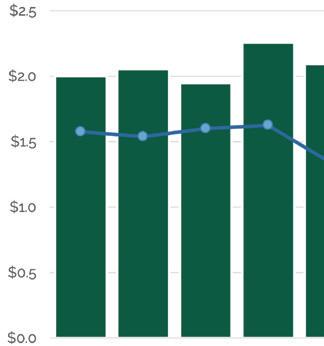
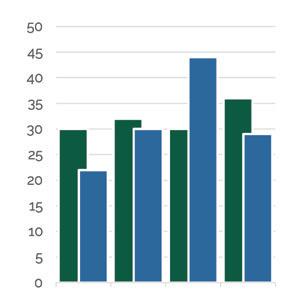
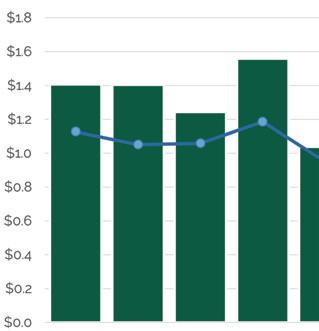
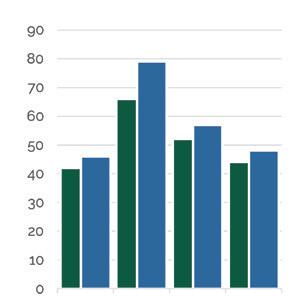
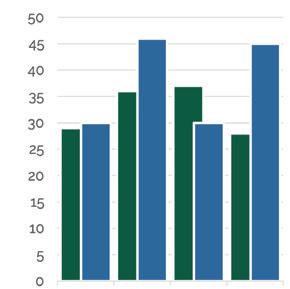
Monterey felt the end of year slowdown during Q4 with just 48 sales, after seeing 57 and 79 over the previous two quarters. e average sales price during Q4 fell from its record high of $1.56M during Q3 to a three-year low of $1.04M, thanks in part to 27 out of 48 sales coming in below $1M. Saddle Road in the Bay Ridge neighborhood brought all three of the sales over $2M in Monterey during Q4. 2024 beat 2023 in number of sales in each individual quarter, ending with 26 more sales for the year. e average sales price increased year over year, up 4.9% to $1.31M. e total sales volume for the year was also up 18.3% to $301.5M.
12.7% 18.3% 31.0% 4.9%
230
$1,310,667 versus 2023 versus 2023 versus 2023 versus 2023
$301,453,393
2024 Quarterly Market Breakdown
Did You Know?
Nearly a quarter million tons of sardines were processed on Cannery Row in 1945, the year John Steinbeck’s Cannery Row was published. Cannery Row was previously named Ocean View Avenue but was renamed to honor John Steinbeck’s well-known novel.
Seaside
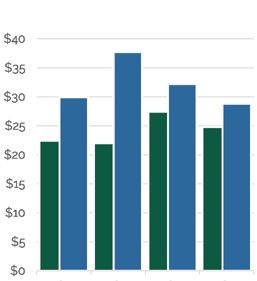
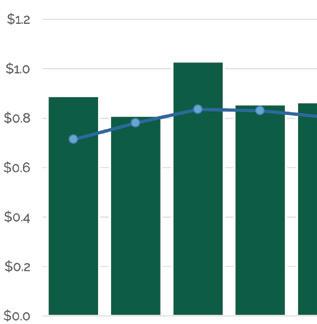
Seaside saw its best quarter of the year in terms of sales (40) and sales volume ($34.6M). e 40 sales were the most of any quarter since Q3 2022. e average days on market (52 days) during Q4 doubled from Q3’s 25 days. e area’s spike of inventory, up to 44 actives during Q3, came down to 27 to end the year. Two of the nine sales over $1M during Q4 took place in the Seaside Highlands, with the others scattered throughout the area. Seaside set a new high in average sales price for a calendar year in 2024, topping $885K.
$118,697,669 Average Days on Market 34 Average Selling Price
$885,804 versus 2023 versus 2023 versus 2023 versus 2023
134 Sales Volume
25.2% 26.2% 0.8% 5.6%
2024 Quarterly Market Breakdown
Did You Know?
In 1910, as Monterey County Supervisor, Jon Roberts successfully lobbied President Theodore Roosevelt to locate the U.S. Army Base Fort Ord in Seaside. As many as 1.5 million American troops trained at Fort Ord between 1917-1994.
Marina & East Garrison
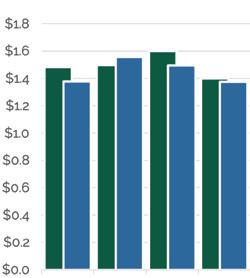
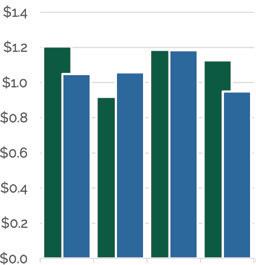
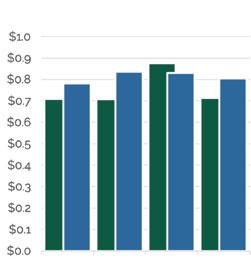
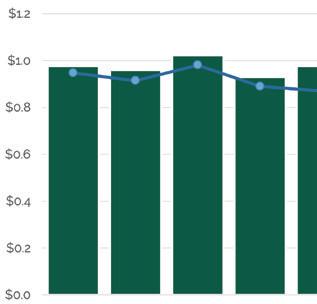
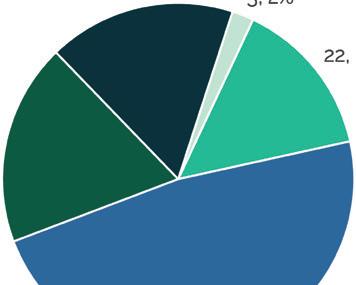
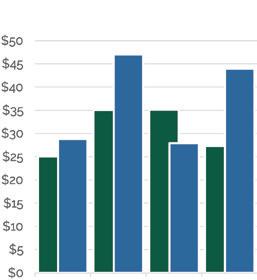
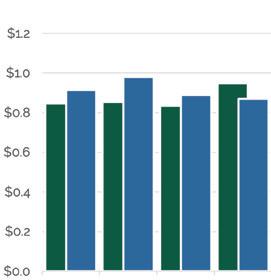
e Marina and East Garrison area had an outstanding Q4. Sales during the quarter totaled 45, topping the last two Q4s on record. Of the newly developed areas, East Garrison saw nine sales, Sea Haven saw six, and e Dunes had four sales (re-sale only). e average sales price for the quarter ($976K) came in almost right on the yearly average of $978K. e median sales price topped $900K over the course of 2024, which was the first time this occurred during a calendar year. Marina joined Carmel Valley as the only two areas to top both 2023 and 2022 in total sales volume, ending the year with $147.7M in sales.
Days on Market 42
151 Sales Volume
Units Sold
Selling Price $977,947 versus 2023 versus 2023 versus 2023 versus 2023 3.7% 5.0% 20.5%
$147,670,036
16.2%
2024 Quarterly Market Breakdown
Did You Know?
Monterey Bay Football Club was founded on February 1, 2021 and played its inaugural season in the USL Championship in 2022. The club plays at Cardinale Stadium, a 6,000-seat soccer-specific venue located on the campus of California State University, Monterey Bay.