Q1 2023 MARKET REPORT Carmel-by-the-Sea & Carmel Point Greater Carmel Carmel Valley Pebble Beach Carmel Highlands, Big Sur & South Coast Monterey & Del Rey Oaks Pacific Grove Seaside Marina & East Garrison 831.624.2300 montereycoastrealty.com Dolores and Seventh Carmel-by-the-Sea DRE#01871677
Company Featured Listings
2
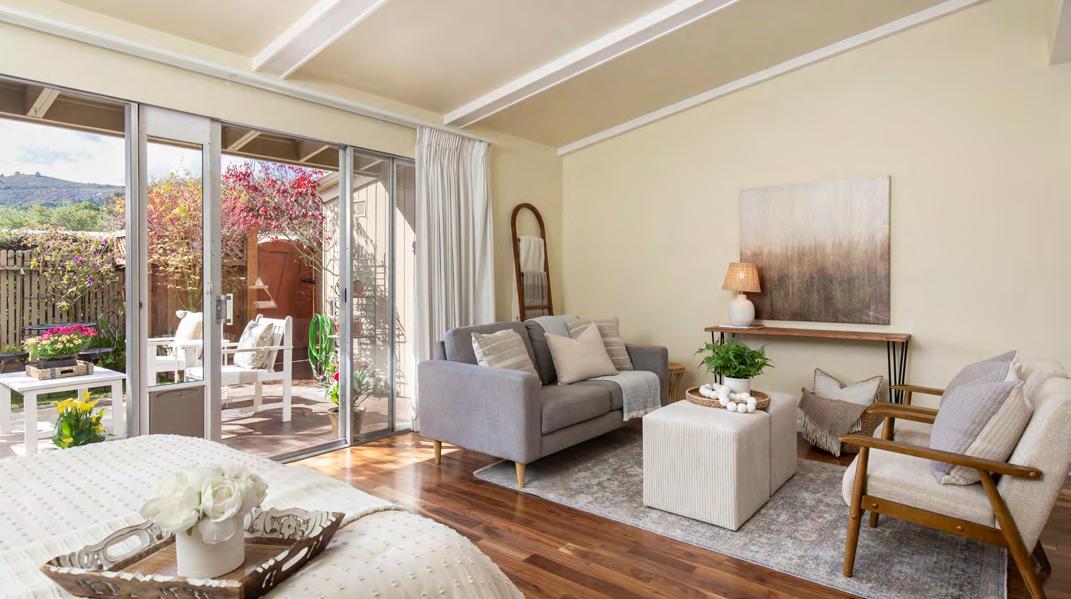
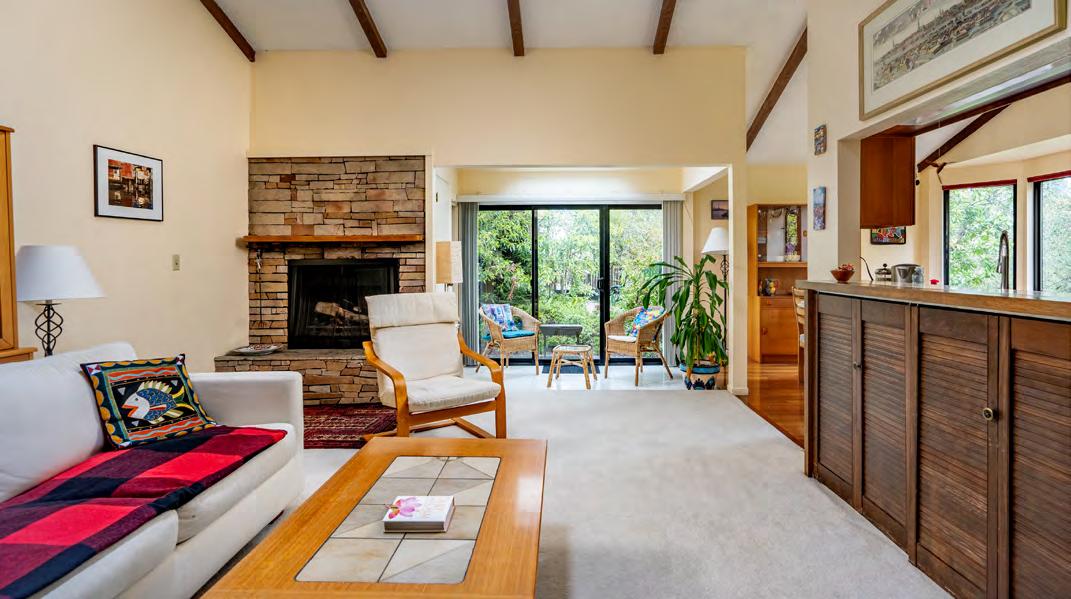
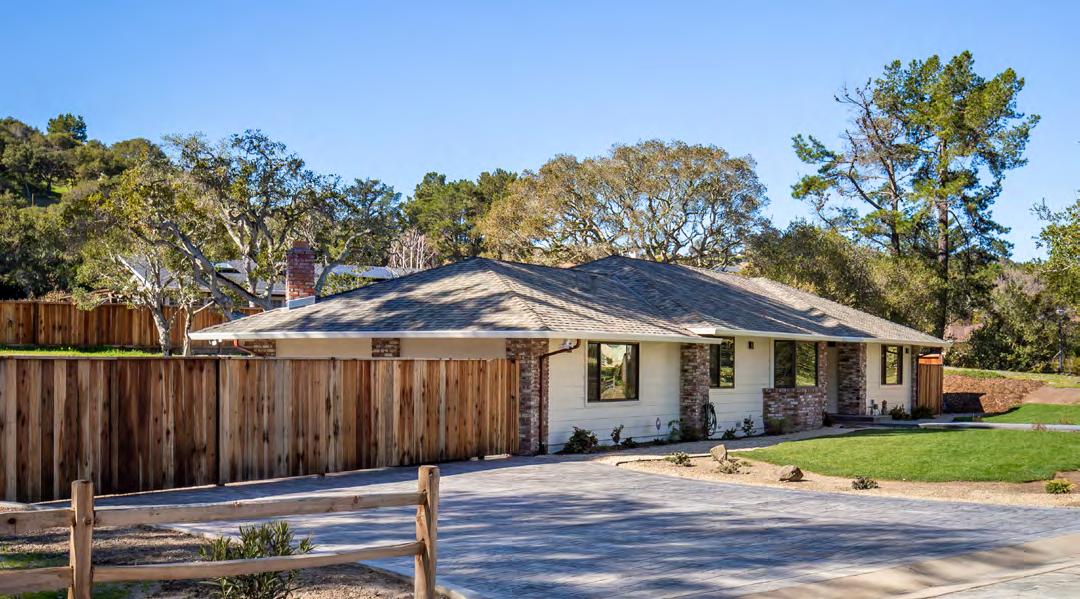
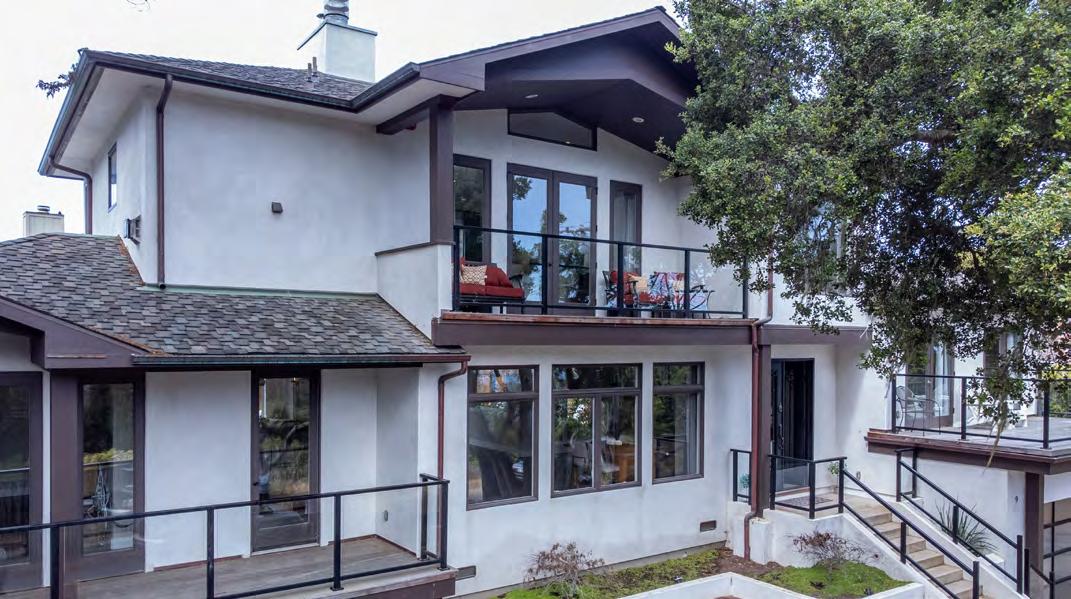
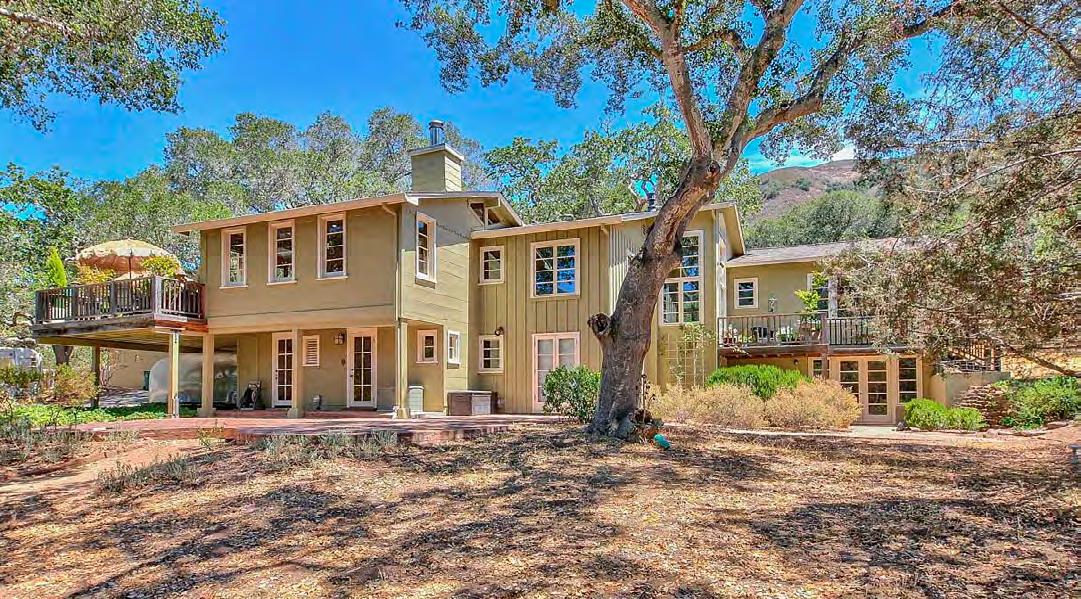
9 Sonoma Lane, Carmel $3,300,000
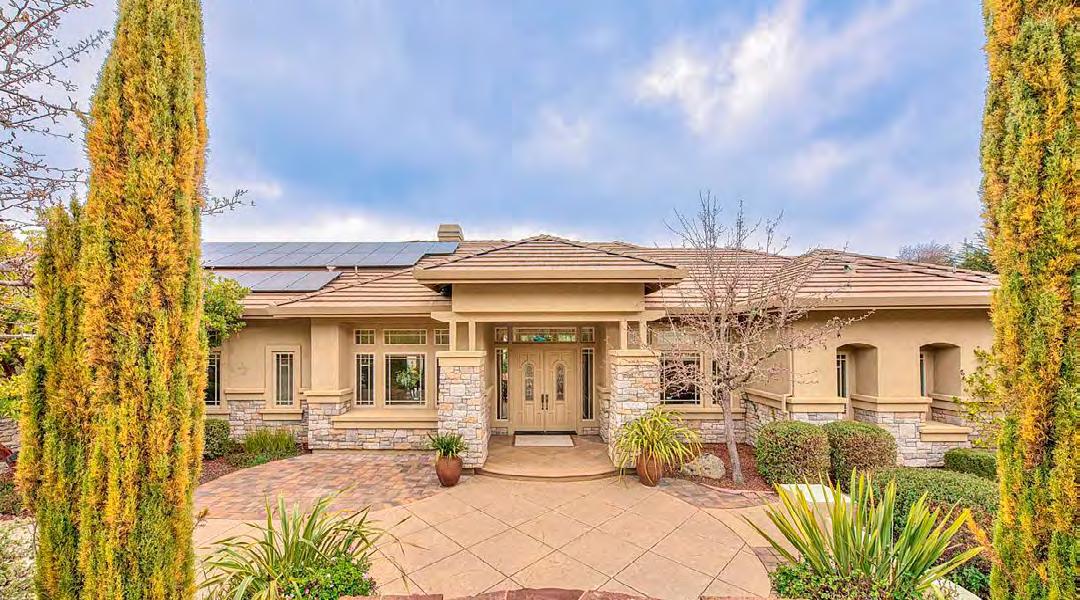
13656 Paseo Terrano, Salinas $1,899,000
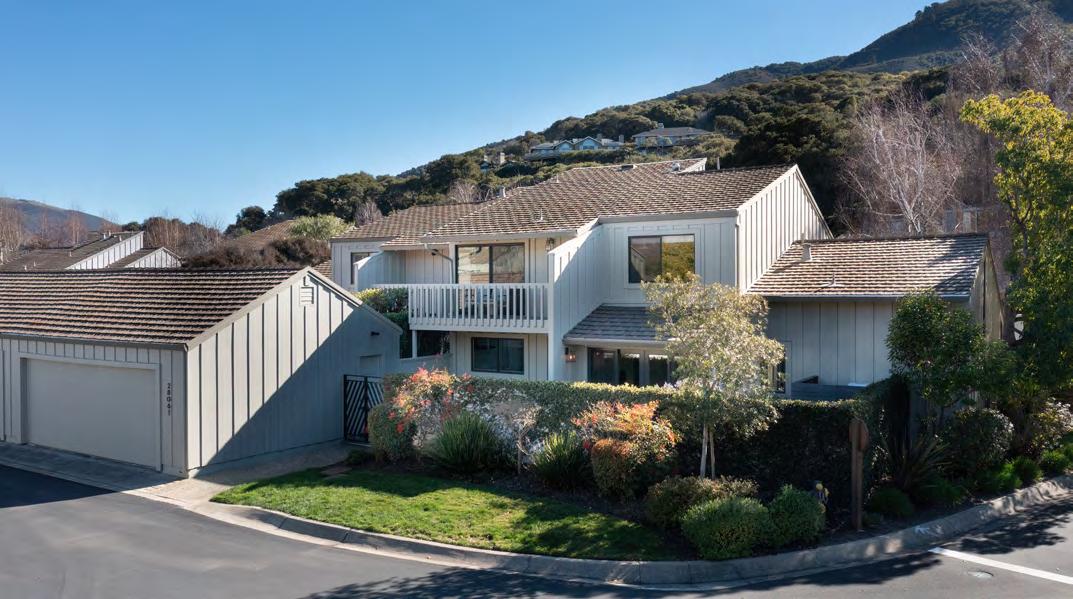
1360 Josselyn Canyon Road #26, Monterey $925,000
264 Hacienda Carmel, Carmel $449,000
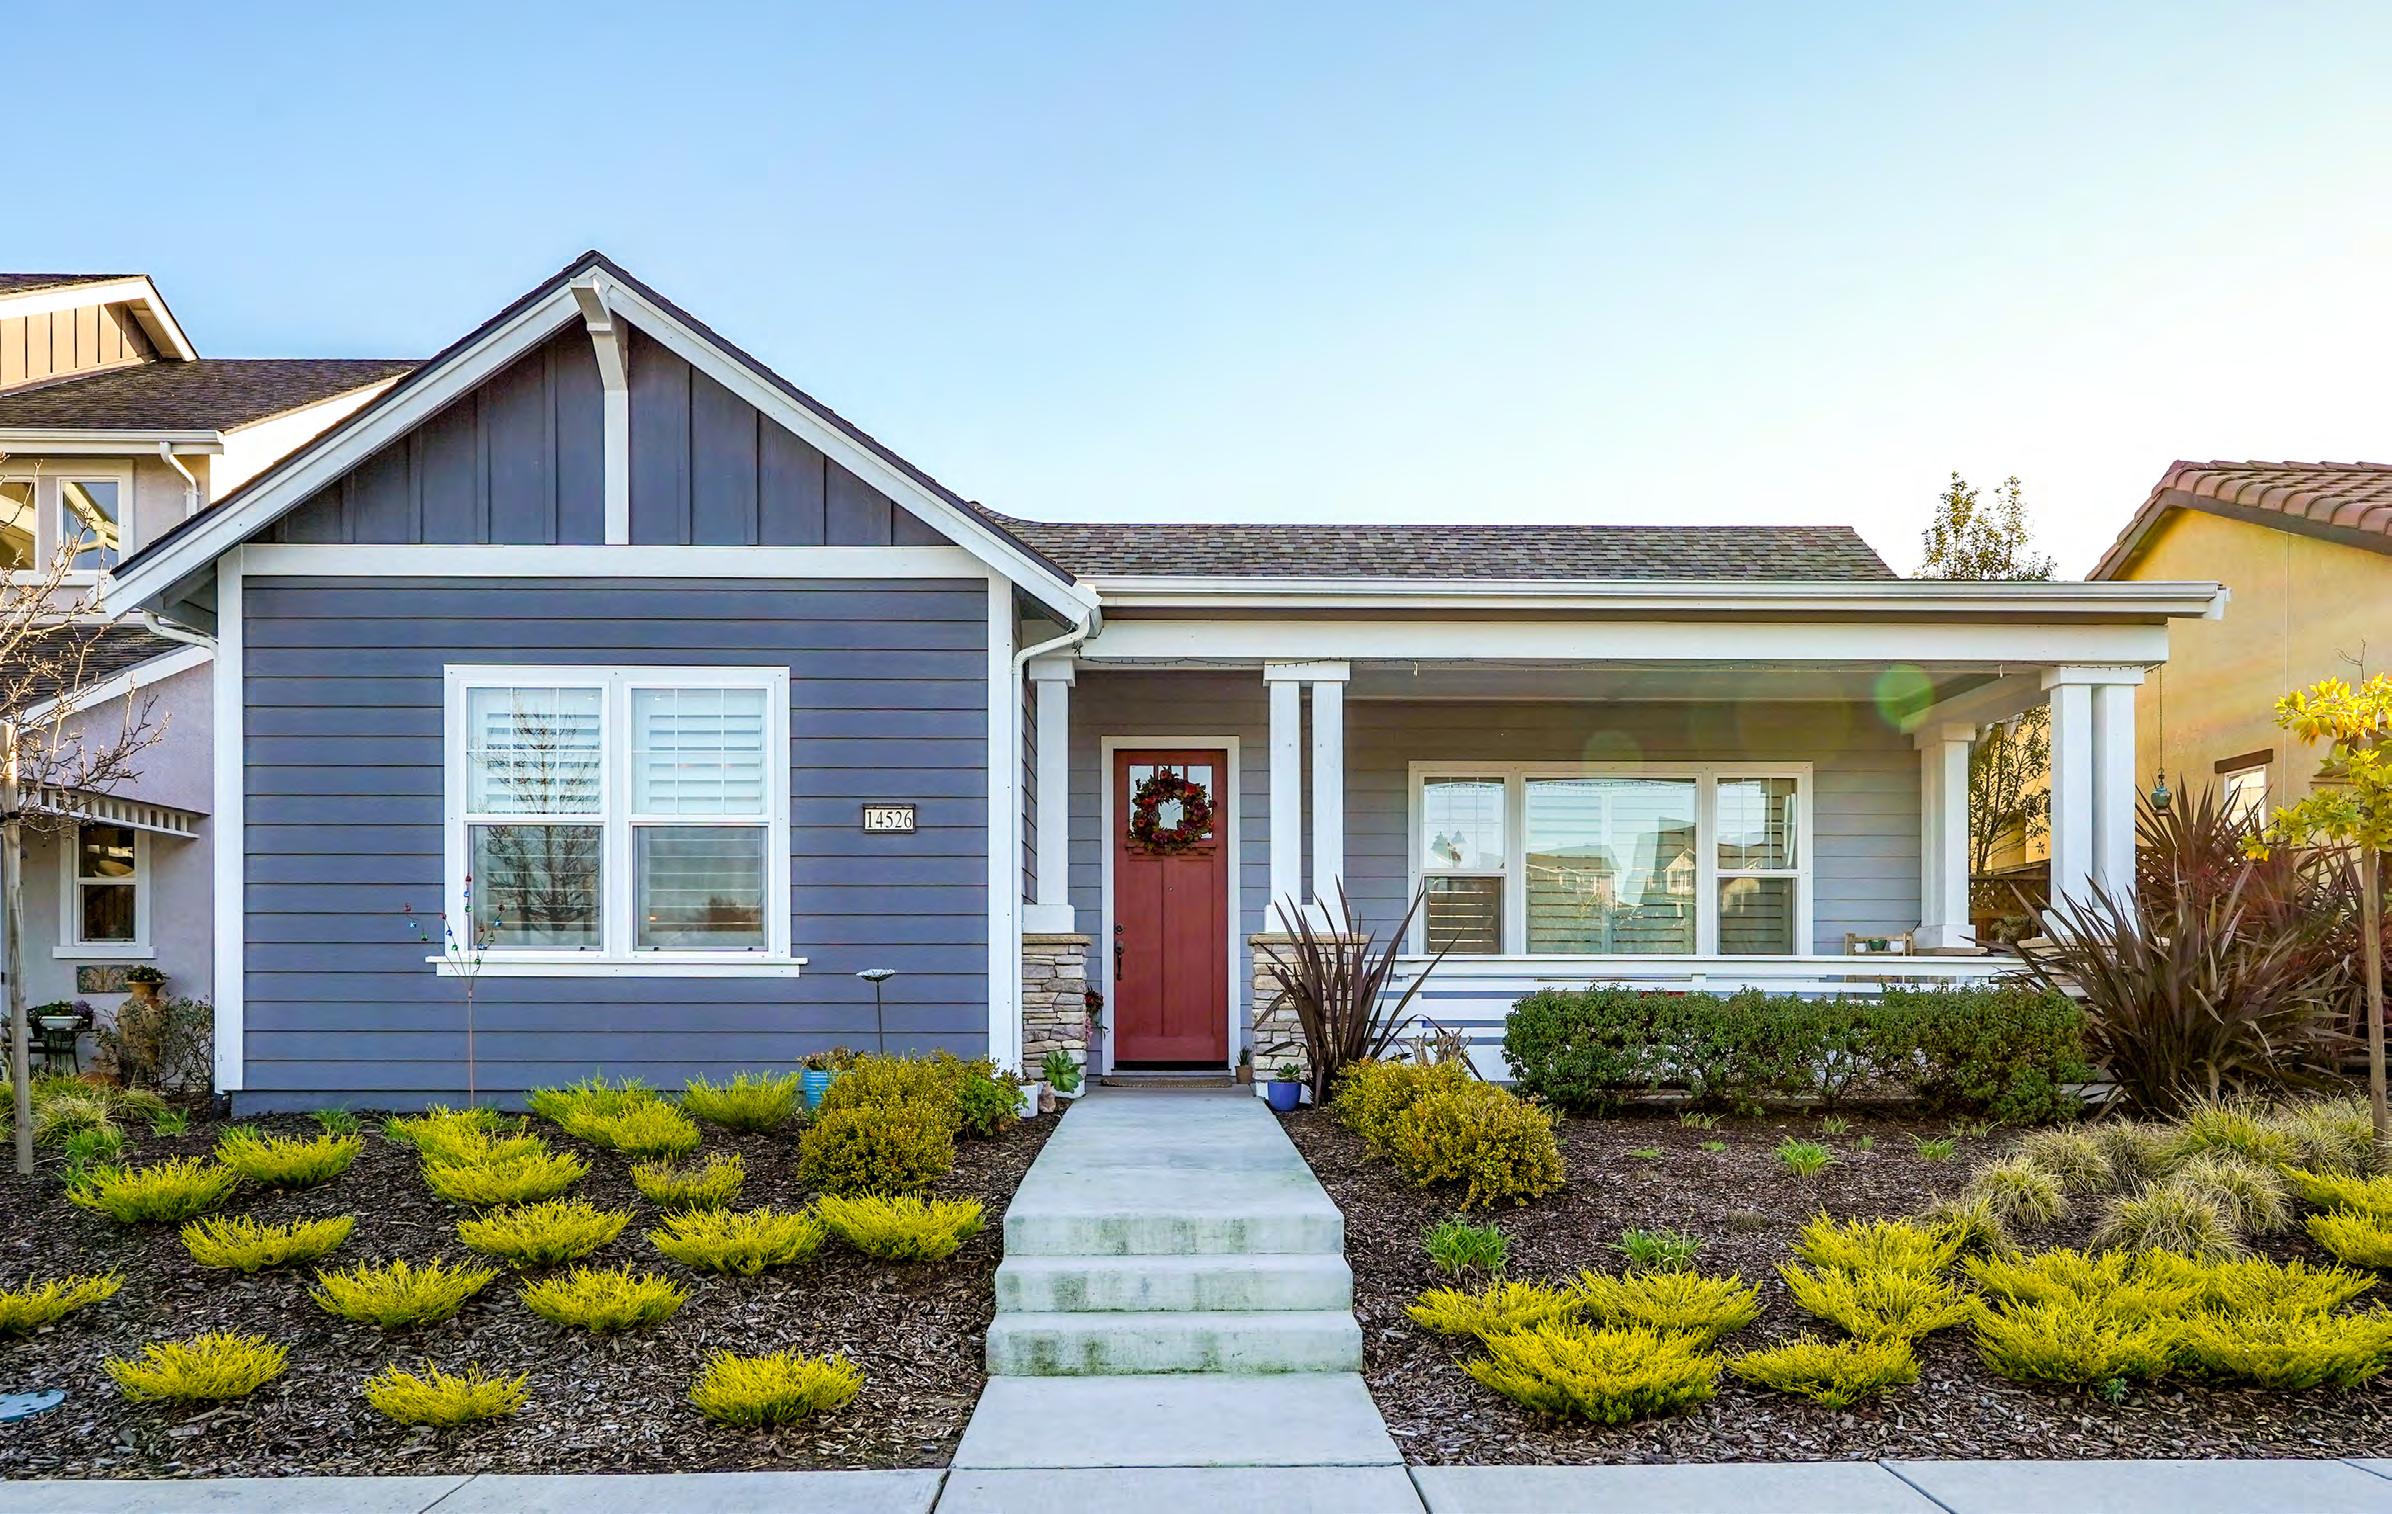
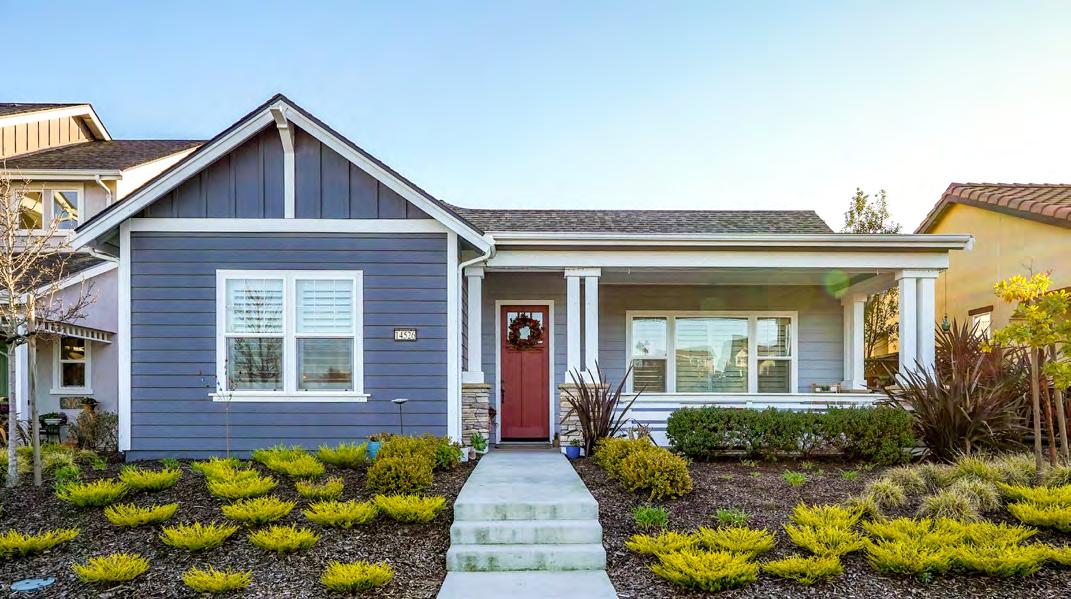
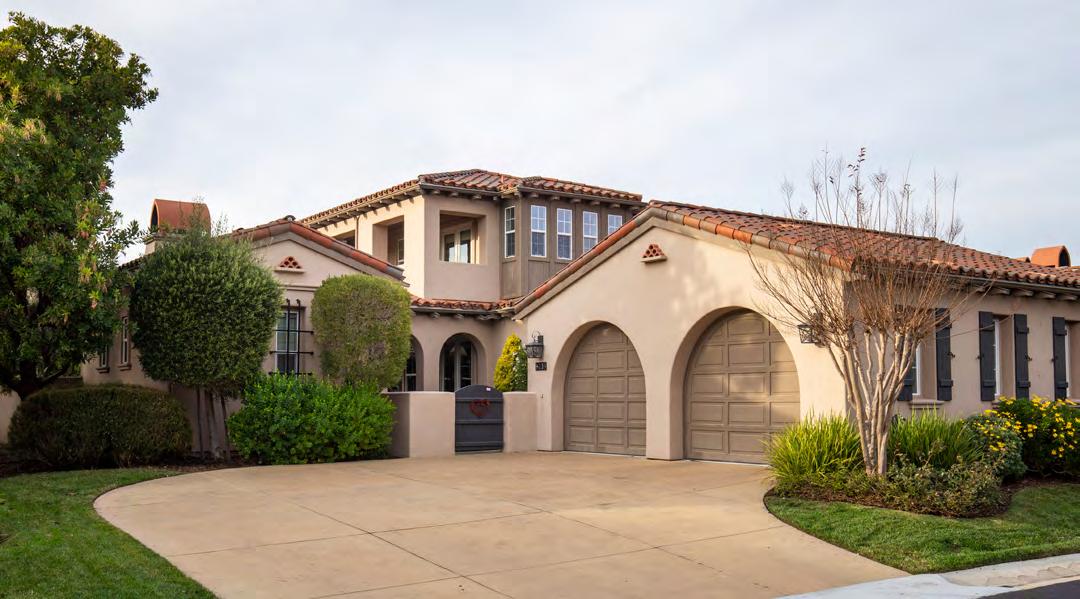
14526 Lee Avenue, East Garrison $1,199,000
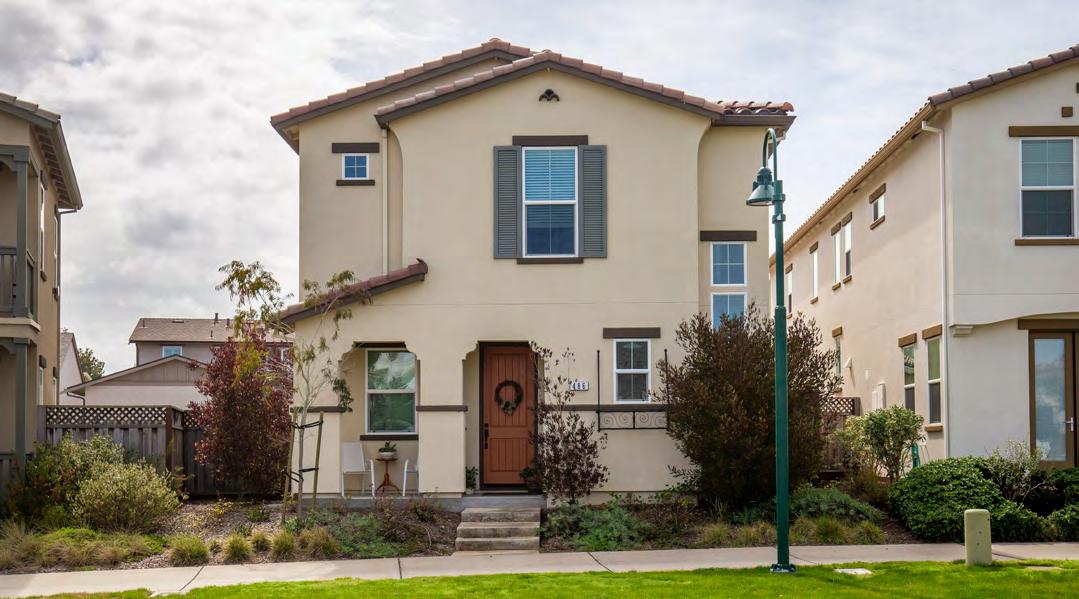
486 Palisade Drive, Marina $895,000
Company Q1 2023 Significant Sales
3 Q1 2023 MARKET REPORT
SW Corner Carmelo & 10th, Carmel • SP: $4.15M Represented Seller 100 Boronda Lane, Monterey • SP: $3.3M Represented Seller 208 Mirasol Way, Monterey • SP: $2.05M Represented Buyer
27530 Crowne Point Lane, Salinas • SP: $1.6M Represented Buyer
28061 Heron Court, Carmel Valley • SP: $2.6M Represented Seller 4 La Rancheria, Carmel Valley • SP: $1.816M Represented Buyer
831.624.2300
montereycoastrealty.com
Dolores and Seventh Carmel-by-the-Sea
Q1 2023 Market Overview
Affected by numerous external drivers, the Monterey Peninsula Real Estate market experienced a 5.5% reduction in transactions from Q4 of 2022 and a 36% reduction from the same quarter last year. This means the market performed comparably to national figures, which is impressive considering the region experienced extremely difficult weather during much of the quarter. The storms in Q1 delivered excessive rain, wind, flooding, and power outages throughout much of the area which made it very difficult to even show property. Combined with macro-economic pressures across the real estate market, high interest rates and geopolitical uncertainty, buyers transacted at very low levels compared to previous quarters. Looking even closer, these factors specifically affected the number of high-priced discretionary sales throughout Carmel and Pebble Beach, dropping total dollar volume and average sales price much more than usual. On a positive note, with extremely tight inventory, values have held up well across the Peninsula and continue to outperform the national market.
Across the markets we track on the Monterey Peninsula, the number of units sold during Q1 2023 was down 5.5% versus an already low Q4 of 2022, and down 36% from Q1 of last year. Average sales price held in stronger, down just over 10% quarter over quarter and down 22% against Q1 2022. Total sales dollar volume in the quarter was 50% lower than Q1 2022. This percentage is skewed by eight homes selling over $10M in Q1 of 2022 (compared to two in Q1 2023), with four of those coming in over $25M. These six additional high-priced sales made up almost 40% of the total sales volume difference between Q1 2023 and Q1 2022.
Moving forward, we are beginning to see the typical rise in inventory levels that come with the late spring season as we transition into summer. As of the end of March, our brokerage has seen a spike of internal listings and the market as a whole has 17% more active listings than the same time last year. With summer weather on the way, banking and financial concerns subsiding and the potential for interest rate easing, we have already seen more homes come on the market and buyers start to return as well. We expect the second quarter to outperform Q1 and hopefully build for a stronger second half of the year. With so much pressure and volatility affecting our market right now, it is essential to work with an experienced and informed agent. Our agents have extensive hands-on local knowledge about every market and are truly market-leading experts across the Peninsula. Moreover, they are supported by a dedicated marketing and analytics team that allows for clients to make informed decisions and to maximize value when buying or selling. The following report breaks out nine of the markets we track with additional performance detail. We hope you will find this report informative. As always, please be sure to contact us if there is anything we can do to help you, or your friends and family, with real estate plans in our marketplace.
- John Romley
4
5 Q1 2023 MARKET REPORT Carmel-by-the-Sea & Carmel Point �������������������������������� 6 Greater Carmel ��������������������������������������������������������������� ��� 8 The areas outside of Carmel-by-the Sea & Carmel Point Carmel Valley ��������������������������������������������������������������� ��� 10 Including The Santa Lucia Preserve Pebble Beach ��������������������������������������������������������������� ���� 12 Carmel Highlands, Big Sur & South Coast ������������������� 14 Monterey & Del Rey Oaks ������������������������������������������������ 16 Pacific Grove ��������������������������������������������������������������� ����� 18 Seaside ��������������������������������������������������������������� �������������� 20 Marina & East Garrison �������������������������������������������������� 22 Table of Contents
831.624.2300
montereycoastrealty.com
Dolores and Seventh Carmel-by-the-Sea
CARMEL-BY-THE-SEA MARKET UPDATE

Although the average sales price in Carmel-by-the-Sea during Q1 2023 was shown to be down over 28% versus Q4 2022, it was right on par with Q1 2022 and 2021 as a whole, meaning prices are holding strong in the area. Just 16 sales during the quarter is the lowest we’ve seen in years, with the area typically showing over 30 sales per quarter. There was also just one sale over $5M in the quarter with 56% of the sales coming in the $3M-5M range. This lack of high-priced homes was a trend we saw in Q1 2023. Number of active listings to end the quarter rose to 27, the most since June 2022, showing promise for more sales moving forward.
$3,289,252
28.7% vs Q4 2022
1.3% vs Q1 2022
$52.6M 40% vs Q4 2022
SALES VOLUME
AVERAGE SELLING PRICE UNITS SOLD DAYS ON MARKET
16 15.8% vs Q4 2022
32


22% vs Q4 2022
56.2% vs Q1 2022
56.8% vs Q1 2022
3.2% vs Q1 2022
6
6% 56% 25% 13%
SALES BY SEGMENT
<$1M - 0 $1M-$2M - 2 $2M-$3M - 4 $3M-$5M - 9 $5M+ - 1
Carmel-by-the-Sea & Carmel Point
7 Q1 2023 MARKET REPORT Closed Sales by Quarter 10 20 30 40 Q1 Q2 Q3 Q4 2022 2023 Average vs Median Sales Price $2M $2.75M $3.5M $4.25M $5M Q1 2022 Q2 2022 Q3 2022 Q4 2022 Q1 2023 Average Median Days on Market 0 10 20 30 40 50 Q1 2022 Q2 2022 Q3 2022 Q4 2022 Q1 2023 Average vs Median Sales Price by Quarter $2M $3M $4M $5M Q1 Q2 Q3 Q4 2022 Average 2022 Median 2023 Average 2023 Median Closed Sales Volume by Quarter $50M $70M $90M $110M $130M Q1 Q2 Q3 Q4 2022 2023
831.624.2300
montereycoastrealty.com
Dolores and Seventh Carmel-by-the-Sea
GREATER CARMEL MARKET UPDATE
LikeCarmel-by-the-Sea, the Greater Carmel area showed prices holding strong at $1.8M. This number was consistent with three of the four quarters during 2022. Just 12 sales during the quarter is about half of typical sales numbers, but actually up from just 10 sales in Q4 2022. Eight out of 12 sales in the quarter came in the $1M-2M dollar segment.
$1,867,542
6.1% vs Q4 2022
0.1% vs Q1 2022
$22.4M
SALES VOLUME
27.3% vs Q4 2022
45.5% vs Q1 2022
12


20% vs Q4 2022
45.5% vs Q1 2022
SALES BY SEGMENT 8% 17% 67% 8%
<$1M - 1 $1M-$2M - 8 $2M-$3M - 2 $3M-$5M - 1 $5M+ - 0
54
AVERAGE SELLING PRICE UNITS SOLD DAYS ON MARKET
8.5% vs Q4 2022
170% vs Q1 2022
8
9 Q1 2023 MARKET REPORT Closed Sales by Quarter 0 10 20 30 Q1 Q2 Q3 Q4 2022 2023 Average vs Median Sales Price $800K $1.41M $2.03M $2.64M $3.25M Q1 2022 Q2 2022 Q3 2022 Q4 2022 Q1 2023 Average Median Days on Market 0 15 30 45 60 Q1 2022 Q2 2022 Q3 2022 Q4 2022 Q1 2023 Average vs Median Sales Price by Quarter $1.25M $1.75M $2.25M $2.75M $3.25M Q1 Q2 Q3 Q4 2022 Average 2022 Median 2023 Average 2023 Median Closed Sales Volume by Quarter 0 $20M $40M $60M $80M Q1 Q2 Q3 Q4 2022 2023
Greater Carmel The areas outside of Carmel-by-the Sea & Carmel Point
831.624.2300
montereycoastrealty.com
Dolores and Seventh
Carmel-by-the-Sea
CARMEL VALLEY MARKET UPDATE
Carmel Valley had a very difficult quarter, especially on the high-end side of the market. Q1 2023 was very similar to Q4 2022 in many ways, with median sales price coming in at $1.3M in both quarters and number of sales tallying 39 this quarter versus 34 last quarter. The difference came in the lack of sales over $3M. There were zero sales over $3M in Q1 2023. During 2022, 15% of sales topped this number. As a result, average sales price dipped to $1.38M for the quarter and total sales volume fell 26% quarter over quarter.

$1,378,151
AVERAGE SELLING PRICE
26.2% vs Q4 2022
24.4% vs Q1 2022
$53.7M
SALES VOLUME
15.4% vs Q4 2022
37.3% vs Q1 2022
39

UNITS SOLD
14.7% vs Q4 2022 17% vs Q1 2022
DAYS ON MARKET
53 29.3% vs Q4 2022
65.6% vs Q1 2022
10
SALES BY SEGMENT 18% 46% 36% <$1M | 14 $1M-$2M | 18 $2M-$3M | 7 $3M-$5M | 0 $5M+ | 0
Carmel Valley Including The Santa Lucia Preserve
11
Closed Sales by Quarter 30 40 50 60 70 Q1 Q2 Q3 Q4 2022 2023 Average vs Median Sales Price $1M $1.25M $1.5M $1.75M $2M $2.25M Q1 2022 Q2 2022 Q3 2022 Q4 2022 Q1 2023 Average Median Days on Market 25 30 35 40 45 Q1 2022 Q2 2022 Q3 2022 Q4 2022 Q1 2023 Average vs Median Sales Price by Quarter $1.25M $1.5M $1.75M $2M $2.25M Q1 Q2 Q3 Q4 2022 Average 2022 Median 2023 Average 2023 Median Closed Sales Volume by Quarter $50M $70M $90M $110M $130M Q1 Q2 Q3 Q4 2022 2023
Q1 2023 MARKET REPORT
831.624.2300
montereycoastrealty.com
Dolores and Seventh Carmel-by-the-Sea
PEBBLE BEACH MARKET UPDATE

Thelack of high-priced sales also affected the Pebble Beach market. With only four homes topping the $5M mark in Q1 2023, average sales price in the area saw its lowest number ($3.59M) over the past five quarters. In comparison, Q1 of 2022 saw eight sales over $10M, with four of those topping $25M, leading to the outlier in average sales price over $8.6M. 25 Sales in Q1 2023 is similar to what we have seen over the last year, but still down about 33% from years prior to 2022. Under $90M in total sales volume for the quarter is trending toward 2018 and 2019 sales dollar volume levels, but we expect this to pick up with the return of high-priced sales later this year.
$3,593,600
AVERAGE SELLING PRICE
29.1% vs Q4 2022
58.3% vs Q1 2022
$89.8M
SALES VOLUME
19.4% vs Q4 2022
58.3% vs Q1 2022
25 13.6% vs Q4 2022 no change vs Q1 2022
34


UNITS SOLD
DAYS ON MARKET
43.3% vs Q4 2022
24.4% vs Q1 2022
12
SALES BY SEGMENT 16% 28% 32% 20% 4% <$1M | 1 $1M-$2M | 5 $2M-$3M | 8 $3M-$5M | 7 $5M+ | 4
Pebble Beach
13 Q1
Closed Sales by Quarter 10 15 20 25 30 Q1 Q2 Q3 Q4 2022 2023 Average vs Median Sales Price $2M $3.75M $5.5M $7.25M $9M Q1 2022 Q2 2022 Q3 2022 Q4 2022 Q1 2023 Average Median Days on Market 20 30 40 50 60 70 Q1 2022 Q2 2022 Q3 2022 Q4 2022 Q1 2023 Average vs Median Sales Price by Quarter $2M $3.75M $5.5M $7.25M $9M Q1 Q2 Q3 Q4 2022 Average 2022 Median 2023 Average 2023 Median Closed Sales Volume by Quarter $75M $125M $175M $225M Q1 Q2 Q3 Q4 2022 2023
2023 MARKET REPORT
831.624.2300
montereycoastrealty.com
Dolores and Seventh Carmel-by-the-Sea
CARMEL HIGHLANDS MARKET UPDATE

SALES
BY SEGMENT
$2,920,000
18.6% vs Q4 2022
49.7% vs Q1 2022
$14.6M
AVERAGE SELLING PRICE UNITS SOLD DAYS ON MARKET
1.7% vs Q4 2022
79.1% vs Q1 2022
5
25% vs Q4 2022
58.3% vs Q1 2022
107 43.4% vs Q4 2022
224.2% vs Q1 2022
14
40% 40%
<$1M
$1M-$2M
InCarmel Highlands and Big Sur, Q1 of 2023 was like that of the previous quarter, showing just 5 sales (versus 4) and sales dollar volume totaling just over $14.6M (versus $14.3M). No homes over $5M sold in the quarter, when last year 32% of the homes sold were in this category. This brought average sales price for Q1 2023 down below $3M for the first time since Q1 2021. Median sales price ($2.97M) actually topped average sales price, again showing the lack of highpriced sales in the area. $2M-$3M
20%
- 0
- 1
- 2 $3M-$5M - 2 $5M+ - 0
SALES VOLUME
Carmel Highlands, Big Sur & South Coast
15 Q1 2023 MARKET REPORT Closed Sales by Quarter 0 4 8 12 16 20 Q1 Q2 Q3 Q4 2022 2023 Average vs Median Sales Price $1.5M $3M $4.5M $6M Q1 2022 Q2 2022 Q3 2022 Q4 2022 Q1 2023 Average Median Days on Market 0 50 100 150 200 Q1 2022 Q2 2022 Q3 2022 Q4 2022 Q1 2023 Average vs Median Sales Price by Quarter $1.5M $3M $4.5M $6M Q1 Q2 Q3 Q4 2022 Average 2022 Median 2023 Average 2023 Median Closed Sales Volume by Quarter 0 $15M $30M $45M $60M $75M Q1 Q2 Q3 Q4 2022 2023
831.624.2300

montereycoastrealty.com
Dolores and Seventh Carmel-by-the-Sea
MONTEREY MARKET UPDATE
Average sales price in Monterey held strong ($1.25M), topping 2022’s full-year average. Median sales price also reached a record high at over $1.2M. This shows prices are not adjusting in this area. This is also proven by the movement of homes from the $800K-$1.2M range up into the $1.2M-2M range, with 40% of sales in Q1 falling in the latter. While prices remain strong, the number of sales fell to 42, less than half the sales we saw in Q1 2022 and the lowest dating back to 2010.
$1,254,137 10.8% vs Q4 2022 1.1% vs Q1 2022
$52.7M
SALES VOLUME
AVERAGE SELLING PRICE UNITS SOLD DAYS ON MARKET
1.1% vs Q4 2022
53.9% vs Q1 2022
42 8.7% vs Q4 2022
54.3% vs Q1 2022
24 31.4% vs Q4 2022
4.3% vs Q1 2022
16 7% 5% 40% 12% 36% <$800K - 15 $800K-$1.2M
5 $1.2M-$2M
17 $2M-$3M
2 $3M+
-
-
-
- 3
SALES BY SEGMENT
Monterey & Del Rey Oaks
17 Q1 2023 MARKET REPORT Closed Sales by Quarter 25 40 55 70 85 100 Q1 Q2 Q3 Q4 2022 2023 Average vs Median Sales Price $800K $1M $1.2M $1.4M Q1 2022 Q2 2022 Q3 2022 Q4 2022 Q1 2023 Average Median Days on Market 10 20 30 40 Q1 2022 Q2 2022 Q3 2022 Q4 2022 Q1 2023 Average vs Median Sales Price by Quarter $950K $1.05M $1.15M $1.25M $1.35M Q1 Q2 Q3 Q4 2022 Average 2022 Median 2023 Average 2023 Median Closed Sales Volume by Quarter 0 $25M $50M $75M $100M $125M Q1 Q2 Q3 Q4 2022 2023
831.624.2300
montereycoastrealty.com
Dolores and Seventh Carmel-by-the-Sea
PACIFIC GROVE MARKET UPDATE
Pacific Grove had its highest average sales price on record in Q1 2023 at $1.7M, slightly topping Q1 of last year. While we saw homes selling quickly in this area over the last few years, average days on market jumped up to 54 days for the quarter, the highest since 2019. Inventory is still low, but slowly increasing, now up to 15 at quarter end. After seeing 30 sales in the quarter once again, we expect to see this number climb closer to the typical average in the low 40s.
$1,708,723
20% vs Q4 2022
0.3% vs Q1 2022
$51.3M
SALES VOLUME
SALES BY SEGMENT
<$800K - 0 $800K-$1.2M - 9 $1.2M-$2M - 15 $2M-$3M - 4 $3M+ - 2
AVERAGE SELLING PRICE UNITS SOLD DAYS ON MARKET
20% vs Q4 2022
0.3% vs Q1 2022
30 no change vs Q4 2022 no change vs Q1 2022
54 45.9% vs Q4 2022
68.8% vs Q1 2022
18
7% 13% 50% 30%
Pacific Grove
19 Q1 2023 MARKET REPORT Closed Sales by Quarter 20 26 31 37 42 48 Q1 Q2 Q3 Q4 2022 2023 Average vs Median Sales Price $1M $1.25M $1.5M $1.75M Q1 2022 Q2 2022 Q3 2022 Q4 2022 Q1 2023 Average Median Days on Market 0 15 30 45 60 Q1 2022 Q2 2022 Q3 2022 Q4 2022 Q1 2023 Average vs Median Sales Price by Quarter $1M $1.25M $1.5M $1.75M Q1 Q2 Q3 Q4 2022 Average 2022 Median 2023 Average 2023 Median Closed Sales Volume by Quarter $25M $43M $62M $80M Q1 Q2 Q3 Q4 2022 2023
831.624.2300
montereycoastrealty.com
Dolores and Seventh Carmel-by-the-Sea
SEASIDE MARKET UPDATE
Seaside saw its average sales price dip to $732K during Q1, the lowest since Q2 of 2021. While true, this price remains consistent with the 2021 full-year average sales price and well above any year prior, showing appreciation in this area is here to stay. The number of sales in the area fell to 24 in Q1 2023, the lowest since the lock down in Q2 2020. We are likely seeing higher interest rates influencing the Seaside market, the lowest priced on the Peninsula. While other areas’ available inventory is on the rise moving into Q2, inventory in Seaside remains at the lowest level we’ve seen over the last three years.
$732,813
SALES BY SEGMENT
< $400K - 0
$400K-$600K - 2 $600K-$800K - 15 $800K-$1M - 6 $1M+ - 1
25%
63% 8%
14.5% vs Q4 2022
6.7% vs Q1 2022
$17.6M
SALES VOLUME
AVERAGE SELLING PRICE UNITS SOLD DAYS ON MARKET
4%
31.6% vs Q4 2022
52.4% vs Q1 2022
24 20% vs Q4 2022
48.9% vs Q1 2022
32
13.5% vs Q4 2022
128.6% vs Q1 2022
20
21 Q1 2023 MARKET REPORT Closed Sales by Quarter 20 28 36 44 52 60 Q1 Q2 Q3 Q4 2022 2023 Average vs Median Sales Price $650K $700K $750K $800K $850K $900K Q1 2022 Q2 2022 Q3 2022 Q4 2022 Q1 2023 Average Median Days on Market 0 10 20 30 40 Q1 2022 Q2 2022 Q3 2022 Q4 2022 Q1 2023 Average vs Median Sales Price by Quarter $600K $675K $750K $825K $900K Q1 Q2 Q3 Q4 2022 Average 2022 Median 2023 Average 2023 Median Closed Sales Volume by Quarter 0 $10M $20M $30M $40M $50M Q1 Q2 Q3 Q4 2022 2023 Seaside
831.624.2300
montereycoastrealty.com
Dolores and Seventh Carmel-by-the-Sea
MARINA MARKET UPDATE
Marina
and East Garrison’s pricing held strong in Q1 of 2023. An average sales price of $862K for the quarter was just 1.2% down from 2022’s average, with median pricing showing the same results. Average days on market was the big surprise in this area, with days to sell jumping to 61 during the period. This was longer than any year dating back to 2012, noteworthy for an area that has steadily shown the lowest days on market per sale over the last three years. The number of sales also came in low at just 29, the lowest since early 2020. While pricing holds up in the area, higher interest rates seem to be displaying a different effect on this area than Seaside through lower sales numbers and longer time to sell.
$862,783
4.6% vs Q4 2022
3% vs Q1 2022
$25M
SALES VOLUME
<$600K - 3 $600K-$800K - 9 $800K-$1M - 10 $1M-$1.2M - 5 $1.2M-$2M - 2
17% 34% 31% 10%
29
30.8% vs Q4 2022
12.2% vs Q1 2022
61
27.5% vs Q4 2022
14.7% vs Q1 2022
7%

AVERAGE SELLING PRICE UNITS SOLD DAYS ON MARKET
56.4% vs Q4 2022
190.5% vs Q1 2022
22
SALES BY SEGMENT
Marina & East Garrison
23 Q1 2023 MARKET REPORT Closed Sales by Quarter 20 26 32 38 44 Q1 Q2 Q3 Q4 2022 2023 Average vs Median Sales Price $750K $800K $850K $900K Q1 2022 Q2 2022 Q3 2022 Q4 2022 Q1 2023 Average Median Days on Market 0 18 35 53 70 Q1 2022 Q2 2022 Q3 2022 Q4 2022 Q1 2023 Average vs Median Sales Price by Quarter $700K $753K $805K $858K $910K Q1 Q2 Q3 Q4 2022 Average 2022 Median 2023 Average 2023 Median Closed Sales Volume by Quarter $20M $30M $40M $50M Q1 Q2 Q3 Q4 2022 2023


Q1 2023 MARKET REPORT John Romley 831.574.9393 john@johnromley.com johnromley.com DRE#01966766 Results Driven Experts