2022 Q4 MARKET REPORT Aptos Capitola Santa Cruz
Valley Soquel 831.624.2300 montereycoastrealty.com Dolores and Seventh Carmel-by-the-Sea
Scotts
APTOS MARKET UPDATE I
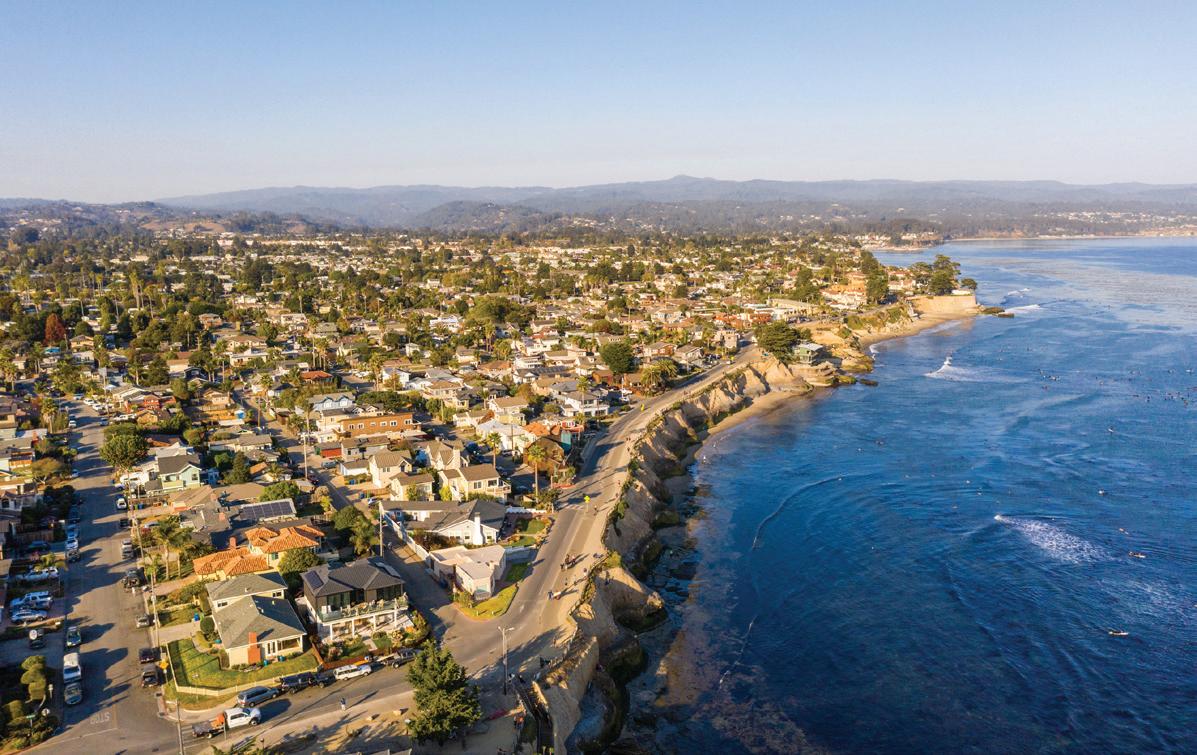
n Aptos, the average sale price showed modest gains from Q3 of 1.14% to $1.86 million, while the median price slid for the second straight quarter to $1.35 million. Both are down significantly from the highs in Q2 of this year by 9.4% and 20%, respectively. The real story is shown in the changes to units sold and days on market (DOM), where sales slowed another 38% to just 41 in Q4, while DOM rose 47% to the highest mark in the last two years. Aptos finished the year with 2.7 months of inventory (MOI), which was up slightly from Q3 and more in line with numbers seen prior to the heated market of the last few years.

2
831.624.2300 montereycoastrealty.com Dolores and Seventh Carmel-by-the-Sea
SALES VOLUME $76.2M 37% vs Q3 2022 43% vs Q4 2021 1.44% vs Q3 2022 5.78% vs Q4 2021 $1,858,579 38% vs Q3 2022 46% vs Q4 2021 UNITS SOLD 41 47% vs Q3 2022 52% vs Q4 2021 44 DAYS ON MARKET 2.6% 6% 20% 59% 11% <$1M | 27 $1M-2M | 139 $2M-3M | 48 $3M-5M | 15 $5M+ | 6 AVERAGE SELLING PRICE 2022 SALES BY SEGMENT


3 2022 Q4 MARKET REPORT Closed Sales by Quarter 20 40 60 80 100 Q1 Q2 Q3 Q4 2021 2022 Average vs Median Sales $1.53M $1.82M $2.1M Q4 2021 Q1 2022 Q2 2022 Q3 2022 Q4 2022 Average Median Days on Market 12.5 25 37.5 50 Q4 2021 Q1 2022 Q2 2022 Q2 2022 Q4 2022 Months of Available Inventory 0.75 1.5 2.25 3 Q1 Q2 Q3 Q4 2021 2022 Closed Sales Volume by Quarter $43M $85M $128M $170M Q1 Q2 Q3 Q4 2021 2022 Aptos
CAPITOLA MARKET UPDATE
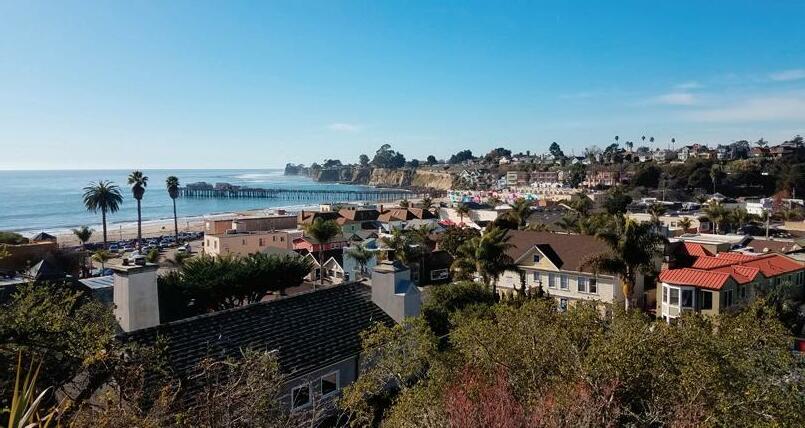
The Capitola market has held consistent throughout the year, though the average sales price slid 3.22% from Q3 to its lowest point for the year at $1.826 million, while the median price rose 1% to $1.67 million. Capitola had a positive Q4 in terms of units sold, which increased 27% from Q3 to 14. This was the highest mark for the year, which helped the market reach its highest sales volume for the year as well. This production was interestingly accompanied by a slight increase of 13% in DOM to 26. Due to the productive sales quarter, Capitola finished the year with only .9 MOI in contrast to many of the other markets.
831.624.2300
4
montereycoastrealty.com Dolores and Seventh Carmel-by-the-Sea
SALES VOLUME $25.56M 23% vs Q3 2022 118% vs Q4 2021 AVERAGE SELLING PRICE 3.22% vs Q3 2022 8.83% vs Q4 2021 $1,825,992 27% vs Q3 2022 100% vs Q4 2021 UNITS SOLD 14 13% vs Q3 2022 7% vs Q4 2021 26 DAYS ON MARKET 2022 SALES BY SEGMENT sales 9% 18% 73% <$1M | 0 $1M-2M | 33 $2M-3M | 8 $3M-5M | 4 $5M+ | 0


5 2022 Q4 MARKET REPORT Capitola Closed Sales by Quarter 5 10 15 20 Q1 Q2 Q3 Q4 2021 2022 Days on Market 10 20 30 40 Q4 2021 Q1 2022 Q2 2022 Q3 2022 Q4 2022 Months of Available Inventory 1 2 3 4 Q1 Q2 Q3 Q4 2021 2022 Closed Sales Volume by Quarter $10M $20M $30M $40M Q1 Q2 Q3 Q4 2021 2022 Average vs Median Sales $1.47M $1.68M $1.9M Q4 2021 Q1 2022 Q2 2022 Q3 2022 Q4 2022 Average Median
2022 SALES BY SEGMENT
Q4, 7%
1.37% vs Q3 2022 2.07% vs Q4 2021
15% 71% 6% <$1M | 29 $1M-2M | 318 $2M-3M | 67 $3M-5M | 31 $5M+ | 4 SALES VOLUME $153.9M 22% vs Q3 2022 28% vs Q4 2021
$1,655,084 48% vs Q3 2022 36% vs Q4 2021
93
UNITS SOLD
AVERAGE SELLING PRICE 21% vs Q3 2022 26% vs Q4 2021
34 DAYS ON MARKET
6
831.624.2300 montereycoastrealty.com Dolores and Seventh Carmel-by-the-Sea
SANTA CRUZ MARKET UPDATE
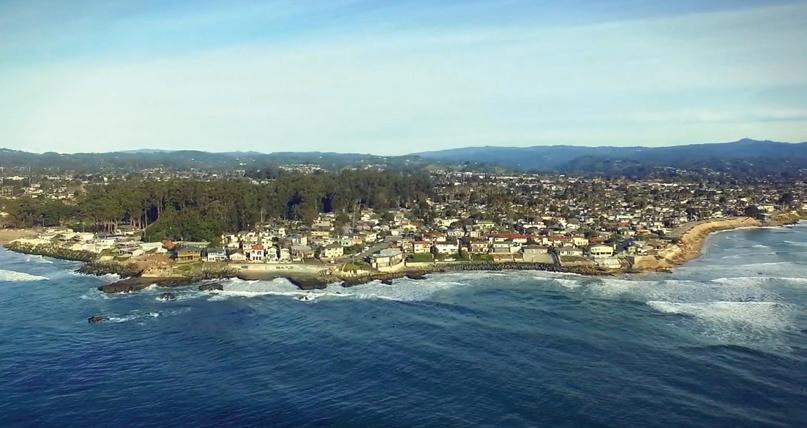
The average and median sale prices have fallen continuously from the highs of Q1, with the average falling another 1.37% from Q3 to $1.65 million. Despite this trend, the median price rose 2% in Q4 to $1.45 million, showing a composition of sales this quarter leaning more heavily on the lower end. Units sold are down 21% from Q3 to just 93 sales in Q4, which is the lowest mark in the last two years for the largest market in the area. DOM increased 48% from Q3 to 34 days, its highest mark in the last two years by nearly 10 days. MOI held steady from Q3 at 1.8 months, which is still low and representative of the lack of new listings coming to market. 0.9%


7 2022 Q4 MARKET REPORT Closed Sales by Quarter 63 127 190 Q1 Q2 Q3 Q4 2021 2022 Average vs Median Sales $1.13M $1.57M $2M Q4 2021 Q1 2022 Q2 2022 Q3 2022 Q4 2022 Average Median Days on Market 7 14 21 28 35 Q4 2021 Q1 2022 Q2 2022 Q3 2022 Q4 2022 Months of Available Inventory 0.5 1 1.5 2 2.5 Q1 Q2 Q3 Q4 2021 2022 Closed Sales Volume by Quarter $80M $160M $240M $320M Q1 Q2 Q3 Q4 2021 2022 Santa Cruz
SCOTTS VALLEY MARKET UPDATE
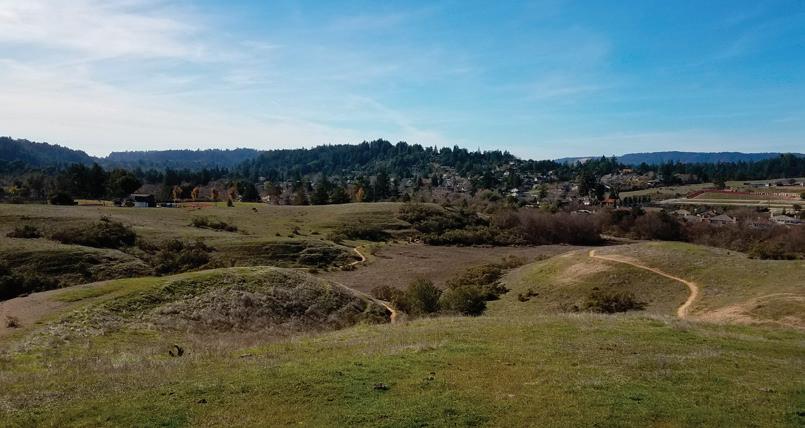
After a few quarters with sliding numbers in average and median sale price, we saw the average price hold steady from Q3 at $1.44 million while the median price rose 14.7% to $1.53 million. Units sold fell another 37% from Q3 to 17 and couldn’t reach half of the sales seen in Q4 of 2021. DOM rose again by 5% to 42, the highest in any of the markets tracked. As expected with the previous two statistics, MOI in the market increased substantially during this time to 4.8 months. On paper, this increase has pushed Scotts Valley into a “balanced” market from a seller’s market when dealing with less than 4 MOI.
8
831.624.2300 montereycoastrealty.com Dolores and Seventh Carmel-by-the-Sea
14% 77% 10% <$1M | 10 $1M-2M | 79 $2M-3M | 14 $3M-5M | 0 $5M+ | 0 SALES VOLUME $24.47M 36.9% vs Q3 2022 51.1% vs Q4 2021 0.18% vs Q3 2022 0.68% vs Q4 2021 $1,439,857 5% vs Q3 2022 121% vs Q4 2021 42 DAYS ON MARKET AVERAGE SELLING PRICE 37% vs Q3 2022 51.4% vs Q4 2021 UNITS SOLD 17 2022 SALES BY SEGMENT


9 2022 Q4 MARKET REPORT Closed Sales by Quarter 20 40 60 Q1 Q2 Q3 Q4 2021 2022 Average vs Median Sales $1.07M $1.43M $1.8M Q4 2021 Q1 2022 Q2 2022 Q3 2022 Q4 2022 Average Median Days on Market 10 20 30 40 50 Q4 2021 Q1 2022 Q2 2022 Q3 2022 Q4 2022 Months of Available Inventory 1.25 2.5 3.75 5 Q1 Q2 Q3 Q4 2021 2022 Closed Sales Volume by Quarter $20M $40M $60M $80M Q1 Q2 Q3 Q4 2021 2022 Scotts Valley
SOQUEL MARKET UPDATE
One of the smaller markets, Soquel, saw some of the most volatile activity in the quarter between average and median sale prices due to a few outlier sales on the high end. The average sale price rose 5.72% to $1.73 million while the median price slid 18.8% to $1.3 million. Units sold were cut back a significant 47% from Q3 to just 9 sales in Q4, however this is representative of a more normal Q4 move for this market during the winter holidays. Even with DOM dropping 18% to 27 days, MOI has reached the “balanced” market threshold of 4 months due to the slow sales quarter.

10
831.624.2300 montereycoastrealty.com Dolores and Seventh Carmel-by-the-Sea
2022 SALES BY SEGMENT 2% 12% 78% 8% <$1M | 4 $1M-2M | 39 $2M-3M | 6 $3M-5M | 1 $5M+ | 0 SALES VOLUME $15.56M 44% vs Q3 2022 10% vs Q4 2021 5.72% vs Q3 2022 10.0% vs Q4 2021 $1,729,111 18% vs Q3 2022 21% vs Q4 2021 27 DAYS ON MARKET AVERAGE SELLING PRICE 47% vs Q3 2022 no change vs Q4 2021 UNITS SOLD 9


11 2022 Q4 MARKET REPORT Closed Sales by Quarter 10 20 30 Q1 Q2 Q3 Q4 2021 2022 Average vs Median Sales $1.13M $1.57M $2M Q4 2021 Q1 2022 Q2 2022 Q3 2022 Q4 2022 Average Median Days on Market 8 16 24 32 40 Q4 2021 Q1 2022 Q2 2022 Q3 2022 Q4 2022 Months of Available Inventory 1 2 3 4 Q1 Q2 Q3 Q4 2021 2022 Closed Sales Volume by Quarter $15M $30M $45M $60M Q1 Q2 Q3 Q4 2021 2022 Soquel

2022 Q4 MARKET REPORT Brian Pybas REALTOR® 831.594.9402 Brian@MontereyCoastRealty.com DRE#02003077


