Scotts Valley Soquel
2022 Q3 MARKET REPORT Aptos
831.624.2300 montereycoastrealty.com Dolores and Seventh Carmel-by-the-Sea
drop in sale prices for the quarter is exaggerated by last quarters jump to $2 million and $1.7 million for average and median sale prices, respectively. When compared year over year, Aptos is still up nearly 17% from Q3 2021. The real story of the market “normalization” is told through the number of sales and days on market. Number of sales is down 19% from Q2 to just 66, while days on market have almost doubled over Q2 to 30 days. Months of inventory has continued to increase to 2.2 months at the end of the quarter but is still within the range of a sellers’ market.

831.624.2300 montereycoastrealty.com Dolores and Seventh Carmel-by-the-Sea 2 APTOS MARKET UPDATE The
SALES VOLUME $121M 27% vs Q2 2022 13% vs Q3 2021 10.7% vs Q2 2022 16.9% vs Q3 2021 $1,832,240 19% vs Q2 2022 26% vs Q3 2021 UNITS SOLD 66 88% vs Q2 2022 25% vs Q3 2021 30 DAYS ON MARKET 2.6% 4% 21% 59% 13% <$1M | 26 $1M-2M | 114 $2M-3M | 40 $3M-5M | 8 $5M+ | 5 AVERAGE SELLING PRICE YTD SALES BY SEGMENT


3 2022 Q3 MARKET REPORT Closed Sales by Quarter 20 40 60 80 100 Q1 Q2 Q3 Q4 2021 2022 Average vs Median Sales $1.53M $1.82M $2.1M Q3 2021 Q4 2021 Q1 2022 Q2 2022 Q3 2022 Average Median Days on Market 7.5 15 22.5 30 Q3 2021 Q4 2021 Q1 2022 Q2 2022 Q3 2022 Months of Available Inventory 0.75 1.5 2.25 3 Q1 Q2 Q3 Q4 2021 2022 Closed Sales Volume by Quarter $43M $85M $128M $170M Q1 Q2 Q3 Q4 2021 2022 Aptos
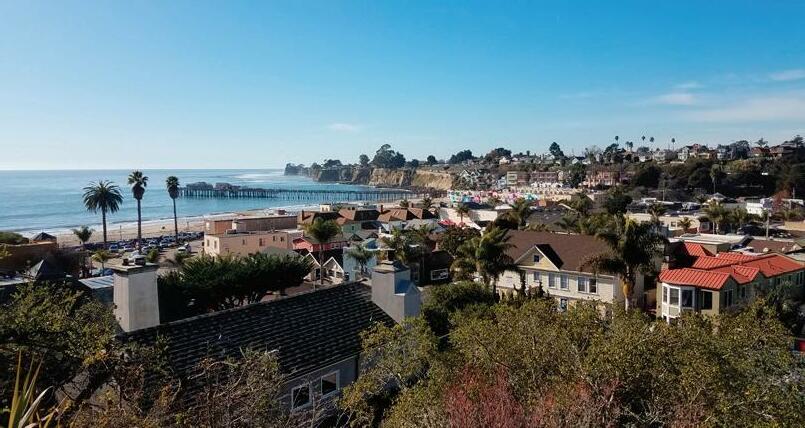
Average sale price has remained consistent in the $1.8 million range throughout the year and is flat from Q2 while only rising 3.9% year over year. The number of sales has also remained consistently low throughout 2022 and finished with 11 for Q3. This puts the Capitola market on track for its lowest number of sales since 2011. Days on market have been quite volatile quarter to quarter during 2022, this time dropping from 39 in Q2 to 23 in Q3. In contrast to the reduction in days on market, Capitola finished Q3 with 4 months of inventory. This is the first market in Santa Cruz County to reach the “balanced” market threshold of 4 months.

831.624.2300 montereycoastrealty.com Dolores and Seventh Carmel-by-the-Sea 4 CAPITOLA MARKET UPDATE
SALES VOLUME $20.75M 22% vs Q2 2022 36% vs Q3 2021 AVERAGE SELLING PRICE .1% vs Q2 2022 3.9% vs Q3 2021 $1,886,727 22% vs Q2 2022 39% vs Q3 2021 UNITS SOLD 11 41% vs Q2 2022 92% vs Q3 2021 23 DAYS ON MARKET YTD SALES BY SEGMENT 6% 16% 74% 3% <$1M | 1 $1M-2M | 23 $2M-3M | 5 $3M-5M | 2 $5M+ | 0


5 2022 Q3 MARKET REPORT Capitola Closed Sales by Quarter 5 10 15 20 Q1 Q2 Q3 Q4 2021 2022 Average vs Median Sales $1.47M $1.68M $1.9M Q3 2021 Q4 2021 Q1 2022 Q2 2022 Q3 2022 Average Median Closed Sales by Quarter 5 10 15 20 Q1 Q2 Q3 Q4 2021 2022 Months of Available Inventory 1 2 3 4 Q1 Q2 Q3 Q4 2021 2022 Closed Sales Volume by Quarter $10M $20M $30M $40M Q1 Q2 Q3 Q4 2021 2022
Average selling price has continued its slide from the peak in Q1 to $1.678 million in Q3. This is down another 5.5% from Q2, though still shows a 4.6% appreciation year over year. At 118, units sold has dropped 16% from Q2 and 28% from Q3 2021. Days on market sits at 23 for the quarter, up 77% from Q2 and 44% from Q3 2021, but remains relatively short when compared to a normal market. Santa Cruz is one of the few markets to show reduced inventory at the end of the quarter, moving from 2.2 months at the end of Q2 to 1.8 months for Q3.

831.624.2300 montereycoastrealty.com Dolores and Seventh Carmel-by-the-Sea 6 SANTA CRUZ MARKET UPDATE
1.1% 7% 11% 71% 10% <$1M | 34 $1M-2M | 254 $2M-3M | 41 $3M-5M | 24 $5M+ | 4 SALES VOLUME $198M 20% vs Q2 2022 24% vs Q3 2021 5.5% vs Q2 2022 4.6% vs Q3 2021 $1,678,097 77% vs Q2 2022 44% vs Q3 2021 23 DAYS ON MARKET AVERAGE SELLING PRICE 16% vs Q2 2022 28% vs Q3 2021 UNITS SOLD 118 YTD SALES BY SEGMENT


7 2022 Q3 MARKET REPORT Closed Sales by Quarter 63 127 190 Q1 Q2 Q3 Q4 2021 2022 Average vs Median Sales $1.13M $1.57M $2M Q3 2021 Q4 2021 Q1 2022 Q2 2022 Q3 2022 Average Median Days on Market 5 10 15 20 25 Q3 2021 Q4 2021 Q1 2022 Q2 2022 Q3 2022 Months of Available Inventory 0.5 1 1.5 2 2.5 Q1 Q2 Q3 Q4 2021 2022 Closed Sales Volume by Quarter $80M $160M $240M $320M Q1 Q2 Q3 Q4 2021 2022 Santa Cruz
Scotts
Valley is another market where sale prices peaked in Q1 and are now down another 12.7% from Q2 to $1.437 million in Q3. Despite this retraction for two consecutive quarters, it is still an 8.5% improvement year over year from Q3 2021. There were 27 units sold for the quarter, down 36% from Q2 and 40% from Q3 2021, and are unusually low for a normally busy quarter in this market. Days on market now sit at 40 days, a 186% increase from 14 in Q2, and the first time this number has even been above 30 in the last 2 years. As expected in relation to some of these other numbers, months of inventory continued its rise to hit 2.8 months at the end of Q3.

831.624.2300 montereycoastrealty.com Dolores and Seventh Carmel-by-the-Sea 8 SCOTTS VALLEY MARKET UPDATE
1% 8% 81% 9% <$1M | 8 $1M-2M | 70 $2M-3M | 7 $3M-5M | 1 $5M+ | 0 SALES VOLUME $38.8M 44% vs Q2 2022 35% vs Q3 2021 12.7% vs Q2 2022 8.5% vs Q3 2021 $1,437,296 186% vs Q2 2022 150% vs Q3 2021 40 DAYS ON MARKET AVERAGE SELLING PRICE 36% vs Q2 2022 40% vs Q3 2021 UNITS SOLD 27 YTD SALES BY SEGMENT


9 2022 Q3 MARKET REPORT Closed Sales by Quarter 20 40 60 Q1 Q2 Q3 Q4 2021 2022 Average vs Median Sales $1.07M $1.43M $1.8M Q3 2021 Q4 2021 Q1 2022 Q2 2022 Q3 2022 Average Median Days on Market 8 16 24 32 40 Q3 2021 Q4 2021 Q1 2022 Q2 2022 Q3 2022 Months of Available Inventory 0.75 1.5 2.25 3 Q1 Q2 Q3 Q4 2021 2022 Closed Sales Volume by Quarter $20M $40M $60M $80M Q1 Q2 Q3 Q4 2021 2022 Scotts Valley
Average sale price in Soquel has seen a slight increase of 2.7% from Q2 to $1.635 million after experiencing some drastic shifts in both directions the last few quarters. While the number of sales for the quarter is up to 17 from 11 in Q2, this is still low and sets Soquel up for its slowest year since number have been tracked back to 2010. Days on market have jumped from 9 in Q2 to 33 in Q3, and despite the volatile nature of this statistic in the market, is unusual for a normally strong quarter. In contrast to the other stats in this market, months of inventory has decreased at the end of Q3 back to 2 months from 3 months the previous quarter.

831.624.2300 montereycoastrealty.com Dolores and Seventh Carmel-by-the-Sea 10 SOQUEL MARKET UPDATE
YTD SALES BY SEGMENT 12% 85% 2% <$1M | 1 $1M-2M | 35 $2M-3M | 5 $3M-5M | 0 $5M+ | 0 SALES VOLUME $27.8M 59% vs Q2 2022 45% vs Q3 2021 2.7% vs Q2 2022 2.6% vs Q3 2021 $1,635,618 267% vs Q2 2022 120% vs Q3 2021 33 DAYS ON MARKET AVERAGE SELLING PRICE 55% vs Q2 2022 43% vs Q3 2021 UNITS SOLD 17


11 2022 Q3 MARKET REPORT Closed Sales by Quarter 10 20 30 Q1 Q2 Q3 Q4 2021 2022 Average vs Median Sales $1.13M $1.57M $2M Q3 2021 Q4 2021 Q1 2022 Q2 2022 Q3 2022 Average Median Days on Market 8 16 24 32 40 Q3 2021 Q4 2021 Q1 2022 Q2 2022 Q3 2022 Months of Available Inventory 0.75 1.50 2.25 3.00 Q1 Q2 Q3 Q4 2021 2022 Closed Sales Volume by Quarter $15M $30M $45M $60M Q1 Q2 Q3 Q4 2021 2022 Soquel


2022 Q3 MARKET REPORT Brian Pybas REALTOR® 831.594.9402 Brian@MontereyCoastRealty.com DRE#02003077


