


INSIGHT September 2023 – Transportation Market Overview September 2023 MODE Insight TRUCKLOAD INTERMODAL LTL INTERNATIONAL ©2023 MODE Global, LLC MODE Public PARCEL
Rejections, Rates and Fuel On the Rise

Key indicators of the TL market, FreightWaves Outbound Tender Rejection (OTRI), DAT National Spot Rates, and Internet Truck Stop (ITS) National Spot Rates are all showing slow but steady increases
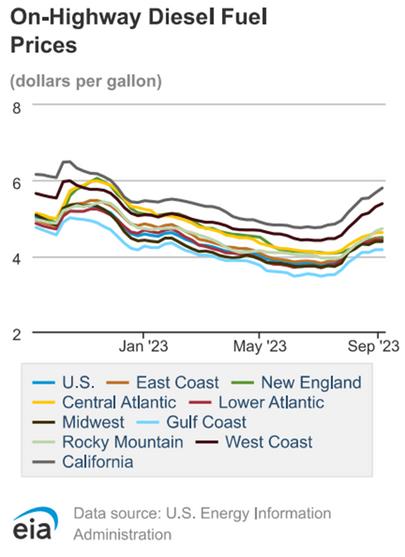

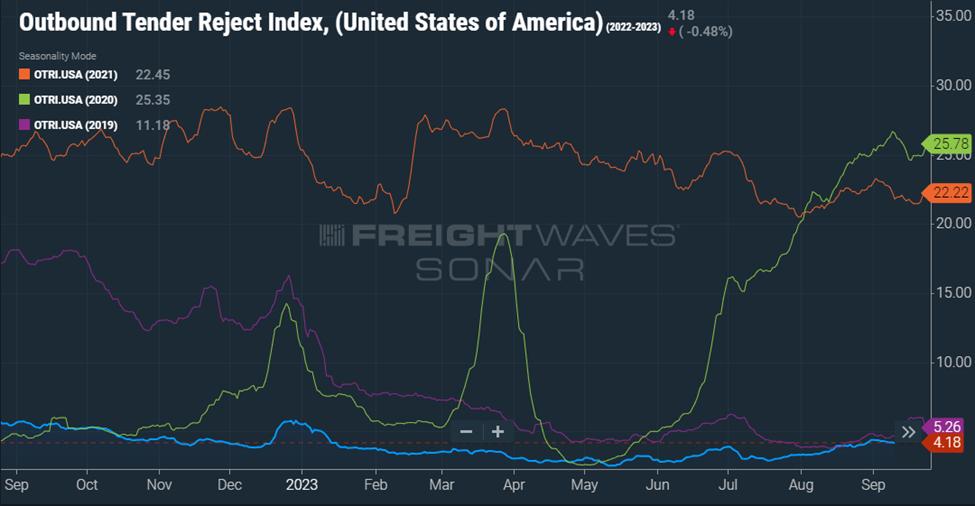
The OTRI, which measures carrier tender rejections across some of the largest TMS providers in the transportation industry, has been trending upward. We are now over 4% National OTRI, nearly double what we saw during late Q2 and early Q3. That being said, OTRI isn’t showing enough of an increase to cause significant macro-market shifts that have a meaningful impact across the entire TL market.

September 2023 MODE Insight
TRUCKLOAD
National Truck Rates Outlook
DAT National Spot Rates and Internet Truck Stop (ITS) National Spot Rates are valuable macro-market indicators of pricing trends. We are continuing to see upward trends across both sources. These upward trends are correlated to the increase in OTRI and the increase in National Diesel Fuel Averages.
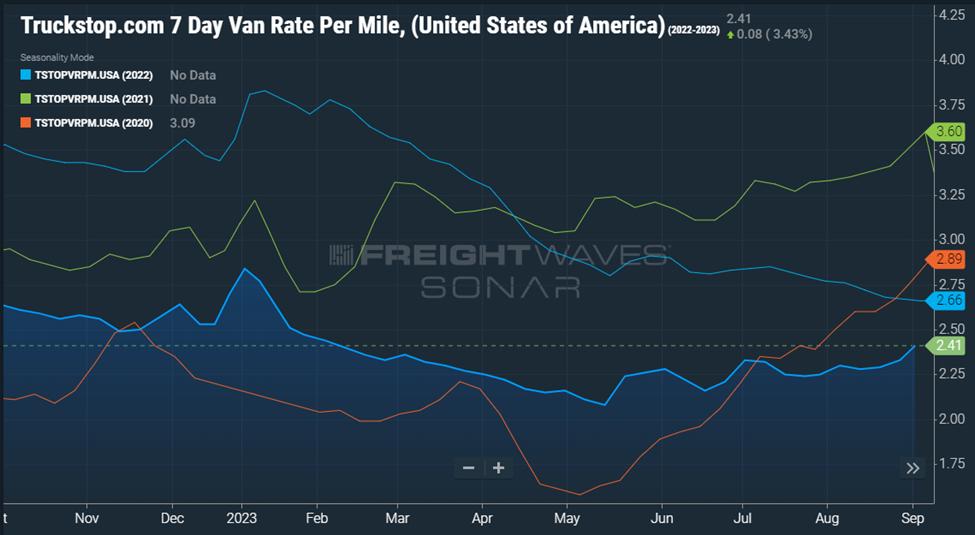
DAT is reporting a 1% increase in National Dry Van Spot Rates from August to September. ITS is reporting a 6% increase in National Dry Van Spot Rates from August to September.
These macro-level trends are good overall indicators of the market but there can be larger variability on market-specific inbound and outbound rates.


TRUCKLOAD UPDATE $208$208$206 DRY VAN $2.10 AUG JUN JUL $2.50$2.50$2.60$2.52 AUG JUN JUL FLATBED $250$251 $2.48$2.43 REEFER AUG JUN JUL
SEP est SEP est SEP est
September 2023 MODE Insight
INTERMODAL

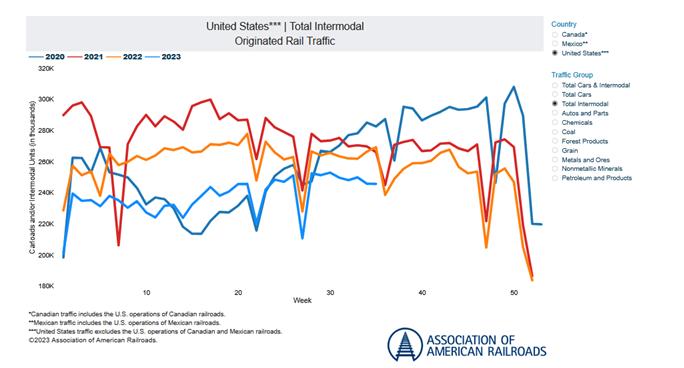
Current Market
Norfolk Southern (NS) has made an $8 million investment in DrayNow Inc , provider of a real-time geo-tracking and ETA platform that integrates directly with TMS (transportation management system) software via EDI and API to connect small fleet owner-operators with brokers who need first- and last-mile intermodal drayage service. NS’s investment in DrayNow involves a partnership “to improve the customer and drayage driver experience, enhance supply chain transparency, and increase network fluidity … through an app that provides customers with real-time shipment tracking and document capture of drayage shipments.”
Eastern Class 1 railroad CSX and the Georgia Ports Authority offer an intermodal service that will run seven days a week and provide a direct rail connection between the Port of Savannah and CSX’s intermodal terminal in Rocky Mount, North Carolina. The service, which will have a ship-to-shore time of about three days, connects GPA’s Mason Mega Rail terminal in Savannah with the CSX Carolina Connector (CCX) terminal in Rocky Mount.
In September, intermodal leadership will attend the Intermodal Association of North America (IANA) Annual Expo Conference. IANA is the only organization representing the combined interests of the intermodal freight transportation industry. “At Intermodal EXPO, you’ll find the widest range of providers and solutions, the industry’s best known thought leaders, and its most relevant discussions Topics to be tackled include terminal design, transloading, driver productivity, sustainability, regulatory risk and chassis provisioning – just to name a few” according to IANA.


September 2023 MODE Insight
With mid-third quarter LTL carrier reports coming out, SAIA, XPO and ODFL are all reporting positive impacts on shipments and tonnage in the wake of Yellow shutting down and a soft U S economy While all three LTL carriers cited a decrease in weight per shipment due to changes in mix, SAIA reported a 14.2% increase in shipments and a 6.8% increase in tonnage YoY for August. XPO reported its second straight month of YoY increases in shipments and tonnage as well, coming in up 8.1% and 3.1%, respectively. While ODFL posted a YoY decline in both categories for August, they did see a significant improvement versus July and revenue per day was down just -1.4% YoY in August compared to a -13.3% decline in July. ABF is also reporting YoY volume increases for the last two months – up ~20% with core accounts since June but has seen tonnage declining through Q3.


Volumes Shifting Post Yellow Shutdown Demand

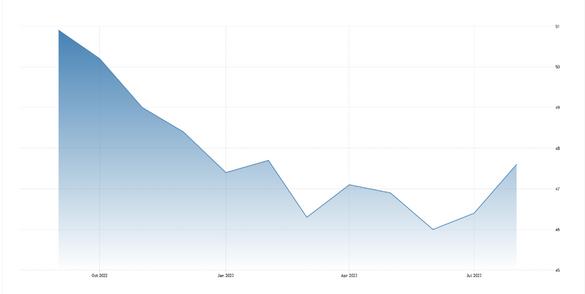
While the LTL market continues to see demand increasing from sectors such as retail, industrial manufacturing has historically been a good indicator of how the overall LTL market looks. Although some LTL carriers have benefited from changing market dynamics, U.S. manufacturing has contracted since November of 2022, reflecting a softening within the LTL market.

The below ISM PMI chart shows a ratio of 47.6 for August, which is an improvement since June’s ratio of 46 –signaling some recovery as of late; however, we are still below the neutral threshold of 50 (below 50 is contracting and above 50 is expansion).
LTL September 2023 MODE Insight
Rates & Service

As depicted in the chart below, we were on a rate roller coaster throughout the first half of 2023 with LTL rates selectively rising and dropping as carriers aimed to balance capacity flowing throughout their networks. Leveling off began in Q3, with rate increases in late July/early August. It’s expected that LTL rates will increase through September, likely in the neighborhood of mid-single digits to low-double digits. In most cases, you can expect carriers to take heftier increases on unfavorable freight profiles and instances where accessorials are required. Don’t be surprised when carriers aggressively target freight, meeting their desired freight profiles or moving within backhaul lanes and markets.

Some LTL carriers are reporting market-based capacity challenges stemming from the recent industry consolidation. You can expect LTL carriers (mainly national) to continue with selective customer capacity allocations, instituting geographical/location-based embargoes and high-cost surcharges to control freight flows as they continue to manage through volume changes post Yellow. It is recommended you communicate proactively with your carriers on your capacity strategy and service needs and build in some lead time on transit.


LTL UPDATE
September 2023 MODE Insight
Parcel Conditions & Future Expectations


U.S. Macro Environment: U.S. Macro environment will drive costs up as fuel and labor remain elevated. However, inflation is expected to stabilize at 4%
Outcome of UPS/Teamsters Negotiations: Teamsters and UPS have reached a final agreement. UPS costs will increase with higher concessions to wages Recovery costs are expected to pass to shippers and, ultimately, consumers
FedEx Operational Change: FedEx to combine express and ground networks to increase efficiency and decrease costs FedEx expected to add the savings to overall margins and maintain established rates for shippers.
Competitive Environment: USPS is launching a new Ground Advantage Service as a direct competitor to more lanes and weight breaks with FedEx and UPS. Amazon is increasing shipping within its own network and decreasing reliance on UPS, increasing the overall competition among the carriers.
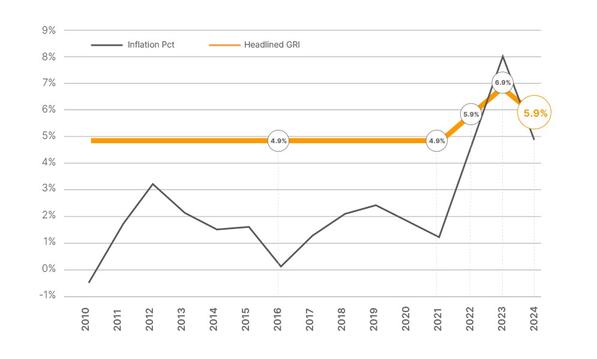
Historical Trends in Price Increases: The past 10 years have shown an increase in surcharges for residential shipments and larger-sized packages. There has been a recent increase in the delivery area surcharge and the introduction of the remote delivery surcharge, all of which are slated for an increase with the impending peak season and new GRI.
FedEx/UPS GRI 2024: Carriers matched at 5.9% increase. UPS’s increase will take effect December 26, 2023, while FedEx’s will take effect January 1, 2024.
September 2023 MODE Insight
PARCEL
INTERNATIONAL

Key Market Themes in September


Supply: Fewer blank sailings in September thus far but tender rejections on the rise
Demand: Asia-U.S. arrivals in August strong but falling again into September
Operational: Weather – Multiple typhoons in Asia and hurricane season
U.S. Import Demand Continues to Fall
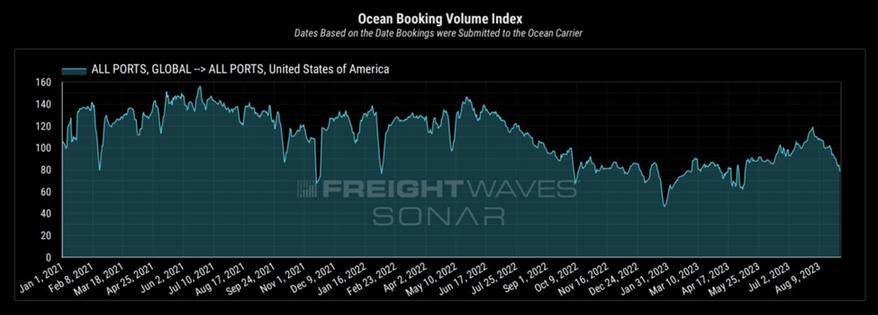
As expected, volume demand for ocean imports continued to fall again in September August was the strongest Asia to U S volume in more than a year; however, recent data from SONAR’s Container Atlas shows new booking volumes dropping over 35% from their peak reached on August 1, a key indicator that U.S. import demand is rapidly deteriorating. One interesting point to watch is while U.S. importers cater to the holiday market across many verticals, with goods typically shipping in September and October, the graph below shows September forward bookings to be weak and may indicate any hope for a holiday spike is unlikely.
Market Outlook and Forecast
Rates will likely continue to soften through the first half of September but may stabilize in late September if carriers increase blank sailings, as expected. As a result of softer market conditions and overcapacity in September, as well as weather-related delays, carriers could increase the number of blank sailings toward the end of the month. In the meantime, rates to U.S. East Coast ports are projected to drop moderately toward the end of the month. Asia-U.S. West Coast rates will likely also fall similarly by the end of the month.
Blank sailings, which reached a summer peak of 19% of trade capacity in mid-August, will remain around the 1013% range for most of September, representing an additional 41,000 TEU per week in September versus mid-
August. Even if September volumes remain consistent, the additional capacity through fewer blank sailings will result in lower average load factors, and consequently a higher frequency of rate reductions. However, space could get tight toward the end of the month, especially if blanks return to August levels.
September 2023 MODE Insight
Downward Pressure on Spot Market Rates
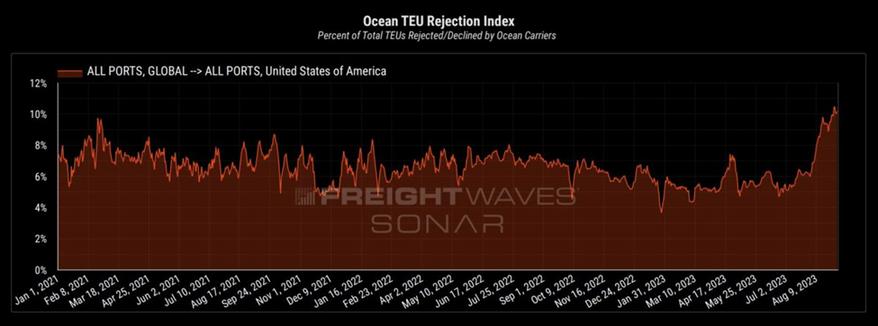
This significant drop in future demand is certainly increasing the downward pressure on spot rates. With August and September GRIs already rolling back to previous levels (or even below), ocean carriers have been pulling out all the stops to help offset this downward pressure. Carriers have gone beyond blank sailings and are rejecting a record number of U.S.-bound container bookings in a last-ditch effort to hold spot rates higher.
The graph above shows the sharp increase in tender rejections (and rolled cargo) by ocean carriers in all global lanes importing to the U.S. trade. By increasing the use of booking rejections (and rolled cargo), carriers can manipulate the velocity of containers departing from their origin This, in turn, is creating a false sense of a market that is tightening in terms of capacity The result the carriers are looking for is a continued ability to hold spot rates higher or implement increases. Whether or not that will be a successful strategy is hard to predict, but it is clear that if demand/volumes continue to decline (and there are no signs to say otherwise), it will be increasingly more work for the carriers to implement additional increases.
Weather Impacting the Overall Supply Chain


Over the last few weeks, two typhoons in the Asia-Pacific region have been disrupting departure schedules in late August and early September. Typhoon Saola impacted operations in South China (Hong Kong, Shenzhen, Xiamen), forcing terminals to be closed for several days late last week. Meanwhile, Typhoon Haikui swept across Taiwan in the first week of September and rolled through the Taiwan Strait, further disrupting departures and transits
Early-season hurricanes have already started to cause disruptions to vessel schedules and operations in the U.S. Tropical Storm Harold hit South Texas at the end of August, impacting the Port of Houston, and Hurricane Lee is currently a severe threat to the East Coast and Florida as a potential Category 4 storm.
INTERNATIONAL UPDATE September 2023 MODE Insight


www.modeglobal.com © 2023 MODE Global. All Rights Reserved. 14785 Preston Road, Ste 850, Dallas, TX 75254


