



The Outbound Tender Rejections Index (OTRI) continues to closely track 2019 and 2024 patterns, fluctuating between 5-6% for August These levels continue to show a shipper friendly market and don’t suggest a market flip during 2025.

DAT’s National Van Spot Linehaul RPM rose 1% year-over-year in August; however, lower fuel prices limited overall revenue growth, resulting in only a 0.8% year-over-year increase in all-in RPM. It appears that the changes to ELP have not created enough capacity volatility to disrupt the truckload market. Transportation costs for shippers should closely follow 2024 trends for the remainder of 2025


FTR Intelligence maintains its outlook for a stable market through the rest of 2025 and into 2026. While linehaul rates are still projected to grow, the pace continues to slow compared to previous forecast. With fuel surcharges trending downward, gains in base rates may be offset, keeping all-in RPM flat or slightly below prior-year levels.


Source: ftrintel.com
Source: DAT.com/trendlines


BNSF and CSX announced new joint interline services to convert over-the-road freight to intermodal. New domestic lanes include:
Charlotte and Jacksonville to/from Southern California
Phoenix to/from Atlanta
International services between the Ports of New Jersey and New York and Norfolk, Virginia, and Kansas City
CSX will reopen the Baltimore Howard Street tunnel after a six-month construction project, returning traffic to the Baltimore Seagirt ramp. This will allow for double-stacking of containers after final construction on several other bridges
Union Pacific traffic between the new Kansas City terminal and Southern California will change from ICTF to City of Industry, which will allow for better service, costs and dray efficiencies. Union Pacific has also launched a new truck-like service from their Inland Empire terminal in Fontana, California, to Chicago with a 20% faster service.
Intermodal spot rates out of Southern California remain high with all intermodal providers having declared peak conditions with allocation and surcharges. 2025 domestic intermodal contract rates are expected to see approximately 1.7% increases year over year and projections for 2026 domestic intermodal rates are an increase of 2 2%

Outside of Southern California, intermodal capacity is abundant in all other areas. Gate reservations, dray power and containers are easily obtainable and are expected to not see any shortages.


Here are links to some top stories in the industry for you to check out:
Falling U.S. LTL volumes putting pressure on margins, rates
Dayton Freight expands terminal network further east
Saia, LTL carriers still waiting for cycle turn
ArcBest cuts Q3 margin outlook due to soft demand, higher costs
As we move into September, the LTL market remains in a holding pattern, with carriers still waiting for a clear cycle turn. While some segments showed modest improvement over the summer, recent data points highlight that conditions are still uneven Saia, for example, reported tonnage sliding back into negative territory in August after posting a small year-over-year gain in July This reflects the broader challenge many carriers face as they lap tough prior-year comps and navigate a sluggish macro backdrop
The manufacturing sector which drives nearly two-thirds of LTL demand remains in contraction The August Purchasing Managers’ Index registered below the neutral 50 mark yet again, extending the trend of weakness that has dominated much of the past three years. New orders did edge back into expansion territory, offering a potential leading indicator for improvement, but the index hasn’t reached levels that typically signal a sustained upturn.
Despite the volume pressure, pricing discipline remains intact. Carriers are maintaining yield protection strategies, leaning on accessorial enforcement, density-based billing and selective freight acceptance to defend margins. Investments in efficiency and digital tools also continue, as carriers look to offset softer demand with tighter cost control.
Fuel costs, which had been easing through much of the summer, ticked higher at the start of September. Combined with wage inflation and ongoing labor considerations, this adds to the pressure on carriers already balancing weaker top-line volumes
Overall, September’s picture is one of cautious patience The market has yet to show a decisive rebound, but carriers are managing through with disciplined pricing, operational efficiencies and a readiness to respond quickly should manufacturing and retail demand begin to strengthen into Q4.

Source: Commercial Carrier Journal (CCJ), “NMFTA launches new digital standard for billing transparency,” CCJ Staff, published Aug. 15, 2025 (ccjdigital.com)
The National Motor Freight Traffic Association’s (NMFTA) Digital LTL Council has introduced a new Preliminary Freight Charges (PFC) API Standard designed to bring greater billing transparency across the LTL industry This marks a major step in the Council’s roadmap to digitize the shipment lifecycle from quote to cash.
The PFC API provides proactive notifications and real-time visibility into freight bill charges, alerting stakeholders to potential billing discrepancies such as reweighs, reclassifications, or accessorial fees before final invoicing. By addressing billing issues earlier, the API aims to reduce disputes, improve payment accuracy and streamline billing processes
Keith Peterson, NMFTA’s VP of Operations, noted that this standard “empowers shippers, carriers and third-party logistics providers to address billing issues proactively,” helping minimize surprises and strengthen trust among stakeholders.
The PFC API is part of a broader initiative to create standardized digital communication protocols across the LTL industry. The roadmap includes seven operational APIs spanning rate quotes to cargo claims and two administrative APIs for document retrieval and carrier route guides Kelly Koller of Estes Express emphasized that standardization allows participants to build integrations once and scale them across all partners, reducing redundancy and accelerating digital adoption.
Early visibility into billing changes will allow us to resolve issues before they impact customers. By adopting and aligning with these new API standards, brokers can reduce dispute cycles, build stronger trust with carrier partners, and provide a more seamless customer experience. Moving forward, we’ll continue supporting shippers with classing, pallet optimization and KPI reviews to capture new opportunities. At the same time, adjusting our carrier mix and pricing strategies will help reduce cost exposure and keep MODE competitive in this evolving digital landscape.


The ISM U.S. Manufacturing PMI rose to 48.7 in August 2025 from 48.0 in July, though it remained below market expectations of 49.0. The reading indicated a sixth consecutive month of contraction, as a sharp decline in production (47.8 versus 51.4) was only partially offset by a rebound in new orders (51.4 versus 47.1). Employment continued to contract, albeit at a slightly slower pace (43 8 versus 43 4) Meanwhile, customers’ inventories (44.6 versus 45.7) and order backlogs (44.7 versus 46.8) fell more rapidly, signaling weaker demand conditions. Input price inflation moderated to 63.7 from 64.8, though it remained elevated overall. Survey respondents consistently highlighted tariffs as a headwind, citing higher costs, supply chain disruptions and diminished competitiveness.

Source: Trading Economics & Federal Reserve
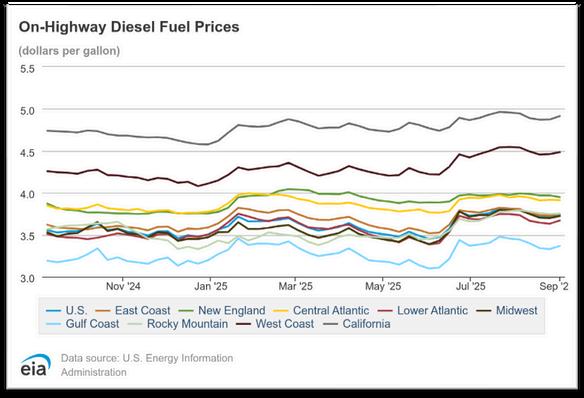
The U S national average cost per gallon for on-highway diesel in August 2025 came in at $3.708, which is $0.097 (2.7%) lower than July’s average of roughly $3.805. August 2024’s average was approximately $3.651, making August 2025 about $0 057 (1 6%) higher yearover-year. As of the first week of September 2025 (week ending September 1, 2025), the national average stands at $3.734 per gallon, which is $0.026 (0.7%) higher than the end of August.


Volume: August import volumes slipped downward again September outlook is mixed and dependent on forward orders prior to Golden Week holiday in China.
Rates: GRIs announced and implemented on September 1– rates already feeling downward pressure.
Capacity: Blank sailings increasing again and carriers suspending service calls. Capacity is available even as carriers manipulate sailings and services.
Operational: Golden Week holiday in China on October 1, which means an eight-day holiday shut down for most Chinese factories’ export activities.
Average FAK rates closing out August reached their lowest levels for the month since 2019. With load factors being elevated by capacity cuts (blank sailings), carriers in September are seeking substantial rate increases effective September 1.
Container rates in the Asia-to-U.S. trade routes have continued to trend downward following a July surge fueled by shippers frontloading imports ahead of tariff increases. The most recent additional 90-day extension of the tariff truce between China and the United States into November will likely not generate a similar import surge according to most trade analysts.
Asia-to-U S spot rates have fallen 60% to 70% in an almost uninterrupted slide since that early volume surge Rates to the West Coast decreased 10% to $1,744 per FEU last week – the lowest level for this lane since December 2023 East Coast prices fell 21% to $2,733 per FEU for a 34% slide to close out August The four weeks of September will offer the ocean carriers their last shot this year to gain back at least some of the recent decline in rates. Starting October 1, Chinese factories will close for eight days for Golden Week.
Ocean carriers implemented GRIs of $800-$900 per FEU, effective September 1 with the goal of slowing the rate erosion of the last two months. Container spot rates from Asia to the U.S. West Coast are currently about $2,000 per FEU, according to various indexes, with the Shanghai Shipping Exchange registering a 65% drop since June. It is also reported that the ocean carriers have opted not to apply the traditional Peak Season Surcharge (PSS) on long-term rates. This would be another indicator that volumes are currently not likely trending upward enough to sustain a PSS.

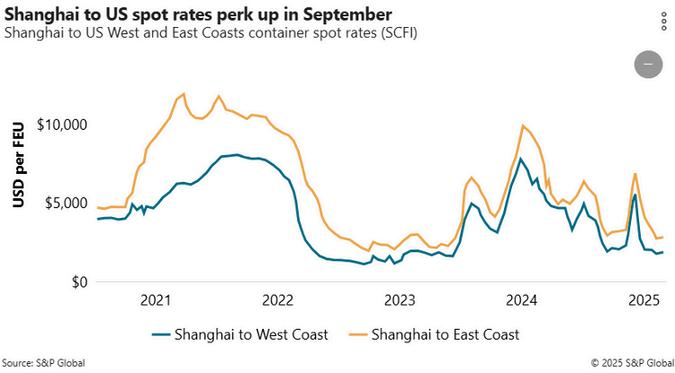
Daily spot rates jumped up $400-$500 per FEU on both lanes, most likely reflecting the carrier introduction of September GRIs; however, with demand and space availability as it stands now, it will be difficult for carriers to sustain these increases even as more blanked sailings are being announced ahead of Golden Week (October 1 –October 8)
During the second half of August, bookings for Asia shipments into the U.S. were down overall from the same time last year. The SONAR index of import bookings (in TEUs) to U.S. ports showed ocean volumes up 17% in the last week of August; however, in total, this is a decrease of 9.35% from July and 18% from the same period a year ago. A notable exception is Vietnam, where volumes are reported up about 4.8% year over year.


Industry experts and analysts are split on whether there is any boost in cargo or booking volumes on the way, which typically happens prior to Golden Week. September bookings for the Asia-to-U.S. trade so far are lower than last year.
Ocean carriers and forwarders believe that, due to both plentiful capacity and favorable rates, retailers should be incentivized to ship what they can this month before the Golden Week holiday. Typically, there is a volume increase moving into September, but at this point, that does not appear to be the case.

The National Retail Foundation (NRF) has a September volume prediction of 1.83 million TEU, which represents a 19.5% year-over-year decrease. The only wild card is whether some U.S. importers are going to push forward any existing orders in mid-September ahead of the Golden Week shutdown in China. Most analysts feel there are few indications in early September to support a significant volume spike.

Over the last 30-60 days, ocean carriers have once again worked to create an artificial capacity situation by deploying more blank sailings in the U.S.-to-Asia trade lane. The primary reason behind this is to try to slow the downward slide in rates. In addition to increased blank sailings, ocean carriers have also taken more direct action by suspending or redeploying several key service strings.
MSC has suspended its Asia-West Coast ‘Pearl’ service and also downsized its Asia-East Coast ‘America’ service Niche ocean carrier CU Lines has all out canceled its TP-1 service, which connects China with the West Coast ONE has announced the merger of the Transpacific leg of its MD2 pendulum service with its existing AG1 service This “new” service will be rebranded as the Gulf Pacific South 2 (GS2) service
These steps are being taken largely because of the continued global carrier capacity growth in 2025 (and beyond), with an estimated 1.8m TEU of new ships to be delivered still this year – and more coming next year (see chart below).
Container lines plan to inject more capacity in October, adding nearly 100,000 TEUs more than what’s deployed in September, according to eeSea. The share of tonnage deployed on Asia to the U.S. West Coast that was blanked/voided is somewhere near 8.4% for August, and carriers plan to blank a similar proportion of capacity in September and October, although that may move up quickly based on weekly volume forecasts.

At this point, capacity is readily available in most key Asia-to-U.S. trade lanes; however, most analysts and industry experts feel that without a moderate increase in volume from Asia, it is inevitable that a sharp increase in blank/voided sailings will occur in the last quarter of 2025.


