




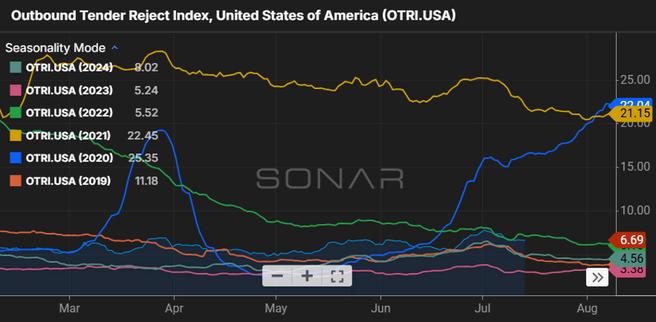
The Outbound Tender Rejections Index (OTRI) continues to closely track 2019 and 2024 patterns, remaining relatively low and indicating that recent English Language Proficiency (ELP) changes have not yet had a meaningful impact on capacity.
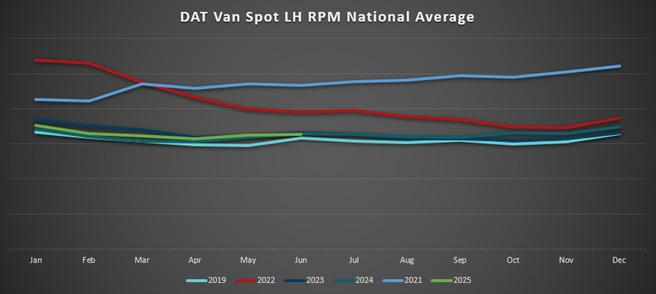
DAT’s National Van Spot Linehaul RPM rose 1% year-over-year in July; however, lower fuel prices limited overall revenue growth, resulting in only a 0.2% year-overyear increase in all-in RPM. This marks the first YoY all-in RPM gain in four months, breaking a three-month streak of declines. If ELP changes continue to have minimal effect on carrier capacity, rates are expected to closely follow 2024 trends for the remainder of the year

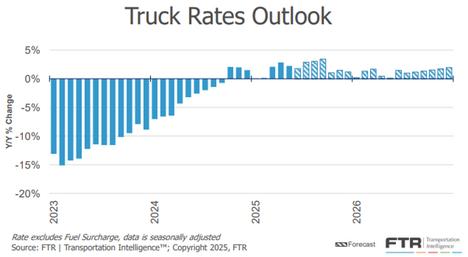
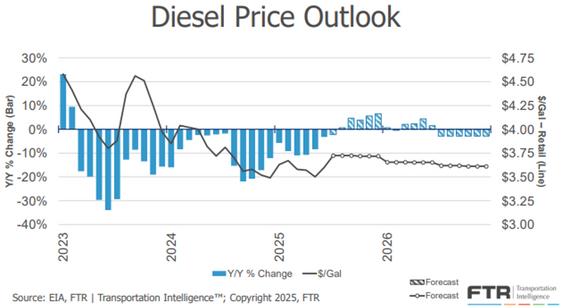
FTR Intelligence maintains its outlook for a stable market through the rest of 2025 and into 2026. While linehaul rates are still projected to grow, the pace has slowed compared with earlier forecasts. With fuel surcharges trending downward, gains in base rates may be offset, keeping all-in RPM flat or slightly below prior-year levels.
Source: ftrintel.com
tightens, but not enough to lift rates
Source: DAT.com/trendlines


With volumes rising and capacity tightening in Southern California, Union Pacific (UP) has declared Southern California a constrained market under the Mutual Commitment Program (MCP). Effective Sunday, August 17, UP will apply a $500 surcharge for aggregate shipments over the surge allowance, and effective August 24, UP will apply a $300 surcharge for MCP shipments above the surge allowance. The surcharges can vary with market demand.
On July 29, Union Pacific announced the purchase of Norfolk Southern (NS). This will establish the first transcontinental railroad in the United States The proposed combination will be filed with the Surface Transportation Board (STB) in October for review and approval. It is estimated that the review process will take 22 months, and if approved, final closing is estimated to be spring of 2027. Until that time, NS and UP will remain separate companies with the same operating structures in place
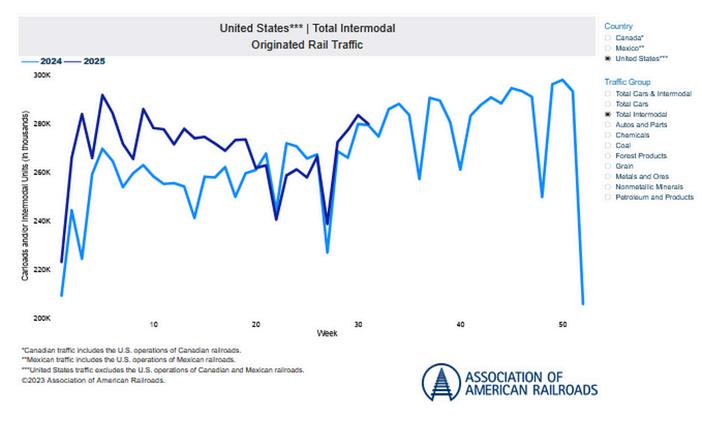
Intermodal spot rates out of Southern California will rise as both Union Pacific and JB Hunt having declared Peak or Constrained with other carriers expected to follow and declare surcharges In other areas around the country, intermodal dray, equipment and gate reservation capacity remain easily obtainable


Here are links to some top stories in the industry for you to check out:
FedEx Freight Gives Shippers ‘More Time’ to Adjust to New LTL Class Rules
LTL Carriers Expanding U.S. Networks Despite Low Freight Demand
ODFL Q2 Profit Slides 16.6% as Market Weakness Persists
A. Duie Pyle Expands Next-day LTL Network with New Ohio-based Service Centers
As we move into August, the LTL market is showing signs of holding its ground after months of softer demand. Overall volumes remain below last year’s levels, which is reflected in some carriers' Q2 results, where tonnage per day fell year-over-year; however, the pace of decline is easing, and certain regions are seeing modest tightening in capacity E-commerce, seasonal retail shipments and select manufacturing sectors like automotive and building materials are helping to offset some of the broader weakness
Retail-driven shipping is slowly picking up as shippers prepare for fall promotions and early holiday demand, adding to baseline volumes; however, the industrial side remains uneven, with many customers taking a cautious approach until there’s more clarity on costs, trade policy and interest rates.
Carriers continue to adjust lane coverage, pricing strategies and service models to protect yield rather than chase low-margin freight. At the same time, investment in digital tools, real-time tracking and routing optimization remains a priority, as does testing alternative-fuel equipment to meet customer and regulatory demands for sustainability.
While the market is not yet in full recovery mode, the slowdown appears to be stabilizing, and many carriers including ODFL, which reported signs of slight improvement in July are approaching the remainder of Q3 with cautious optimism, ready to scale if demand gains momentum heading into peak season.

Source: FreightWaves, “LTL pricing index to hit record high in Q3,” Todd Maiden, published July 15, 2025 (freightwaves.com)
A recent report from FreightWaves highlights that Less-Than-Truckload (LTL) rates are expected to climb to an alltime high in the third quarter of 2025. The TD Cowen/AFS Freight Index shows LTL rate-per-pound surging 65.9% above the January 2018 baseline, up 170 basis points from Q2 and 130 bps above the previous 2022 peak If this forecast holds true, it marks the seventh consecutive year-over-year increase.
Aaron LaGanke, VP of freight services at AFS Logistics, attributes this resilience to “carrier pricing discipline.” He also notes that the upcoming transition of the NMFC to a density-based classification system will give carriers enhanced tools for managing classification and pricing
Despite a 2.9% year-over-year drop in cost per LTL shipment in Q2, shipment weight also fell 5.1%, suggesting that carriers are holding firm on pricing while emphasizing revenue management On a sequential basis, while cost per shipment declined 1.6%, carriers were able to offset headwinds from lower weight (–1.8%) and fuel surcharges (–1.3%) with a longer average haul (+3.6%).
In contrast, truckload (TL) pricing paints a less optimistic picture: the TL rate-per-mile component of the index is forecasted to slip slightly in Q3, perpetuating a ten-quarter slump following its 2022 peak.

Carrier pricing discipline and the NMFC classification shift mean accurate freight details will be more important than ever to avoid reclassifications and unexpected costs With rates holding firm, brokers will need to focus on strategic carrier selection, proactive customer communication and maximizing operational efficiency to protect margins and maintain competitiveness.
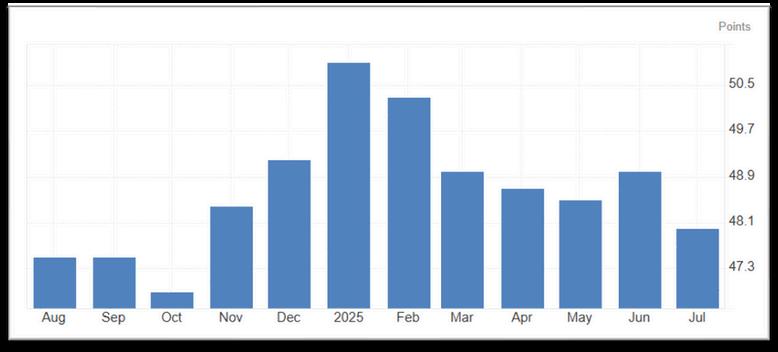
The ISM Manufacturing PMI dropped to 48 in July 2025 from 49 in June, falling short of forecasts for 49.5 and marking the fifth straight month of contraction its lowest level since October 2024. The sharpest declines came from supplier deliveries (45.7 vs. 46.7) and employment (43.4 vs. 45.0). According to Susan Spence, chair of the ISM Manufacturing Business Survey Committee, companies remain focused on managing headcount rather than hiring, reflecting cautious sentiment despite a production uptick. On the brighter side, production grew (51.4 vs. 50.3), and the drops in new orders (47.1 vs. 46.4) and backlogs (46.8 vs. 44.3) slowed. Price pressures eased as the prices index fell to 64 8 from 69 7
Source: Trading Economics & Federal Reserve
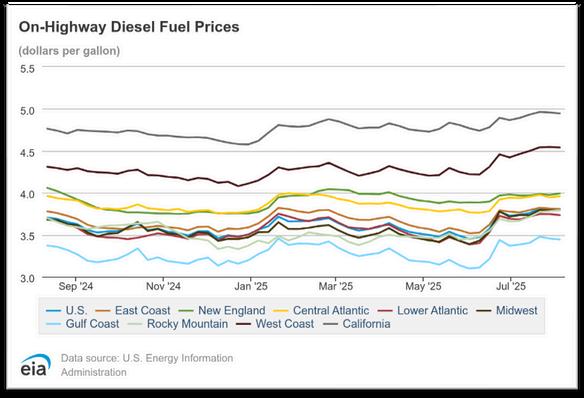
The U.S. national average cost per gallon for on-highway diesel in July 2025 came in at $3 805, which is $0 070 (1 9%) higher than June’s average of roughly $3.735. July 2024’s average was about $3.768, putting July 2025 approximately $0.037 (1.0%) higher year-over-year. As of the first week of August, the national average stands at $3.80 per gallon, a slight decrease of $0.005 (0.13%) from late July.


Volume: July volume surge over previous month driven by tariff concerns and likely some peak season
ordering; volume predictions for rest of 2025 are not optimistic
Rates: Declines in U.S. import rates are slowing but with low demand and extra capacity, more erosion possible and perhaps even some stability
Capacity: Blank sailings increasing again and carriers suspending service calls
Operational: Despite increase in July import volumes at top U.S. ports, transit time delays have increased only modestly

Ocean container spot rates in the Asia-U.S. route slowed their sharp declines that saw an average 53% drop since June to the U.S. East and West coast. Moving into August with volumes and load factors slipping, carriers are again starting to feel some over-capacity concerns. Proposed rate increases on August 1 were mostly not successful.
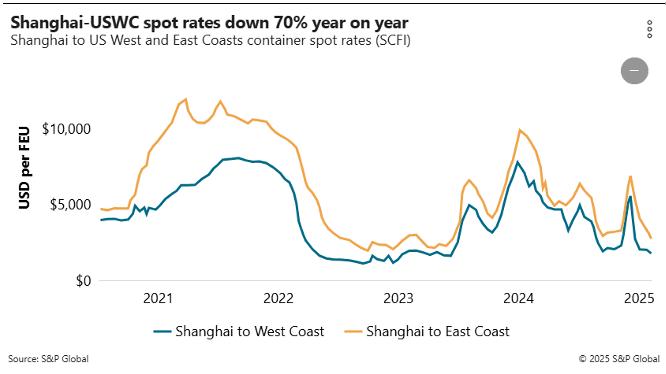
The latest update from Xeneta shows market average spot rates from the Far East to U S West Coast at $2,098 per FEU, down 3% from July 31, and $3,311 to the East Coast, 9% lower in that time
Those declines compared to a 62% decrease to the West Coast since June 1, and 53% to the East Coast since June 15, after falling a further 9% since June 31, to $2,015 per FEU.
The Shanghai Containerized Freight Index (SCFI) has dropped for eight consecutive weeks. Overall spot rates are down about 70% YoY.
As of August 10, the Freightos-Baltic freight rate index for Asia to U.S. West Coast dropped about $200 now down to an average of $1,941 per FEU. This marks the first time that this index has been below $2000/FEU since the end of 2023.

Although ocean carriers may attempt to impose more general rate increases (usually the first and fifteenth of the month) most industry professionals do not expect any further rate increases or peak season charges to stick in the Asia to U S trade There are no indicators now providing any substance to support significant increases
July 2025 data showed U.S. container import volumes increasing to 2.6 million TEUs, rising 18.2% over the previous month. July volumes reflect order frontloading ahead of impending trade policy and tariff concerns from U.S. importers. July’s volumes really emphasize how tariff timing, not just seasonal demand cycles, is increasingly shaping U.S. import volumes.
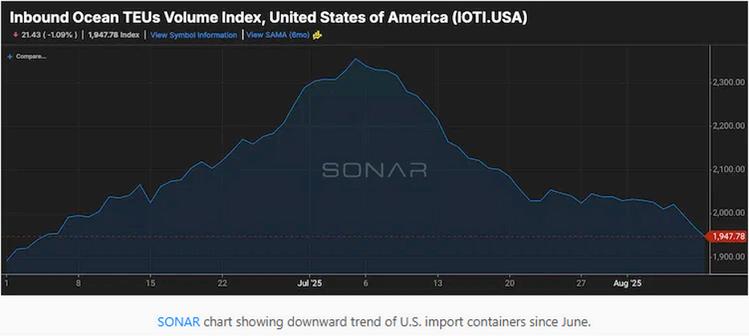


Tariffs are now likely becoming a significant factor in the U.S. import demand. As an example, imports from Europe rose 8% in the first half of 2025, but analysts at Jeffries are predicting a -10% decline for the second half of the year based on the latest EU trade deal.
A recently released Global Port Tracker report released by the National Retail Federation (NRF) predicts import cargo volumes to the U.S. main container ports to finish 2025 with a 5.6% decrease compared to 2024’s volume. The report predicts import volumes for September through December forecast to come in each month about 20% under the comparable 2024 levels when shippers were pushing volumes ahead of the threat of port strikes in early 2025.
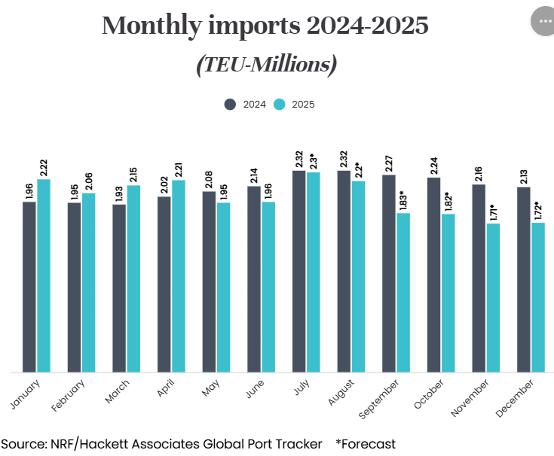
August is forecast at 2.2 million TEU, down 5% year over year, and September at 1.83 million TEU, down 19.5% year over year. October is forecast at 1.82 million TEU, down 18.9% year over year; and November at 1.71 million TEU, down 21 1% for the lowest total since 1 78 million TEU in April 2023 December is forecast at 1 72 million TEU, down 19 3% year over year

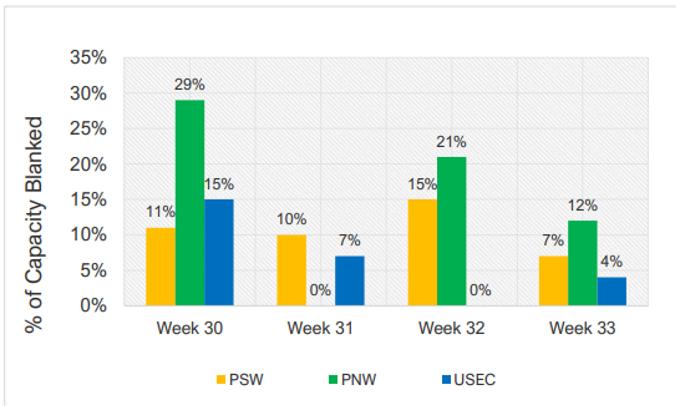
As import demand has continued to drop all through July, carriers resumed blank sailings – affecting up to 20% of market capacity moving into August.
The increase in blank sailings in early July was a sharp reversal of the previous eight weeks, during which time carriers injected over 700,000 TEU of capacity to handle the demand surge triggered by the suspension of reciprocal tariffs by the Trump Administration
Now that the volume surge has subsided, carriers find themselves in an overcapacity situation, with spot rates falling and load factors underwhelming Already, several niche carriers have cut back or even suspended services that were just recently launched in May and early June. As mentioned in previous updates, these new entrant niche carriers came into the market (as in the COVID era) to take advantage of elevated rates when volumes were spiking.
The traditional ocean carriers are now trying to quickly pivot and adjust schedules as load factors have dropped moving into August and tariff uncertainty continues. The four-week rolling average of blanked sailings from the Far East to the U.S. West Coast has increased from 30,000 TEUs per week on June 22 to 57,000 TEUs on August 1.
Blank sailings will continue to climb throughout the month of August. The market could see a 15%–20%
Source: M+R Spedag Group

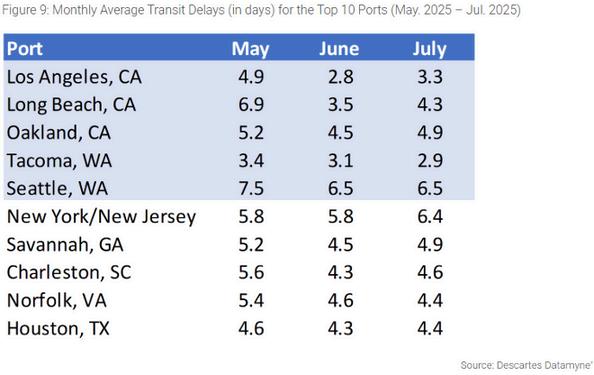
Even with a sharp increase in July import volumes at the top U.S. ports, overall performance has been solid. Transit time delays have increased but only a moderate amount compared to June. This seems to be an indicator that the port complexes are absorbing the added pressure without major disruption.
As shown in the below graphic, all the U S major ports showed only minor increases in overall transit delays all just a fraction of a day Only Tacoma showed a modest decrease in delays, improving to 2.9 days. Seattle held steady at 6.5 days, unchanged from June. It is also notable that all ports are operating with far fewer delays compared to May 2025.
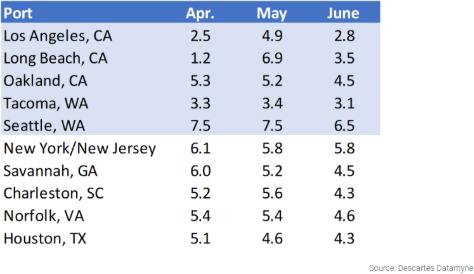
MONTHLY AVERAGE TRANSIT DELAYS (IN DAYS) FOR THE TOP 10 PORTS (MAY. 2025 – JUL. 2025)
