Metroplan is a voluntary association of local governments that has operated by interlocal agreement since 1955. Originally formed as the Metropolitan Area Planning Commission of Pulaski County, Metroplan now has members in five counties of the six-county metro area (see below). Metroplan is the designated metropolitan planning organization (MPO) under Title 23 of the United States Code.
Metroplan serves as the regional voice on issues affecting Central Arkansas, develops transportation plans required by federal law, convenes stakeholders to deal with common environmental issues, and provides information and staff resources to our member local governments, the business community and the public. As part of that mission, Metroplan publishes Metrotrends twice yearly. The spring/ summer edition is normally the Demographic Review and Outlook and the fall/winter edition is the Economic Review and Outlook. In 2021 the release of the 2020 Census did not occur until August. Therefore, we reversed the order, with the Demographic Review and Outlook in the fall/winter period.
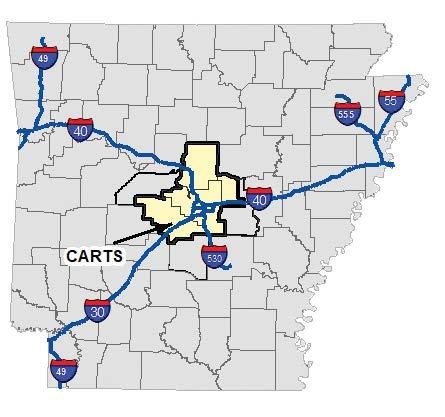
About CARTS
The Central Arkansas Regional Transportation Study, or CARTS, is the cooperative effort by the participating communities, transportation providers, and many other interested parties to develop a long-range transportation plan for the metropolitan area.
Housing Cost and Affordability in the 2020 Decade
Housing cost and affordability have become prominent issues lately, with home prices surging in response to economic conditions. The Covid-19 pandemic shifted people’s priorities. Working from home became commonplace, and there was a renewed focus on housing. Home-building accelerated, causing supply bottlenecks as construction costs surged, spurred in part by pandemicrelated market disruptions. Also, the Millennial Generation seems to finally be buying houses after a lengthy delay.
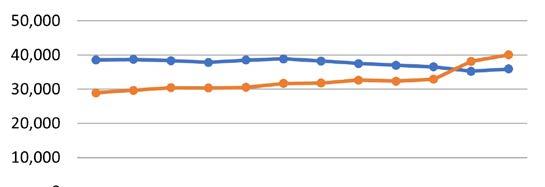
The chart above right shows long-term trends in U.S. housing starts. The last major disruption was during the 2007–2010 housing crisis. During those years single-family housing construction plummeted from unsustainable levels, while multi-family construction gained prominence afterwards. The Covid-19 recession in early 2020 also jolted housing markets, but less severely. Single-family housing construction has jumped, but the shift has been less drastic than in the previous economic crisis. At the same time, housing costs have risen sharply. For example, the median cost of new single-family homes in the Little Rock MSA jumped 11 percent in 2021 after inflation adjustment. This was the biggest inflation-adjusted hike in eight years. Some housing experts are even seeing past the rise to the beginnings of a fresh housing “bubble,” which may be followed by a looming market correction.
U.S. Housing Starts 2000-2021
U.S. Housing Starts 2000–2021
It is often difficult for market processes to resolve the affordable housing problem, particularly for persons at the lower end of the income scale. New units tend to sell (or rent) for premium prices. From a builder’s point of view, it is hard to make money by building and selling low-cost housing. New housing construction still benefits overall affordability, though, because new construction increases the total supply of available units.
In the end, some people at the bottom end find themselves paying more than they can reasonably afford for housing, and the problem has worsened in recent years. This edition of the Metrotrends Demographic Review and Outlook will review the housing affordability problem in Central Arkansas. The Little Rock MSA does an unusually good job at housing affordability, compared with other metros (pp. 2-3), but there is still a gap. For example, about 46 percent of renters in the region pay 30 percent or more of household income for a place to live. This is somewhat smaller than the U.S. average (49 percent of renters paying 30 percent or more) but the region can do better.
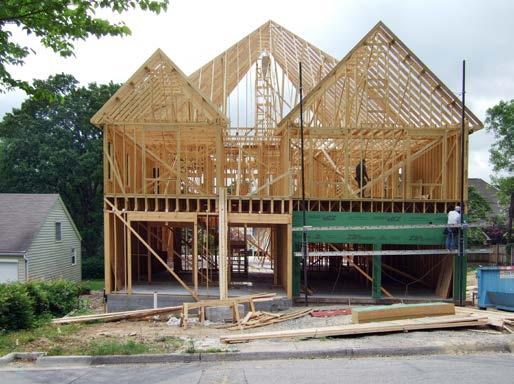
A major uptick in housing starts since 2019 suggests that the Millennial Generation is finally moving into single-family homes. Photo credit: iStockphoto.
Central Arkansas and the Housing Cost Question
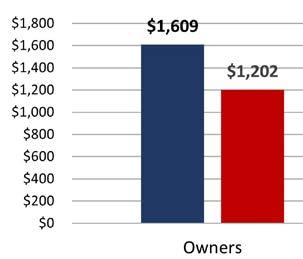
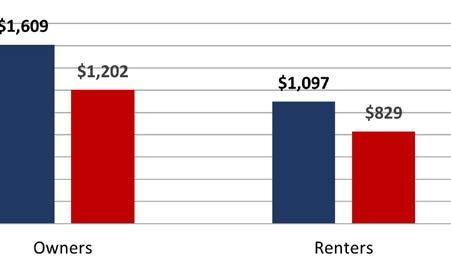
When looked at on the national scale, the Little Rock MSA has low housing costs. For both owners and renters, average housing costs run about 25 percent below the national average. The region also ranks well compared with other metro areas, particularly in owner markets. To show this, Metroplan ran a ranking of median owner costs among U.S. metro areas of similar approximate size (500,000 to 1 million). As the table at right shows, mortgage-paying owners in Little Rock paid about $1,220 monthly on average. This ranks the region fifth lowest among all mid-sized U.S. metro areas, with lower costs then seven other selected mid-sized metros in the south and mid-south region of the country.
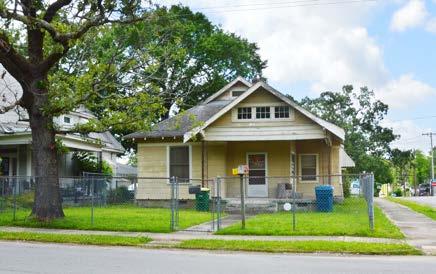
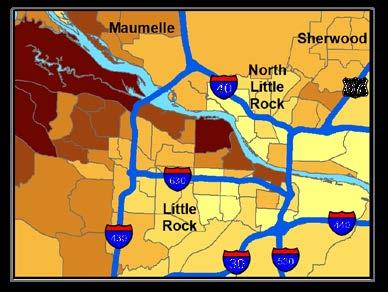
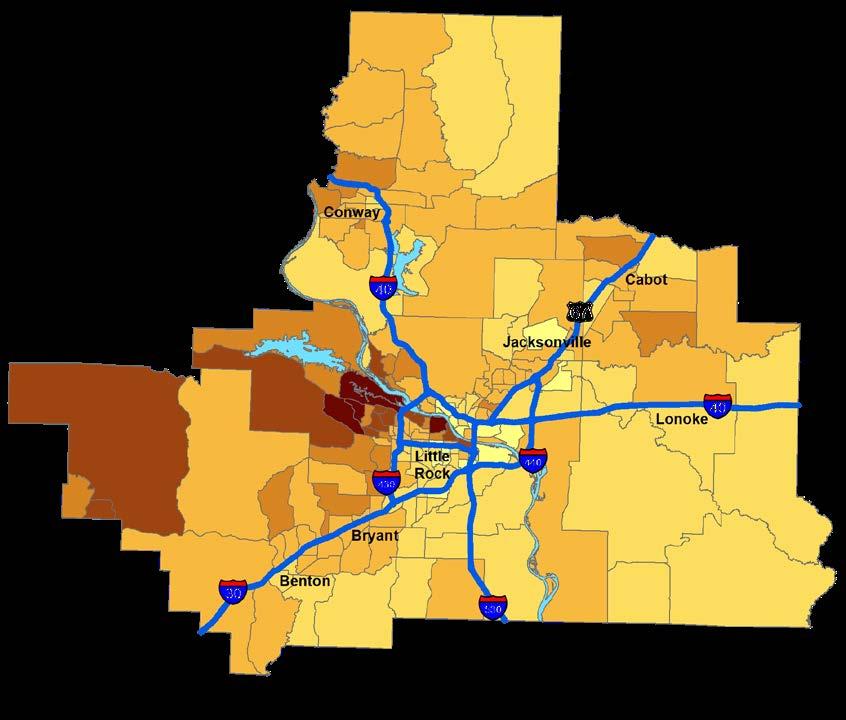
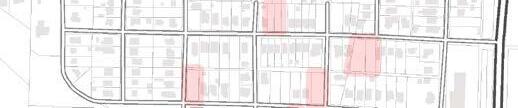
The map at right gives a local look at housing cost and affordability questions. As with most regions, housing costs vary tremendously by location. This analysis depicts median home value by census tract. Tract 16 (the Heights in Little Rock) has an average home value of $530,600. By comparison, 33 tracts have average home values under $100,000, or less than one-fifth as much. The map also introduces some of the complexities involving housing affordability. Some of the difference in value has to do with the size and quality of housing units, but it also demonstrates that location matters. People are looking for far more than an inexpensive house. They are also concerned about the proximity of jobs, shopping, recreation, quality of schools, and perceived personal safety.
Housing affordability is a slightly different issue, measuring housing cost against ability to pay. As the second table on page 3 shows, the Little Rock region still ranks quite well—56.1 percent of mortgage-paying owners pay under 20 percent of their incomes for housing. This ranks ninth among all midsized U.S. metro areas and outranks six of the seven other south and south-central metros in this analysis. You will notice, though, that the Fayetteville (Northwest Arkansas) region outranks Central Arkansas, ranking first in the country. While homes are a little more expensive in Northwest Arkansas, average incomes are higher, too.
Comparative Monthly Housing costs in 2019
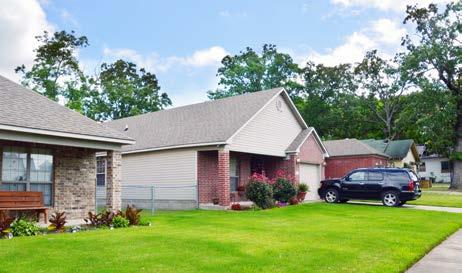
Relatively affordable homes are available in many locations across the Little Rock region, including the redeveloping Jump Start area near 12th Street in Little Rock.
Source: ACS 2019 (1-yr).
Fencing in front of this home points to the importance of personal security, a critical factor in housing cost and affordability.
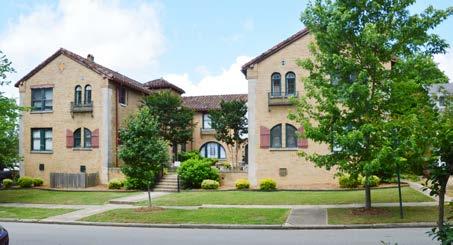
The presence of this small apartment complex in a neighborhood of high-value single-family homes in Little Rock’s Hillcrest neighborhood defies the notion that apartments do not belong in the mix.
Median Monthly Owner Costs for Homeowners with a Mortgage (ranked among
Percent of Owner Households Paying Under 20 percent of Income for Mortgage (ranked
Source: ACS 2020 (5-year)
Central Arkansas Owner-Occupied Home Values by Census Tract 2020
The map above depicts disparity in home values by location across the Little Rock MSA. It shows some sharp differences, with high home values near the Arkansas River from downtown Little Rock westward. You can also identify concentrations of high-value homes in Maumelle, central North Little Rock, northern portions of Benton and Bryant, northern Cabot, and northwestern Conway.
Source: ACS 2020 (5-year)
The map depicts self-reported home values from owners in the five-year 2020 American Community Survey. It gives no information on renters, and it takes no account of density. Thus, western Saline County appears to be covered by highvalue homes, when most of it is uninhabited National Forest. The high home values shown represent a portion of the Hot Springs Village community in the southeast corner of census tract 105.17.
Pandemic Demographics
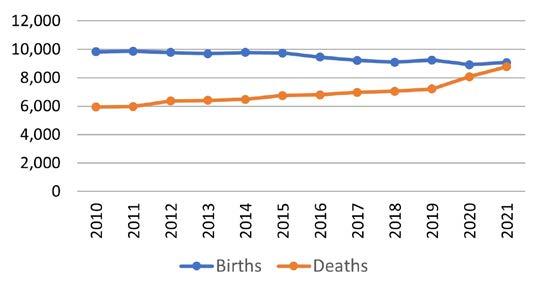
In 1990, just over thirty years ago, there were almost twice as many births as deaths in the six-county Little Rock MSA. By 2019, just before the Covid-19 pandemic hit, births were about 22 percent higher than deaths. In 2021, during the pandemic, that margin was pared to just 3.2 percent. These figures are approximately the same for the State of Arkansas, except that in 2021 total deaths exceeded total births by 11.5 percent.
Births and deaths were converging even before the pandemic hit. The number of deaths has a lot to do with the age, size, and health of the population, so a slow rise in total deaths pre-Covid was pretty normal. Birth rates have been steadily dropping for many years, although overall population growth has allowed some growth in total births even as the rate of births per woman dropped.
The table at bottom gives a closer look at population change within the six-county Little Rock MSA. As you can see, three counties – Grant, Perry, and Saline—saw net natural decrease, i.e., deaths were greater than births. The other counties had positive natural increase, yielding some natural increase for
the region. Migration also added somewhat to the regional population.
All these figures are preliminary and will be subject to revision. Based on trends so far this year, deaths in 2022 will come in lower than in 2021. Regional population will continue growing, but more slowly than in the past.
Population Change
Little Rock-North Little Rock-Conway MSA Population Change 2020–2022
*Represents portion of Alexander by county **Official MSA since May 2003
County Annualized Growth Rates 2010–2020 and 2020–2022 Compared
Habitats for Central Arkansas Humans
While renting offers flexibility, most people prefer to own their home. Owning a stable, comfortable, and safe house is a humble goal, but can be a hard one to realize, especially for people with modest resources.
For those who qualify, Habitat for Humanity offers “a smokin’ deal,” with no down payment and zero interest. But it is no giveaway. People must show ability to pay, and are obliged like other homebuyers to make monthly mortgage payments. Families must also contribute “Sweat Equity,” to the tune of at least 300 volunteer hours. It is a “hand up,” not a hand-out.
Habitat for Humanity runs its business model from the ground up, starting with land. Typically, it starts with donated land, or land sold by public-minded owners at discount rates. The Little Rock-based office employs one manager and two staffers, constantly constructing homes. Volunteers, often church groups, assemble on weekends and contribute manual labor under direction from the permanent staff. Habitat also employs subcontractors for mechanical work like plumbing and electrical installations.
The Central Arkansas Habitat for Humanity operation is funded in multiple ways. A significant contributor is the ReStore, a miscellaneous-goods store (mostly used furniture and building materials) which accepts donations from the public. Construction costs are largely funded through private donations and federal, state, and local government grant monies.
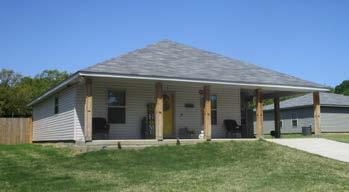
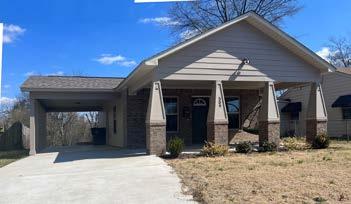
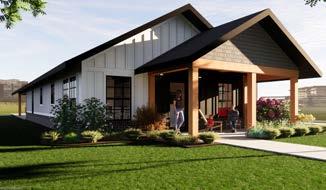
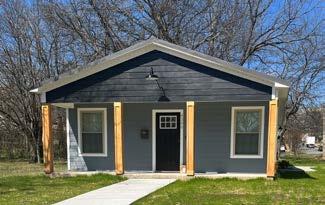
The result is a modest but steady stream of small but livable homes that are built to Energy Star 3.0 standards. The resultant energy savings help new homeowners to afford the cost of living. Habitat homes are built wherever land can be found, often in target neighborhoods within existing city areas. Clusters of homes are often built in the same vicinity, an arrangement that can help with costs, while also strengthening neighborhoods with brand-new stock of owner-occupied housing.
People with solid housing situations tend to live more stable lives. They and their children typically see better long-term outcomes in terms of education, personal health, financial earnings, and family life. As Habitat for Humanity builds homes, it also builds better lives.
Minor style features barely add to cost but do much to enhance appeal and long-term investment value. Clockwise from top right: an architect’s rendering, new Habitat homes on 11th Street and Thayer Street in Little Rock, and Porter Cove in North Little Rock.
You can donate and shop for bargains at ReStore at 6700 South University Avenue. It sells miscellaneous goods, mainly furniture, building materials and tools. Proceeds go to Habitat for Humanity.
Central Arkansas Habitat for Humanity Accomplishments March 2020–March 2022
• 12 new homes SOLD! (28 individual’s lives changed, including 16 young children)
• 5-year Strategic Plan written
• $443,558 Endowment established (and growing!)
• 8 new Board members
• Americorps back in action!
• $1 million ReStore!!!
• Fundraising more than doubled
• 36-acre land donation
• New & improved house plans designed
• Clinton School students engaged & on our team
• 3 record-breaking fundraisers
• Stable, happy team in a productive, healthy work environment
• Inaugural Veteran’s Build
• Updated Employee Handbook & Benefits
A whiteboard in the Habitat for Humanity office in Little Rock continues to remind staff of their recent accomplishments.
Home at Last
Walker, a U.S. Army veteran, considers himself lucky. He works as a Peer Support Specialist for the Veterans Administration, and he owns a brandnew home. In fact, Walker is the first member of his immediate family to own a home.
Not long ago, Walker was homeless. He admits he was in need of mental health treatment during this rough period after leaving the military. He did a stint of transitional housing with St. Francis House in Little Rock, which included counseling. Walker is a self-described “busy body,” somebody who needs to be doing things, so he helped around St. Francis House. This turned into a part-time job, then a full-time one.
break. But he took the offer and helped the builders almost every day during construction. Today he owns and lives in a 1,300-square foot three-bedroom home in central Little Rock.1 Utility costs are moderate, thanks to the home’s highquality insulation and all-electric fixtures.
When Habitat for Humanity made an offer to build and sell him a new house, Walker was unsure he deserved it. He knew plenty of others who felt like they never caught a
Walker insisted on placing Bibles in the foundations of all four corners as the house was constructed. His comfortable new home base is a secure platform for building a renewed life. He is watching the neighborhood slowly come back and finds fulfillment in his day job, counseling veterans. He appreciates his good fortune but there are still plenty of homeless people who need help. When asked about his personal achievement in overcoming homelessness, Walker replies “It’s not about me,” he insists, “it’s about the work with the Homeless Veteran’s Program.”
1 The home is in a redeveloping neighborhood about three blocks from the 12th Street Jump Start project, which is
and Metroplan.
a cooperative effort by the City of Little Rock
Walker in the sun-filled kitchen of his new home.
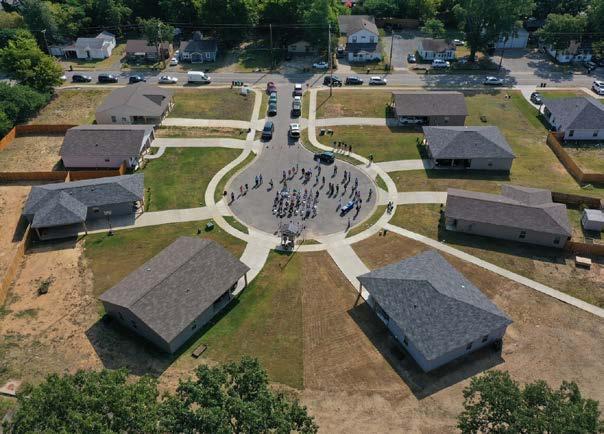
Ribbon-cutting for the Porter Cove development by Habitat for Humanity in North Little Rock. Built on the site of a former elementary school, this affordable development puts families close to a community center and a grocery store.
Most newly-built owner-occupied housing tends to be exclusive, with high costs that rule out people with low and moderate incomes. Even when new high-value homes are located in older urban areas, they can cause gentrification, in which rising costs (and tax rates) can drive existing low and moderate-income residents out of a neighborhood.
Near the Rockwater development just west of downtown North Little Rock, owners Lisa Ferrell and Jim Jackson are actively working to help keep the area affordable. “Including quality affordable housing near Rockwater has always been in our vision,” Lisa says. They have partnered with Habitat for Humanity to redevelop the older neighborhood just to the north. By selling land to Habitat at discount prices, Lisa and Jim are giving a boost to owner-occupied moderate-income housing in the adjacent Baring Cross area. The design of these new homes will incorporate stylish features, costing only slightly more than the austere “cracker box” simplicity that is common to affordable housing. Lisa is convinced that building in minor refinements to these homes “in the Rockwater style” can help establish long-term value without putting the price tag out of reach.
Habitat for Humanity will soon begin building eight new homes in North Little Rock’s Baring Cross neighborhood, in close proximity to the new Rockwater neighborhood on the Arkansas Riverfront a few blocks to the south.
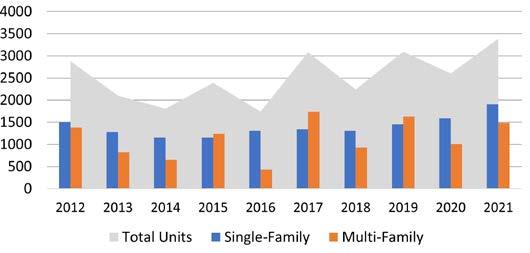
Housing Construction Ramps Up in 2021
The Central Arkansas region started 3,391 new housing units in 2021. This was its highest total since 2007. Construction of new single-family units totaled 1,908, also the highest since 2007. The greatest uptick was in North Little Rock, which saw new single-family starts more than double, from 87 to 180. Little Rock permits rose 49 percent, from 347 to 517. Benton saw the third greatest increase, from 224 to 322, up 44 percent.
Total multi-family starts were 1,483, above average but not record-breaking. Little Rock saw more apartments started (783) than single-family units (517). These were in about four new complexes, and several smaller groupings, mostly in western and southwestern Little Rock. North Little Rock gave permits to 440 new multi-family units, mainly in a large
Little Rock MSA New Housing Construction 2012–2021
public project on West 19th Street. Conway came in third with 226 new units located south of Dave Ward Drive. Cabot saw 60 new units and Bryant gave permits to several duplexes.
Housing Unit Permits 2018–2021
Sources: U.S. Bureau of the Census and Metroplan records. U.S. 1st quarter 2022 data are preliminary.
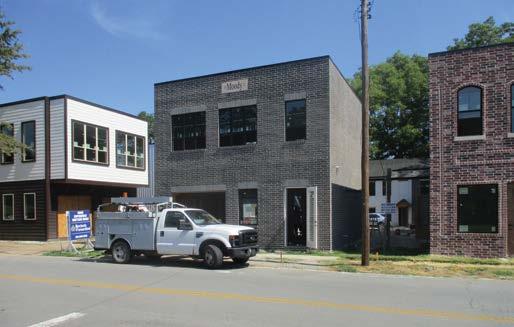
While most new housing in the region has a suburban character, the new Pettaway Square project on East 21st Street in Little Rock will mix retail, office and apartments.
Note: regional totals shown above exclude Hot Springs Village, part of which extends into Garland County beyond Metroplan’s area.
Low interest rates heated up the market in 2021 and early 2022. Rising rates will now cool things off.
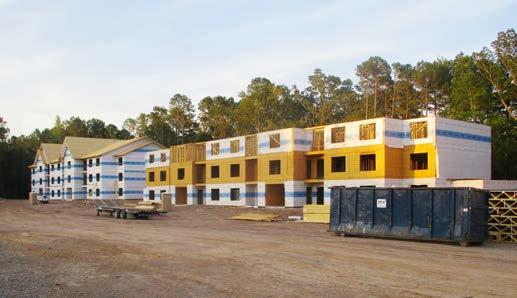
This new multi-family complex of 96 units is going up on Dover Drive in southwest Little Rock.
Demographic Outlook 2022
Natural increase of the regional population has slowed to a crawl, and went negative for the state of Arkansas in 2020 and 2021, as shown on page 4. Because there has been some net in-migration into both the state and the metro area, slow overall population growth continues, with localized exceptions. As the pandemic fades, mortality rates are declining. Nonetheless, cases (and deaths) continue from Covid-19, with alternating peaks and valleys. There are also long-term health impacts for a portion of previously infected population groups. It remains too early to make judgments about the pandemic’s long-term demographic impacts.
Regional population growth will remain slower than in previous decades because fertility rates remain low, and in-migration has slowed compared with recent past decades. With less rapid change going on, it makes sense to examine quality of life, of which housing affordability is a key measure.
Having a well-balanced and affordable housing market contributes to regional economic good health. As the tables on page 3 show, the Little Rock region does quite well in affordability, ranking 9th among mid-sized U.S. metro areas. The Northwest Arkansas region does even better in affordability
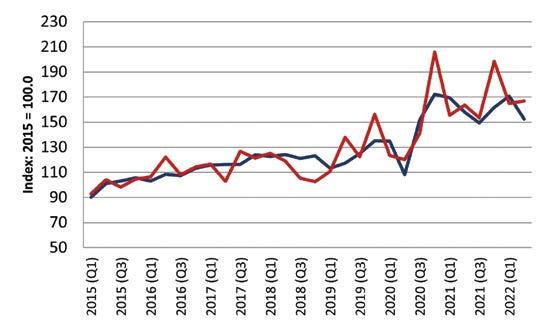
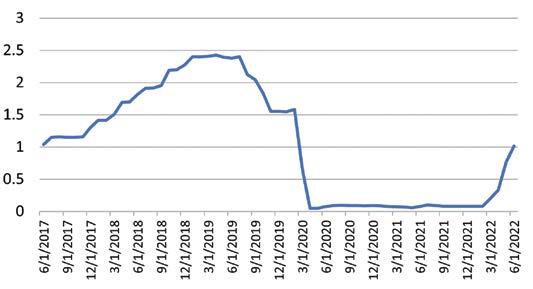
Effective Federal Funds Rate June 2017–June 2022
Interest rates were near zero from early 2020 through the beginning of 2022 but have climbed sharply, and will probably continue rising through the end of 2022. Source: Federal Reserve Bank of St. Louis.
because the match-up between incomes and housing costs is closer there. Yet median owner cost is seven percent less in Central Arkansas, an edge that could benefit the region’s longterm economic development.
Interest rate pressure is beginning to hit the housing market. By June of 2022 local single-family housing construction is showing signs of slowdown. Higher rates will also increase uncertainty in multi-family and other construction activities. It appears the post-Covid housing boom is ending.
Lessons from Habitat for Humanity
Metroplan chose to examine local efforts by Habitat for Humanity because, after years of reviewing building permit data, our staff recognized that Habitat makes a real impact. It puts working people of moderate economic means into owner-occupied housing, giving them a leg up to participate in the larger economy and society around them.
Builders cater to the more lucrative upper end of the housing market, for simple business reasons: the return on investment is greater. On the other hand, Habitat for Humanity makes an end run around traditional construction economics by going into older, less trendy— and less expensive—areas, restoring neighborhoods, saving public infrastructure expense, and building better lives.
Statistical Supplement
Covid-19 Mortality and Vaccination Rates
The table below compares regional Covid-19 mortality rates by geographic area. The Little Rock MSA has logged fewer deaths than the national average. The state of Arkansas has had more deaths than the U.S. average, however, with the highest death rates in rural counties, as well as in its smaller
metro areas. The table at right shows vaccination rates, which correlate inversely with overall mortality. For example, vaccination rates in rural Arkansas counties run one-third lower than the U.S. average, and death rates have been about one-third higher.
*AR portion only for multi-state MSAs.
Source: Arkansas Department of Health; Census estimate for population as of July 1, 2021. Deaths as of 6/21/2022.
* AR portion only for multi-state MSAs.
Source: U.S. Centers for Disease Control, Census estimate for population. Note: State of AR vaccination rates run higher because county is unknown for about 12 percent of vaccinations.
Renter Affordability
The tables below depict comparisons of renter affordability among 56 mid-sized U.S. metro areas. In the Little Rock metro area, about 43.2 percent of renters pay 30 percent (or more) of their incomes on rent. While this represents four in ten regional renters, other metros have even higher shares of rent-stressed residents. Little Rock ranks best among the eight metro areas compared, and tenth among all mid-sized metros.
Share of Renters Paying Over 30 Percent of Income for Rent
The second table depicts the share of renters who are least financially stressed, paying 20 percent (or less) of their incomes on housing. Here the Little Rock region ranks 17th among mid-sized metro areas and second-best among the eight regions compared. As with owner-occupied housing, the Little Rock region does well in housing affordability for renters.
Share of Renters Paying Under 20 Percent of Income for Rent (ranked among 56 mid-sized metros, from
Source: ACS 2020 five-year, rankings by Metroplan.
Source: ACS 2020 five-year, rankings by Metroplan.
PRESIDENT
Judge Doug Erwin Lonoke County
2022 Metroplan Board of Directors
VICE PRESIDENT
Judge Barry Hyde Pulaski County
SECRETARY/TREASURER
Mayor Allen E. Scott City of Bryant
Mayor Paul Mitchell City of Alexander
Mayor Bernadette Chamberlain City of Austin
Mayor Eddie Jones City of Bauxite
Mayor Tom Farmer City of Benton
Mayor Ken Kincade City of Cabot
Mayor David Graf City of Cammack Village
Mayor Bart Castleberry City of Conway
Mayor David “Butch” House City of England
Mayor Sammy Hartwick City of Greenbrier
Mayor Sam Higdon City of Guy
Mayor Roy H. Carman City of Haskell
Mr. Keith Keck Hot Springs Village
Mayor Bob Johnson City of Jacksonville
Mayor Frank Scott, Jr. City of Little Rock
Mayor Trae Reed, III City of Lonoke
Mayor Caleb Norris City of Maumelle
Mayor Randy Holland City of Mayflower
Mayor Jonathon Hawkins City of Mount Vernon
Mayor Terry Hartwick City of North Little Rock
Mayor Mike Kemp City of Shannon Hills
Mayor Joe Wise City of Sheridan
Mayor Virginia Young City of Sherwood
Mayor Michael Nash City of Traskwood
Mayor Charles Gastineau City of Ward
Mayor Terry Don Robinson City of Wooster
Mayor Allan Loring City of Wrightsville
Mayor Preston Scroggin City of Vilonia
Judge Jim Baker Faulkner County
Judge Randy Pruitt Grant County
Judge Jeff Arey Saline County
Mr. Brad McCaleb Arkansas Department of Transportation
Mr. Justin Avrey Rock Region METRO
Mr. Bryan Day Little Rock Port Authority
Mr. Bryan Malinowski Clinton National Airport
Metroplan’s Demographic Review and Outlook is an annual chronicle providing demographic and housing data and insight for the Little Rock-North Little Rock-Conway MSA.
Prepared by: Jonathan Lupton, research, writing and editing Lynn Bell, graphics, layout, and illustrations
Photographs by Lynn Bell and Jonathan Lupton except where noted
This report was funded in part through grant(s) from the Federal Highway Administration and Federal Transit Administration, U.S. Department of Transportation. The views and opinions of the authors expressed herein do not necessarily state or reflect those of the U.S. Department of Transportation.
Notice of Nondiscrimination
Metroplan complies with all civil rights provisions of federal statutes and related authorities that prohibit discrimination in programs and activities receiving federal financial assistance. Therefore, Metroplan does not discriminate on the basis of race, sex, color, age, national origin, religion, disability, or income status, in admission or access to and treatment in Metroplan’s programs and activities, as well as Metroplan’s hiring or employment practices. Complaints of alleged discrimination and inquiries regarding Metroplan’s nondiscrimination policies may be directed to Hans Haustein, Title VI/ADA/504 Coordinator, 501 West Markham Street, Suite B, Little Rock, AR 72201, (501) 372-3300, or the following e-mail address: hhaustein@metroplan.org. (Hearing and speech impaired may dial 711.)
This notice is available upon request from the Title VI/ADA/504 Coordinator in large print, audiotape or braille.