

PREPARED BY FOR


Metroplan is a voluntary association of local governments that has operated by interlocal agreement since 1955. It is the designated metropolitan planning organization under Title 23 of the United States Code. Metroplan has members in five Central Arkansas counties: Faulkner, Grant, Lonoke, Pulaski, and Saline. The organization acts as a unified voice to serve local governments, convening stakeholders, and providing information and data to address transportation, land use, and environmental issues affecting the region.
Casey Covington – Metroplan
Jonathan Lupton – Metroplan
Bryan Day – Port of Little Rock | Marsha Guffey – Port of Little Rock
Judge Barry Hyde – Pulaski County | Van McLendon – Pulaski County
Jon Honeywell – City of Little Rock | Walter Malone – City of Little Rock
Mayor Derrick Rainey – City of Wrightsville| Mayor Allen Loring – City of Wrightsville
Cloria Dozier – College Station Progressive League | Susan Forte – Sweet Home
Jay Chesshir – Little Rock Regional Chamber of Commerce | Hank Kelley – Kelley Commercial Partners
Amy Heflin – FHWA Arkansas Office
This report was funded in part through grant(s) from the Federal Highway Administration and Federal Transit Administration, U.S. Department of Transportation. The views and opinions of the authors expressed herein do not necessarily state or reflect those of the U.S. Department of Transportation.
Notice of Nondiscrimination Metroplan complies with all civil rights provisions of the federal statutes and related authorities that prohibit discrimination in programs and activities receiving federal financial assistance. Therefore, Metroplan does not discriminate on the basis of race, sex, color, age, national origin, religion, disability, or income status, in admission or access to and treatment in Metroplan’s programs and activities, as well as Metroplan’s hiring or employment practices. Complaints of alleged discrimination and inquiries regarding Metroplan’s nondiscrimination policies may be addressed to Hans Haustein, Title VI/ADA/504 Coordinator, 501 West Markham Street, Suite B, Little Rock, AR 72201, (501) 372-3300, or the following e-mail address: hhaustein@metroplan.org.
(Hearing and speech impaired may dial 711.)
This notice is available upon request from the Title VI/ADA/504 Coordinator in large print, audiotape or braille.
>> The South Loop Study evaluates potential roadway connections from I-530 to I-440 to accommodate increased traffic flow and growing economic activity in the Port of Little Rock.
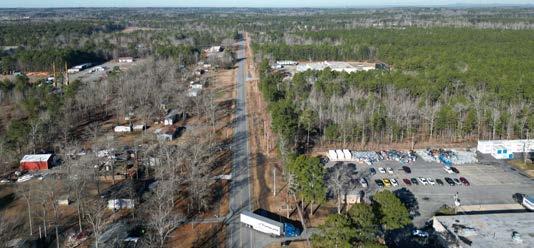
The emergence of Central Arkansas as a logistics hub has produced increased pressure on port and rail traffic in and around the Port of Little Rock. The inflow and outflow of goods, services and employees is currently affected by delays caused by deliveries from the Class I railroads an internal switching operations of the Little Rock Port Authority Railroad. Trains blocking the railroad crossing Fourche Dam Pike frequently result in traffic backing up onto the I-440 exit ramps. A more direct route to I-530 creates access to developable land south of the Port while providing opportunities for capitalizing on new labor markets and material supplies in South Arkansas. Additionally, a connection to I-530 may have the potential to relieve congestion at the I-530 & I-30 interchange as well as create an alternative route to the Port from I-30 in instances of congestion or delays on I-440. This study is the result of a thorough analysis of alternative routes to achieve these goals, including public outreach, preliminary traffic, civil engineering, and environmental analysis.
The project’s guiding principles were addressing area corridor traffic, safety for all modes of transportation, mobility and connectivity for people, goods and services, evaluating economic, environmental and community impacts, and delivering preliminary engineering design.
This report is an update to the Feasibility Study done in 2006, which recommended constructing a one-lane/direction roadway to enhance transportation and intermodal operations at the Port of Little Rock. The study found that building the suggested new route was economically feasible and showed improved travel time savings and better access to future economic development areas, such as what is now the WelSpun supersite.
STEP 1
>>> Data collection and project research: Geographic information mapping analysis was performed which included review of previous studies, traffic, environmental, economic and cultural information.
STEP 2
>>> Define purpose and need: With the direction of stakeholders and local residents, a framework for analyzing alternatives and performance measures for selection was clearly defined.
STEP 3
>>> Public and community engagement: Six community engagement meetings were held with local residents to share information about the project and determine their priorities for alternative development.
STEP 4
>>> Development and analysis of alternatives: Out of 15-20 alternative alignments initially reviewed, six alignments were selected for environmental, social and economic impact analysis based on stakeholder and public feedback.
STEP 5
>>> Recommendations: A final alignment was recommended for implementation, and areas for future additional study were identified.
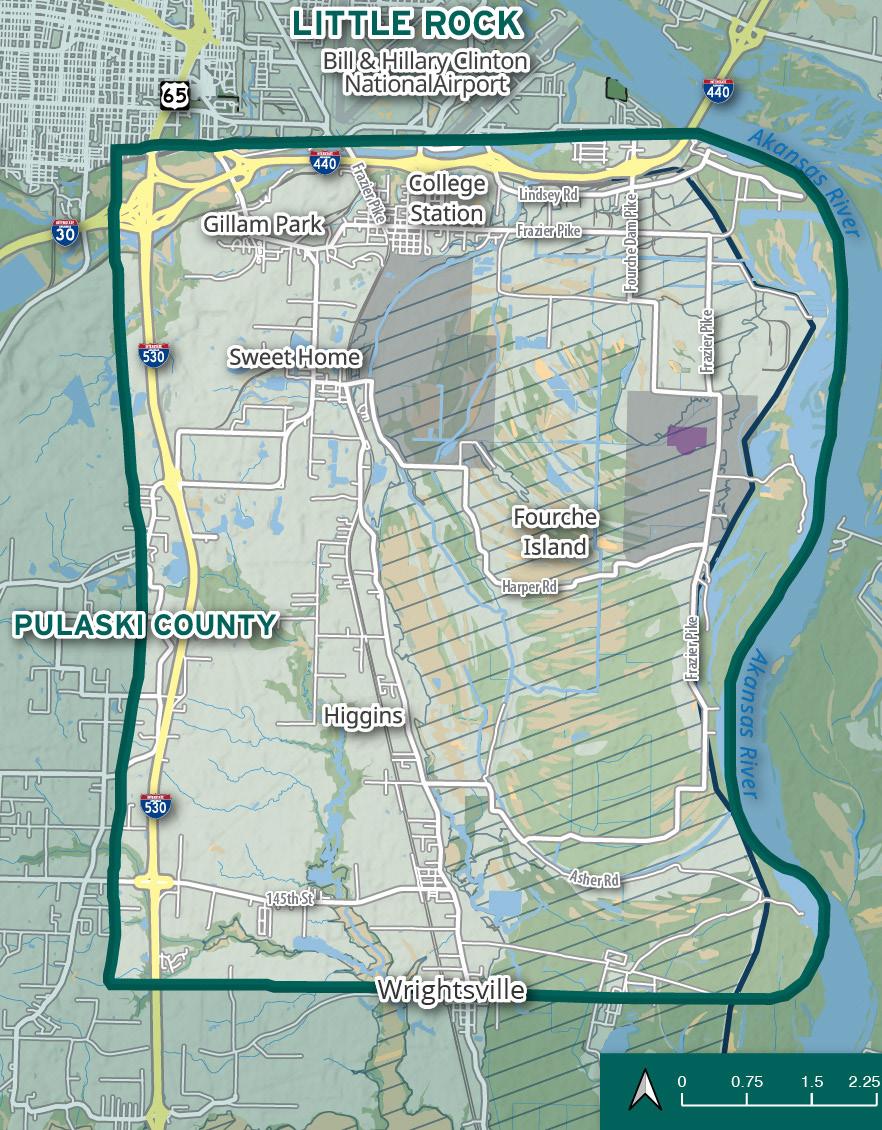
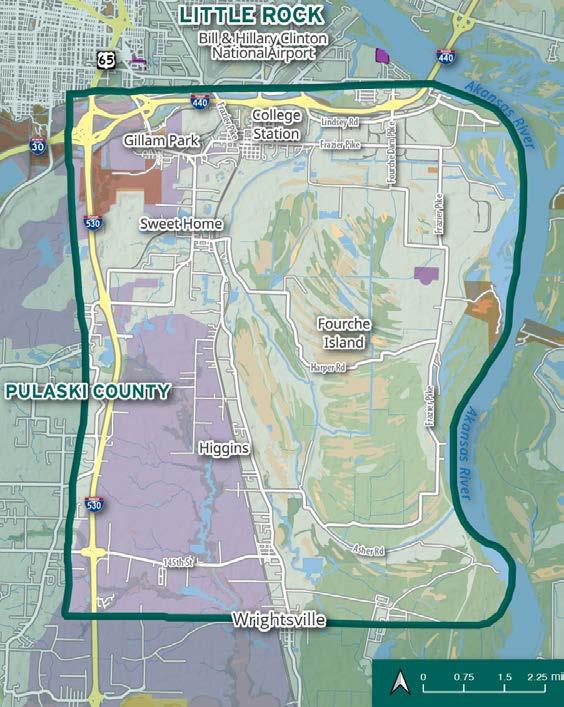
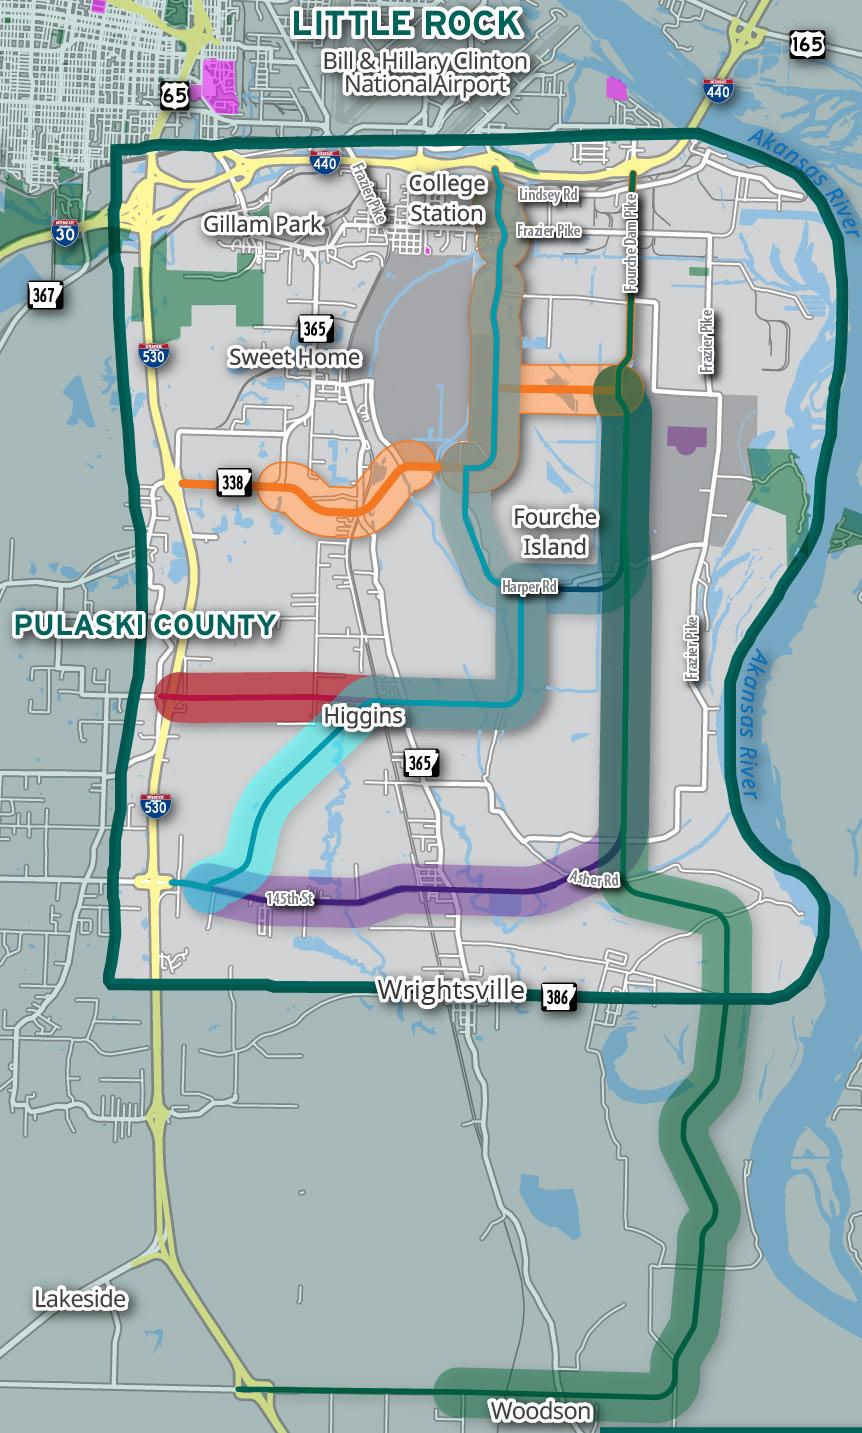
>> The South Loop Study area is diverse in environmental considerations, people, and economic development.
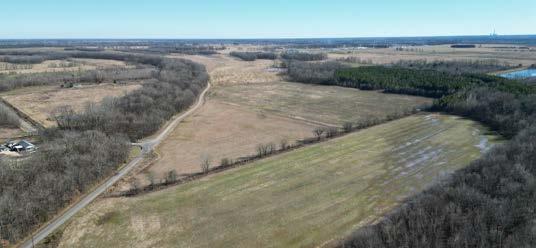
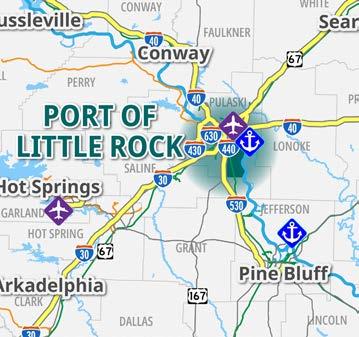
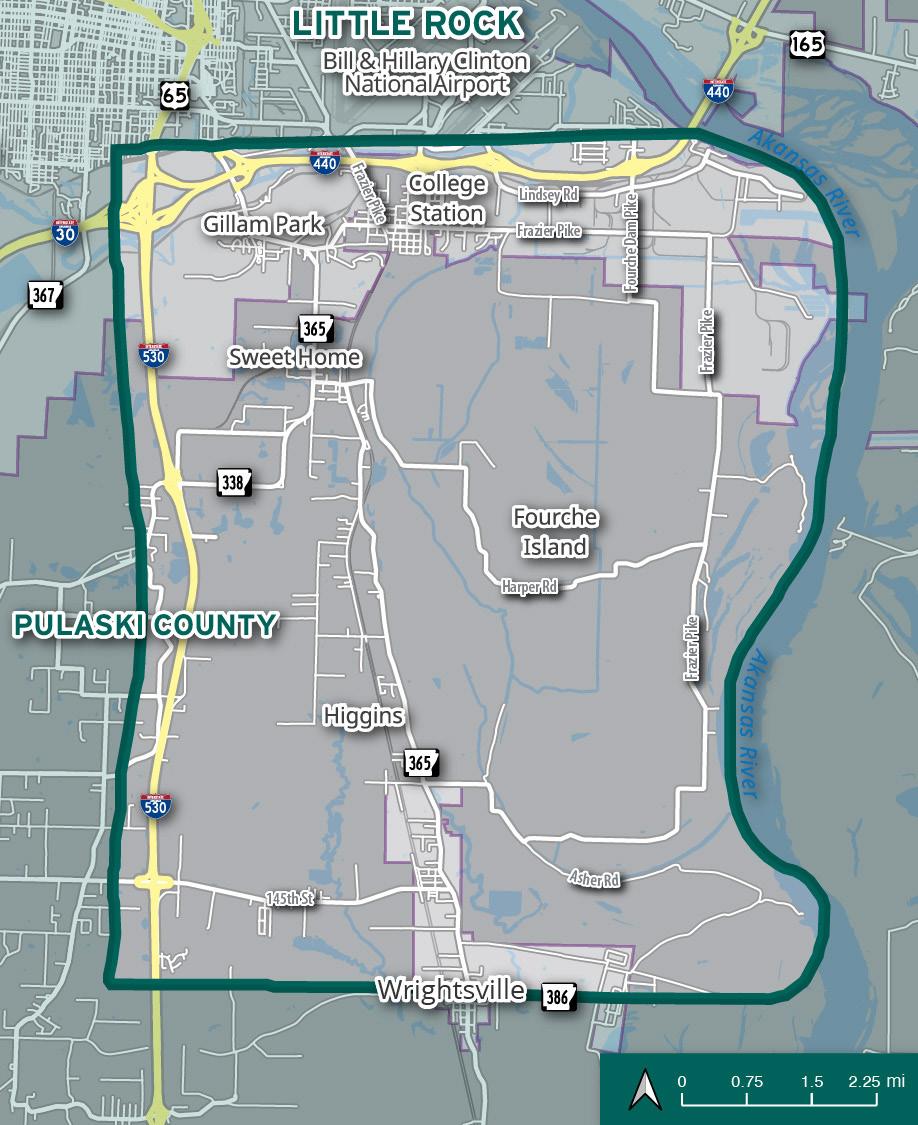
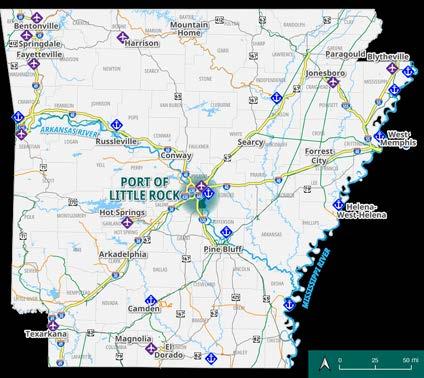
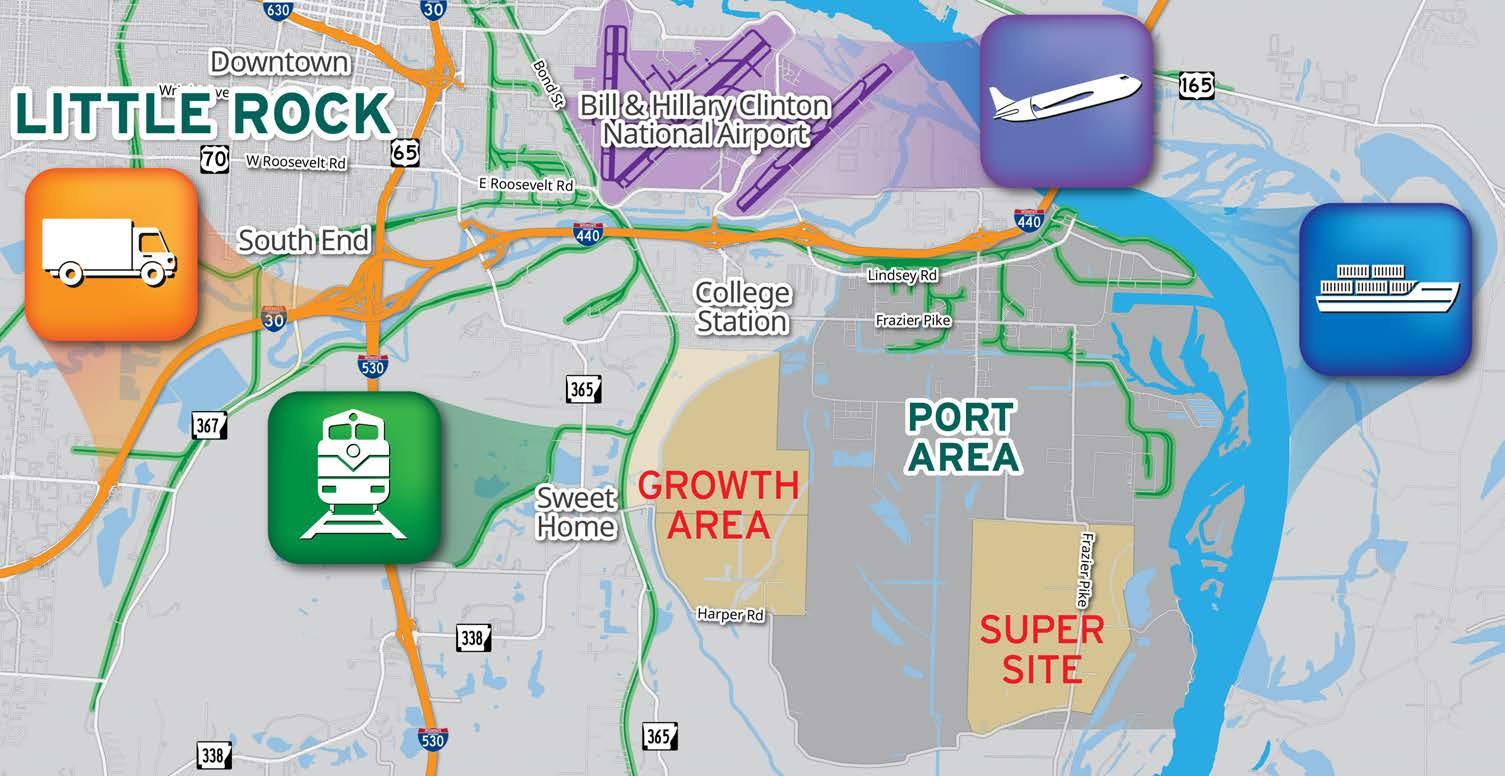
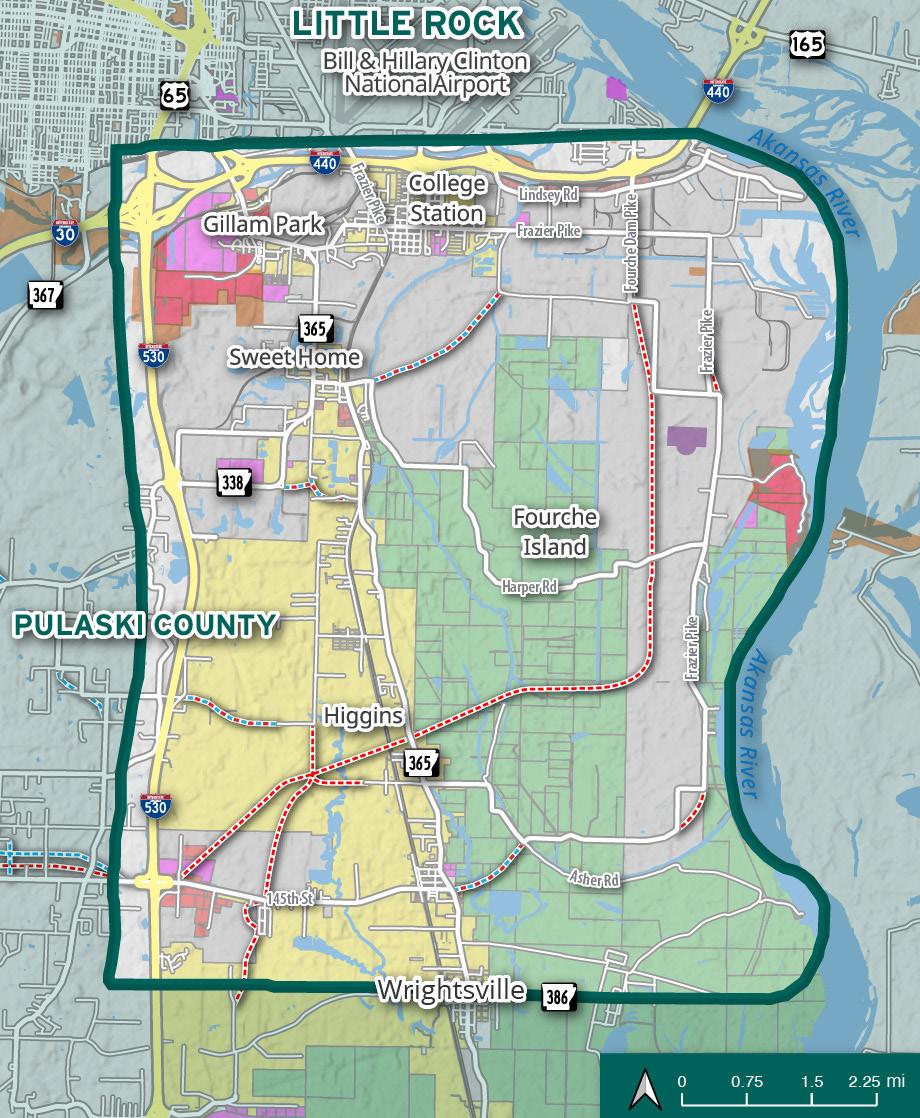
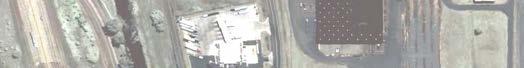
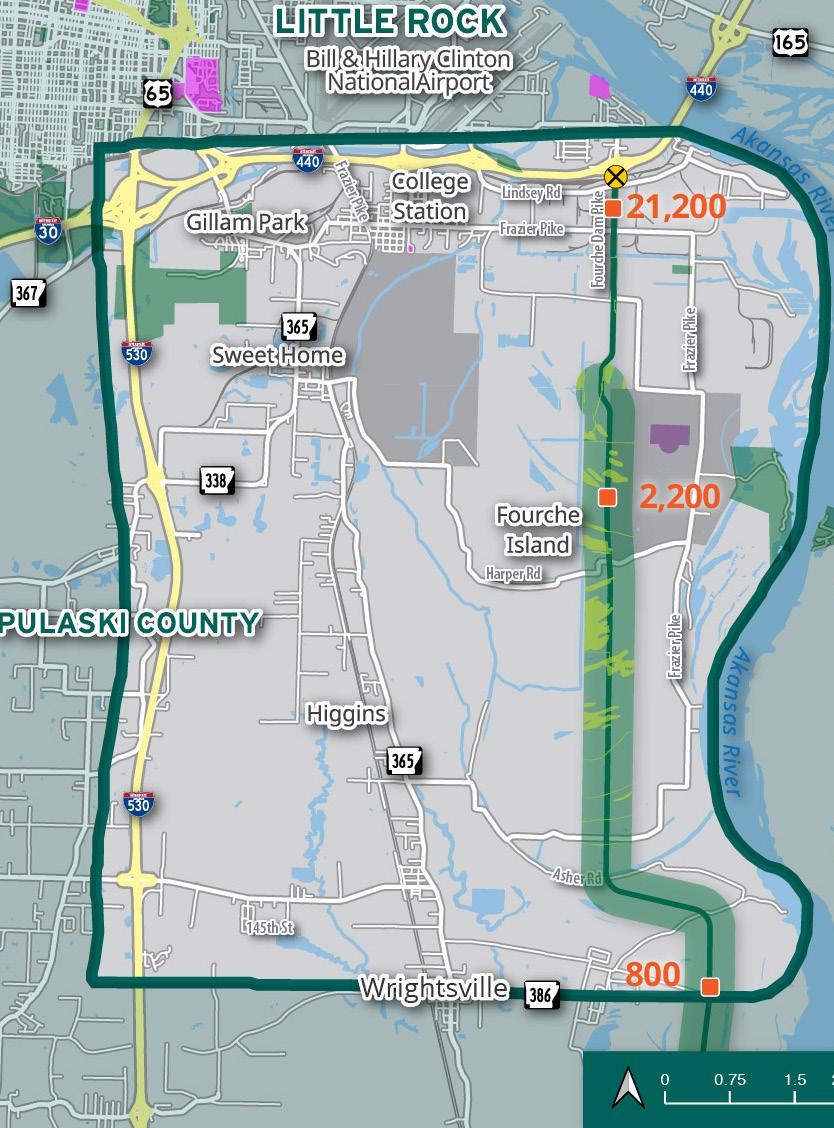
The study area is in the southeastern region of Pulaski County and is bounded by I-530, I-440, and the Arkansas River. The northeast of the study area is home to the Port of Little Rock, which is a significant industrial area that provides more than 10,000 jobs. The Port is strategically located adjacent to I-440, the airport, and the Arkansas River.
COMMUNITIES
>>> College Station
>>> Sweet Home
>>> Higgins
>>> Wrightsville
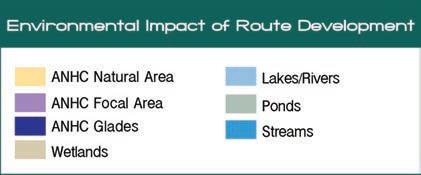
>>> Streams and Wetlands >>> Floodplain >>> River Levee >>> Glades >>> Agricultural land
DEMOGRAPHICS
>>> Population roughly 6,800
>>> 61.4% African American and 69.9% all minority groups
>>> Median household income $41,568 (county $55,235)
>>> 22.6% of households below poverty line (county 15.8%)
>> Public engagement is an essential component to this project. An extensive outreach program identified the possibilities and concerns with a new South Loop connection.
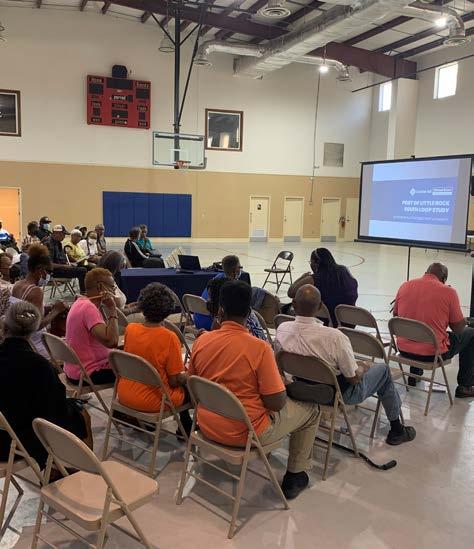
Public engagement began in 2022, during which stakeholders and the public were invited to meetings to share their ideas, visions, and concerns surrounding the project. The public engagement phase saw over 238 participants at in-person public gatherings.
The well-established and close-knit, predominately African American communities in the study area have traditionally been overlooked in engagement surrounding past transportation decisions. As a result, they have struggled with inadequate infrastructure, limited access to transportation facilities, and insufficient public transportation options.
During the study, the community response focused on the roadway’s potential for increased truck and industrial traffic through residential communities. Residents expressed concern and a strong priority for preserving existing communities during the public engagement phase. Traffic, large trucks, noise, and potentially disconnecting long-standing communities of color were common concerns from Wrightsville, College Station, and Sweet Home communities. At the request of the public, a sixth alternative was added for evaluation that avoided the developed areas of the study area.
The South Loop Study was guided by a steering committee that comprised representatives from Metroplan, the City of Little Rock, Pulaski County, the Port of Little Rock, state economic development officials, and area representatives. The committee considered input from stakeholders and members of the public when developing and providing feedback on the alternatives proposed. Additionally, meetings with the Port Industry Council, Fourche Dam Island property owners, and port industry employees revealed concerns regarding frequent backups and delays on Fourche Dam Pike.
Results of community engagement expressed a desire to increase affordable housing and small businesses with the South Loop project in order to increase economic growth, job opportunities, and local retail businesses to serve the community.
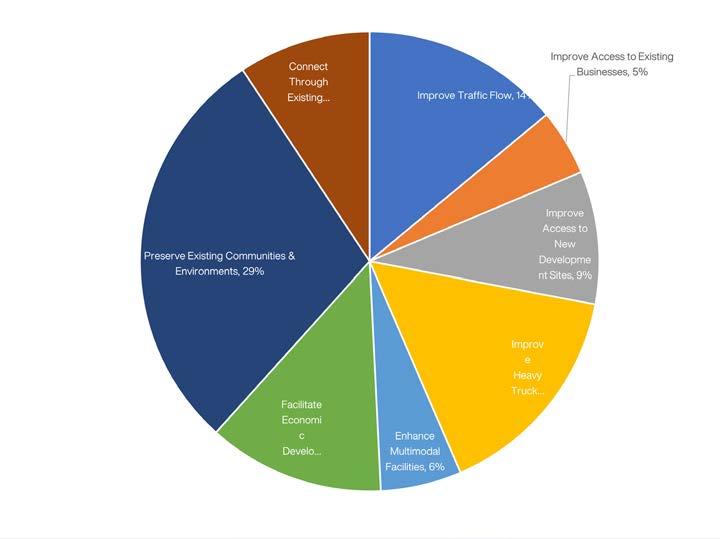
THE COMMUNITY EXPRESSED THAT THEIR PRIORITIES AS:
preserving existing communities
12%
of respondents indicated support for the South Loop Study and the final alignment facilitating economic development, but the overall sentiment was characterized by unease at the potential displacement of residents or businesses because of a new or widened roadway facility. Preserving existing neighborhoods and businesses was the driving force behind support for the project, which generally translated to a preference for a new roadway alignment instead of widening an existing one.
29% enhance multimodal facilities 6% improve access to existing communities 5% connect through existing communities 9% improving traffic flow 14% improving the safety of heavy truck and rail access 16%
>> The Port of Little Rock is a critical linkage to the movement of goods and an essential component of the Little Rock region and Arkansas.
With access to global markets via multiple major interstates, Class I Railways, a nearby national airport and a flood-controlled, year-round, ice-free navigable channel on the Arkansas River, the Port of Little Rock is America’s best connected inland port and a critical hub of economic activity for the South Loop study area as well as the state. The Port’s three full-service river barge terminals and slackwater harbor see more than $500 million in annual dock commodities from 543 annual barges on the McClellan-Kerr Arkansas River Navigation System. The region’s skilled labor force is nearly 430,000, a strong positive indicator for international companies seeking job stability for unimpeded flow of operations.
The Port of Little Rock accounts for the majority of jobs within the South Loop study area, with 49.6% of all jobs being in manufacturing, with an additional 17.8% employed in transportation and warehousing. With multiple available sites, continued near term economic development growth is expected to employ up to 10,000 more in key market segments such as chemical manufacturing, machinery manufacturing and primary metals manufacturing.
The Port is important as a regional economic hub. It is also a crucial local employer located near longstanding neighborhoods. This study gives careful consideration to the Port’s current economic impact, anticipated growth in general and in relation to an identified super site. Transportation impacts, along with existing travel patterns that may be affected by any evaluated alternative routes, have been examined.
Since 2016 , that area has seen:
>>> More than $466 million investments
>>> 17 project commitments
>>> 2,388 new jobs
With more than 24,000 daily drivers entering the Port each day, and an estimated 10,000 railcars interchanged annually, the study area demonstrates a high degree of intermodal transportation pattern complexity.
>> The Port of Little Rock is a complete multi-modal port with all transportation available: Waterways, air, trucking, and rail.
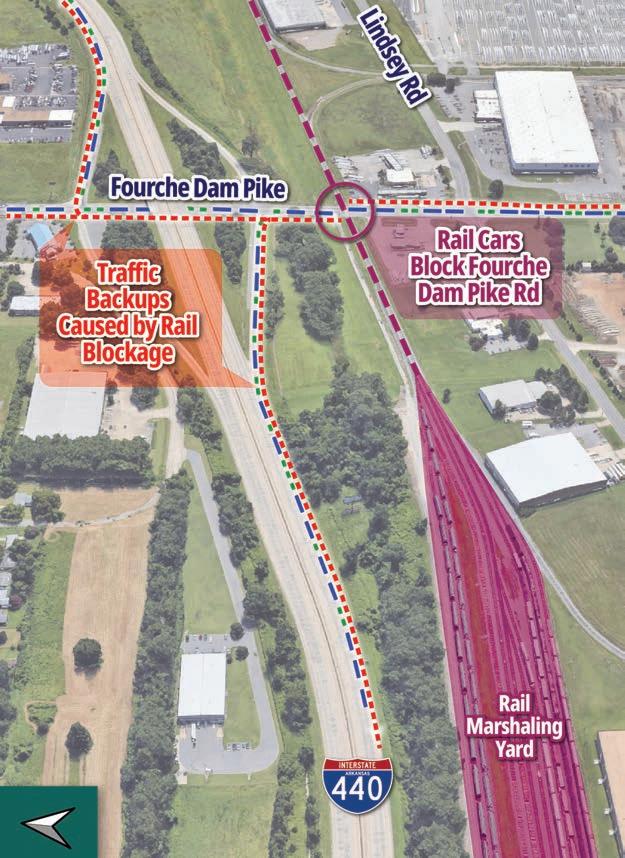
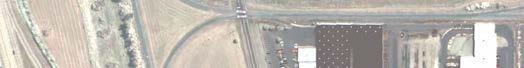
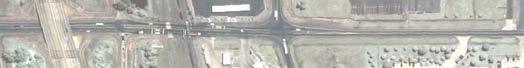
>> The Fourche Dam Pike rail crossing is a pinch point to Port operations that causes significant delays and financial impacts.
The railroad crossing at Fourche Dam Pike serves slow-speed trains destined to and from industry rail yards and freight transfer facilities. In addition, the rail marshaling yard west of Fourche Dam Pike is a switching area where trains often travel through Fourche Dam Pike to allow for train positioning. Due to the slow nature of this crossing, with trains often coming to a full stop, traffic on Fourche Dam Pike will queue, backing onto I-440 with delays as long as 20 minutes or more.
>>> Two scheduled through trains per day
>>> The Ethanol Unit Trains are a mile long and arrive once a month, causing the worst disruption
>>> Current switching operations block the road four times a day; this is expected to increase to 8 times a day in the future
>>> Unscheduled Union Pacific and BNSF crossings create longer delays
>> Adopted plans include growth and new roadways south of the Port area.
>>> Pulaski County is drafting an updated Comprehensive Land Use Study to consider land development, infrastructure, growth, economic development, and quality of life. The recommendations of the South Loop Study will help inform future land use in the area.
>>> Future land use analysis predicts a transition of mostly agricultural land in the north and east portions of the study area into industrial.
>>> The roadway network in the study area is substandard and not designed to carry a high traffic volume or absorb an increase in freight movements. The adopted roadway network does not provide appropriate roadway capacity for the current and proposed expansion of the Port.
>>> Regional models predict growth in the study area over the next twenty years. Additional roadway capacity and connectivity within the Port of Little Rock area becomes critical, with future industrial expansion that may encompass one-quarter of the study area over the next several decades.
>>> The South Loop study is critical in providing alternative routes, creating redundancy in the network, and providing economic growth opportunities to communities along Highway 365 and I-530.
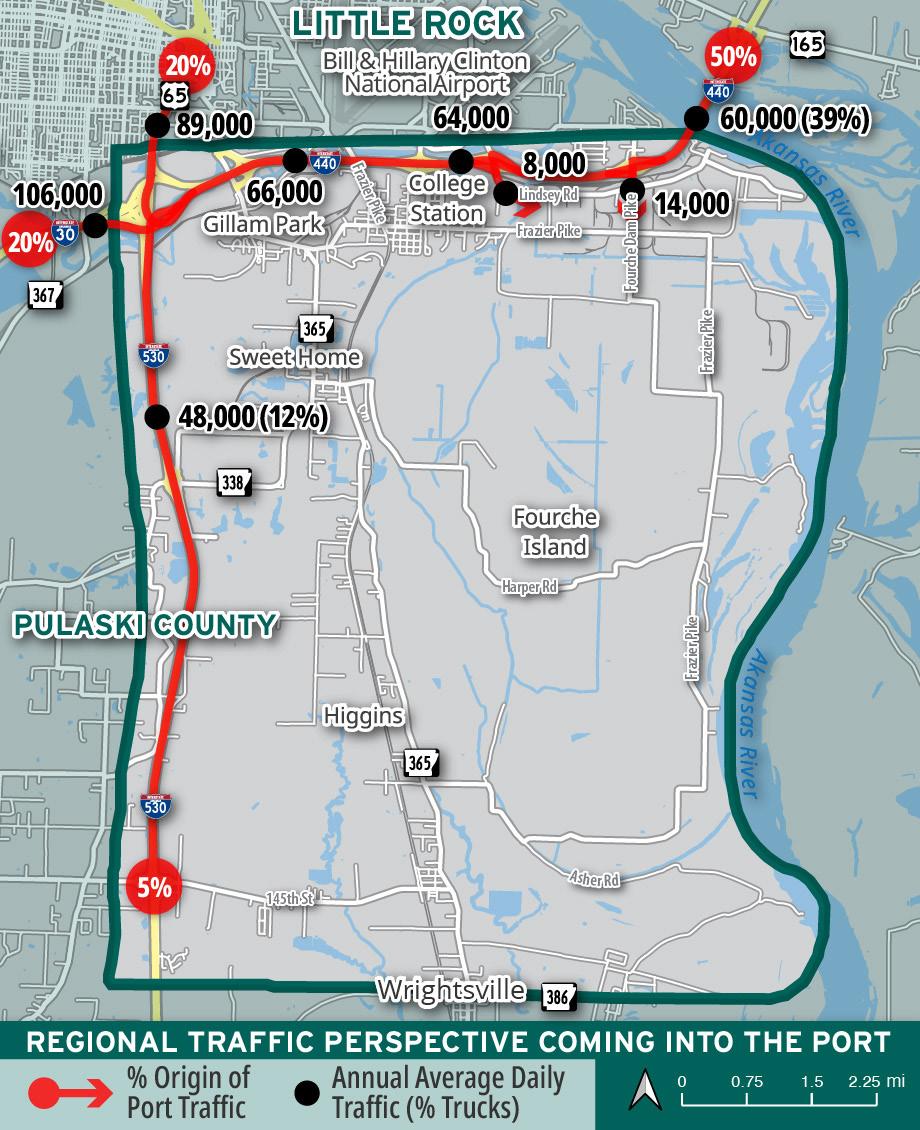
>> Port of Little Rock vehicle traffic primarily uses the interstate system, with most traffic from the Northeast. Delays occur at Fourche Dam Pike.
The Port Area sees about half of its traffic coming from or going to I-440 East. Around 20% of trips to and from the port come from I-30 West, 20% come from I-30 North and I-630, and 5% from I-530 South
Access to land identified for the Port’s immediate economic development and future growth is limited. The existing roadway network lacks connectivity necessary to unlock the true potential of the area .
Traffic from I-30 & I-530 does not have clear options other than I-440 for traveling to the Port. In the event of a blockage at Fourche Dam Pike or accident on I-440 few alternate routes exist. Without an identified route, traffic will find its own way often through residential neighborhoods.
Direct access to the Port is currently limited to entrances along I-440, with limited redundancy. Adequate routes to evacuate or reach the Port from the west or south do not exist.
>> The overall crash rates for freeways and roads in the study area are within statewide averages. However, crashes in the Fourche Dam Pike Interchange area are excessive.
The crash analysis for this study used ARDOT crash data for five years (2017-2021) and covered the area between I-440 and I-530, including state highways, county roads, and city streets.
>>> There were ten fatal crashes over the analysis period. Six occurred on the freeway, and the others on local streets. Fatal crashes were predominantly single-vehicle with one head-on crash.
>>> Of the total crashes in the study area, three collisions were with a railway vehicle
>>> While overall, the crash rates across the state on freeways and local streets are comparable to those within the study area (see Figure 11), an excessive number of crashes occur on Fourche Dam Pike

>> Environmental factors like wetlands, streams, and floodways affect route selection due to engineering and permitting challenges or increased construction costs.
The study area is divided by Highway 365, along which community development is concentrated. Eastern farmland features soybean and hay production, along with woody wetlands. The western section, dominated by woodland and significant wetlands near Fish Creek, is separated by evergreen and deciduous forests, streams, and ponds typical of Arkansas River floodplains.
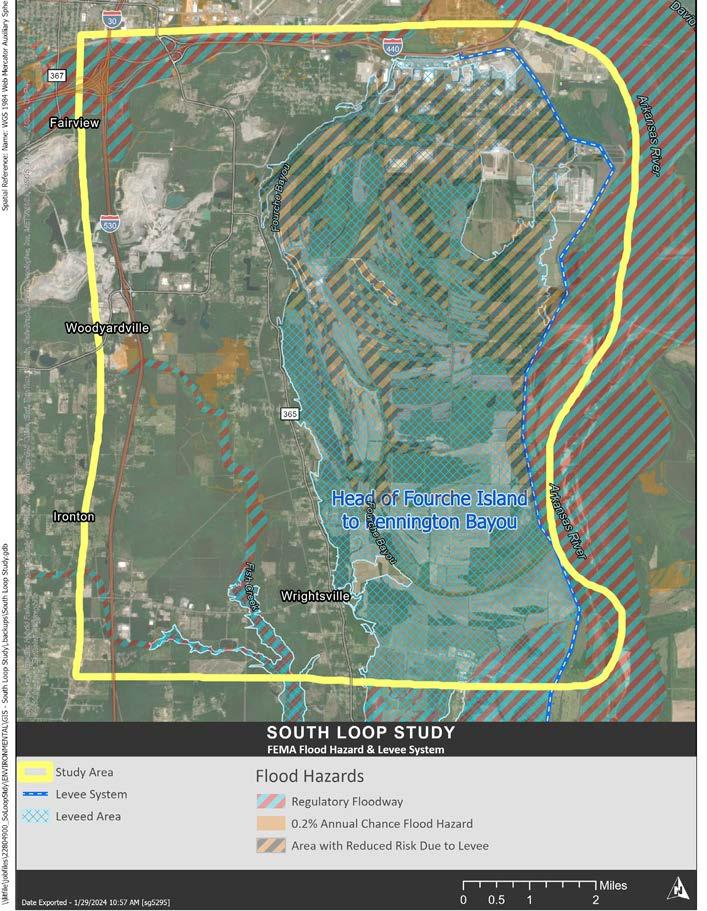
Due to the project being located near the Arkansas River, FEMA Regulatory Floodways border the area. The Head of Fourche Island to Pennington Bayou levee system is necessary to allow for development and protection of rural lands, homes, businesses, and agricultural areas.
>>> FEMA Regulatory Floodways
> Restrictions on construction in designated flood-prone areas.
> Requirements for elevating structures to mitigate flood risks.
>>> U.S. Army Corps of Engineers Levees
> Constraints on development near or within levee systems.
> Compliance with levee maintenance and repair standards.
>>> Hydric Soils
> Challenges in soil stability for road foundation and drainage design.
> Potential need for additional soil treatment or stabilization measures.
>>> Waters of the U.S. (WOTUS) (wetlands, streams, and ponds)
> Considerations for wetland preservation or mitigation.
> Implementation of erosion control measures to protect water quality.
>> Road construction and upgrades affect existing environments like natural areas, glades, wetlands, streams, and parks, necessitating careful consideration.
The Arkansas Natural Heritage Council (ANHC) designates the Focal Area for Lorance Creek Natural Area, south of Highway 338 and west of Highway 365, extending to Clear Creek. It includes diverse habitats like swamps, open water, bald cypress/tupelo swamp, beaver ponds, and sandy washes overlain with groves of swamp black gum. The Fourche Creek and Central Arkansas Glades Focal Areas intersect the project area to the northwest. These delineated Focal Areas provide buffers and protection for the nearby Natural Areas.
>>> Waters of the U.S. (WOTUS) (wetlands, streams, and ponds)
> Avoiding drainage or pollution impacts on aquatic ecosystems.
> Compliance with WOTUS protection regulations, permits & authorizations.
> Implementing measures to minimize wetland disturbances and maintain hydrological functions.
> Implementing erosion control measures to maintain stream health and aquatic habitats.
>>> Focal Areas (e.g. Lorance Creek Natural Area)
> Preserving biodiversity and habitats.
> Mitigating disturbances to sensitive ecosystems.
>>> Nepheline Syenite Glades (none within 1,250 ft of alternatives)
> Minimizing impact on rare geological formations.
> Avoiding potential ecological disturbances.
>>> Parks
> Balancing road development with recreational spaces.
> Ensuring minimal disruption to park amenities and visitor experiences.
Threatened & Endangered Species potentially occurring within the study area
Mammals
Northern Long-eared Bat Endangered
Tricolored Bat Proposed Endangered
Birds
Eastern Black Rail Threatened
Piping Plover Threatened
Red Knot Threatened
Reptiles
Alligator Snapping Turtle Proposed Threatened
Insects
Monarch Butterfly Candidate
FIGURE 13: ENDANGERED SPECIES IN AREA
>> Locals Solutions can move the needle on safety and traffic congestion.
>>> Collecting data and distributing this information to users though technology informs travelers of potential delays and congestion, allowing them to better plan their trips and routes.
>>> This can be done through highway message boards, notifications to personal devices, and online applications. However, there are challenges to implementing this technology and accessing systems currently in place.
>>> Turn lanes at intersections and driveways are crucial for safe and efficient traffic flow.
>>> Adding continuous turn lanes, or two-way-left-turn lanes , on roadways with offset or closely spaced driveways can create safety challenges.
>>> Access management is the coordinated planning, regulation, and design of access to roadways and land development (driveways).
>>> An effective access management program can reduce crashes by 50%, increase roadway capacity by 23% to 45%, and reduce travel time and delay by 40% to 60% (TRB Access Management Manual 2nd Edition (2014)).
>>> Some access management tools include minimum road and driveway spacing, aligning driveways across roadways, medians, and joint and cross access.
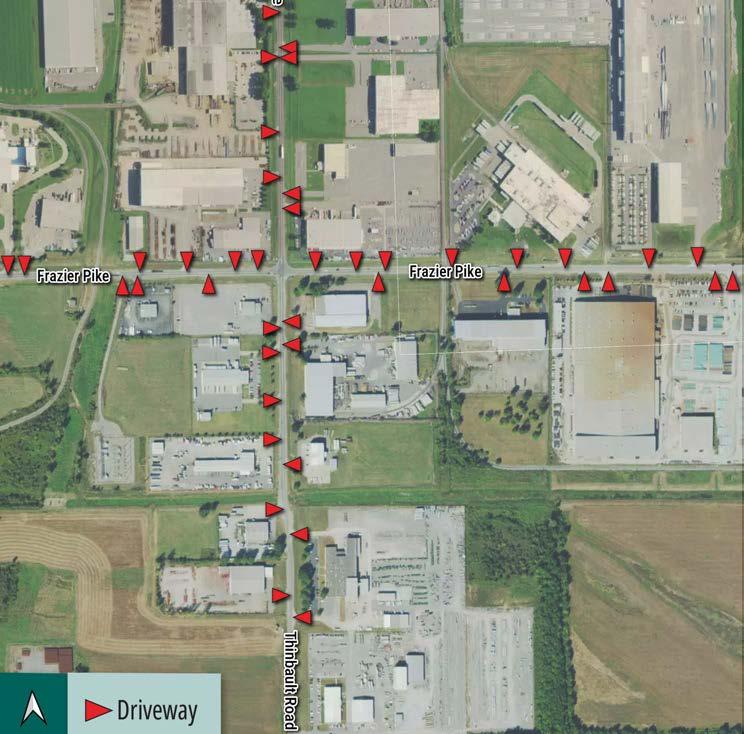
> Lindsey Road: 29
> Fourche Dam Pike: 25
> Frazier Pike/Sloane Drive: 19
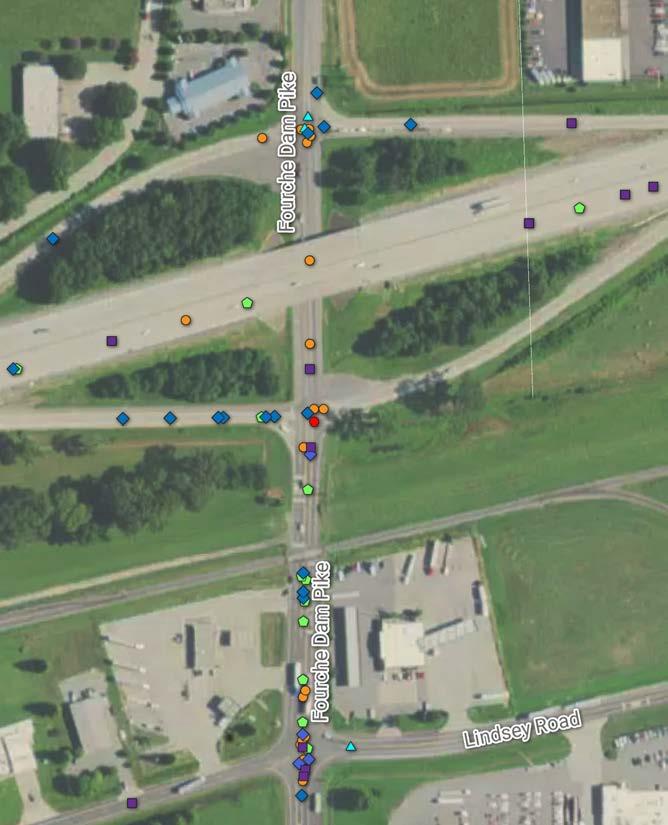
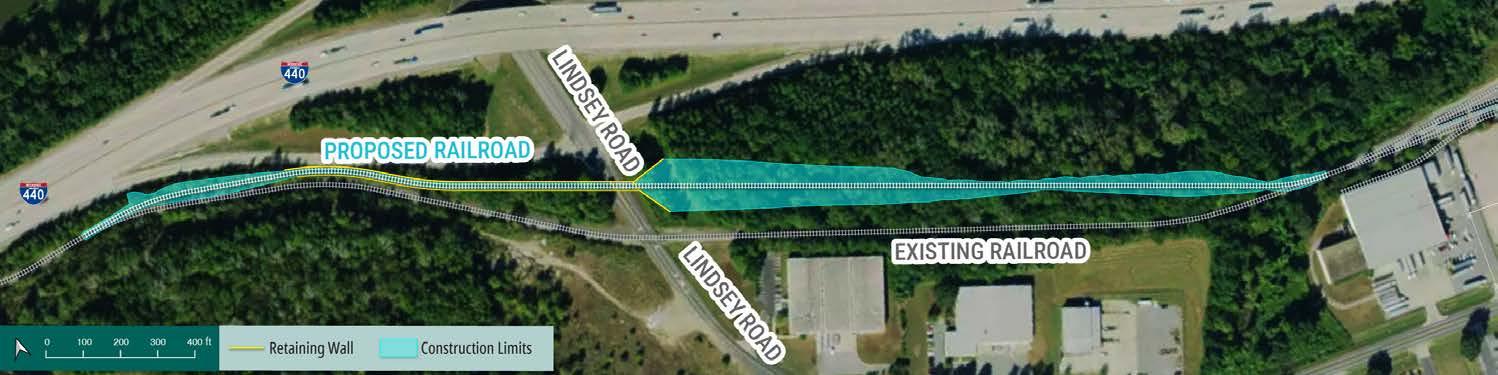
In 2006, a feasibility study was conducted for the South Loop to investigate the possibility of a rail grade separation at Fourche Dam Pike. The study (shown at right) revealed that taking the road over the railroad is unfeasible due to its proximity to the I-440 interchange. While it is possible to take the railroad over Fourche Dam Pike, this would result in an undesirable downgrade into the marshaling yard. Therefore, another alternative would be a rail grade separation at Lindsey Road. However, due to the railroad’s proximity to I-440, the rail would need to go over the road, as illustrated in Figure 16 below.
Even though Lindsey Road has less traffic volume than Fourche Dam Pike, a grade separation at Lindsey Road would have less impact on rail operations. A steep slope at the entrance of the port marshaling yard would be needed to cross over Fourche Dam Pike. Moving the marshaling yard, as referenced on Page 19, would create a feasible opportunity to grade separate the railroad over the road.


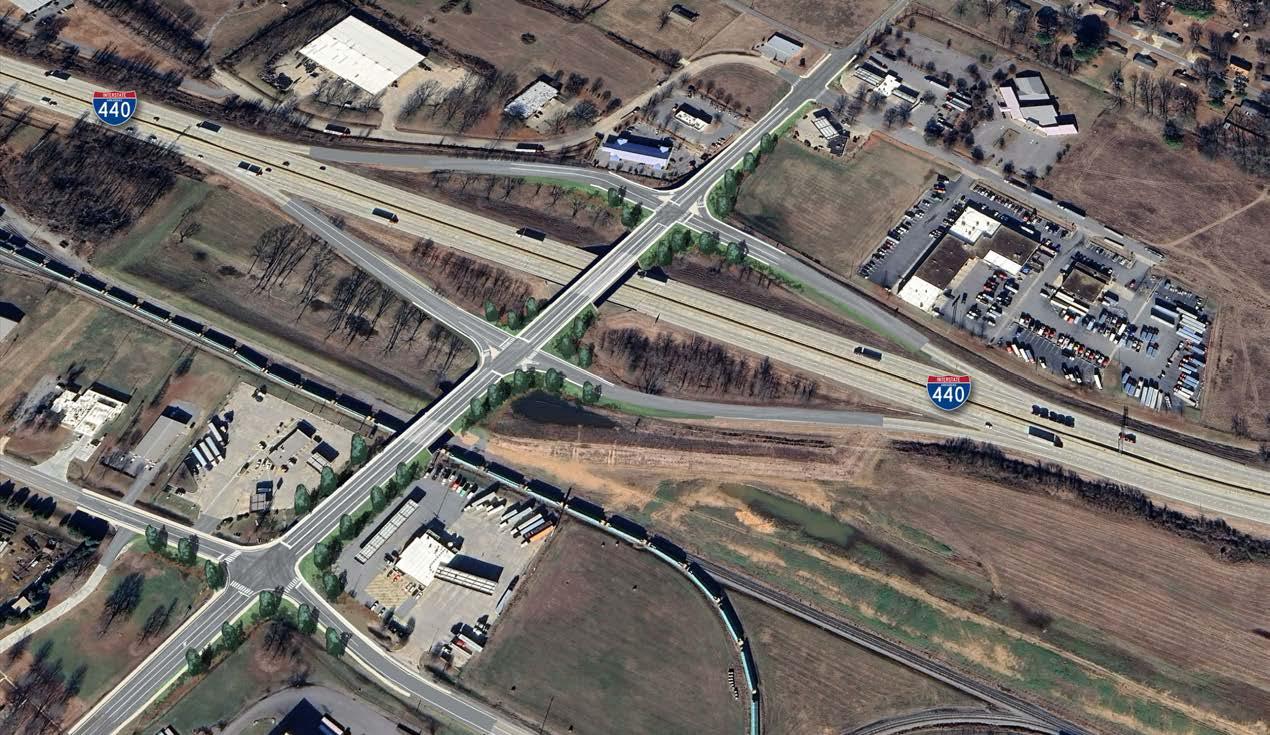
Another option for a rail grade separation at Fourche Dam Pike is to reconfigure the I-440 interchange so that Fourche Dam Pike goes over I-440. This would allow enough clearance to get the Fourche Dam Pike over the railroad. The two service stations south of the railroad and the complications with reconfiguring an interchange on a major interstate would be challenges to this approach. The extremely high cost and intricate planning needed to maintain traffic flow during construction would limit consideration of this solution. The feasibility of this alternative was not considered.
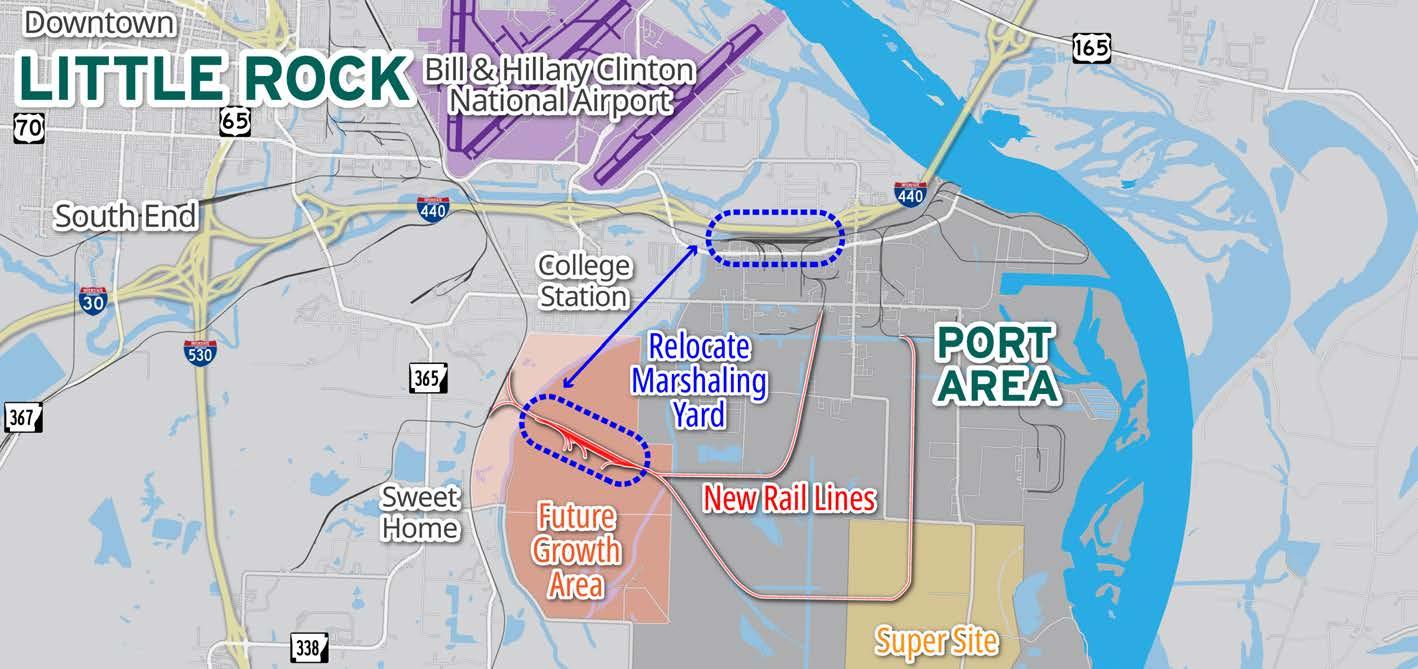
>> Moving the main railroad network to the South Port area would improve roadway crossings. Any relocation would require coordination with Class I rail companies and Port Area businesses.
The rail network for the Little Rock Port is robust, connecting businesses and waterways and trucking freight with rail. The marshaling yard adjacent to I-440 has been considered for relocation to the western future growth area. This relocation will move most of the rail traffic and switching activity away from Fourche Dam Pike. The New Rail lines will open the south port area to new growth, in particular, a new super site that has been identified.
>> Regional solutions: Creating a new roadway between I-440 and I-530 through the Port of Little Rock area.
> NEW ROADWAY BENEFITS: A new route would offer alternative access during blockages and congestion, support future industrial sites, and benefit local businesses.
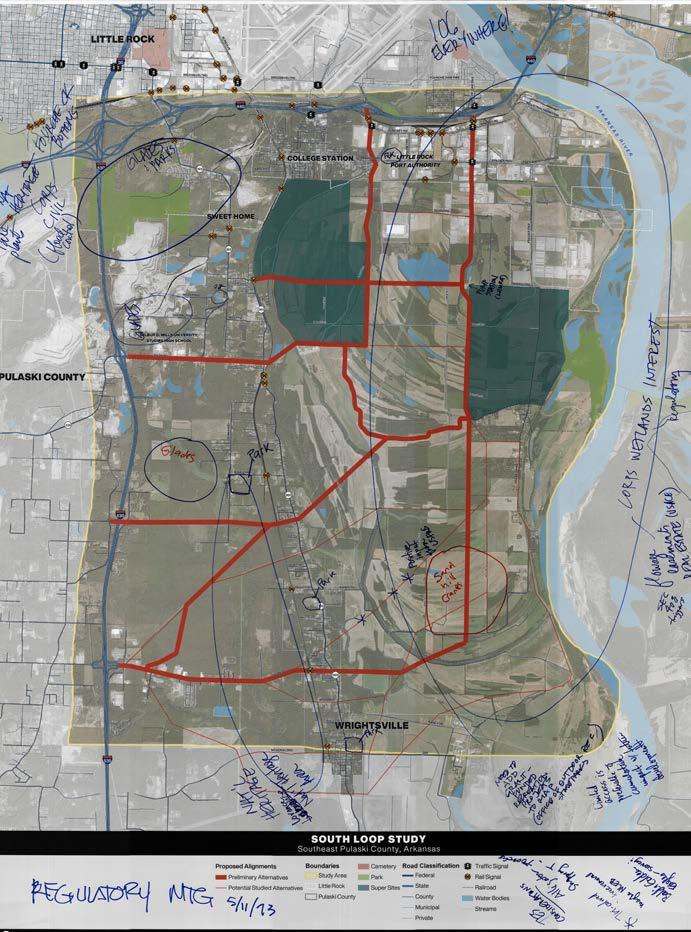
> ROUTE DEVELOPMENT: Routes from the 2006 South Loop Feasibility Study were evaluated, and additional routes were added based on potential future development sites, recent roadway improvements, and reasonable connections not previously considered. Feedback received from public meetings and the steering committee was used to narrow to alternatives shown in Figure 20. The alternatives are shown as a potential corridor the roadway could be placed within. All evaluations were performed based on impacts for the entire corridor. Future study and design will be required to determine a final alignment and impacts to specific parcels within the wider planning corridor.
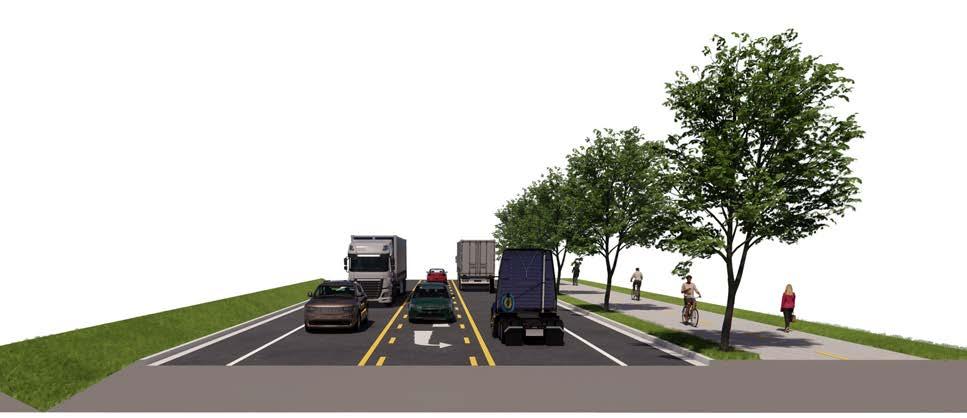
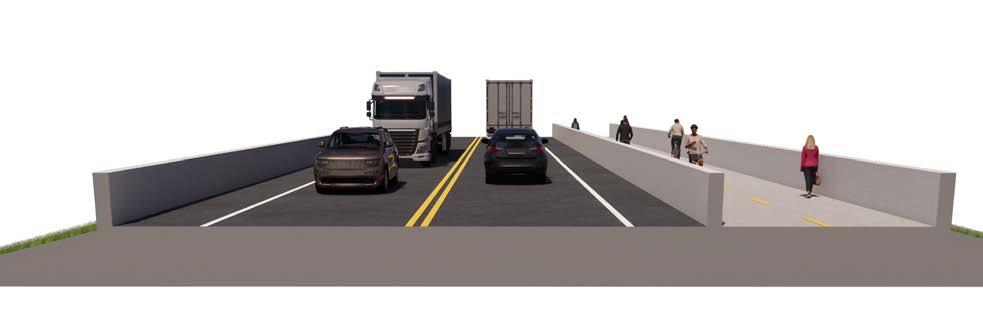
> ROADWAY CONSTRUCTION: The new roadway will be constructed as two lanes with buffered bike lanes. Consideration will be given to areas where wider cross sections might be needed, including widening existing two-lane roads to three lanes. Existing roadways will be brought to current standards and safety improvements, such as turnlanes, traffic signals, and sidewalks will be added where needed. New bridges will be constructed as two lanes with a protected sidepath.

Continued from Page 20
> GRADE-SEPARATED OVERPASSES: At grade railroad crossings pose additional risks due to the proximity of vehicles and trains and lead to delays when the crossing is blocked. The South Loop plan includes constructing overpasses to provide additional safety by separating rail and vehicle crossings and allowing residents and commercial traffic to bypass railroad crossings that cause delays.
> ECONOMIC AND COMMUNITY IMPACT: New infrastructure can attract new businesses and industries to the region, leading to job creation and increased economic growth. The improved roadway will make transportation more efficient and convenient for employers, residents, and visitors. Greater vehicle numbers could also benefit local businesses in the Highway 365 communities.
Several factors were evaluated for each route to provide a detailed comparison of the different alternatives. These topics are as follows
>>> Impacts to Developed Structures and Existing Communities: How many existing structures are within the planning corridor? Are there impacts to existing communities?
>>> Congestion Relief at Fourche Dam Pike: Will constructing the route reduce traffic congestion going into the port?
>>> Increased Access to Industrial Lands: Will the route open land for potential industrial development?
>>> Environmental Impacts: How severe are potential environmental impacts, permitting, and mitigation requirements?
>>> Directness: How short or straight is the route? Does this route have higher or lower traffic volumes due to its length?
>>> Construction Costs: How much will be needed for all portions of design and construction?
>>> Connectivity and Emergency Response: Does the alternative provide better connectivity and emergency response within the study area? What additional travel distance is needed to avoid a blockage on I-440 or Fourche Dam Pike?
>> Coordinated land use and transportation area plan will create a unified vision.
Two initiatives — the South Loop study and Pulaski County Land Use plan — exist to provide planning elements in the area. However, these initiatives alone cannot satisfy community concerns or regional and local transportation needs. Planning both halves of the study area jointly is crucial as they have differing needs but are interrelated.
An area plan is a comprehensive land use, zoning, and development analysis that addresses critical issues such as transportation, economic development, housing, and zoning. Unlike county or city plans, the area plans to focus on land use and transportation issues at a smaller scale. This is an opportunity for community-led efforts to identify potential development. When completed, an area plan usually becomes a component of a city or county land use plan.
>>> Involve the neighborhoods and business community in developing a long-term vision
>>> Evaluate existing land uses, transportation, economic development, and environmental conditions.
>>> Develop policies and actions to guide future changes in the area.
>>> Identify more detailed future land uses and suggest zoning changes.
>>> Evaluate new street connections , widening, and other improvements that can be made to complete the transportation network and provide redundancy and emergency access. Evaluate opportunities for improving sidewalks and street networks to enhance the safety and comfort of pedestrians, transit riders, and cyclists. Establish freight routes. The addition of alignments to the Master Streets Plan helps to reserve the necessary right-of-way as and when development takes place.
>>> Provide guidance on urban design , including location of buildings and parking, sidewalk width, and street trees.
>>> Provide guidance for implementing private and public investments , and strategies to realize the area’s vision.
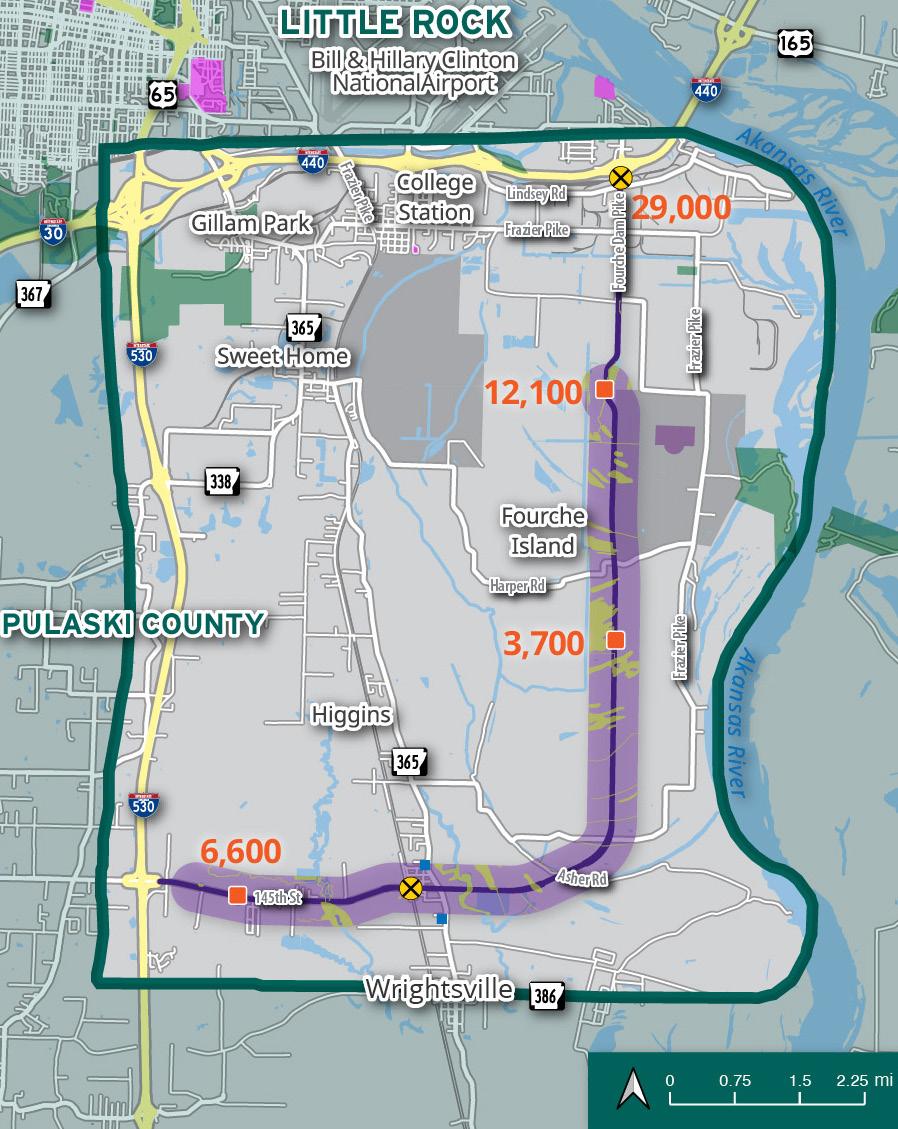
>> Alternative 1 connects I-440 at Fourche Dam Pike and I-530 at 145th Street.
Alternative 1 connects I-440 at Fourche Dam Pike and I-530 at 145th Street. It includes constructing rail-grade separations on Fourche Dam Pike and at the Union Pacific crossing in Wrightsville. Additionally, the I-530 bridge and access at 145th Street would be rebuilt under this plan. Between Highway 365 and I-530, the route can follow existing alignment or could run parallel to it on new alignment.
>>> A new grade-separated crossing at 145th Street may impact adjacent improved residential structures and additional truck traffic is anticipated through Wrightsville
>>> Opens access to potential eastern super site development
>>> Estimated cost: $70,055,000 >>> Additional miles from I-30 to Port: 12.7
Impacts to Developed Structures and Existing Communities
Congestion Relief/LOS (At Fourche Dam Pike)
Increased Access to Industrial Land
Possible impacts to Developed Structures and Existing Communities
Improvement at Lindsey Road with grade separation forecasts traffic relief on Fourche Dam Pike from F to C in 2050
High Potential to open additional industrial land for development
Environmental Impacts Limited Potential Impacts on Environmental Areas
Directness
Construction Cost
Connectivity and Emergency Response
Not a direct route; moderate traffic volume expected
Moderate cost estimated
Less additional study area connectivity or less adequate emergency routes
>> 17 Stream Crossings
>> 27 Acres of Wetland Impacted
>> 5 Miles within ANHC Focal Areas
>> 8 Miles of New Route
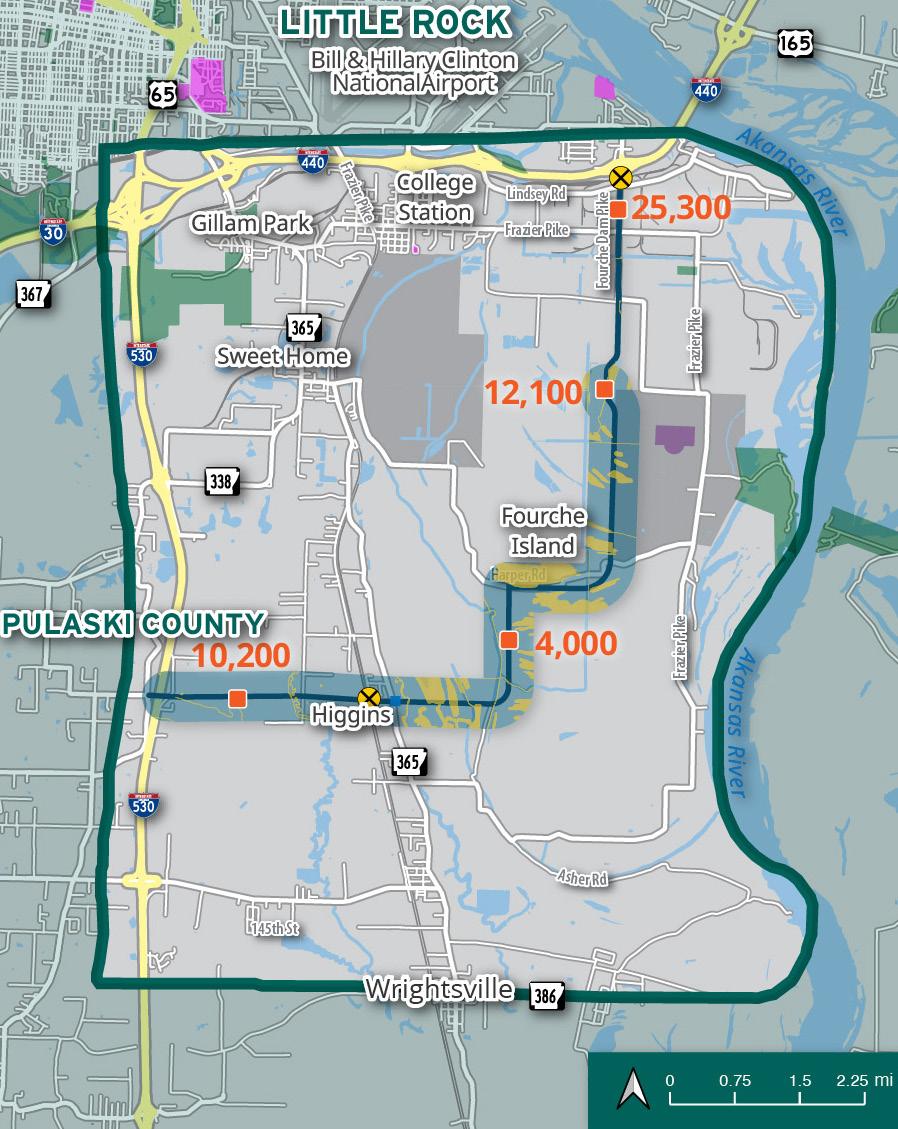
>> Alternative 2 connects I-440 at Fourche Dam Pike and I-530 at Dreher Cut-off.
Alternative 2 entails constructing rail-grade separations on Fourche Dam Pike and on the Union Pacific line west of Highway 365. The Dreher Cutoff bridge is reconstructed to provide access to I-530.
>>> A new grade-separated crossing at Highway 365 is likely to impact developed structures
>>> Opens access to potential eastern super site development
>>> Estimated cost: $68,885,000 >>> Additional miles from I-30 to Port: 8.9
Impacts to Developed Structures and Existing Communities
Congestion Relief/LOS (At Fourche Dam Pike)
Possible impacts to developed structures and existing communities
Improvement at Fourche Dam Pike with grade separation forecasts traffic relief on Fourche Dam Pike from F to C in 2050
Increased Access to Industrial Land Opens a limited amount of future industrial lands
Environmental Impacts
Directness
Construction Cost
Connectivity and Emergency Response
Least potential Impacts on Environmental Areas of all alternatives
Moderate direct route; higher traffic volume expected
Second lowest construction cost
Additional study area connectivity or adequate emergency routes lacking
>> 14 Stream Crossings
>> 22 Acres of Wetland Impacted
>> 4 Miles within ANHC Focal Areas
>> 7 Miles of New Route
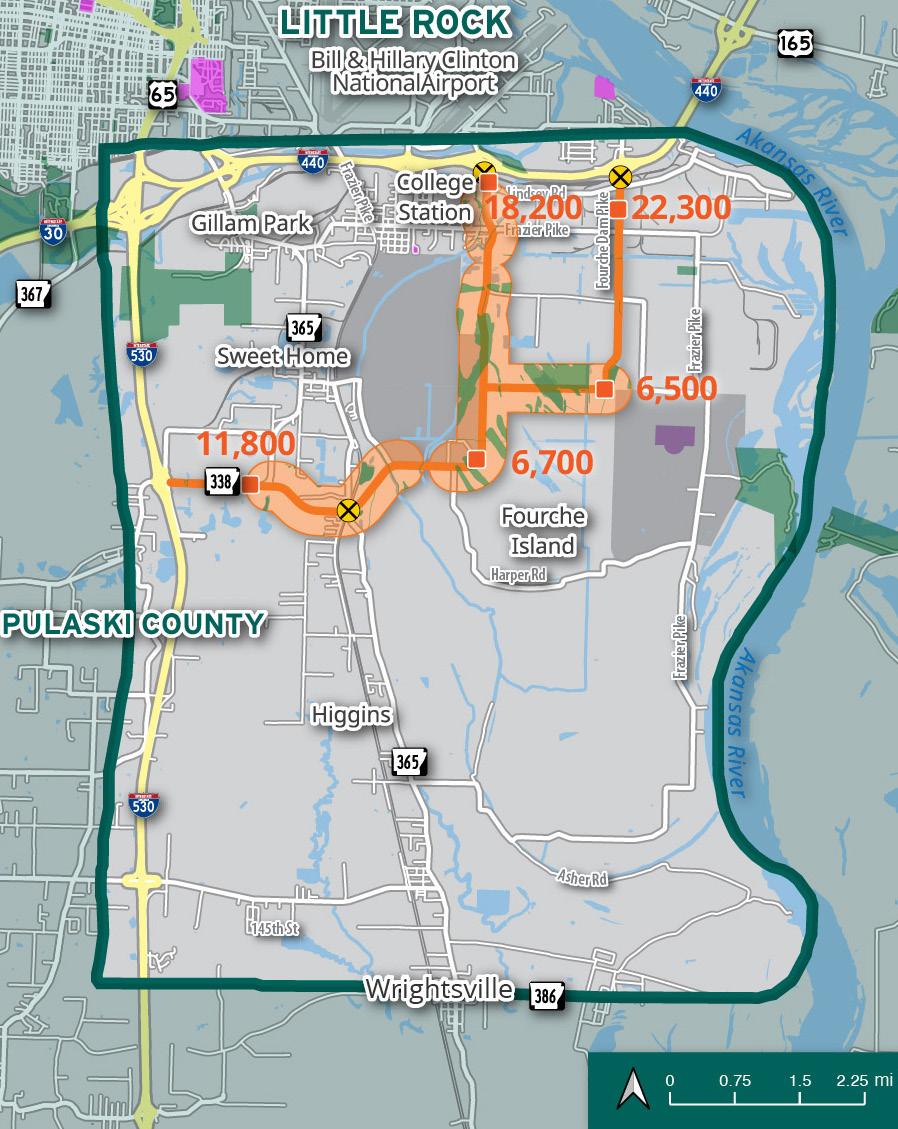
The proposal for Alternative 3 includes two connections from I-440 at Lindsey Road and Fourche Dam Pike, which will be linked to I-530 at Dixon Road. As a part of this study, a new rail-grade separation is anticipated at Lindsey Road and near Highway 365.
>>> Shortest and most direct route .
>>> Opens access to potential eastern super site development
>>> Alignment runs adjacent to Mills Middle School/High School along Highway 338/Dixon Road.
>>> Estimated cost: $55,396,250 >>> Additional miles from I-30 to Port: 4.9
Impacts to Developed Structures and Existing Communities
Congestion Relief/LOS (At Fourche Dam Pike)
Increased Access to Industrial Land
Environmental Impacts
Directness
Construction Cost
Connectivity and Emergency Response
Less anticipated impacts to developed structures and existing communities.
Improvement at Lindsey Road with grade separation forecasts traffic relief on Fourche Dam Pike from F to C in 2050
High potential to open additional industrial land for development
Greatest potential Impacts on Environmental Areas
Shortest route from Lindsey Road; higher traffic volume expected
Lowest construction cost
Provides connections at both Lindsey and Fourche Dam Pike with extension of new east/west road
>> 16 Stream Crossings
>> 42 Acres of Wetland Impacted
>> 1 Mile within ANHC Focal Areas
>> 5 Miles of New Route
The proposed Alternative 4 connects from I-440 at Lindsey Road to I-530 at Dreher Cut-off. It entails constructing rail-grade separations on Lindsey Road and the Union Pacific line west of Highway 365. The Dreher Cutoff bridge is reconstructed to provide access to I-530.
>>> A new grade-separated crossing at Highway 365 is likely to impact developed structures .
>>> Opens access to potential future growth
>>> Estimated cost: $75,808,750 >>> Additional miles from I-30 to Port: 9.7
Impacts to Developed Structures and Existing Communities
Congestion Relief/LOS (At Fourche Dam Pike)
Possible impacts to developed structures and existing communities
Traffic forecasts on Fourche Dam Pike estimated to improve from F to D in 2050
Increased Access to Industrial Land Opens the least amount of future industrial land
Environmental Impacts
Directness
Construction Cost
Connectivity and Emergency Response
Greater level of environmental impacts
Shortest overall route; higher traffic volume expected
$10 million higher construction cost estimated from lowest cost alignment
Additional study area connectivity or adequate emergency routes lacking
>> 12 Stream Crossings
>> 33 Acres of Wetland Impacted
>> 4 Miles within ANHC Focal Areas
>> 8 Miles of New Route
>> Alternative 5 connects from I-440 at Lindsey Road to I-530 at 145th Street.
Alternative 5 proposes connecting I-440 at Lindsey Road to I-530 at 145th Street. New rail-grade separation is anticipated on Lindsey Road and west of Highway 365 on the Union Pacific line. I-530 access at 145th Street will be improved by replacing the overpass and ramps.
>>> A new grade-separated crossing at Highway 365 is likely to impact developed structures.
>>> Opens access to potential future growth.
>>> Differs slightly from the alignment selected in the 2006 study and codified in the Pulaski County Master Streets Plan, as it connects to Lindsey Road at I-440 rather than Fourche Dam Pike.
>>> Estimated cost: $75,030,000 >>> Additional miles from I-30 to Port: 12.7
Impacts to Developed Structures and Existing Communities
Congestion Relief/LOS (At Fourche Dam Pike)
Possible impacts to developed structures and existing communities.
Traffic forecasts on Fourche Dam Pike estimated to improve from F to D in 2050.
Increased Access to Industrial Land Opens a limited amount of future industrial land
Environmental Impacts
Directness
Construction Cost
Connectivity and Emergency Response
Greater level of environmental impacts
Longer route; moderate traffic volume expected
$10 million higher construction cost estimated from lowest cost alignment
Less additional study area connectivity or adequate emergency routes could be better
>> 16 Stream Crossings
>> 34 Acres of Wetland Impacted
>> 6 Miles within ANHC Focal Areas
>> 9 Miles of New Route
Alternative 6 proposes connecting I-440 at Fourche Dam Pike to I-530 at Woodson Lateral. Grade separations are anticipated at Fourche Dam Pike and the Union Pacific line between Woodson Lateral and Highway 365. Alternative was added at the request of the public and preliminary analysis was completed.
>>> Attracted the fewest number of vehicles
>>> Passes through Arkansas Department of Corrections facilities and Woodson Levee.
>>> Significantly higher environmental impact due to length and adjacency to Arkansas River
>>> Additional miles from I-30 to Port: 23.1
Impacts to Developed Structures and Existing Communities
Congestion Relief/LOS (At Fourche Dam Pike)
Increased Access to Industrial Land
Environmental Impacts
Directness
Construction Cost
Connectivity and Emergency Response
>> 28 Stream Crossings
>> 12 Acres of Wetland Impacted
No anticipated impacts to developed structures. Alignment runs through Arkansas Department of Corrections property.
Improvement at Lindsey Road with grade separation forecasts traffic relief on Fourche Dam Pike from F to B in 2050.
Opens a limited amount of future industrial land
High number of environmental and levee impacts south of the study area.
Significantly longer than other alternatives; low traffic volume expected
Costs were not developed for this alternative, but are expected to be higher than Alternative #1 due to length and environmental impacts
Additional study area connectivity lacking or adequate emergency routes needed
>> 2 Miles within ANHC Focal Areas
>> 13 Miles of New Route
>> This comparative analysis evaluates the feasibility and implications of various alternatives for establishing a South Loop access route to the Port of Little Rock. The assessment was carried out by thoroughly analyzing alternatives and assessing various factors such as traffic, land use, environmental impacts, community impacts, and cost estimates. The comparative analysis process in the document involved evaluating different alternatives for a proposed South Loop access route.
>>> Potential routes were examined in detail, considering factors like length, water and railroad crossings, and environmental impacts.
>>> A conceptual analysis was developed to understand the costs and impacts of different alignments, considering the likelihood to impact developed structures and affected areas.
>>> Key statistics and performance measures were analyzed to understand the transportation impacts/benefits of the South Loop Corridor.
>>> Good transportation infrastructure is vital for a thriving economy. A well-connected roadway system enables efficient travel and transport, ensuring that goods and services can be moved quickly, and people can reach their destinations on time. It also provides alternative routes to ensure transportation services remain uninterrupted in emergencies.
DIMENSIONAL ANALYSIS
Environmental Impacts Land Use
Right-of-Way Impacts TRAFFIC MODELING
Traffic Forecasting Crash Analysis
COMPARATIVE ANALYSIS
Community Input
Construction Costs
Economic Development
Emergency Response
RECOMMENDED ALTERNATIVE
Continued from Page 29
>>> Alternative 4 has the highest impact on floodplains.
>>> Alternatives 1 and 2 have the potential to minimize negative land use effects on wetlands, streams, floodplains, and sensitive habitats.
>>> Alternatives 4 and 5 have the highest potential environmental impacts on natural and cultural features such as glades, wildlife habitats, wetlands, and streams, while Alternatives 1 and 2 have the lowest.
>>> All alternatives in the study area may disproportionately affect disadvantaged communities in the study area, and special care should be taken to limit adverse effects.
>>> Alternative 4 offers the most significant reduction in delays at I-530 northbound, while Alternative 2 has the lowest Vehicle Miles Traveled, Vehicle Hours Traveled, and Volume to Capacity ratio.
>>> Construction of a new road in the study area will improve safety. All alternatives allow a more evenly distributed traffic flow.
>>> Alternatives 1 and 3 provide easier access to the Port of Little Rock.
>>> Alternative 3 was preferred as it minimized impacts on developed structures, community facilities, and parks compared to other alternatives.
>>> Alternatives 2 and 3 provide the most direct and efficient routes between I-440 and I-530, which could enhance the connectivity and mobility of the Port and the surrounding industrial areas.
>>> Estimated costs for new roadway construction and widening were prepared, including costs for new rail-grade separations and highway interchange improvements.
>>> Cost factors: The main factors that affected the costs were the length of the roadway, the number and type of drainage structures, the amount of right-of-way acquisition, and the cost of mitigating environmental impacts.
>>> Cost range: The total estimates ranged from $55 million for Alternative 3 to $75.8 million for Alternative 4.
Congestion Relief/LOS (At Fourche Dam Pike)
Increased access to Industrial land
Environmental Impacts
Directness
Construction Cost
Connectivity and Emergency Response
>> After analyzing the data, Alternative 3 is recommended for further consideration as it demonstrated the highest level of feasibility and practicality with favorable outcomes.
> DIRECTNESS: Alternative 3 provides the most direct and efficient route between I-440 and I-530, reducing travel time and distance for Port traffic and improving access to future industrial land uses.
> ECONOMIC DEVELOPMENT: This alternative supports the industrial growth and expansion of the Port of Little Rock by providing enhanced access to industrial development and redundancy in the network with connections to both Fourche Dam Pike and Lindsey Road.
> COMMUNITY IMPACTS: Alternative 3 has less potential for direct impact on developed structures. This route minimizes the impacts on the existing communities and disadvantaged populations by following the existing Thibault Road corridor and avoiding residential areas. The alignment does pass adjacent to a middle and high school, so special care should be given to the design and mixing of traffic.
> ENVIRONMENTAL IMPACTS: Alternative 3 has a high environmental impact . Due to the high number of stream crossing and large area of potential wetland impacts, a detailed environmental study will be required to determine the level of permitting required. Environmental permitting will be an lengthy process and the cost of mitigating impacts can escalate quickly.
> COST ESTIMATES: This route has the lowest estimated total cost of $55 million, which includes construction, right-of-way acquisition, utility relocation, and environmental mitigation.
> TRAFFIC DEMAND: Alternative 3 shows moderate improvement in travel speed, delay, and level of service compared to the no-build scenario. It also reduces the traffic volume and crashes on Fourche Dam Pike and I-440.
> CONNECTIVITY AND EMERGENCY RESPONSE: This alternative creates redundancy in the network, providing better emergency response and alternatives when roads are blocked.
> BENEFIT-COST ANALYSIS: A full segment Benefit-Cost Analysis was conducted for each alternative, but no alternative demonstrated a net benefit since the development in the study area has not reached a point where it can fully utilize the advantages of the entire alignment . Based on the phasing plan described in the Next Steps section on page 32, a smaller segment may show a net benefit upon future analysis.
> LONG-TERM CONSIDERATIONS: The Port of Little Rock plans to expand industrial development, leading to a significant increase in truck traffic over the next few decades. To support this growth, additional roadway capacity will be necessary. However, constructing just one roadway will not be sufficient. To create a well-designed and comprehensive roadway network, a long-term strategy should be developed that considers constructing Alternatives 1 and 2.
>> This phased approach aims to address immediate concerns while planning for future developments in the Little Rock Port Area.
Begin area planning effort
Conduct an environmental review, engineering alignment, and cost benefit analysis study of recommended alternative
An area plan establishes a vision and a more granular analysis of the transportation and land use components.
A detailed alignment and engineering study will set the final alignment and provide an engineering-level review, cost estimates, environmental assessment, and cost benefit analysis.
Short-term
Alternative 3: Grade-separate Lindsey Road at the railroad
Relocate marshaling yard
Grade-separate Fourche Dam Pike at the railroad
Alternative 3: Grade separation of the Union Pacific Railroad and Highway 365
Alternative 3: Connect to I-530 Interchange
Facilitate a grade-separated crossing for better access to the Port.
Moving the marshaling yard limits frequency and length of delays at Fourche. Coordination with Class I rail carriers and Port area industries will be required.
Becomes more feasible and cost-effective after the relocation of the marshaling yard.
Separating traffic from the Union Pacific mainline near Highway 365 will improve safety and better serve nearby communities.
Short-term
High
Medium
Alternative 1 and 2
Medium
Long-term
New road construction and upgrades to Dixon Road provide a connection to I-530. Long-term
Evaluate the potential for constructing additional routes to improve connectivity and accessibility in the study area. Long-term
and wetlands
Figure 2-5: Potential Area of Wetland impacted by each Alternative Alignment
Figure 2-6: Potential Total Length (Linear feet) of Stream impacted by each Alternative Alignment
Figure 2-7: Alternative Alignments and Environmental Justice Screen, People of Color
Figure 2-8:
Although the South Loop study area is primarily centered around farmland, land affected by floodway, or reserved for economic development in the Port of Little Rock, the team placed great care and focus on engaging community residents. These include Wrightsville at the southern area of the study area, the unincorporated communities of College Station and Sweet Home, which are located just outside the City of Little Rock, and the unincorporated community of Higgins, located between Wrightsville and the City of Little Rock on Highway 365. The community engagement process of the South Loop study progressed generally in the following order:
1. Collect technical data and background information
2. Review existing and concurrent plans, such as the 2006 South Loop study and the ongoing Pulaski County Land Use Plan update
3. Receive input and guidance from steering committee and regulatory stakeholders to determine preferred and suitable alignments
4. Engage area residents to provide project overview and anticipated benefits and impacts, as well as preferred alignments for consideration or removal
5. Relay community engagement to the steering committee and adjust plans accordingly
6. Engage area residents
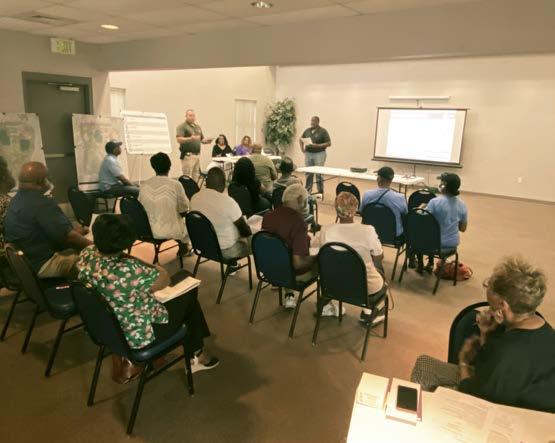
Community-specific meetings were publicized and organized with the assistance of steering committee members who were also area residents. Meetings were held at Wrightsville, College Station as part of the monthly Progressive League meeting, Higgins, and again at Wrightsville. Two outreach meetings were also held at the Port of Little Rock. Residents were concerned about anticipated increases in traffic volume and safety of residents and school age children associated with large trucks moving in and out of the port, as well as speeding. Most notably, however, recurring resident concerns were rooted in the historic trend of transformation and economic development projects disrupting and fragmenting established communities of color. The team and client were aware of these concerns, and as a result, empathetic and careful listening and outreach was incorporated into project planning from the very beginning of the study.
The primary challenge of community engagement resided in communicating the history of the South Loop and its overall purpose, including the uncertain timeline of when a new transportation corridor would actually be constructed.
The results, collected over the course of seven public meetings clearly reflect two primary desires: preserving existing communities (29%), and improving
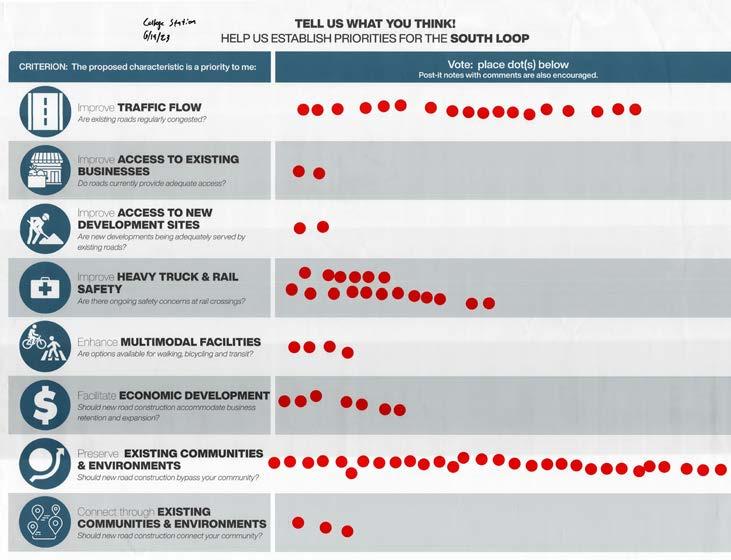
safety pertaining to heavy truck and rail access (16%).These are corroborated by the sentiment and feedback received at each meeting. While 12% of respondents indicated support for the South Loop study and the final alignment facilitating economic development, overall sentiment demonstrated unease about widening an existing roadway and displacing residents or businesses, such as 145th Street in Wrightsville. Project support translates generally to a preference for a new roadway alignment as opposed to widening an existing roadway.


The concerns of area residents regarding heavy truck and rail safety resembled those of Port of Little Rock staff and steering committee members. Employees of the Port and area residents alike are affected by backups from rail cars moving into and out of the Port, most significantly on Fourche Dam Pike, and also Lindsey Road, particularly during peak travel times. Residents indicated a desire for elevating either the roadway or the railroad to create grade-separated crossings to increase safety and traffic flow.
A summary of steering committee and public engagement meetings is included below.
Steering Committee Meeting #1 – August 2022
• The project, study team, and role of the steering committee was introduced
• There was a discussion on the purpose & need of the study
• The proposed work plan and schedule was reviewed
• Early ideas of the study were generated
Steering Committee Meeting #2 – December 2022
• There was a review of the existing data collection
• The existing traffic modeling was discussed including Streetlight trip origin & destination date and the need to update traffic data for years 2021 & 2022
• A plan for regulatory and stakeholder engagement was reviewed and the format for public engagement meetings was discussed.
• There was additional discussion on the study purpose and need
• A map of preliminary route alternatives and other relevant maps were reviewed.
• The study area data collection process and existing traffic data analysis results were presented
• There was a discussion on the alternative development process and public engagement meetings plans were shared
Regulatory Stakeholder Meeting – May 2023
• The study background including project partners & representatives, the study area, purpose, and key consideration was presented.
• Existing data for the study area including traffic data analysis and population were reviewed.
• Alternative development and alternative analysis processes were discussed.
• Stakeholders were invited to discuss the study with Crafton Tull and Michael Baker International staff, leave comments & marks on study area maps, participate in a prioritization exercise, and complete a comment card.
• There was a recap of public engagement meeting results including a review of prioritization feedback and comments received.
• A discussion of potential routes was held and five routes were selected for detailed analysis.
• The broad environmental and engineering constraints for the potential routes were identified.
• An alternatives analysis process was introduced.
Port Board Update – October 2023
• The public engagement responses were reviewed, and the five routes for detailed analysis were introduced
• Potential rail grade separation locations and alignments were discussed
1-3:
Port Industry Council – September 2022
• The study was introduced and a study area map was shared.
• An informal discussion on purpose & need for the study was held.
• Attendees were given the opportunity to provide feedback on the study.
Public Engagement Meeting – May 2023
College Station Progressive League Public Meeting – June 2023
Wrightsville Public Meeting #1 – May 2023
Sweet Home Public Meeting – June 2023
• The study background including project partners & representatives, the study area, purpose, and key consideration was presented.
• Existing data for the study area, including traffic data analysis and population, were reviewed.
• Alternative development and alternative analysis processes were discussed.
• Attendees were invited to discuss the study with Crafton Tull and Michael Baker International Staff, leave comments & marks on study area maps, participate in a prioritization exercise, and complete a comment card.
Wrightsville Public Meeting #2 – September 2023
Higgins Public Meeting – October 2023
• There was a recap of public engagement meeting results, including a review of prioritization feedback and comments received.
• The locations and alignments for potential rail grade separation were presented.
• The five selected alignments for detailed analysis were shared with an accompanying map and route details.
• The alternative analysis relative to active mobility considerations, environmental constraints, and engineering constraints was introduced.
• Potential cross-sections with active mobility accommodations were presented.
• Following the presentation by Crafton Tull , Port , and Metroplan staff time was given for public comments and questions.
• Attendees were invited to discuss the study with Crafton Tull , Port , and Metroplan staff, leave comments & marks on the route maps, and provide comments on the study progress
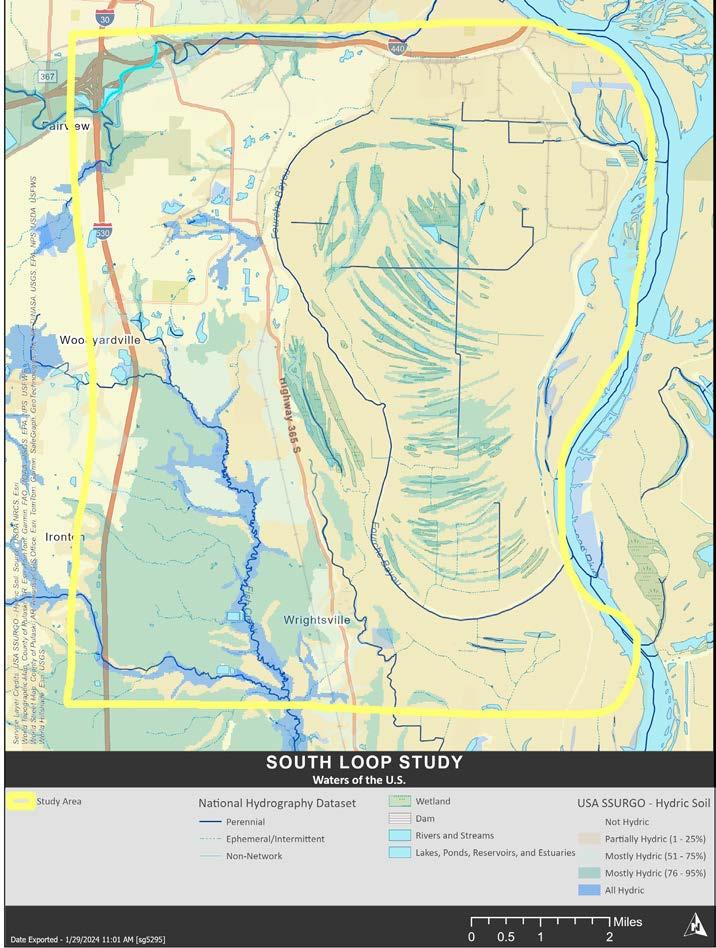
Highway 365 runs from north to South and divides the project area into relatively distinct land-use areas. The eastern portion is dominated by Prime Farmland and Farmland of Unique Importance (USA Soils Map Units Farmland Class) bounded by the Arkansas River levee system, with soybean and hay production agriculture east of the Fourche Bayou, interspersed with woody wetlands. Centuries of flooding along the banks of the Arkansas River have created distinctive soil and hydrological functions for floodwater storage. Hydric soils, wetlands, marshes, and other ecological features help improve water quality and provide habitat for fish and wildlife.
FEMA Regulatory Floodways bound the Project Area to the north (Fourche Creek) and east (Arkansas River) with narrow tracts of floodway adjacent to Fish Creek and Lorance Creek in the southwest (Figure 2 1).
The Head of Fourche Island to Pennington Bayou Local Flood Project is a federally authorized flood risk management initiative, not federally operated or maintained. This project (Figure 2 1), including the Fourche Island Drainage District No. 2 and the Woodson Levee District, aims to reduce flood damage across approximately 21,580 acres of rural lands, encompassing homes, businesses, and agricultural areas in Pulaski County, Arkansas. Positioned on the right bank of the Arkansas River, the project spans about 19 miles from a point nine miles south of College Station to high ground three miles east of Hensley.
Community development is concentrated along Highway 365. West of this development is a large, wooded area with significant wetland areas associated with Fish Creek. The predominant land cover between these developed areas is Evergreen and Deciduous Forests, with wetlands, streams and ponds typical of large floodplains (of the Arkansas River).
While the whole project area is generally dominated by hydric soils, Soil Survey Geographic Database (SSURGO) classified soils as “Mostly Hydric” (Class Name) dominate the central and southwestern portions of the project area. Mostly Hydric soils are soils with 51-100% hydric characteristics. The western half of the project area is predominantly Partially Hydric soils (1-25%).
Natural and other notable features are shown in Figure 2 3, include the Arkansas Natural Heritage Council (ANHC) identified areas, south of Alternative Alignment 3 and West of Highway 365, as an ANHC Focal Area, called Lorance Creek Focal Area, which extends outside the project area to Clear Creek in the South. This Focal Area is part of the Coastal Plain / Mississippi Alluvial Plain transition Zone. A portion of the Fourche Creek and Central Arkansas Glades (Nepheline Synite) Focal areas intersect the project area to the northwest. A small Nepheline glade potentially occurs at Gillam Park located on Highway 365, northwest of Sweet
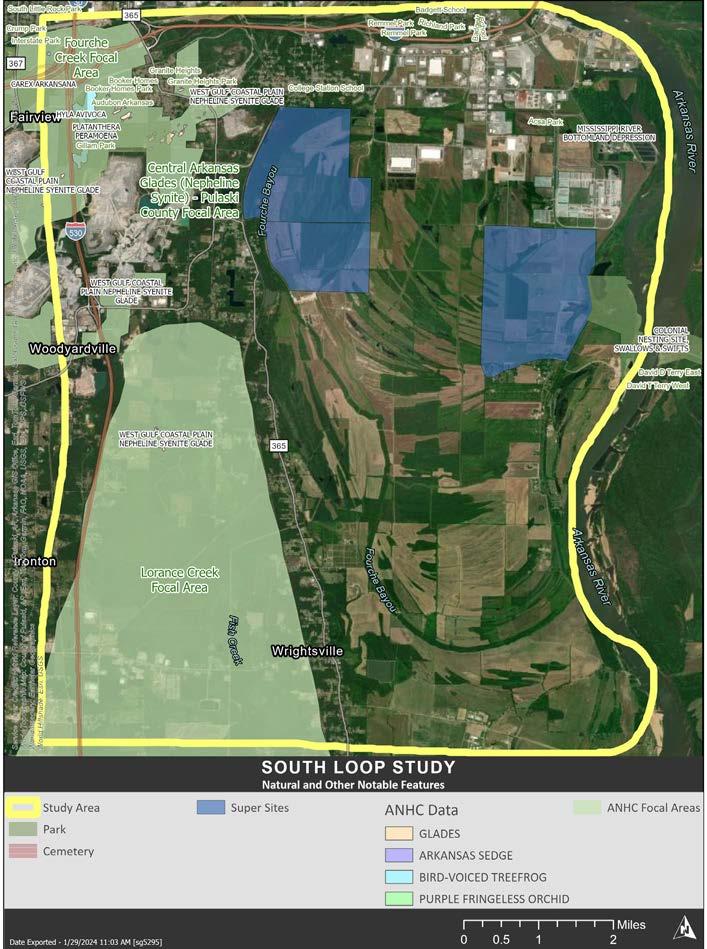
Home. These focal areas are characterized by relatively high degrees of intact habitat cores, more so than areas to the East of the project area, which are more agricultural. A potential Super Site has been identified to the east bordering David D. Terry Park on the Arkansas River. A second future development area lies in the north, stretching from near College Station to Harper Road.
The 2006 South Loop Feasibility Study included documentation on the potential environmental impacts of the South Loop, including the conversion of prime farmland and substantial wetlands due to the proximity to the Arkansas River.
Any design work will require close coordination with the USACE and US Fish and Wildlife Service (USFWS), which expressed concern regarding the cumulative impacts of such development in the area around Fish Creek. Cumulative impacts, while acknowledged, have not formed part of this environmental review.
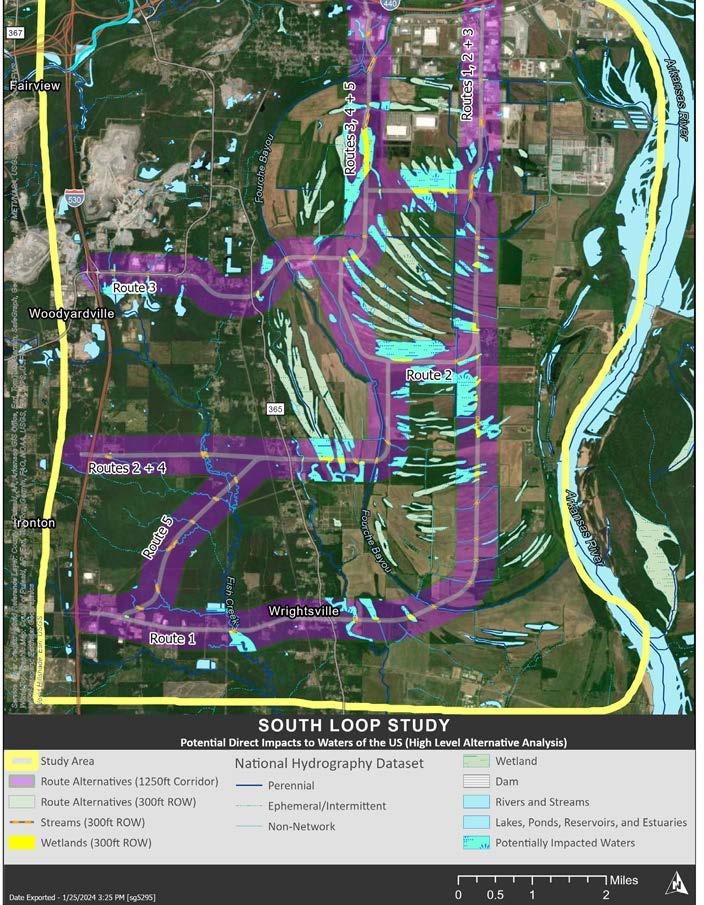
An assessment corridor was applied to all five alternative alignments to assess potential direct impacts on wetlands and streams (Waters of the US), ANHC focal areas, glades, and agricultural land. Due to the extent of the project area and the scoping nature of this review, it is important to note that physical examination of the proposed Alternative is essential. Several assumptions have been made to compare proposals and allow for high-level identification of potential environmental concerns.
Publicly available environmental data was clipped to the evaluated width of each alternative alignment and assessed. A simplified USACE “Charleston District” method was applied to streams and wetlands to achieve a cost estimate for potential compensatory mitigation. Without accurate delineation, jurisdictional determination, and classification of wetlands and streams, this exercise allowed for a normalized comparison between proposed alternative alignments.
Alignments 4 & 5 potentially impact more wetlands than 1 & 2, with Alternative 3 potentially impacting the most (Figure 2 5). Alternatives 3 & 5 potentially impact the most linear feet of Stream, with Alternatives 1 & 2 impacting comparatively fewer (Figure 2 6). The need for Clean Water Act (CWA) Section 404 and potential Nationwide Permits will only be determined after field investigation and subsequent delineation and jurisdictional determination. Such determination will require coordination with the USACE.
No Arkansas Heritage Protection Program (AHPP) National Register and Survey Database sites were found within the 1,250ft buffer (2,500ft Right of Way (ROW)) of all alternative alignments.
Previous cultural and archaeological studies have been completed at sites within the study area and have found limited evidence of historical activities, likely due to the heavy flood events before the large flood control projects. However, the 2006 Feasibility Study suggests a high risk for finding unrecorded sites during field investigations and construction activities. For federally funded projects, a more detailed study and analysis will need to be completed as part of the scope.
Much of the project area falls within Federal Emergency Management Agency (FEMA) Hazard Zones, with the eastern areas typically within the 1% Annual Chance Flood Hazard and Area with Reduced Risk due to Levee. Alternatives 1, 2, 4 & 5 all pass over Fish Creek and its associated Regulatory Floodway. Careful consideration and planning are required during the project’s design stage, with early consultation with FEMA, to mitigate flooding impacts.
While the whole project area is generally dominated by hydric soils, Soil Survey Geographic Database (SSURGO) classified soils as “Mostly Hydric” (Class Name)
dominate the southeastern portions of the project area. Mostly Hydric soils are soils with 51-100% hydric characteristics. These areas may require additional engineering to ensure appropriate drainage during storm events.
An overview of the public engagement activities relating to this project can be found in Section 4. Wrightsville, College Station, Higgins, and Sweet Home
had similar concerns about potential impacts a new roadway might have on their communities. Traffic, large trucks, noise, and potential disruptions to longstanding communities of color were the primary concerns voiced in these public forums.
Residents of Wrightsville expressed concern and a strong priority for preserving existing communities during the public engagement phase, especially along the 145th Street corridor where the existing right-of-way is approximately 60-70’. An increase in the right-of-way width or grade separation along this corridor will likely impact existing residences and remove access to 145th Street from connecting streets.
During recent years of industrial and logistics development in the Port, the College Station community has seen an increase in traffic volumes that includes heavy trucks and delivery vehicles using the Bankhead Drive exit from I-440 to access Frazier Pike. Bankhead Drive is probably utilized by these vehicles to avoid rail crossing at Lindsey Road and Fourche Dam Pike, or due to misdirection by navigation systems or wayfinding apps. The roads and intersections within College Station are not designed for large vehicles. Increased volume has created potential hazards at the elementary school, community center, and small businesses within College Station. Rail grade separation within the Port at I-440, or an extension of Bankhead Drive would potentially decrease trucks and Port traffic on these local roads.
The U.S. Environmental Protection Agency (EPA) created a screening tool combining a large amount of demographic and environmental data to create a common starting point when looking at issues related to environmental justice. The alternative alignments are all within areas containing a higher percentage of people of color, as depicted in Figure 2 7. All alternatives impact communities of color to some extent, and special care should be taken to limit community impacts, such as including resident input in all design phases.
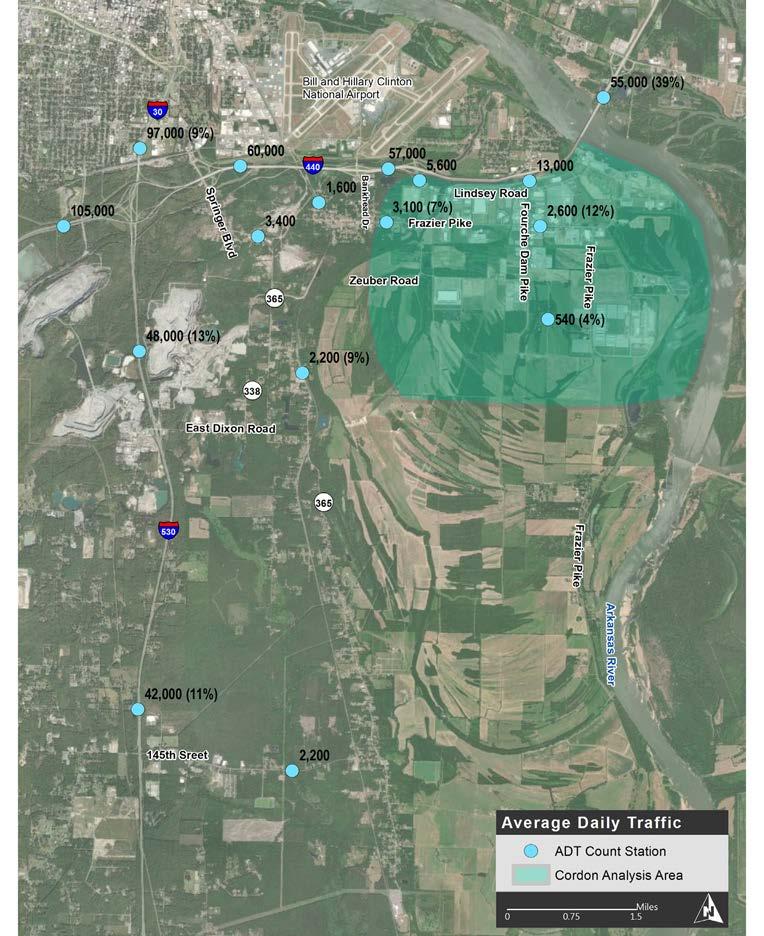
The existing condition traffic count data was obtained from the Arkansas Department of Transportation (ARDOT) Average Daily Traffic (ADT) data portal, which provided the most recent and historical traffic count data for permanent and temporary count stations. Figure 2-8 depicts the 2021 ADT of major roadways in the study area and the truck percentages on available count stations.
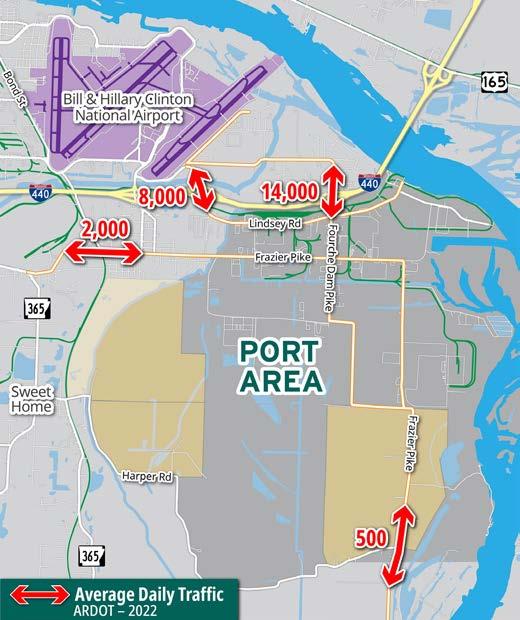
The highest ADTs in the study area are observed on two interstate freeways. I-440 carries 56,000 to 60,000 vehicles daily, and I-530 serves 42,000 to 48,000 vehicles daily. Fourche Dam Pike has the highest ADT within the study area for the surface streets. The north portion connecting with the I-440 interchange experiences 13,000 daily vehicles, and the ADT is approximately
Version 1.0 of the CEJST: Technical Support Document
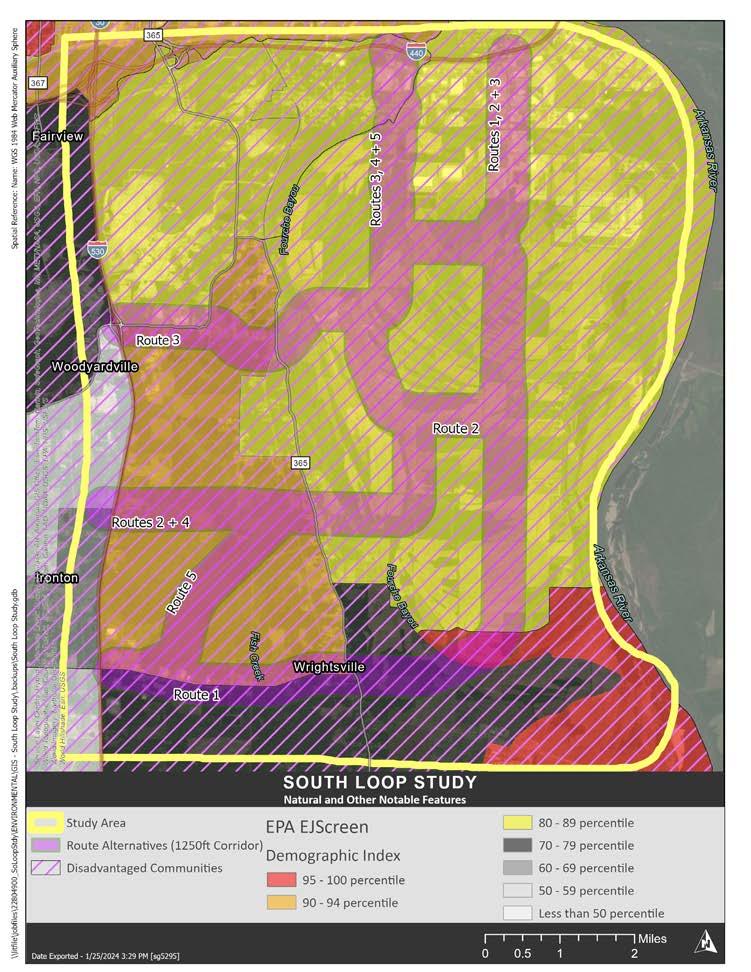
2-7: Alternative Alignments and Environmental Justice Screen, People of Color (US EPA 2023, CJEST 2022)
Table 1. Overview of methodology used in version 1.0 of the CEJST (Items marked as NEW are changes made from the beta version to version 1.0)
Communities are considered disadvantaged:
• if they are located in a census tract that meets the thresholds for at least one of the tool’s categories of burden, or;
• if they are on land within the boundaries of Federally Recognized Tribes (NEW)
Census tracts that are completely surrounded by disadvantaged communities are also considered disadvantaged if they meet an adjusted low income threshold (≥ 50th percentile). (NEW)
Category Environmental, climate, or other burdens
Climate change 1. Expected agriculture loss rate ≥ 90th percentile OR
2. Expected building loss rate ≥ 90th percentile OR
3. Expected population loss rate ≥ 90th percentile OR
4. Projected flood risk ≥ 90th percentile (NEW) OR
5. Projected wildfire risk ≥ 90th percentile (NEW)
Energy 1. Energy cost ≥ 90th percentile OR
2. PM 2.5 in the air ≥ 90th percentile
Health 1. Asthma ≥ 90th percentile OR
2. Diabetes ≥ 90th percentile OR
3. Heart disease ≥ 90th percentile OR
4. Low life expectancy ≥ 90th percentile
Housing 1. Historic underinvestment = Yes (NEW)
2. Housing cost ≥ 90th percentile OR
3. Lack of green space ≥ 90th percentile (NEW) OR
4. Lack of indoor plumbing ≥ 90th percentile (NEW) OR
5. Lead paint ≥ 90th percentile
Legacy pollution 1. Abandoned mine land present = Yes (NEW) OR
2. Formerly Used Defense Site (FUDS) present = Yes (NEW) OR
3. Proximity to hazardous waste facilities ≥ 90th percentile OR
4. Proximity to Superfund or National Priorities List (NPL) sites ≥ 90th percentile OR
5. Proximity to Risk Management Plan (RMP) sites ≥ 90th percentile
Transportation 1. Diesel particulate matter ≥ 90th percentile OR 2. Transportation barriers ≥ 90th percentile (NEW) OR
3. Traffic proximity and volume ≥ 90th percentile
Water and wastewater 1. Underground storage tanks and releases ≥ 90th percentile (NEW) OR
2. Wastewater discharge ≥ 90th percentile
Workforce development 1. Linguistic isolation ≥ 90th percentile OR
2. Low median income ≥ 90th percentile OR
3. Poverty ≥ 90th percentile OR
4. Unemployment ≥ 90th percentile
* Low Income = 65th percentile or above for census tracts that have people in households whose income is less than or equal to twice the federal poverty level, not including students enrolled in higher education (NEW method of calculation)
Table 2-1: Overview of methodology used in version 1.0 of the CEJST (CEJST 2022)
7,100 when approaching the intersection with Frazier Pike. Lindsey Road has approximately 5,600 daily vehicles as another primary road connecting the Little Rock Port area with I-440. The ADTs on Frazier Pike and Springer Boulevard are 3,100 to 3,400, and Highway 365 experiences approximately 2,200 daily vehicles. 145th Street carries about 2,200 vehicles per day. The truck percentages on I-530 are 11% to 13%. The highest truck percentage is on I-440 east of Arkansas River, which is close to 39%. The truck percentage ranges from 4% to 12% on the study area’s surface streets, with higher truck percentages near the Port Area and other industrial parks.
Approximately 22,000 vehicles per day entered and exited the green highlighted area in Figure 2-8. The Little Rock Port Area is the most significant traffic generator within this highlighted area. These trips can most potentially benefit from the new South Loop Corridor as a daily commuting route to access the Port Area or as an alternative reliever route to I-530 and I-440.
Origin and destination (OD) data provides information on the trip generators and attractors in the study area and how the significant roadways are used for daily travel. StreetLight data, which samples anonymous travel data from in-vehicle smartphones and Global Positioning System (GPS) devices, which was used to analyze the trip OD patterns in this study. The OD data was collected for trips from Monday through Sunday in 2019, and 24 zones were defined in StreetLight to represent the main origins/destinations in and surrounding the study area, such as I-30 North and West, I-440 East, I-530 South, I-630, Highway 365, Highway 338, Fourche Dam Pike, Frazier Pike, Springer Boulevard, Bankhead Drive, and other major roadways in the area. The OD analysis was carried out for five defined areas: the entire study area, the northern portion, the northwest, the northeast, and the middle/south portion.
From the analysis, most trip generators/attractors are located in the northern part of the study area (i.e., between I-440 and North of Sweet Home). During weekdays, the northern area generates 75% of the total trips and attracts 73% of the total trips from the surrounding areas. During the weekend, the northern part generates 64% of the trips, attracting 62% from the surrounding areas. The northwest area (West of Mauney Road) contributes to 39% of total weekday trips and 42% of weekend trips. The northeast area (East of Mauney Road) contributes 36% of weekday trips and 20% to 22% of weekend trips. The middle/southern part of the study area generates and attracts about 25% of the total weekday trips and 36% to 38% of the total weekend trips.
On weekdays, many trips generated/attracted in the study area are traveling to or from the East, North, and West through the interstate freeways. There is also increased traffic flow during weekend travel to the South of the study area. In the OD data, 21% of the weekday trips in the study area travel to or from the East using I-440. Over 15% of the weekday trips in the study area travel to or
from the North using I-30, and approximately 15% of the total trips travel through I-30 to the West. During the weekend, the portion of trips to and from I-440 East drops to about 13%. However, the number of trips to and from I-30 West and I-30 North has increased compared to the weekdays. Over 17% of weekend trips are heading to I-30 North, and over 15% are heading to I-30 West. Approximately 11% of the weekend trips are to and from Highway 365 South.

Figure 2.9 and Figure 2.10 display the top-ranked OD pairs across and inside the study area on weekdays. Many trips travel to or from Fourche Dam Pike to I-440 East, I-30 North, and I-30 West. Fourche Dam Pike provides an essential connection between the surrounding industrial properties and I-440. The second most significant OD pair is 145th Street and Highway 365 South. Several
trips travel to and from Springer Boulevard to I-630 and I-30 West. During the weekend, in addition to the trips between Fourche Dam Pike and I-440 East, there are a few trips from 145th Street to I-30 North and Highway 365 South. Significant trips are observed during the weekend between Springer Boulevard (mainly residential lane use) to I-30 North, I-630, and I-30 West.
For the OD pairs inside the study area, the trips to and from Springer Boulevard to Highways 365 and 338 are significant during weekdays. There are also a certain amount of trips between Fourche Dam Pike and Frazier Pike South of Birdwood Drive and between Fourche Dam Pike and Frazier Pike West. These OD patterns inside the study area are also observed on the weekend.
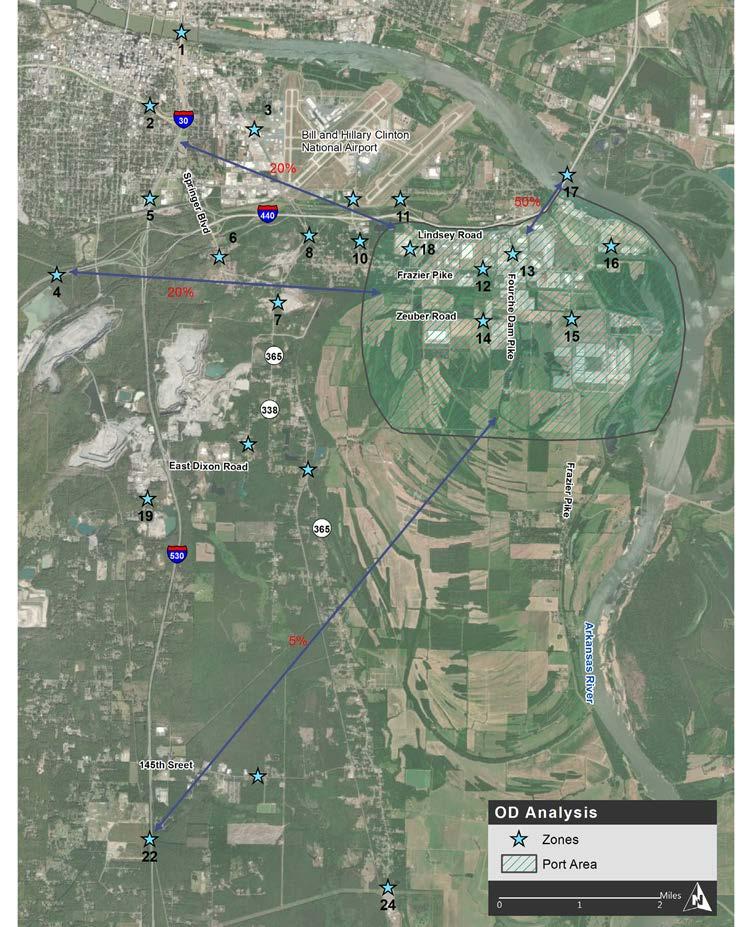
Figure 2.10 shows the trip patterns for the Little Rock Port Area during weekdays. About half of the traffic in and out of the Port Area goes to or from I-440 East. Approximately 20% of the trips travel to or from the I-30 North, and 20% to or from I-30 West. About 5% of the trips in and out of the Port Area travel to or from I-530 South. During the weekend, the major OD trip patterns are approximately one-third of weekday trips from the StreetLight data. Total trips in the Port Area are likely driven by weekday employment traffic, which often experiences morning and afternoon peak travel times.
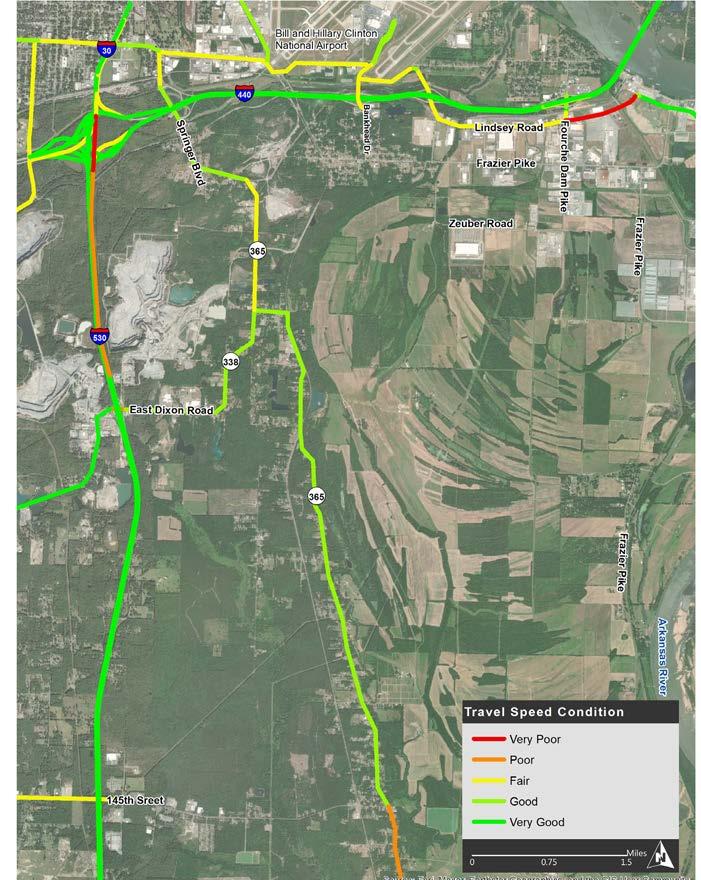
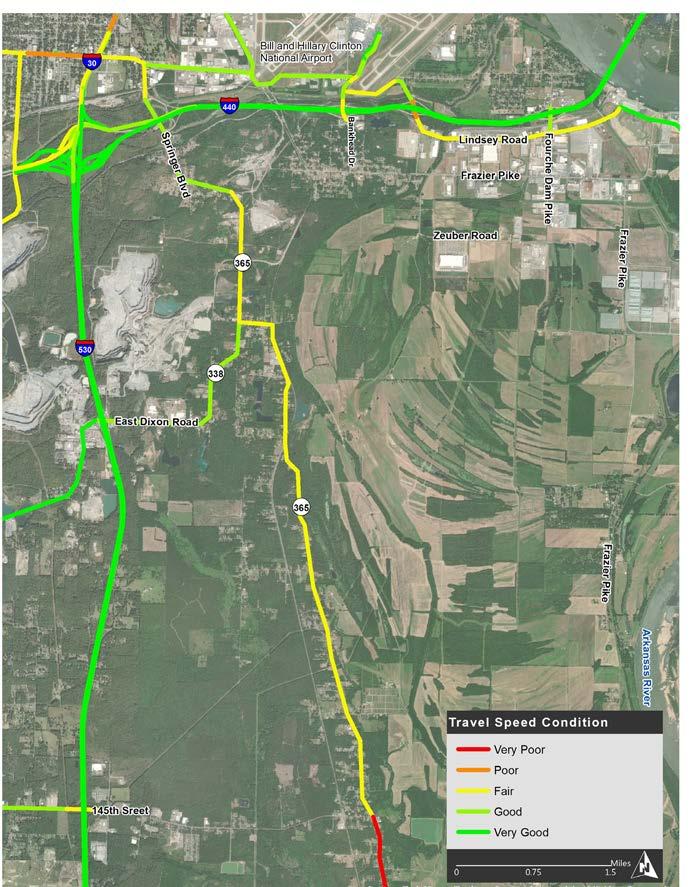
The operating speed is an indicator of the actual traffic operations. The project team analyzed the travel speed data from the National Performance Management Research Data Set (NPMRDS) for 2019, 2021, and 2022. The speed was aggregated for each hour of the weekdays. Figures 2-13 to 2-14 illustrate the average travel speed for the AM peak (7:00 to 8:00 am) and PM peak (4:00 to 6:00 pm) in 2019. The 2021 and 2022 data showed similar travel conditions but less available data for the study area roadways; therefore, they were not included in this Report. In Figures 2-13 through 2-14, the speed performance was classified into five categories based on the actual travel speed (S) to the free flow speed (FFS) ratio: “Very Poor” (S/FFS is less than 0.5), “Poor” (S/FFS is 0.5 to 0.6), “Fair” (S/FFS is 0.6 to 0.8), “Good” (S/FFS is 0.8 to 0.9), and “Very Good” (S/FFS is 0.9 to 1.0).
As shown in Figure 2-12, during the AM peak hour, the interstate and study area roadways overall operate with “Fair” to “Good” conditions, with some roadway segments experiencing “Poor” or “Very Poor” travel conditions. The average travel speed on I-530 is 65 mph to 70 mph. However, the northbound I-530 from Highway 338 to the I-440 interchange has an average speed of 36 mph, which falls within “Poor” travel conditions compared to the free flow speed. The northbound I-530 segment merging into I-30 operates at “Very Poor,” indicating queuing and excessive delays. The average travel speed on I-440 is between 55 and 65 mph, and the speeds are low on the interchange surface streets (20 mph to 35 mph). Highway 365 operates with “Fair” to “Good” conditions with two sections showing “Fair” to “Poor” conditions: the segment from Highway 338 to Springer Boulevard with 25 to 30 mph average speed and the segment south of 145th Street in “Poor” travel conditions. The average speed on Lindsey Road is 20 to 30 mph, operating at “Fair” to “Very Poor” conditions, especially the segment east of Fourche Dam Pike.
The overall travel speed performance from 4:00 to 5:00 pm (Figure 2-13) is similar to the AM peak, but multiple segments experience low travel speed. The average speed on I-530 is between 65 mph and 70 mph. Northbound I-530 from Highway 338 to the I-440 interchange has an average speed of 65 mph.
The average speed on I-440 is 60 mph to 65 mph, except for the westbound segment from Springer Boulevard to the I-530 interchange, running at 50 mph. The travel speed on Highway 365 is lower than the AM peak hour. The segment South of Springer Boulevard operates at “Fair” conditions, especially the
South of 145th Street, which operates with “Very Poor” conditions. Lindsey Road also operates with “Fair” to “Poor” Conditions with 10 to 30 mph average speed and low travel speed on the segments near the I-440 interchange.
From 5:00 to 6:00 pm (Figure 2-14), the average speed on I-530 is
approximately 65 mph, marginally lower than the average speed from 4:00 to 5:00 pm. The average speed on I-440 is 60 to 65 mph. The west segment along I-440 from Springer Boulevard to the I-530 interchange experienced higher speeds than average from 4:00 to 5:00 pm. The travel speed on Highway 365 is overall in “Good” to “Fair” conditions. Lindsey Road segment west of Fourche Dam Pike operates at “Fair” condition. The segment east of Fourche Dam Pike operates with low travel speed, which is likely related to a low number of large vehicles using this segment than an indication of traffic congestion.
The safety analysis relied on the ARDOT crash data to evaluate crash patterns and safety concerns in the study area. The crash data was provided by ARDOT for the years 2017 through 2021. The analysis area encompasses I-440 to the North, I-530 to the West, Arkansas River to the East, and South of 145th Street. To better understand study area crash patterns, the project team analyzed the study area, interstate freeways (I-440 and I-530), and surface streets. This section presents the crash characteristics for interstate freeways and surface streets by time, severity, location, type, and contributing factors.
Over the five-year analysis period, 1,514 crashes occurred within the study area, which resulted in an average of 303 crashes per year. 987 (65%) of the total crashes were on the interstate freeways (I-530 and I-440), and 385 (25%) of the crashes occurred on the surface streets. The rest of the crash data does not include the roadway type information. Figure 2.15 shows the number of crashes by year for both the interstate freeways (“Interstate”) and surface streets in the study area (“Surface Street”).
From the seasonal distribution of the crashes, February to May had fewer than the rest of the year. The number of crashes was relatively high during summer (June to August) and October to January.
Figure 2-16 depicts crash distribution by time of day. On interstate freeways, the highest number of crashes were observed from 5:00 am to 8:00 am, which were
likely the morning peak hours of the study road network. There were also certain distributions of the crashes from 3:00 pm to 6:00 pm and 10:00 am to 12:00 pm. On surface streets, the highest number of crashes was observed from 5:00 am to 12:00 pm, and there was also a certain distribution of crashes from 3:00 pm to 8:00 pm.
In the study area, 72% of the crashes are property damage-only (PDO) crashes. 24% of crashes had minor injuries, 3% had serious injuries, and 1% were fatal crashes. Six out of ten fatal crashes (in five years) were on interstate freeways, three crashes on surface streets, and one unknown. The fatal crashes were mainly single-vehicle crashes and one head-on crash. The first harmful events involved in the fatal crashes were vehicle overturn/rollover, collision with a cable barrier, collision with a culvert, collision with another motor vehicle, railway vehicle (train, engine), and collision with a pedestrian. The fatal crashes occurred at midnight 1:00–2:00 am, morning 5:00–9:00 am, evening 7:00–8:00 pm, and midday 10:00 am–2:00 pm.
For the crash severity compositions, the interstate freeways showed similar
patterns as in the study area: 74% of no apparent injury crashes, 22% of minor injury crashes, 3% of serious injury crashes, and 1% of fatal crashes. Compared to the crash severity of the interstate freeways, the surface streets showed a slightly higher percentage of minor injury crashes (27%). The crash severity for both interstate freeways and surface streets is shown in Figure 2-17.
Of all crashes in the study area, 65% occurred on interstate freeways, 11% on state highways, and 11% on city streets. I-530 had the highest crashes (626) between 2017 and 2021, averaging 125 crashes yearly. Second was I-440, which had 402 crashes in total and, on average, 80 crashes per year. Highways 365 and 338 had an average of 8 to 22 crashes yearly. For the city streets, Fourche Dam Pike, Frazier Pike, Springer Boulevard, 145th Street, Bankhead Drive, Lindsey Road, and 3 M Road also experienced crashes.
Figure 2-18 compares the total crashes with the traffic volumes on each major road in 2021. I-530 had lower ADT than I-440 but more crashes. For the surface streets, Highway 365, Frazier Pike, Springer Boulevard, and Highway 338 have relatively low ADT but higher crashes. Although the crash frequency tends to increase as the traffic volume increases, other critical parameters are worthy of inspections for these roads, such as geometric characteristics (number of lanes,
lane width, shoulder width, grade, sight distance, roadside settings, etc.), traffic control devices (posted speed limit, traffic signal, signing, striping, etc.), and other environmental factors.
Figure 2-19 shows the hot spots where all crashes occurred in the study area. Crash densities were greatest on the I-530 and I-440 freeways. Along I-530, from the South of Highway 338 interchange to the interchange with I-440 and I-30, frequent crashes were experienced between 2017 and 2021, with larger hot spots approaching the interchanges. Another notable hot spot on I-530 is the segment approaching 145th Street. The highest density of crashes on I-440 was observed around the interchanges of Springer Boulevard and Fourche Dam Pike. The I-440 segment from the I-30 interchange to Bankhead Drive and Lindsey Road also had concentrated occurrences of crashes between 2017 and 2021. On the surface streets, crashes were distributed on Highway 365 and 338 and some major streets and their intersections, such as Fourche Dam Pike, Frazier Pike, Bankhead Drive, and Springer Boulevard.
The crashes are categorized into six types: single-vehicle crashes, rear-end crashes, head-on crashes, angle crashes, sideswipe, and other types (i.e., rearto-side, rear-to-rear). As shown in Figure 2-20, on interstate freeways, 41% of the crashes were single vehicle run off the road, followed by rear-end (28%) and sideswipe crashes (24%). The angle, head-on, and other collisions accounted for about 6% of crashes. For surface streets in the study area, single-vehicle crashes accounted for 36% of total crashes, followed by rear-end crashes (23%), angle crashes (20%), sideswipe (12%), and head-on crashes (7%), which are typical crash types of city streets and intersections.
2-20: Crash Type
The primary harmful event within the study area total 54% of crashes and involved collision with other motor vehicle. Collision with roadside objects was the second primary harmful event, such as collision with a roadside barrier, tree, parked vehicle, ditch, traffic signal pole, utility pole/support, culvert, bridge rail, guardrail, mailbox, and other fixed objects. These collisions added up to 36% of the total crashes. Approximately 3% are overturned/rollover crashes, and 3% are animal collisions. Table 2-20 summarizes the primary harmful event. The interstate freeways had similar patterns as the study area but a slightly higher percentage of collision with a fixed object. The surface streets had fewer collisions with a fixed object but more crashes with other motor vehicles and animal collisions, compared to interstate freeways.
Figure 2-21 depicts the light conditions of the crashes. On interstate freeways, about two-thirds (65%) of the crashes occurred in daylight, 2% occurred in dawn and dusk conditions, 3% occurred in dark-lighted conditions, and 29% were under dark un-lighted conditions. For the surface streets, the percentages of crashes that occurred during daylight and dark, un-lighted conditions were slightly lower than the interstate. The crashes occurred during dark-lighted conditions, and dawn or dusk conditions were marginally higher than the interstate conditions.
Crashes relevant to non-motorists, school buses, work zones, railroad crossings, and commercial vehicles were summarized in Table 2-3. The majority of crashes in the study area were motor vehicle crashes. Pedestrians/bikes and other types
Table 2-2: Crash First Harmful Event | Note: “All” crashes include “Interstate,” “surface street in the Study Area,” and the “unknown” road classification.
2-21 Crash with Light Condition
of non-motorists were involved in less than 1% of total crashes on interstate freeways and approximately 2% of the total crashes on surface streets. One school bus was involved in a crash on surface streets. The interstate freeways had more crashes related to work zones than the surface streets. Work zonerelated crashes accounted for approximately 2% of
roads and 1% of total crashes on surface streets. Seven crashes involved railway at-grade crossings in the study area. Commercial vehicle crashes accounted for approximately 10% of total crashes on interstate freeways and 8% of total crashes on surface streets in the study area.
Travel demand forecasting provides important information for determining the feasibility of proposed alignments. This section summarizes the key statistics and performance measures of the travel demand modeling analysis. The purpose is to help understand the proposed South Loop Corridor’s potential transportation impacts/benefits. The travel demand modeling analysis, consists of the following elements:
• Travel Demand Modeling.
• The systemwide impact of the South Loop Corridor on traffic operation.
• A screenline analysis of the traffic distribution in the Port area.
• The performance of key corridors in the study area.
• The forecasted daily traffic, V/C ratio, and LOS for the network links.
The travel demand forecasting work for the South Loop project was performed using Metroplan’s Central Arkansas Regional Transportation Study (CARTS) travel demand model. Metroplan has provided the travel demand model results for the 2015 Base year and the 2030 and 2050 future years with forecasts for the South Loop alternatives. The alternatives tested in the CARTS models are consistent with the proposed alternatives, except that three additional alternatives were included in the modeling analysis. Alternative 6 reflects the South Loop corridor from Woodson Lateral Road to the Fourche Dam Pike. Table 2-4 shows the comparative analysis of the alternatives with the 2050 No Build condition. Model runs show an increase in Vehicle Miles Traveled (VMT) from the 2050 No Build scenario for all alternatives, which suggests the alternatives increase the overall trip length. The model suggests some improvements in travel delays (Vehicle Hours Traveled) and improvement in travel speeds in the alternatives versus the no-build condition, but no alternative outperformed significantly.
Table 2-4: South Loop 2050 Alternatives Comparison - System Performance Measures by Alternative * The changes of VMT, VHT, and delay of the South Loop alternative scenarios compared to the 2050 No-Build scenario.
Table 2-5: 2050 Level of Service Corridor Performance Summary By Alternative
The Volume over Capacity Ratio (VOC) measures roadway capacity. Ratios that are under 0.6 are generally considered free-flowing traffic. As the capacity reduces, the VOC increases. A ratio over 1.0 indicates excessive delay. Regardless of the
Alternative, I-530, and I-440 are expected to experience a higher volume-tocapacity ratio over 0.8. Surface streets are expected to operate with lower VOCs below 0.8, except for the links of Fourche Dam Pike, Lindsey Road, and Frazier Pike east of Fourche Dam Pike. Overall, South Loop alternatives help reduce traffic volumes on adjacent roadways to some extent.
Table 2-5 shows the forecasted Level of Service (LOS) for roadways within the study area based on 2050 travel demand forecasting. Alternatives 2 and 3 improve the LOS to be acceptable at Fourche Dam Pike.
A screenline is an imaginary line generally placed along a major arterial or topographical feature (such as Railroad, creek, and river) to determine the movements of trips between various areas of the model. In this study, two screenlines were defined near the Port of Little Rock area to compare the traffic impacts of South Loop alternatives on the key facilities in the subarea. Screenline 1 is roughly along the Railroad South of I-440 to capture the traffic movements on Bankhead Drive, Lindsey Road, and Fourche Dam Pike. Screenline 2 is defined in the South near Zeuber Road and intersects with the proposed South Loop Corridor, connecting to Lindsey Road or Fourche Dam Pike. Figure 2-22 depicts the two screenlines developed for this study and the daily traffic volumes crossing the screenlines in 2050 based on the model results.
From the figure, Alternatives 3, 4, and 5 (connections to Lindsey Road) are expected to have significantly higher daily traffic volumes on Lindsey Road than the No Build and other alternatives (i.e., above 18,000 vpd vs. 3,800 vpd in 2050). The traffic volume on Bankhead Drive is expected to decrease significantly (i.e., from 12,000 vpd in No-build conditions to approximately 2,000 vpd in alternatives 3, 4, and 5 in 2050). The daily traffic volumes on Fourche Dam would also experience certain decreases, i.e., from 20,000 vpd in No-build conditions to approximately 16,000 in Alternatives 4 and 5 in 2050. Alternative 3 (South Loop connection to Lindsey Road and Fourche Dam Pike) would help reduce the traffic volumes on Bankhead Drive but not on Fourche Dam Pike compared to Alternatives 4 and 5.
As expected, Alternatives 1, 2, 3, and 6 (connections to Fourche Dam Pike) would have increased traffic volumes on Fourche Dam Pike compared to No Build conditions. In 2050, the daily traffic volume is estimated to increase by 2,000 to 9,000 vpd from the No Build condition in these alternatives.
The total traffic volume along screeline 1 indicates that all the alternatives have slightly higher daily traffic volumes than the No Build conditions. Alternatives
3, 4, 5 would add more traffic volumes on Screenline 1 compared to other scenarios. On Screenline 2, Alternatives 4 and 5 have higher traffic volumes than Alternative 3, connecting to Lindsey Road. Alternative 1 is expected to carry higher traffic volumes than Alternatives 2, 3, and 6 connecting to Fourche Dam Pike.
The project team reviewed the 2017 to 2021 historical crash data provided by ARDOT for the study area and the statewide average crash rate from the Arkansas Highway Safety Improvement Program Annual Report 2022. The Report revealed an average of 1.81 fatality rate per 100 million VMT and a 7.10 serious injury rate in the statewide facilities. The crash rates for major roadways in the study area were calculated based on the crash data, ADT, and roadway geometry for each type of crash. The crash rate would be unreasonably high for roadways with low ADT and short corridor lengths, such as Harper Road, Zeuber Road, Bankhead Drive, and Jones Street. The statewide crash rates were applied for these roadways.
The number of crashes for the No Build conditions and alternative scenarios with the South Loop corridor was estimated using average crash rates and the VMTs from the travel demand model. Tables 2-6 and 2-7 summarize the estimated total crash changes for major roadways in the study area in 2050 conditions. Most of the roadways in the study area will see a decrease in the number of crashes due to the build-out of the South Loop corridor. However, the total crashes in the study area are sensitive to the crash rate on the newly built South Loop sections.
The crash estimation in Table 2-6 and 2-7 assumes that the crash rate of the South Loop corridor would be the same as the same type of facilities statewide or in the study area. In this condition, the number of crashes in the study area would be expected to increase due to the increased crashes on the South Loop corridor. The crash changes were also analyzed in an optimal condition that assumes the crash rate of newly built South Loop sections would be the best in the study area (i.e., the same crash rate as I-440). Table 2-6 and 2-7 shows that the total crashes in the study area are expected to decrease in all build alternatives.
All alternatives reduced the overall crash rate on roads within the study area. Constructing a new facility will increase the total number of crashes on the system. Increased traffic volumes due to the new facility will decrease estimated number of crashes per user. While forecasting future crash rates on a new roadway is difficult, the analysis was prepared using comparable crash rates on existing roadways within the study area. This analysis showed that the South Loop decreased the estimated number of crashes per user on roadways within the study area. The forecasted crash rate for the five South Loop alternative routes increased. It is important to note that most of the existing roadways in the study area are substandard in width and design, with accompanying access management issues
2050
2050 Annual Change in Number of Crashes and VMT – Optimal Case
and a lack of pedestrian and bicycle facilities, which could be over-inflating the comparable crash rates. A newly built facility that follows current design guidelines decreases driveway spacing and separates freight, vehicular, and active transportation traffic, which would likely increase safety and reduce the crash rate for the South Loop facility. Still, it is not forecastable at this time.
The roadway network is disjointed and incomplete within the study boundaries, with narrow roadways that struggle to accommodate a large freight volume and limited bicycle and pedestrian facilities. While the proximity to the interstate highway system and rail network is highly desirable for industrial port development, the at-grade rail crossings directly adjacent to the off-ramps will continue to provide traffic challenges. Providing access to, through, and around the communities of College Station, Sweet Home, Wrightsville, and Higgins is a topic for further discussion to ensure that the right amount of access is provided to incentivize economic development without burdening residential uses.
The at-grade railroad crossing at Fourche Dam Pike is significant to port and traffic operations because it is the main entrance and exit to US-440, serving employees and freight vehicles. On a typical week, it is reported that Little Rock Port Authority (LPRA) trains block Fourche Dam Pike four times per workday for approximately five minutes. Union Pacific rail traffic can block Fourche Dam Pike for 8-30 minutes, depending on the activity. The proximity to the interstate/ramping and a switching yard complicate vehicle movements and often create backups on the freeway, creating major safety concerns and aggravating vehicle delay on the freeway and within the Port. As development increases in the Port, vehicular and Railroad traffic is expected to increase, exacerbating the delay situation. Constructing a gradeseparated crossing of the Railroad at either Lindsey or Fourche Dam Pike as part of any of the alternatives would create network redundancy and increase the capacity in the Port. Extending Bankhead Drive to Lindsey or Prat Remmel would be another important point of entry and direct connection to the airport to alleviate congestion.
Considerations must be made to serve the area’s residents better as roadways within the study area develop and future employees require alternative transportation options throughout the community. Just as some roadway facilities will need more lanes, some are better suited for different active transportation facilities. Active transportation facilities can take many forms, but the three most appropriate facilities for the trucking-heavy study area are sidewalks, protected bicycle lanes, and side paths. Generally, standard bicycle lanes should not be implemented on roads with daily ADT counts exceeding 3,000 vehicles.
Separation is always the best option for pedestrian and bicyclist safety. Bicycle lanes are acceptable in areas where separation from the roadway is not an option. Sidepaths and sidewalks are usually built inside the road right of way and depend on the amount of right of way available. Sidepaths allow safe passage by bicyclists and pedestrians in both directions and may be built on just one side of the road, whereas sidewalks require placement on both sides.
As traffic volumes on new and improved roads increase, it is necessary to evaluate roadway capacity and the need for additional directional lanes. Roadways with one travel lane in each direction are generally able to accommodate up to 15,000 vehicle trips per day with appropriate intersection density and controls. Above 15,000 vehicle trips per day an additional lane in each direction may be necessary depending on land use, access management, and the presence of a median or continuous left turn lane.
When an existing roadway can accommodate appropriate travel lanes (up to 14’), the remaining surface width may be restriped to allow a 3’ buffer and up to 6’ bicycle lanes. This buffer will provide greater safety and security for bicyclists riding in both directions. At the minimum, a wide shoulder can accommodate a more experienced rider.
When a bridge is constructed over water, a rail line, or another roadway. A 14’ sidepath bridge should be constructed alongside the roadway, separated by

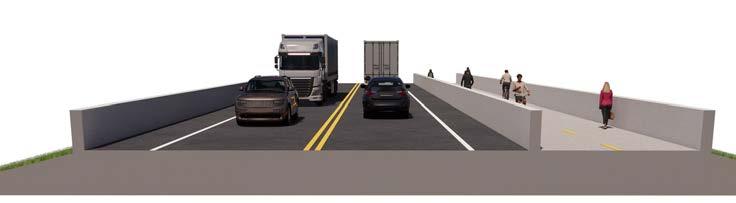
a vertical concrete barrier. Bridges have historically omitted bicyclists and pedestrians from their designs, and this inclusion will allow users the option to safely cross the same barrier as they would in their car.
As traffic counts increase, demand for a center turn lane also increases to avoid delays due to a single car making a left-hand turn. In these instances, implementing a sidepath or sidewalk provides separation from traffic and comfort for all user levels while traveling along these major collectors. The recommended buffer width is at least 4’, a space to which trees, grass, and shrubs may be added. Some physical constraints may better facilitate a sidepath, whereas others may better suit sidewalks on both sides.
Connectivity to other active transportation facilities should be considered to ensure no interruption in the comfort level of people walking or biking in the area.
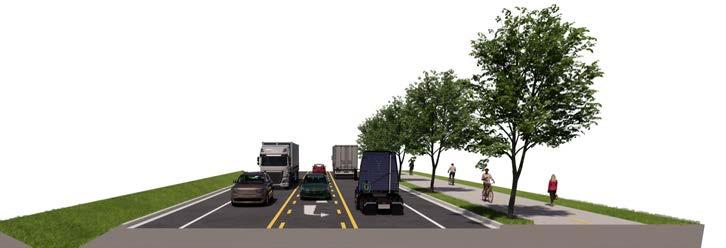
The northern portion of the study area is served by METRO Connect Microtransit on-demand service. It connects to the major employers and the River City Transit Hub, the main connection point for the bus network. The on-demand service is an appropriate transit level for the current density in the area. Where
appropriate, integrating transit amenities at major employers, such as shelters and benches, could be included to provide more convenient opportunities for workers to use transit. Construction of the South Loop may make an extension of METRO Connect Microtransit to cover more of the study area, including Wrightsville, more feasible.
Project cost is a major consideration for determining overall feasibility, potential funding sources, and overall benefits that can be used to evaluate and compare the alternatives. To begin a rough alignment was created within the alternative corridors to determine roadway areas. It was assumed that newly built roads would consist of one travel lane in each direction and existing roads would be widened to an appropriate width to accommodate one travel lane in each direction. Construction of newly built and widening of existing roadways were assumed to include either buffered bike lanes or a separated side path. Unit prices from the most recent roadway projects within the study area were used to create accurate unit prices. A cost per square foot was developed for pavement. New subgrade preparation and existing subgrade preparation as well as cost per foot for striping, signage, and erosion control measures. For items not used in recent projects, the ARDOT Estimated Cost per Mile report and Weighted Average tables were used to estimate component costs.
Every route will have a grade separated rail crossing and multiple routes require new or rebuilt interstate interchanges which accounts for a large percentage of the overall construction cost. To determine this amount a preliminary layout was developed for each interchange or railroad bridge. This layout was then used to develop a planning level estimate.
Road construction costs, railway, and interchange estimates were then combined to provide a subtotal construction cost. This subtotal was used to determine rightof-way and property acquisition costs. Based on similar studies and the property values of the study area a ROW cost was estimated as 4% of the subtotal cost.
Due to the location of the project area, environmental impacts could be a major factor when considering constructability of a given route. For that reason, potential mitigation costs need to be considered as part of the total cost. To do this a buffer zone was created for each route and then evaluated to determine the acreage of potential wetland areas and linear feet of stream that could be impacted by roadway construction. These values were used to determine the required mitigation credits using the USACE mitigation credit calculation method. Regional mitigation credit prices were then applied to provide a comparative assumption used in cost estimates.
Subtotal cost, right-of-way acquisition, and environmental mitigation costs were combined to give the total construction cost. A 10% contingency and 15% engineering and permitting fees were then added, which gives the total estimate to be used for further analysis.
A benefit-cost analysis (BCA) is a method to quantify the performance of projects by calculating the benefits to users to see if they outweigh the construction costs. A BCA was completed for the five alternatives. The Federal Highway Administration (FHWA) methodology quantifies the cost of project alternatives and direct and indirect safety-related benefits. Direct safety benefits include the expected change in crash frequency and severity. Indirect benefits include reduced crashes, operational, and environmental benefits (e.g., reduced delay, fuel use, and emissions). A score of 1 or above shows the project benefits outweigh the direct and indirect costs. The analysis used approved Federal Highway Administration methodology to analyze regionally available travel forecasts, crash data, and transportation costs.
The regional demand modes uses macro methodologies that cannot quantify the delays caused by the rail cars blocking Fourche Dam Road. The travel time and distance of all the South Loop alternatives far outweigh the time savings associated with eliminating delays at the railroad crossings. As a result, none of the alternatives scored a BC above 1.0 using this regional demand model data.
However, this does not mean the project, in part or as a whole, is not warranted. As shown by the screen line analysis, there is a demonstrated traffic need for improvements in the study area. A more localized traffic and safety analysis at the key locations of Lindsey Road and Fourche Dam Pike can be strategically used to justify grade separations and other transportation improvements.
Crash savings are realized on existing roadways within the study area, but the added costs of crashes on the South Loop outweigh the estimated savings.
Assumptions
VHT: Vehicle Hours of Travel $30 per hour
VMT: Vehicle Miles of Travel $0.60 per mile
Delay Time: $30 per hour
Annual Factor: 130 weekdays