• Housing and Housing Affordability —an Introduction
• Population Estimates
• Population Change
• Housing Cost: Metropolitan Comparisons
• A Look at Metro Inequality Rankings
• Covid-19 and a Housing Challenge in the New Decade
• Demographic Outlook 2020
• Statistical Supplement
FORECLOSURE
August 2020 Housing
About Metroplan
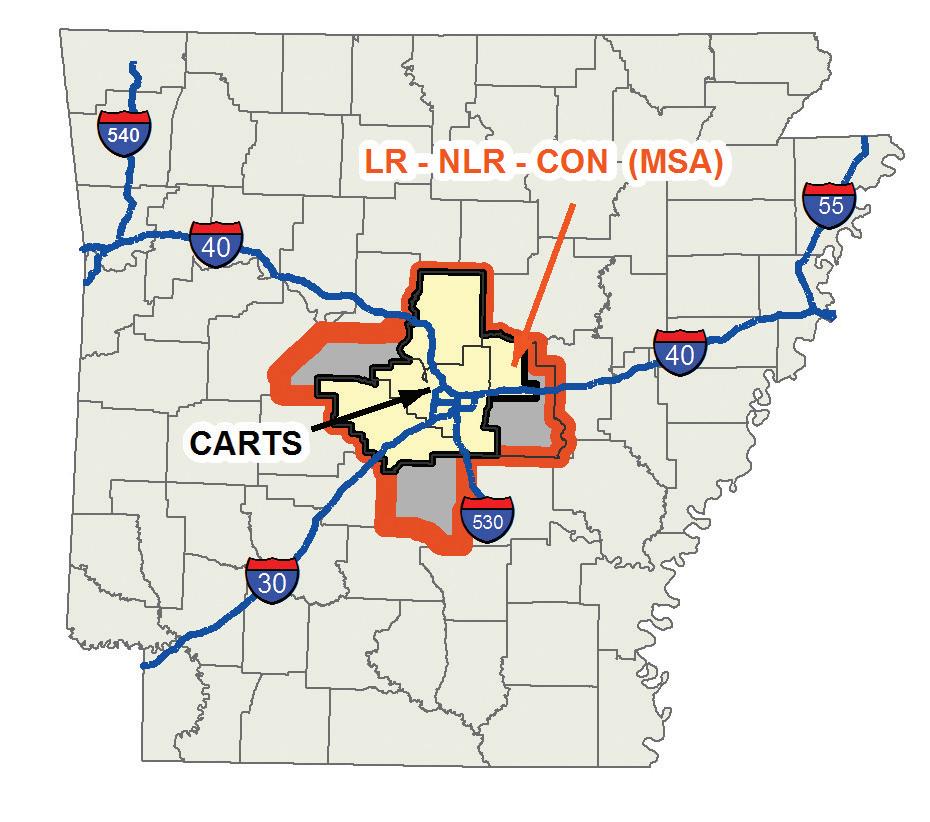
Metroplan is a voluntary association of local governments that has operated by interlocal agreement since 1955. Originally formed as the Metropolitan Area Planning Commission of Pulaski County, Metroplan now has members in five counties of the six-county metro area (see below). Metroplan is the designated metropolitan planning organization (MPO) under Title 23 of the United States Code.
Metroplan serves as the regional voice on issues affecting Central Arkansas, develops transportation plans required by federal law, convenes stakeholders to deal with common environmental issues, and provides information and staff resources to our member local governments, the business community and the public. As part of that mission, Metroplan publishes Metrotrends twice yearly. The spring/summer edition is the Demographic Review and Outlook; the fall/winter edition is the Economic Review and Outlook
About CARTS
The Central Arkansas Regional Transportation Study, or CARTS, is the cooperative effort by the participating communities, transportation providers and many other interested parties to develop a long-range transportation plan for the metropolitan area.
Housing and Housing Affordability—an Introduction
The 2016 edition of this Metrotrends publication looked at housing trends in Central Arkansas. At that time, the construction of several large apartment complexes in the region—and especially Little Rock—was sparking controversy. Renting and multi-family housing were rising as a share of total housing both nationally and locally.
Homeowner_2005-2018
US and LR-NLR HomeOwnership Trend
Owner-Occupied Homes (share of total housing) 2005-2018
again. While the economic future has been thrown into uncertainty, housing remains a vital part of the economic picture and therefore worthy of study. This edition of the Metrotrends Demographic Review and Outlook will take a look at housing, not just with local data but with figures that compare housing with the U.S. average.
Four years on, the region’s housing profile continues changing. The rise in renting has slowed, and in 2018 the share of owners began growing again. Renting and multi-family remained, however, more important in the regional housing picture during the 2010 decade than they had been previously.
The Great Recession marked a big change in housing, locally and nationally. Today, just as it looked like rising prosperity was boosting a renewed trend toward home ownership, the Covid-19 crisis has jolted the economy
Compiled by Metroplan 4/8/2020
Owner-Occupied Homes
Owner-Occupied Homes (share of total housing) 2005–2018
Sources: U.S. Bureau of the Census, Quarterly Housing Inventory. American Community Survey (ACS) one-year data, 2007–2018.
National Housing Cycles
The chart below graphically depicts a trend closely linked with U.S. economic history. In the year 2000, the U.S. was building around 100,000 units a month, climbing steadily to a peak of 171,000 units in January 2006. In hindsight the trend was driven by speculation. Homes were a rapidly appreciating asset until, suddenly, they weren’t. The housing surge could not be sustained by population or economic growth.
The subsequent crash in U.S. single-family housing starts coincided with the Great Recession. Construction bottomed out around 40,000 units monthly in 2009 and grew only slowly. In the words of one expert, conventional suburban single-family housing had been “exotically overbuilt.”1 In February 2020 the figure briefly crossed 100,000, just before the Covid-19 crisis hit.
Multi-family housing took up some of the slack from 2011 onward, accounting for a larger share of slowed
overall U.S. housing construction. Similar trends occurred in the Little Rock region. Housing costs were beginning to hit crisis levels in the country’s largest coastal cities, when the Covid-19 crisis launched what is likely to become an entirely new housing cycle.
1. U.S. Bureau of the Census, Quarterly Housing Inventory. 2. American Community Survey one-year data, 2007-2018.
Population Estimates 2020
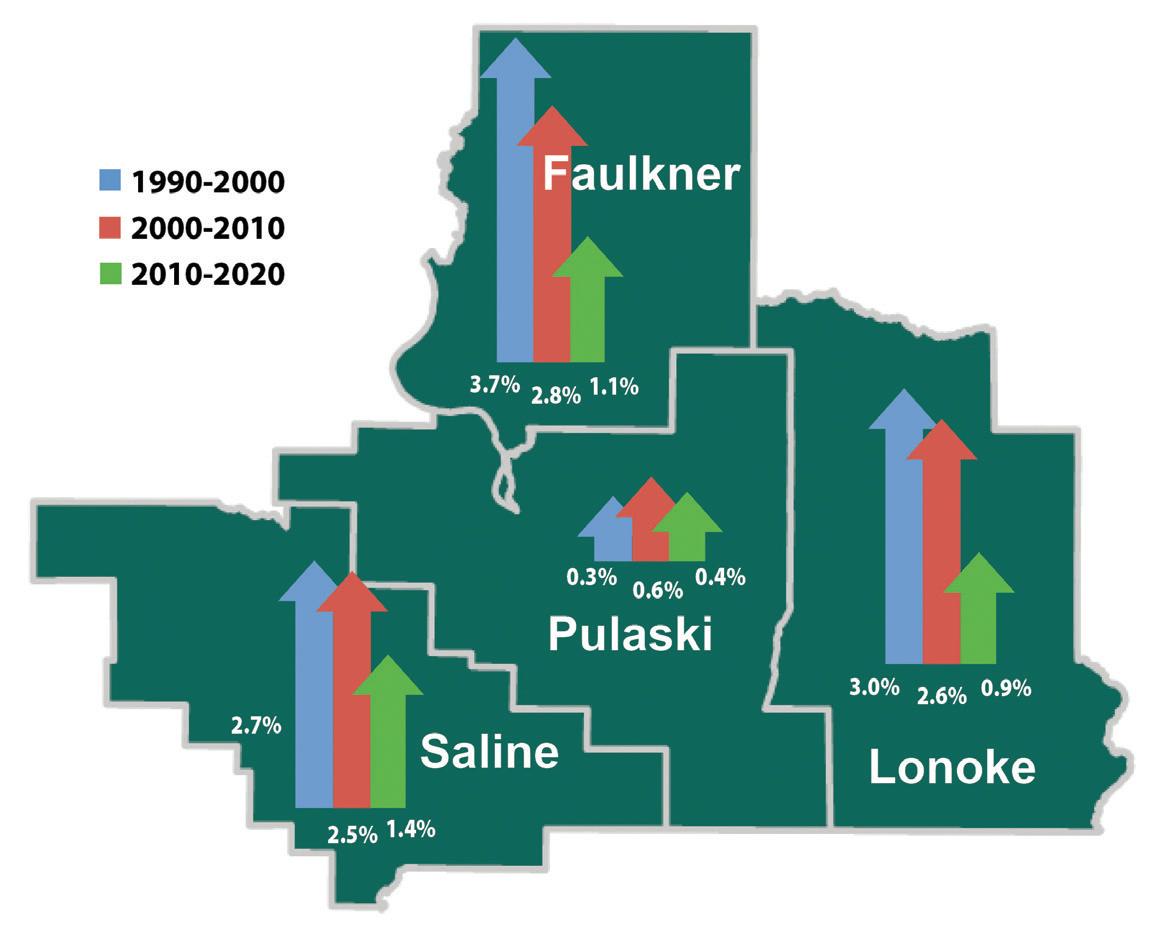
This year’s population estimates represent Metroplan’s best guess at the figures we’ll see around March 2021 when the Census Bureau releases Census 2020.1 Highlights: the Little Rock MSA has a total population around 750,000—three quarters of a million. It continues growing population, but that growth slowed sharply during the 2010–2020 decade. The annual rate of growth has slowed from about 1.4 percent 2000–2010 to 0.7 percent in the more recent decade. Conway has (probably) passed North Little Rock as the region’s second-largest city, and this will change the MSA’s official title when the Office of Management and Budget (OMB) reviews the status of metropolitan areas in 2023. The region’s fastestgrowing portion is now Saline County, which outgrew all
others in the 2010–2020 decade although Faulkner County still has a slightly larger population total.
As the chart at right shows, all the region’s counties—even Saline—grew more slowly in the more recent decade. The biggest question concerns the growth rate of Pulaski County, which appears to have grown slightly faster 2010–2020 than it did in the 1990–2000 interval, but slower than the 2000–2010 decade. In the big picture, the most dramatic story is the slowdown evident in Faulkner and Lonoke Counties, both of which saw their annual rate of growth decline by more than half from the previous decade.
Census in a Pandemic
The official “census day” for the 2020 Decennial Census was April 1, 2020—during the tightest spell Covid-19 lockdown. Of course, many households responded online, or via mail. As of July 1, 2020 the Census Bureau estimates it had a 61.8 percent overall response. Normally the Bureau would have begun its “non-response follow-up” immediately, but Covid-19 delayed things. Census Bureau staff began interviews in July instead, following local safety
protocols like maskwearing, social distancing, and conducting interviews outdoors when possible. The deadline for follow-up visits has been extended to October 31, 2020. You can still submit a response online up to that date. Visit https://2020census.gov/.
1 There is a slight difference however, because Metroplan’s estimates represent January 1, 2020 whereas the Census figures are officially taken for April 1, 2020.
*Represents portion of Alexander by county **Official MSA since May 2003
*Represents portion of Alexander by county. **Official MSA since May, 2003.
Housing Cost: Metropolitan Comparisons
Housing cost is an important measure for economic developers when they compare metro areas. While high housing costs are often a marker for productive areas with high incomes, they can be a drag on economic growth. All other things being equal, competitive housing costs are a big advantage.
with a mortgage pay more than 30 percent of income on their homes. This is quite a bit better than the national average, where an additional five percent—27.7 percent of owners— pay over 30 percent. It is well below very expensive metros like San Jose and New York, where owners pay 33.4 percent and 37.9 percent, respectively, of their incomes. Although household income in Central Arkansas is lower than in the nation’s priciest metro areas, the break in housing costs means local owners are less financially stressed.
Housing Cost
When you look at basic housing cost in dollars, the Little Rock region stacks up well. As the chart shows, median cost for owners with a mortgage is $1,185 monthly, 24 percent lower than the national average. The area is also a comparative bargain for renters. Median renter cost is $821, or about 23 percent below the U.S. average. Even in the relatively affordable Atlanta region, owner cost is $1,520, or 22 percent higher, and renter cost is $1,169, or 29 percent higher. Residents of San Jose California pay almost three times as much to own or rent a home.
Housing Affordability
Affordability measures ability to pay, the ratio between average income and average housing cost. Here the Little Rock region’s advantage narrows because local incomes run a bit lower than the U.S. average. For owners, the region remains affordable. As the chart shows, only about 22.1 percent of local owners
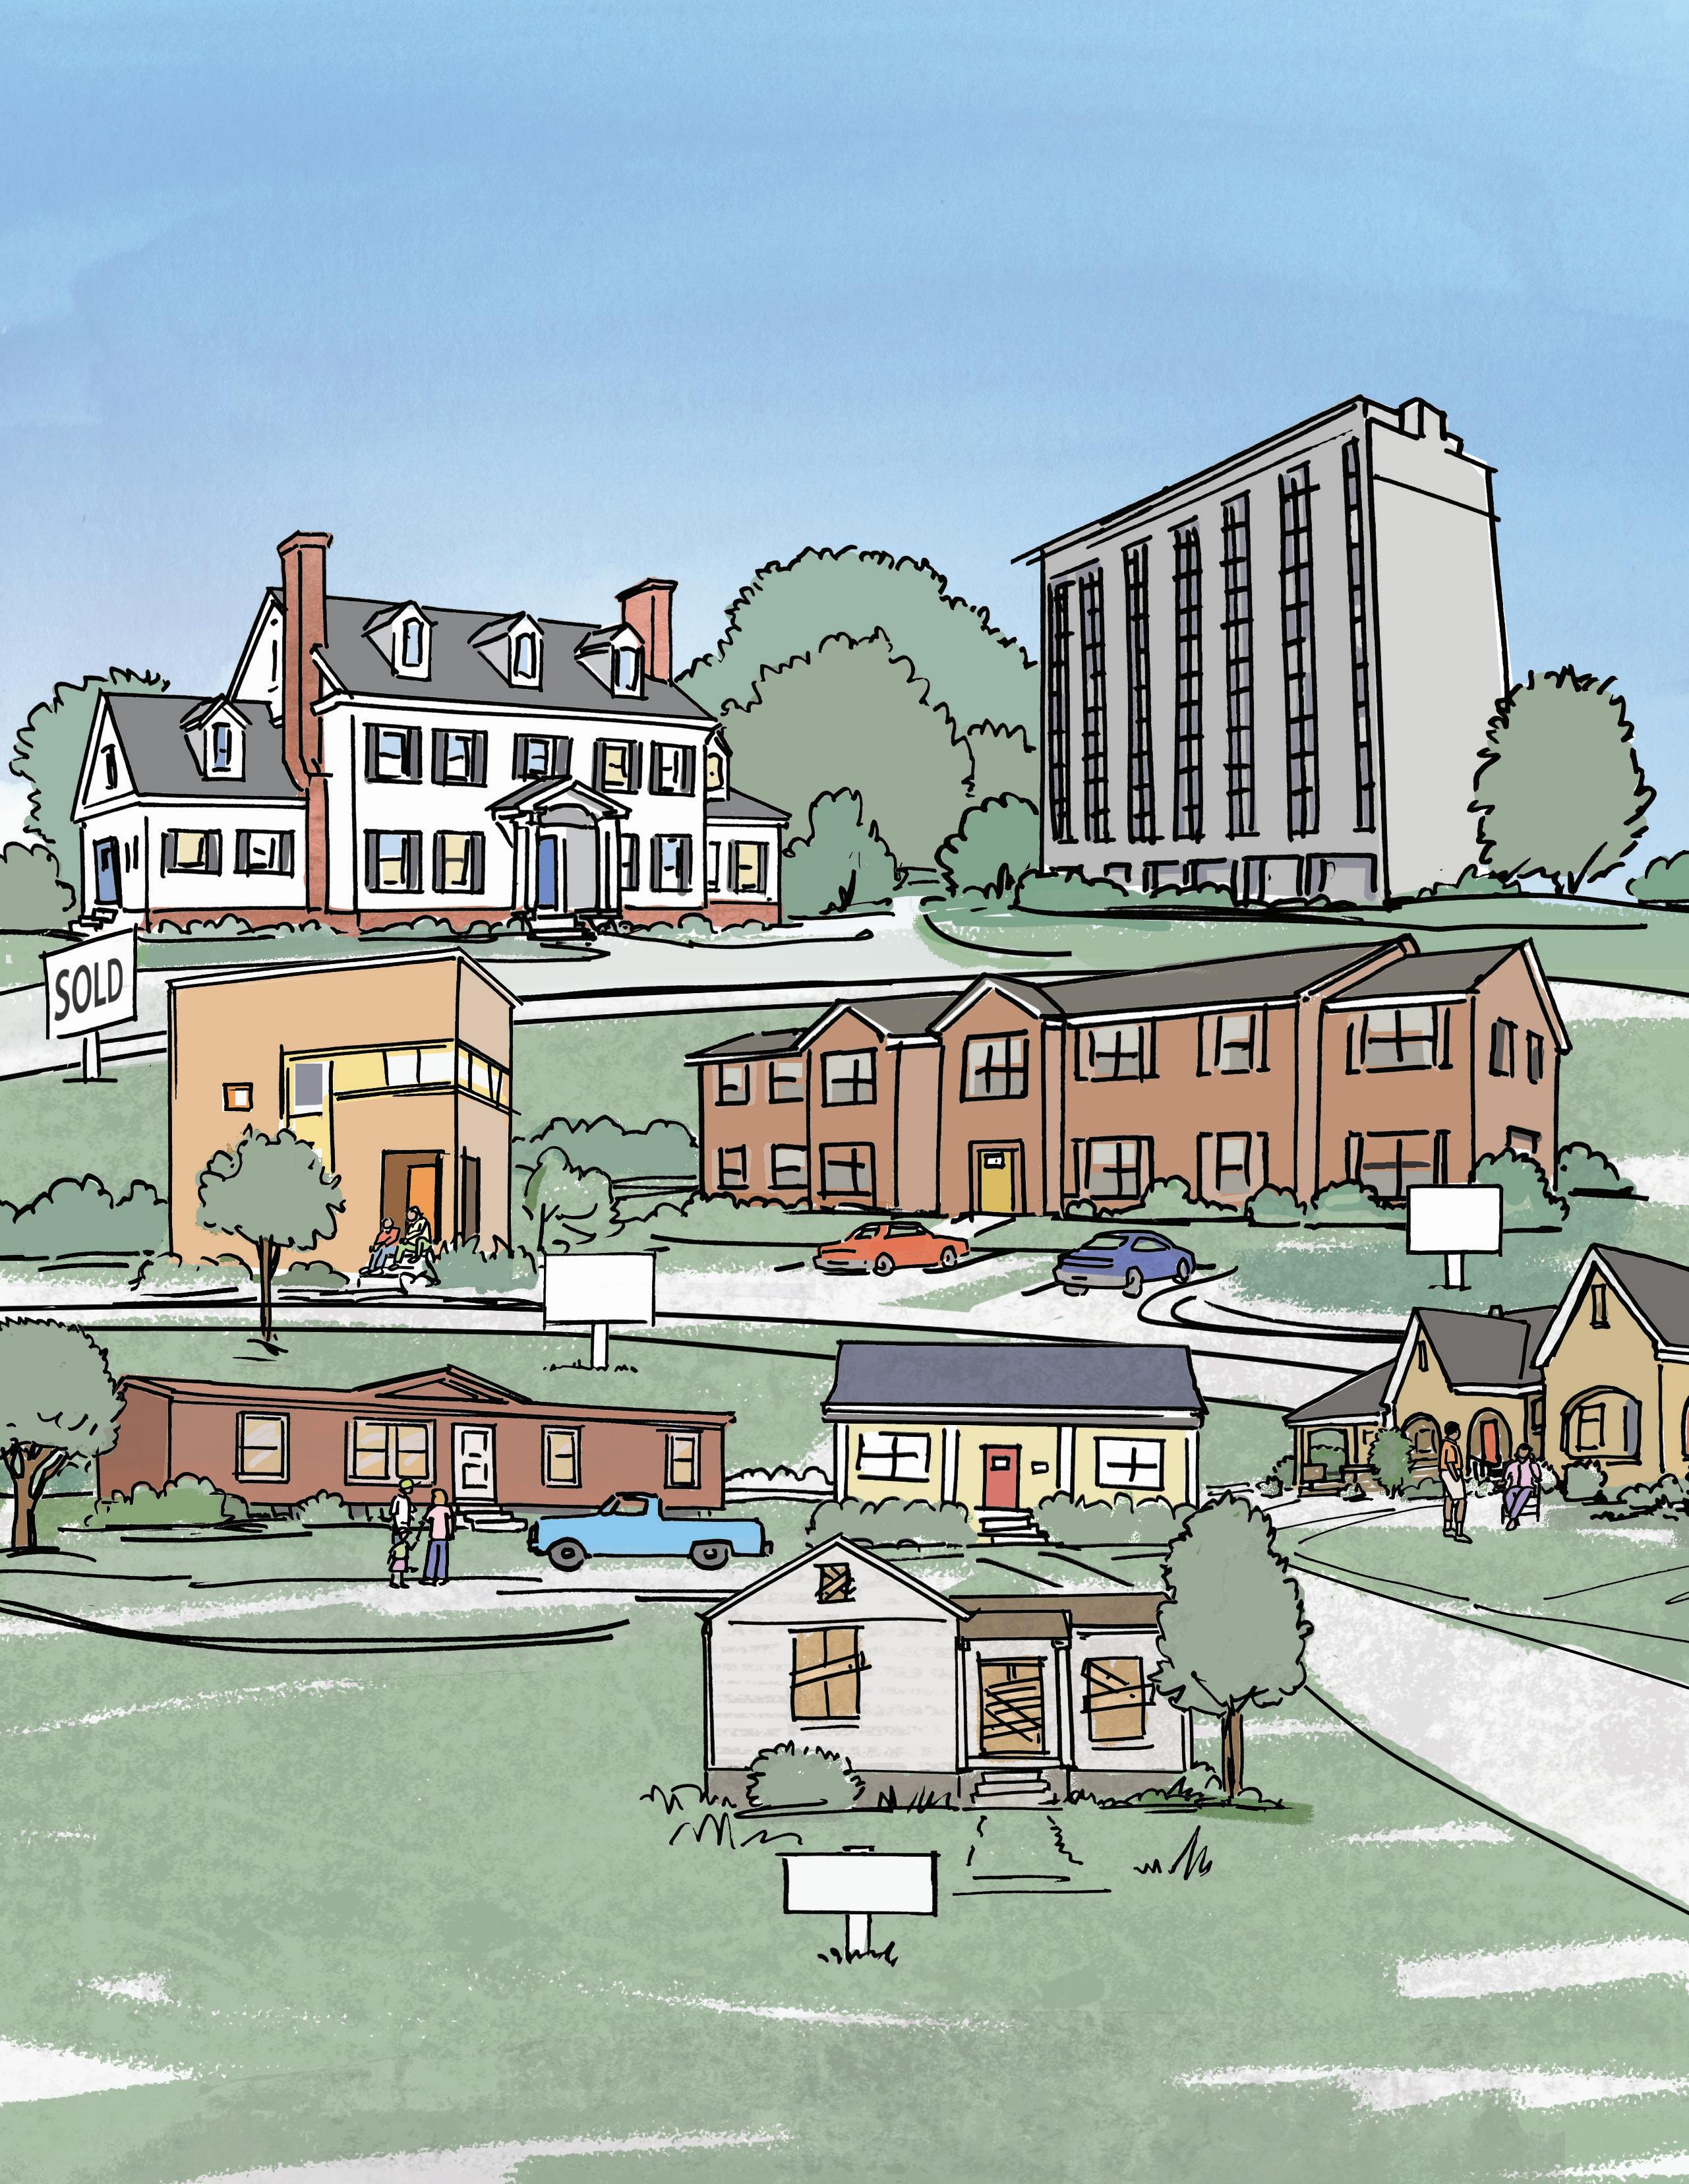
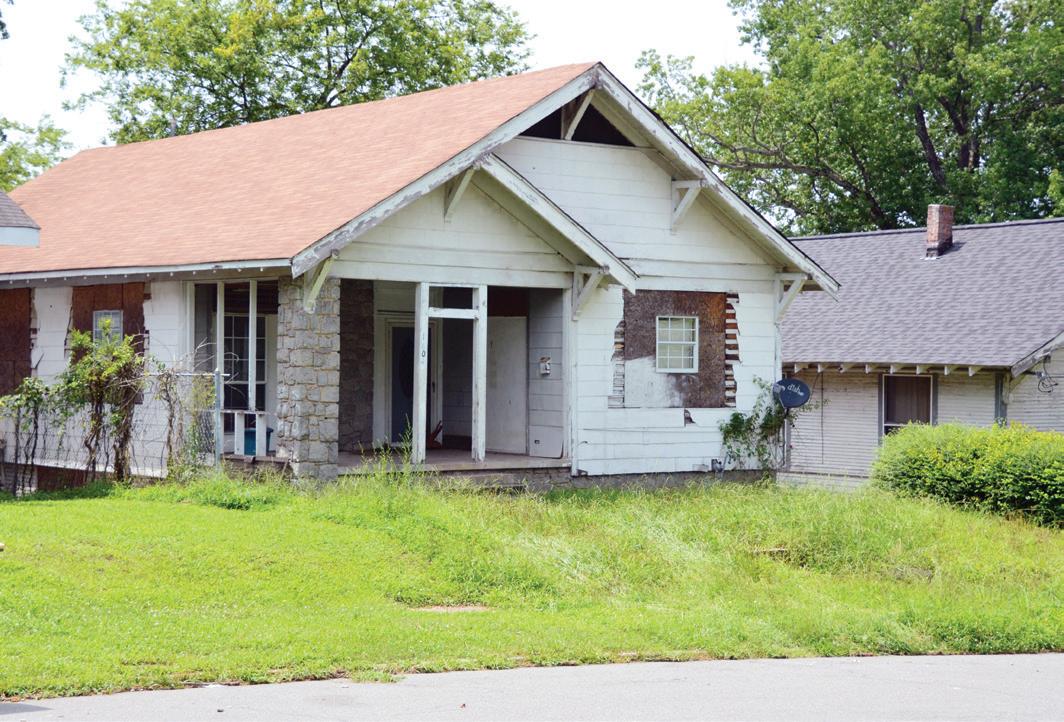
The dream: nice
For renters, the equation is different. As the chart at bottom left shows, despite low rates many local renters are stretched. Fully half of Little Rock regional renters—50.2 percent—pay over 30 percent of their incomes on housing. That is slightly higher than the national average, despite low local rents. Residents in Northwest Arkansas and even pricey San Jose are less cash-strapped as a share of their incomes.
The Little Rock area’s rental affordability problem has a lot to do with higher-than-average levels of poverty. For example, in the Little Rock region almost half of renting households
Owners
Renters Paying 30%+ on Housing 2018
have incomes below $35,000. By comparison, only about 39 percent of U.S. renters are in this income category. Among the comparative metro areas, only the Memphis MSA had a higher share of renters with incomes under $35,000 than the Little Rock region.
In summary, when you measure by housing costs, the Little Rock MSA is competitive on a national basis. Owners do quite well and generally pay a smaller share of their incomes on housing than the national average. Renters pay less too, but a large share of local renters are financially stretched.
Share of Rental Units w/Household Income Below $35k
The reality for many: depreciating home, neighborhood with concentrated poverty. Nearly half of renting households in the region have incomes below $35,000.
A Look at Metro Inequality Rankings
In late May and early June 2020, large-scale protests arose locally and nationally about policing and racial inequalities. The controversy erupted most forcefully in the Minneapolis region. Studies show the Minneapolis area has deep disparity between whites and African Americans in vital metrics like median household income and homeownership. How does the Little Rock region stack up? We decided to develop rankings for the 100 largest metro areas in the U.S.1
The table below reviews homeownership statistics for nine selected U.S. metro areas. The metros are listed in alphabetical order, with rankings at right. As you can see, the Little Rock region ranks 45th among the largest 100 metros for its share of homeowners among households—65.1 percent in 2018. Minneapolis does better, ranking 8th with 70 percent. Los Angeles does poorly, ranking 100th with only 48.2 percent of its households owning homes, probably affected by high housing costs.
The next table ranks black homeownership. The Little Rock region ranks 30th, with 43.7 percent of black/ African American households owning their homes. Several metros in the table do better than Little Rock. For example, Jackson, Mississippi does the best in the list, ranking 5th in the country with 54.1 percent homeownership among black households. Baton Rouge, Atlanta and Memphis also have higher
Home Ownership
homeownership levels for African Americans. But several others do less well, including Austin, Tulsa, Los Angeles, and especially Minneapolis which ranks 95th for African Americans, with just 24.7 percent homeownership.2
Home ownership is a useful metric of economic well-being, but income matters too. The table below right analyzes African American median household income as a share of white household income.3 The results are like the home-owning rankings, but not the same. Atlanta does best in the list, with black household income at 65 percent that of whites, ranking 24th in the nation. Minneapolis again does poorly, 99th with 44.7 percent. Little Rock again ranks near the middle, 49th among the top 100 U.S. metros for black household income as a share of white. Little Rock outperforms nearby metro areas like Memphis and Baton Rouge, but with household incomes running at just 60 percent that of whites, inequality remains pronounced.
1 At present the Little Rock-North Little Rock-Conway MSA ranks 76th in the country for population size.
2 Tables for white homeownership can be found in this document’s Statistical Supplement, on page 12.
3 All tables in this set refer to non-Hispanic whites.
Covid-19 and a Housing Challenge in the New Decade
Prior to the Covid-19 pandemic, a strong economy was pushing housing costs upward, especially on the coasts. In the Little Rock region the surge was less pronounced. Homeowners in Central Arkansas generally get a lot of house for their money. This advantage partly compensates for the region’s somewhat lower-than-average household incomes. For renters, local costs are also moderate, but low-income renters face difficult prospects, and must often spend a disproportionate share of their incomes on housing.
The month of March 2020 suddenly faced the country, and the region, with an unprecedented public health and economic crisis. Regional housing construction activity which was already “in the pipeline” has continued. In the months of April and May, single-family activity continued at nearly its previous pace. National trends suggest, however, that single-family housing markets are slowing. Fretting about their economic futures, often working at home, fewer people are out shopping for new homes. The pace of new single-family construction in Central Arkansas has slowed. Home values are, however, still appreciating in spite of recession conditions.1
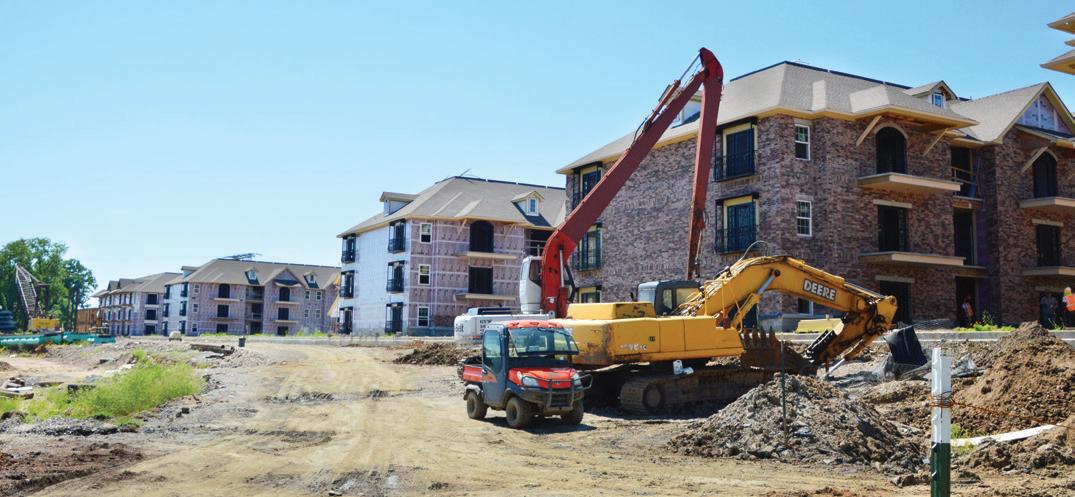
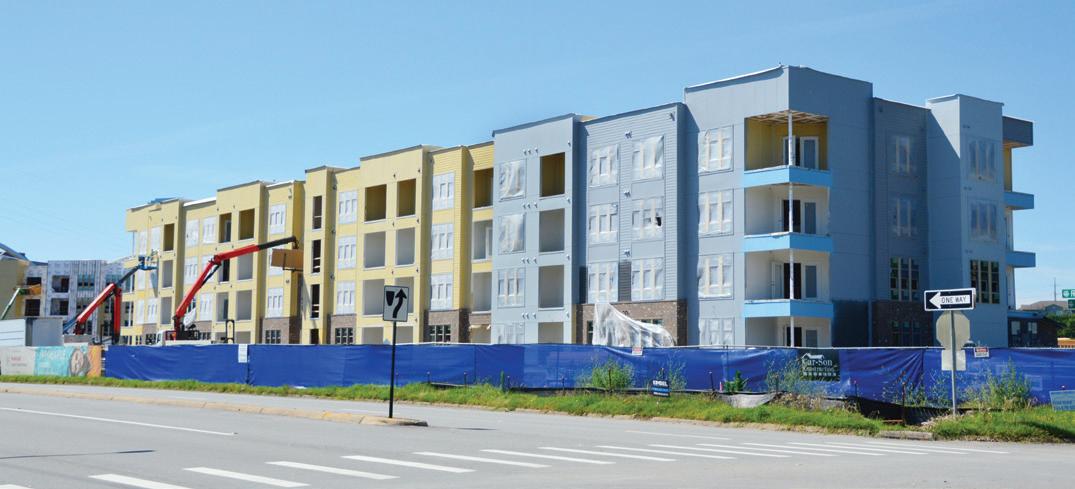
Multi-family markets face major uncertainties. Projects like the Pointe at North Hills, the Vue in downtown North Little Rock, Harbortown east of downtown Little Rock, and about three major projects in western Little Rock are adding hundreds of new units to the market. However, we are not aware of any further major projects coming along. New multifamily development is driven by finance markets, which in turn look at job growth, market absorption and rental growth to test the waters before opening the coffers for new projects. There is just too much uncertainty at present to justify major new multi-family housing investments.
The local region’s low-income renters remain strained. While in theory this might imply market demand for low-cost units, the challenges posed by finance markets and the cost of
construction materials make low-cost housing construction non-viable as a market-based investment. If there is an opportunity to provide affordable housing, it lies in securing well-located land at discount costs that might be reserved for affordable housing construction or conversion of existing units. It is possible the pandemic’s economic shake-out may open up commercial and office properties that have previously been too expensive for residential projects. A competitive region requires a housing base that accommodates its aspiring residents, many of whom are challenged by low and moderate incomes. Despite economic pain and uncertainty, there may be opportunities in an economic landscape that has transformed itself underfoot, but only if public and private leadership grasp the relevance of affordable housing as a key factor in regional economic competitiveness.
In the meantime, low-income households will face a challenge of uncertain duration. Household sizes will probably rise as people double-up in existing housing units. This will repeat a pattern from the previous decade’s Great Recession. The economic impacts of today’s pandemic are hitting minority and low-income populations the hardest, and housing is a core issue.
1“Property in America: The House Wins,” Economist July 4, 2020.
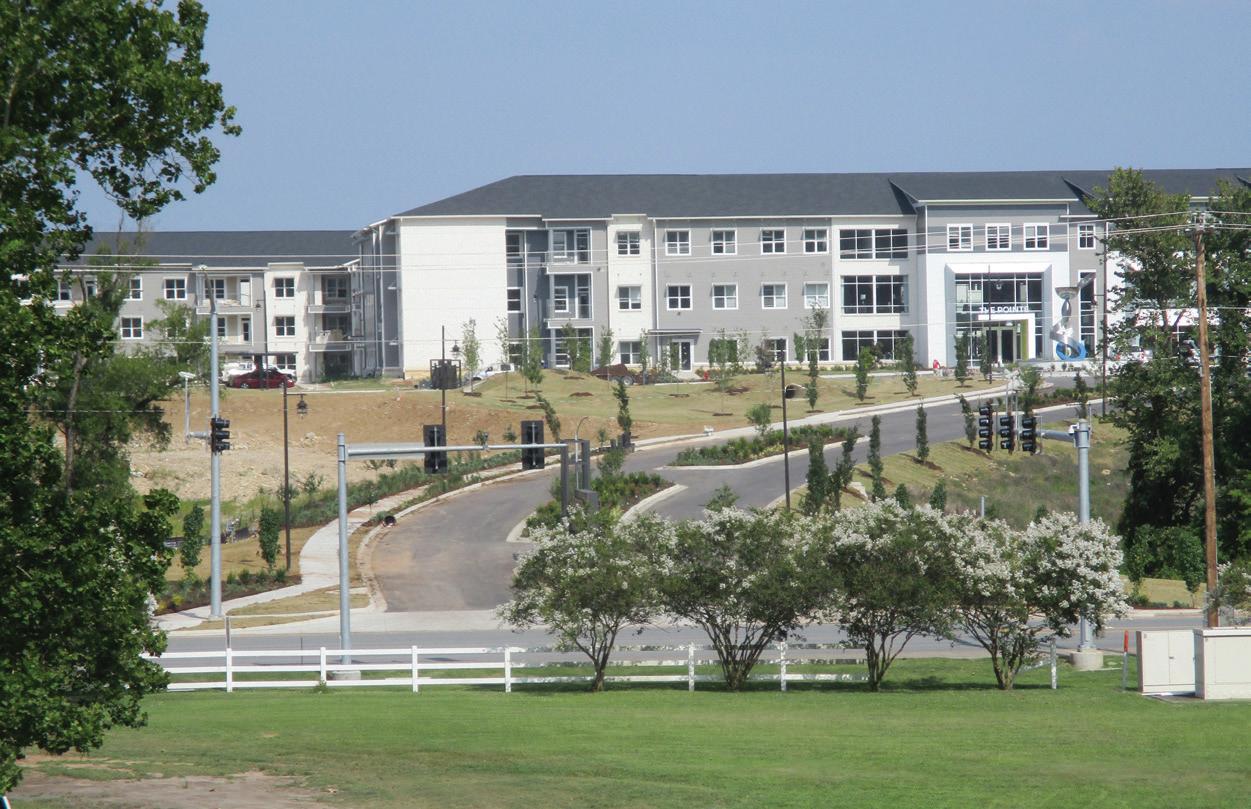
The Pointe North Hills required a lot of site work, and it took a while to start leasing up. It will eventually add about 900 units near the Lakewood neighborhood in North Little Rock.
Building Permits
The year 2019 was a good one for Central Arkansas housing construction. The total number of new units was just over 3,000, the highest recorded since 2010. Both single-family and multi-family markets showed strength. With 1,458 units permitted, single-family construction was at its highest since 2012 (1,501 units). The largest proportional increase was in Jacksonville, with 60 new units started, an increase of 28 compared with 2018 (+ 88 percent) Conway saw the second-greatest uptick, with 268 new units (up 43 percent from 2018). North Little Rock was up 31 percent, with 111 units, and Little Rock saw 393 new starts, up 27 percent from 2018 levels. Other cities saw some drop-off from 2018, but in most cases the number of new units permitted remained comparable to recent years. The one exception was Benton, down 22 percent from 2018 and lower than any year since 1990.
Little Rock saw permits taken for three large projects: the Fitzroy Promenade, at 701 Rahling Road with 331 units, 180 new units at the Bowman Pointe on South Bowman Road, and 176 units at the Residences at Harbortown, located east of the Clinton Presidential Library near downtown Little Rock. The largest new project in North Little Rock is the Vue, adding 244 units on the river front just west of the Broadway Bridge. Another mixed use multi-family project at the Esplanade a short distance upriver will add 92 units. There will be 86 additional units at the large multi-family community being constructed on North Hills Boulevard just north of I-40. Conway permitted a new complex titled 12 Hundred Place near Dave Ward Drive just west of Harkrider Road with 160 units, plus many duplex units. The single-family index chart at right shows quarterly single-family housing construction stats through mid-2020.
Multi-family markets were dominated, as usual, by the region’s three largest cities, Little Rock, North Little Rock and Conway.
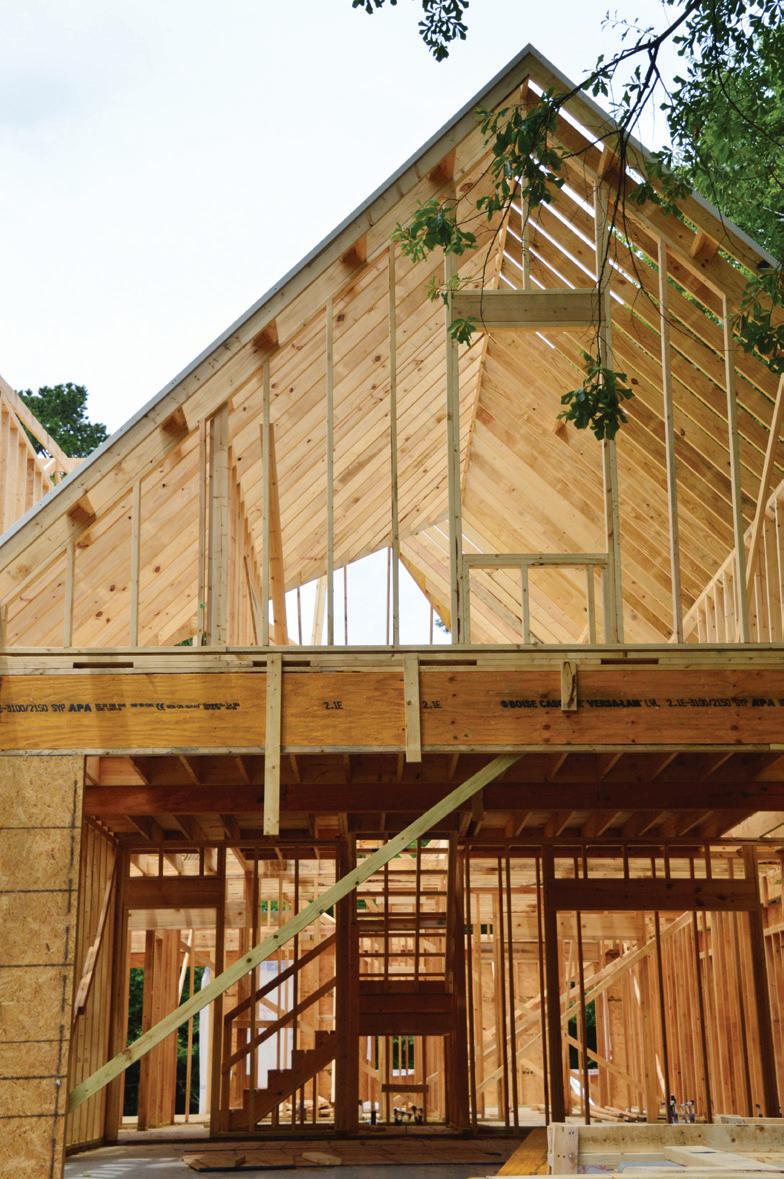
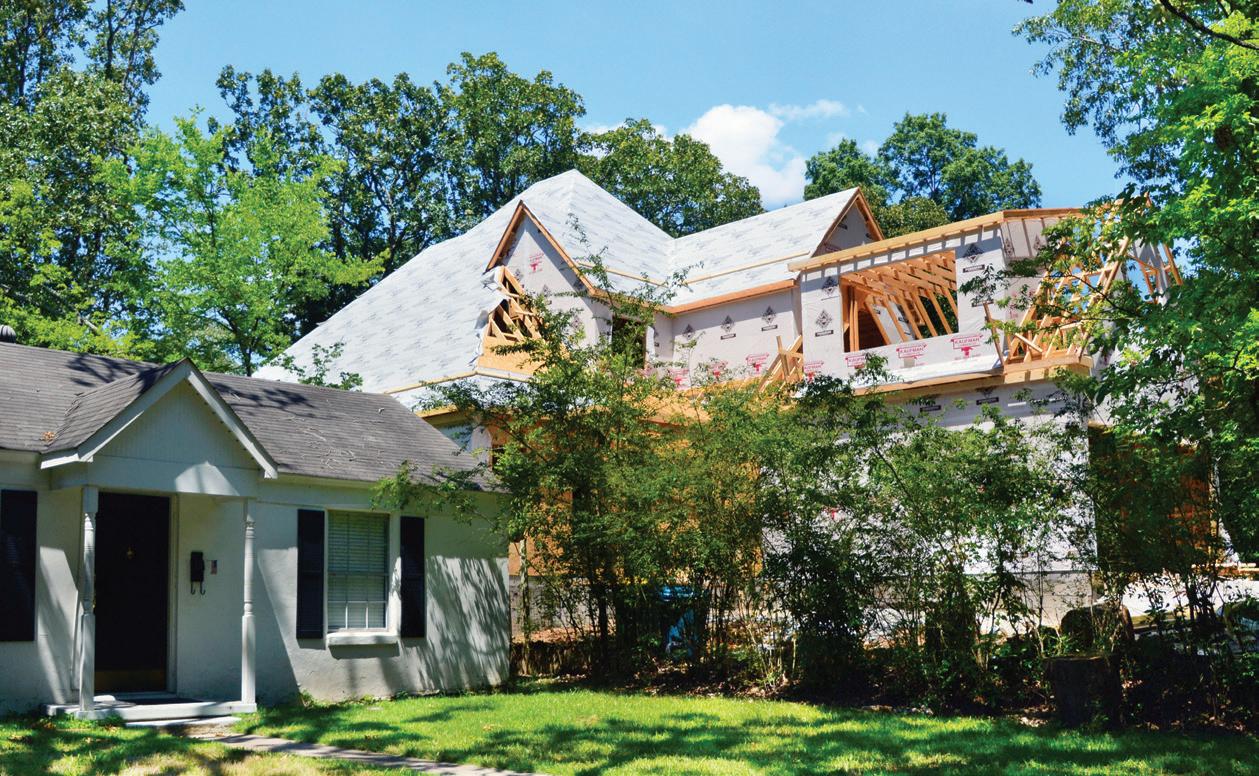
A new home under construction in Little Rock towers over its
Single-family construction ticked up during the fourth quarter of 2019, probably responding to interest-rate cuts, and the local region climbed well above the national index. In the first quarter of 2020, single-family construction remained relatively
strong nationally, but ticked down in local markets, possibly owing to unusually rainy winter weather in the south-central U.S. Second-quarter figures are preliminary, but substantially down for both the U.S. and the local area. Compared with the second quarter of 2019, U.S. permits in the second quarter of 2020 were down about 13 percent and local ones down about 26 percent, the latter possibly exacerbated by rainy spring weather. Given the magnitude of the economic crisis, what stands out is that housing construction has not collapsed; it has instead dropped to roughly 2015 levels.
Trend
Note: regional totals shown above exclude Hot Springs Village, part of which extends into Garland County beyond Metroplan’s area.
Quarterly Single-Family Construction Trend
The Residences at Harbor Town will add 176 high-end units and a marina just east of the Clinton Library in downtown Little Rock.
The Vue will add 244 units on the Arkansas River Trail in North Little Rock.
Demographic Outlook 2020
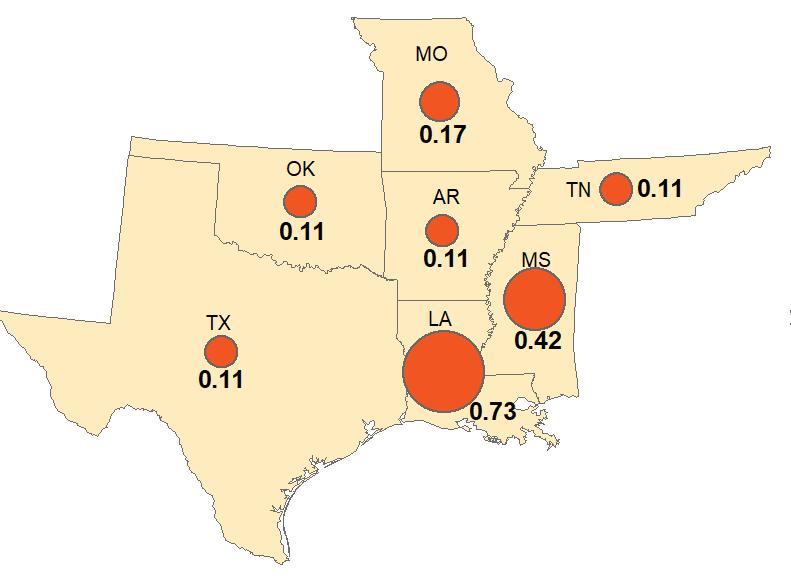
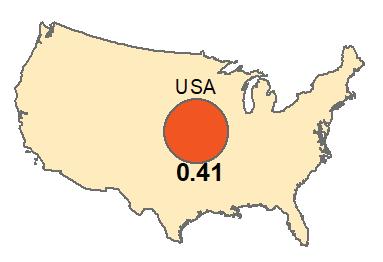
The Covid-19 pandemic has emerged as a public health threat and has thrown the U.S. economy into a deep recession. Other issues, like housing, still matter but must be viewed in light of the current economic and public health crisis. Arkansas managed the Covid-19 crisis rather well early on. The state’s mortality remained lower than in Louisiana, Mississippi and Missouri as of mid-July, 2020, but had climbed up to match other adjacent states like Oklahoma, Texas and Tennessee. A comparatively early shutdown in Arkansas seems to have helped. However, new cases have accelerated since the state began reopening its economy, and in mid-July the state’s rate of new cases had climbed above Missouri and Oklahoma. The state still lags Texas, Louisiana and Mississippi for new cases.1
UnempTrend_2019-2020_Jun2020
How has Central Arkansas fared in this crisis? The data available thus far are limited. In April 2020, the month of greatest “lockdown,” local employment dropped by 10.1 percent or 37,000 jobs, compared with April of 2019. By May the climbback had already begun, although it will be slower than the sudden loss that occurred from March to April. Regional unemployment took an unprecedented leap in April, although again the increase was a little less severe than the U.S. average. Building permits have taken a hit, but not a severe one so far, as the single-family figures at right show. The region saw 589 permits for new multi-family units in May 2020, mostly in Little Rock and Conway. While not a record, this statistic
Source: U.S. Bureau of Labor Statistics, Job trend comparison index
Source: U.S. Bureau of Labor Statistics, Compiled by Job trend comparison index 2019-2020 by Metroplan. Metroplan Figures are not seasonally adjusted. 7/14/2020
1 Data represent the week preceding July 13, cases per 1,000 population.
Covid-19 Mortality Rate
Deaths per 1,000 Population as of July 14, 2020
2 Many experts are concerned that, as commuting returns to normal, use of private automobiles may rise above pre-pandemic levels due to contagion concerns.
suggests the construction industry is still moving forward, boosted by low interest rates.
The Covid crisis continues. The sense that “the worst is over” in public health terms will be proven wrong if caseloads—rising at publication date—continue their upward vector. Economic consequences are still unfolding. Commercial property is seeing a major shakeout. This will impact local tax revenues, and challenge investors to reposition properties that previously benefitted from location advantages but have been rendered vacant by market fluctuations.
Public health is a critical economic issue. Although “lockdown” policies contributed to economic slowdown during the March-May window, much of the slowdown resulted from voluntary decisions made by individual consumers and workers as they face contagion risks. Public health is incremental to economic well-being. Economists talk of a “90 percent economy” going forward, at least until vaccines become more widespread. The fall edition of Metrotrends will expand upon the impact of Covid-19.
Pandemic preparedness is likely to affect economic and policy-making trends far into the future. The pandemic has also caused changes in transportation, like reduced use of public transit, greater use of bike and pedestrian facilities, and reductions—at least over the short-term—in auto traffic.2 E-commerce has shifted from an option to a virtual utility for many consumers. The practice of working from home has become more widespread, with consequences that will outlast the pandemic. Plans will have to be revised. Our view of the future is being refracted through a slightly different lens.
Single-Family Housing Permits: 2020 as Share of 2019
Biking and Walking 2020
A pandemic descends. Offices and businesses close, and busy people suddenly have time on their hands. Many public indoor spaces are seen as hazardous, or even off-limits. Road traffic is lighter than ever. And next … surprise … you have a renaissance in biking and pedestrian activity. It’s happened around the world. Bike shop owners will tell you they’ve never seen anything like it. Bikes, tires, pumps, and helmets are suddenly selling out. Cities like London and New York have closed selected streets, which are now flocked with walkers and bikers.
The sudden rise in biking and walking may be a passing pandemic-related fad. Yet last year’s edition of this newsletter pointed out how small investments in trails and ped-friendly facilities can leverage big increases in property values, and
“trail-oriented development” is becoming a reality in U.S. urban areas. The pandemic lifted constraints imposed by traffic and inertia. Perhaps a latent trend was waiting to emerge.
Mornings in early summer get busy on the Two Rivers Park Bridge.
Statistical Supplement
The charts below survey owner and renter costs for the twelve largest cities in Central Arkansas. Owner costs seem to run lower in the smaller outlying cities, plus North Little Rock and Jacksonville. Median rent, by comparison, is higher in smaller outlying cities, perhaps due to shortage of rental units. Rental rates in the region’s largest cities suggest the benefits of competition in larger markets but may also signify
concentrations of poverty. The table at bottom right completes the metro inequality analysis on page 6. As you can see, the Little Rock area ranks 48th in the country for homeownership among non-Hispanic whites. About 73 percent of white households own their homes, compared with 59.6 percent for African American households in the region.
Share of Owners Paying Over 30 percent of Income
Metroplan’s Demographic Review and Outlook is an annual chronicle providing demographic and housing data and insight for the Little Rock-North Little Rock-Conway MSA.
Prepared by: Jonathan Lupton, research, writing and editing Lynn Bell, graphics, layout, and illustrations
Photographs by Lynn Bell and Jonathan Lupton
This report was funded in part through grant(s) from the Federal Highway Administration and Federal Transit Administration, U.S. Department of Transportation. The views and opinions of the authors expressed herein do not necessarily state or reflect those of the U.S. Department of Transportation.
Notice of Nondiscrimination
Metroplan complies with all civil rights provisions of federal statutes and related authorities that prohibit discrimination in programs and activities receiving federal financial assistance. Therefore, Metroplan does not discriminate on the basis of race, sex, color, age, national origin, religion, disability, or income status, in admission or access to and treatment in Metroplan’s programs and activities, as well as Metroplan’s hiring or employment practices. Complaints of alleged discrimination and inquiries regarding Metroplan’s nondiscrimination policies may be directed to La’Kesha Stewart, Title VI/ADA/504 Coordinator, 501 West Markham Street, Suite B, Little Rock, AR 72201, (501) 372-3300, or the following e-mail address: lstewart@metroplan.org. (Hearing and speech impaired may dial 711.)
This notice is available upon request from the Title VI/ADA/504 Coordinator in large print, audiotape or braille.
PRESIDENT
Mayor Joe Smith
2020 Metroplan Board of Directors
City of North Little Rock
VICE PRESIDENT Judge Doug Erwin Lonoke County
SECRETARY/TREASURER
Judge Jim Baker Faulkner County
Mayor Paul Mitchell City of Alexander
Mayor Bernadette Chamberlain City of Austin
Mayor Eddie Jones City of Bauxite
Mayor Tom Farmer City of Benton
Mayor Allen E. Scott
City of Bryant
Mayor Ken Kincade
City of Cabot
Mayor David Graf City of Cammack Village
Mayor Bart Castleberry City of Conway
Mayor Sammy Hartwick City of Greenbrier
Mayor Sam Higdon
City of Guy
Mayor Roy H. Carman
City of Haskell
Mr. Keith Keck
Hot Springs Village
Mayor Bob Johnson City of Jacksonville
Mayor Frank Scott, Jr. City of Little Rock
Mayor Trae Reed, III City of Lonoke
Mayor Caleb Norris City of Maumelle
Mayor Randy Holland City of Mayflower
Mayor Jonathon Hawkins City of Mount Vernon
Mayor Mike Kemp City of Shannon Hills
Mayor Joe Wise City of Sheridan
Mayor Virginia Young City of Sherwood
Mayor Michael Nash City of Traskwood
Mayor Charles Gastineau City of Ward
Mayor Terry Don Robinson City of Wooster
Mayor Terry Mizer City of Wrightsville
Mayor Preston Scroggin City of Vilonia
Judge Randy Pruitt Grant County
Judge Barry Hyde Pulaski County
Judge Jeff Arey Saline County
Mr. Steve Frisbee Arkansas Department of Transportation