

2025 MARKET OUTLOOK
MIAMI-DADE I BROWARD I PALM BEACH
DOWNTOWN MIAMI

DOWNTOWN FORT LAUDERDALE
HOW
DID SOUTH FLORIDA BECOME THE PLACE TO BE?


The Effect of Interest Rates on Buying Power

The Tax Factor


Internal Migrations
Averages
THE STATES WINNING AND LOSING THE POPULATION GAME.
2 STATES LOST POPULATION BETWEEN JULY 1, 2023 AND JULY 1, 2024.
FLORIDA’S POPULATION GREW DURING THE SAME
PERIOD BY 463,347 “NET” NEW PERMANENT RESIDENTS (1,280 PER DAY).
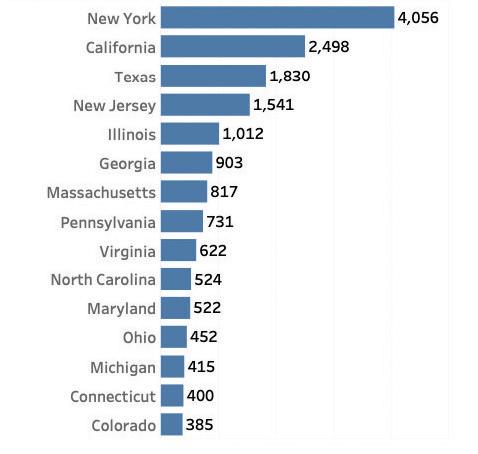
U.S. "NET" PERSON GAINS (LOSSES)
Note: The estimates are developed from a base that integrates the 2020 Census, Vintage 2020 estimates, and (for the U.S. only) 2020 Demographic Analysis estimates. For population estimates methodology statements, see https://www.census.gov/programs-sur
veys/popest/technical-documentation/methodology.html. See Geographic Terms and Definitions at https://www.census.gov/programs-surveys/popest/guidance-geographies/terms-and-definitions.html for a list of the states that are included in each region. All geographic boundaries for the 2024 population estimates series are as of July 1, 2024.
Internal Migrations
4-Year Period
THE STATES WINNING AND LOSING THE POPULATION GAME.
7 STATES LOST POPULATION BETWEEN JULY 1, 2020 AND JULY 1, 2024.
FLORIDA’S POPULATION GREW DURING THE 4-YEAR PERIOD BY 1,780,180 “NET” NEW PERMANENT RESIDENTS (1,219 PER DAY).
U.S.
"NET" PERSON GAINS (LOSSES) OVER THE 4-YEAR PERIOD BETWEEN JULY1, 2020 AND JULY 1, 2024
Note: The estimates are developed from a base that integrates the 2020 Census, Vintage 2020 estimates, and (for the U.S. only) 2020 Demographic Analysis estimates. For population estimates methodology statements, see https://www.census.gov/programs-surveys/popest/technical-documentation/methodology.html. See Geographic Terms and Definitions at https://www.census.gov/programs-surveys/popest/guidance-geographies/terms-and-definitions.html for a list of the states that are included in each region. All geographic boundaries for the 2024 population estimates series are as of July 1, 2024.
Who is moving to South Florida?
MIGRATION TO FLORIDA IN 2024 BASED ON DRIVER LICENSE EXCHANGES
Driver License exchanges from residents who moved to Florida between January 1 and December 31, 2024 and other countries or US territories.

Number of Driver License Exchanges in 2024


Top origins of Out-of-State Driver License Exchanges in 2024 in Miami-Dade County
Top origins of Out-of-State Driver License Exchanges in 2024 in Broward County
Top origins of Out-of-State Driver License Exchanges in 2024 in Palm Beach County
The Exchange Rate


DECEMBER 2023 VS. DECEMBER 2024

Source: Oanda.com. Data accessedDEC 31, 2024.


Unlock Your Profit Potential
The Median Sold Price of A Single-Family Home within Miami-Dade County Has Increased 353% Over the Past 14 Years –from $150,000 to $680,000.
Single-Family Homes
Miami-Dade County, Florida
15-Year Overview
The months of supply of available inventory of single-family homes across Miami-Dade County began increasing in the spring of 2022, when interest rates began rising from the 3%-range to the 7%-range.
Highest median price prior to
Unlock Your Profit Potential
The Median Sold Price of A Condominium within Miami-Dade County Has Increased 373% Over the Past 14 Years –from $92,000 to $435,000, but prices adjusted up & down during 2024.
Condominiums
Including Condos, Co-ops, Villas and Townhomes
Miami-Dade County, Florida 15-Year Overview
The months of supply of available inventory of condominiums across Miami-Dade County began increasing in the spring of 2022, when interest rates began rising from the 3%-range to the 7%-range.
Highest median price prior to falling prices during recession March 2007 - $265,000
A 15 YEAR LOOKBACK AT NUMBER OF SALES (2010
- 2024)
A 15 YEAR LOOKBACK AT NUMBER OF SALES (2010 - 2024)
I-395 Miami Bridge Project
Completion: Late 2027


The Overall Market
The Overall Market (All Prices) | Single Family Homes
COMPARING Q4 2024 VS. Q4 2023
MIAMI-DADE COUNTY SINGLE-FAMILY HOMES
BROWARD COUNTY
SINGLE-FAMILY HOMES
PALM BEACH COUNTY
SINGLE-FAMILY HOMES
The Overall Market (All Prices) | Condominiums
COMPARING Q4 2024 VS. Q4 2023
MIAMI-DADE COUNTY CONDOMINIUMS
BEACH
COUNTY CONDOMINIUMS BROWARD COUNTY CONDOMINIUMS
MIAMI-DADE COUNTY SINGLE-FAMILY HOMES
The Under $1 Million Market
COMPARING Q4 2024 VS. Q4 2023
SINGLE-FAMILY HOMES BROWARD COUNTY
BEACH COUNTY
SINGLE-FAMILY HOMES
MIAMI-DADE COUNTY CONDOMINIUMS
The Under $1 Million Market
COMPARING Q4 2024 VS. Q4 2023
BROWARD COUNTY CONDOMINIUMS
PALM BEACH COUNTY CONDOMINIUMS
MIAMI-DADE COUNTY SINGLE-FAMILY HOMES
The Over $1 Million Market
COMPARING Q4 2024 VS. Q4 2023
SINGLE-FAMILY HOMES BROWARD COUNTY
PALM BEACH COUNTY
SINGLE-FAMILY HOMES
661 SALES VS.
MIAMI-DADE COUNTY CONDOMINIUMS
The Over $1 Million Market
PALM
BEACH
COUNTY CONDOMINIUMS BROWARD COUNTY CONDOMINIUMS

Market Data By Price Segment
MIAMI-DADE I BROWARD I PALM BEACH
MIAMI-DADE COUNTY SINGLE-FAMILY HOMES
The Under $500,000 Market
COMPARING Q4 2024 VS. Q4 2023
BROWARD COUNTY SINGLE-FAMILY HOMES
PALM BEACH COUNTY
SINGLE-FAMILY HOMES
MIAMI-DADE COUNTY CONDOMINIUMS
The Under $500,000 Market
COMPARING Q4 2024 VS. Q4 2023
PALM BEACH COUNTY CONDOMINIUMS BROWARD COUNTY CONDOMINIUMS
COMPARING Q4 2024 VS. Q4 2023
MIAMI-DADE COUNTY
BROWARD COUNTY
SINGLE-FAMILY HOMES
PALM BEACH COUNTY
SINGLE-FAMILY HOMES
The $500,000 - $999,000 Market
COMPARING Q4 2024 VS. Q4 2023
MIAMI-DADE COUNTY CONDOMINIUMS
CONDOMINIUMS BROWARD COUNTY CONDOMINIUMS
BEACH COUNTY
The $1 Million - $1.999 Million Market
COMPARING Q4 2024 VS. Q4 2023
MIAMI-DADE COUNTY
BROWARD COUNTY
SINGLE-FAMILY HOMES PALM BEACH COUNTY
SINGLE-FAMILY HOMES
SINGLE-FAMILY HOMES
414
The $1 Million - $1.999 Million Market
COMPARING Q4 2024 VS. Q4 2023
MIAMI-DADE COUNTY CONDOMINIUMS
BEACH COUNTY CONDOMINIUMS BROWARD COUNTY CONDOMINIUMS
The $2 Million - $2.999 Million Market
COUNTY
HOMES
BEACH COUNTY
The $2 Million - $2.999 Million Market
COUNTY CONDOMINIUMS
CONDOMINIUMS
CONDOMINIUMS
The $3 Million - $4.999 Million Market
COUNTY
HOMES
BEACH COUNTY
HOMES
The $3 Million - $4.999 Million Market
MIAMI-DADE COUNTY CONDOMINIUMS
BEACH
COUNTY CONDOMINIUMS BROWARD COUNTY CONDOMINIUMS
201
The $5 Million - $9.999 Million Market
MIAMI-DADE COUNTY SINGLE-FAMILY HOMES
SINGLE-FAMILY HOMES BROWARD COUNTY
PALM BEACH COUNTY
SINGLE-FAMILY HOMES
365
MIAMI-DADE COUNTY CONDOMINIUMS
CONDOMINIUMS
90
PALM BEACH COUNTY CONDOMINIUMS
The $10 Million and Higher Market
COMPARING Q4 2024 VS. Q4 2023
MIAMI-DADE COUNTY
SINGLE-FAMILY HOMES
SINGLE-FAMILY HOMES BROWARD COUNTY
PALM BEACH COUNTY
SINGLE-FAMILY HOMES
239
The $10 Million and Higher Market
MIAMI-DADE COUNTY CONDOMINIUMS
PALM BEACH COUNTY CONDOMINIUMS BROWARD COUNTY CONDOMINIUMS
37
38

The Rental Market
COMPARING Q4 2024 VS. Q4 2023
MIAMI-DADE COUNTY
SINGLE-FAMILY HOMES
10% NO. OF HOMES FOR RENT IN THE MLS
1,778 ON DEC 31, 2024 VS. 1,624 ON DEC 31, 2023
BROWARD COUNTY
SINGLE-FAMILY HOMES
9% 3.8 MONTHS VS. 3.5 MONTHS
Q4 2024 VS. Q4 2023
CLOSED SINGLE-FAMILY RENTALS IN THE MLS
1,437 RENTALS VS. 1,407 RENTALS
Q4 2024 VS. Q4 2023 TOTAL RENTALS
9% NO. OF HOMES FOR RENT IN THE MLS 1,687 ON DEC 31, 2024 VS. 1,542 ON DEC 31, 2023
10% CLOSED SINGLE-FAMILY RENTALS IN THE MLS
1,208 RENTALS VS. 1,335 RENTALS
Q4 2024 VS. Q4 2023 TOTAL RENTALS
The Rental Market
COMPARING Q4 2024 VS. Q4 2023
MIAMI-DADE COUNTY CONDOMINIUMS
8%
BROWARD COUNTY CONDOMINIUMS
7,735 ON DEC 31, 2024 VS. 7,158 ON DEC 31, 2023 INVENTORY
TOTAL RENTALS
6%
NO. OF CONDOS FOR RENT IN THE MLS
CLOSED CONDO RENTALS IN THE MLS
6,310 RENTALS VS. 6,689 RENTALS
Q4 2024 VS. Q4 2023
19% 3.8 MONTHS VS. 3.2 MONTHS
Q4 2024 VS. Q4 2023
2%
VS. $2,850
23%
NO. OF CONDOS FOR RENT IN THE MLS
7,765 ON DEC 31, 2024 VS. 6,325 ON DEC 31, 2023 INVENTORY
TOTAL RENTALS
6%
CLOSED CONDOS RENTALS IN THE MLS
5,747 RENTALS VS. 6,108 RENTALS
Q4 2024 VS. Q4 2023

Market Data By City

AVENTURA
The Aventura Market
COMPARING Q4 2024 VS. Q4 2023

BAL HARBOUR
The Bal Harbour Market

BOCA RATON
The Boca Raton Market
COMPARING Q4 2024 VS. Q4 2023

8
The Brickell Market
COMPARING Q4 2024 VS. Q4 2023 (Zip Codes 33129, 33130, 33131)

COCONUT GROVE
The Coconut Grove Market
COMPARING Q4 2024 VS. Q4 2023 (Zip Code 33133)

3.1
The Cooper City Market

CORAL GABLES
The Coral Gables Market
COMPARING Q4 2024 VS. Q4 2023

CUTLER BAY
The Cutler Bay Market

DAVIE
2.9
The Davie Market
COMPARING Q4 2024 VS. Q4 2023

The Doral Market
COMPARING Q4 2024 VS. Q4 2023

FORT LAUDERDALE
The Fort Lauderdale Market
COMPARING Q4 2024 VS. Q4 2023

GOLDEN BEACH
NO. OF HOMES FOR SALE IN THE MLS
0 ON DEC 31, 2024 VS. 0 ON DEC 31, 2023
The Golden Beach Market
COMPARING Q4 2024 VS. Q4 2023
0 MONTHS VS. 0 MONTHS
Q4 2024 VS. Q4 2023
OF HOMES FOR SALE IN THE MLS 28 ON DEC 31, 2024 VS. 29 ON DEC 31, 2023
MONTHS

The Hallandale Market
COMPARING Q4 2024 VS. Q4 2023

HOLLYWOOD
The Hollywood Market
COMPARING Q4 2024 VS. Q4 2023

The Homestead Market
COMPARING Q4 2024 VS. Q4 2023

KEY BISCAYNE
0
The Key Biscayne Market COMPARING Q4
2024 VS. Q4 2023

CITY OF MIAMI
The City of Miami Market
COMPARING Q4 2024 VS. Q4 2023

BEACH
MIAMI
The Miami Beach Market
COMPARING Q4 2024 VS. Q4 2023

MIAMI LAKES
4.9
The Miami Lakes Market
COMPARING Q4 2024 VS. Q4 2023

MIAMI SHORES
The Miami Shores Market
COMPARING Q4 2024 VS. Q4 2023

PALMETTO BAY
The Palmetto Bay Market COMPARING
Q4 2024 VS. Q4 2023

The Pinecrest Market
COMPARING Q4 2024 VS. Q4 2023

SOUTH MIAMI
The South Miami Market

SOUTHWEST RANCHES
The Southwest Ranches Market
COMPARING Q4 2024 VS. Q4 2023

SUNNY ISLES BEACH
0
The Sunny Isles Beach Market
COMPARING Q4 2024 VS. Q4 2023

0
The Surfside Market
COMPARING Q4 2024 VS. Q4 2023

The Wellington Market
COMPARING Q4 2024 VS. Q4 2023

4.2
The Weston Market
COMPARING Q4 2024 VS. Q4 2023

WEST PALM BEACH
The West Palm Beach Market
COMPARING Q4 2024 VS. Q4 2023
GROWING INVENTORY IN 2025
JANUARY 2025 MEDIAN PRICE VS.
MONTHS OF INVENTORY
GROWING INVENTORY IN 2025 REPORT CONDOMINIUMS
JANUARY 2025
MEDIAN PRICE VS. MONTHS OF INVENTORY
WE
ARE EXCITED TO ANNOUNCE A NEW PARTNERSHIP WITH

NEO is the premier new construction / pre-construction website where REALTORS® can find the builder information needed for their customers and their business including:

Updated availability and prices
•
RESERVED Information like commission and bonuses directly uploaded by builders
•
High quality floor plans, virtual tours and renderings
• ... And much more


The Key Biscayne Fund for the Sunshine Kids invites you to an exclusive shopping experience at the Wish Fine Jewelry Showroom! Discover timeless pieces and enjoy special offers while supporting a meaningful cause.
Wednesday, February 12th 11 AM - 3 PM Wish Fine Jewelry Showroom 200 Crandon Blvd, Key Biscayne, FL 33149
A portion of the sales will benefit The Sunshine Kids Foundation. Come shop, sip, and make a differencewe can’t wait to see you!


If you’d like to join others in contributing, please visit: thecharitablefoundation.net Our hearts are with our Berkshire Hathaway HomeServices California Properties Family. The Charitable Foundation, has established a new Disaster Relief Fund. This fund is providing direct assistance to BHHS California Properties agents and staff members who have sustained property losses as a result of these devastating fires.
