Coaching Equipment Dealers to Peak Performance

2023 Dealer Financial Picture for Level 100 Tiered Curriculum Approach
NOT an actual submission by a DeLaval Dealer
A Average Dealer volume across all ten dealers
B Average Sales Mix
C Average Gross Profit by Sales Segment
D Average total Gross Margin
Average Expenses NOT allocated across sales segments
2 3 4 5 6 7 8 9 10 11 12 13 14 15 16 17 18 19 20 21 22 23 24 25 26 27 28 29 30 31 A B C D E F G H I J O P Q R S T U
F
Operating Profit
B B B B B Sales Mix 27% 12% 20% 39% 2% Absorption 101.9% Sales $2,540,160 100% $1,128,960 100% $1,881,600 100% $3,669,120 100% $188,160 100% $9,408,000 100% A Gross Profit $670,872 26% $162,960 14% $666,600 35% $1,187,453 32% $188,160 100% $2,876,045 31% D C C C C Expenses Personnel $0 0% $0 0% $0 0% $0 0% $0 0% $1,082,000 $1,082,000 11.5% Operating $0 0% $0 0% $0 0% $0 0% $0 0% $865,600 $865,600 9.2% Occupancy $0 0% $0 0% $0 0% $0 0% $0 0% $216,400 $216,400 2.3% Total Expenses $0 0.0% $0 0.0% $0 0.0% $0 0.0% $0 0.0% $2,164,000 $2,164,000 23.0% E Operating Profit $670,872 26.4% $162,960 14.4% $666,600 35.4% $1,187,453 32.4% $188,160 100.0% ($2,164,000) $712,045 7.6% F Other Income/Expense F&I Net Profit Before Tax $5,550,720 Service & Parts Parameters Tech Productivity 57% Tech Efficiency 67% Wage Multiple 2.3 Parts to Labor Ratio $1.82
Sales Dept. Service Parts Consumables Non-Dairy Eq. G&A Total
E
Average
as a Return on Sales
For Sample Illustration of Dealer Averages
For Sample Illustration of Dealer Averages
See Instructions tab before entering information.
1 2 3 4 5 6 7 8 9 10 11 12 13 14 15 16 17 18 19 20 21 22 23 24 25 26 27 28 29 30 31 32 33 34 35 36 37 A B C D E Dealership Name DDS Submitted By MAC Sample Number of Locations 1 18 buildings (7 branches) End Date for 12 months of Data 8/21/23 SALES (A) COGS (B) GROSS PROFIT (C) Total Sales & COGS Dairy Capital Equipment $1,128,960 $825,000 $303,960 VMS Equipment $1,411,200 $1,044,288 $366,912 Other Dairy Equipment $0 Total Dairy Equipment $2,540,160 $1,869,288 $670,872 26.4% Non-Dairy Equipment $188,160 $0 $188,160 Total Non-Dairy Equipment $188,160 $0 $188,160 100.0% Service Labor $1,128,960 $966,000 $162,960 Equipment Installations Labor $0 Other Service Sales $0 Total Labor $1,128,960 $966,000 $162,960 14.4% Original Parts $1,881,600 $1,215,000 $666,600 Total Parts $1,881,600 $1,215,000 $666,600 35.4% Chemicals $1,223,040 $831,667 $391,373 Liners & Tubes $1,223,040 $825,000 $398,040 Farm Supplies $1,223,040 $825,000 $398,040 Other Consumables $0 Total Consumables $3,669,120 $2,481,667 $1,187,453 32.4% Total Net Sales & GP $9,408,000 $6,531,955 $2,876,045 Total Department Expenses $2,164,000 Other Income Other Expenses e.g. Interest Total operating profit $712,045 F & I Income Net Pre-Tax Profit $712,045
For Sample Illustration of Dealer Averages
1 2 3 4 5 6 7 8 9 10 11 12 13 14 15 16 17 18 19 20 21 22 23 24 25 26 27 A B C D E F G H I J EXPENSE DETAIL Department --> Total Equpment Sales Total Labor Total Parts Total Consumables Total Non-dairy Equipment G&A Dept.* Total Personnel $1,082,000 $1,082,000 Operating $865,600 $865,600 Occupancy $216,400 $216,400 Total $0.0 $0.0 $0.0 $0.0 $0.0 $2,164,000 $2,164,000 Service Technician Productivity Parameters: Source $1,128,960.00 From Sales A in the GP Template 0 From Hours E- $ Per Tech Hour Billed #DIV/0! 0 Paid $ = Service COGS $966,000.00 * Vacation, Training, Rework, etc. Paid Hours (D) 0 From COGS B in the GP Template F- $ Per Tech Hour Paid #DIV/0! From Hours 57% Efficiency = A / B 67% Effective Wage Multiple = E / F 2.3 Parts to Labor Ratio Source Note on Service Personnel Expenses From Sales A in the GP Template Some dealerships include benefits for Technicians in COGS. If so, please note. From Sales A in the GP Template 1.82 $ Parts to Labor Ratio
G&A=General & Administrative or Overhead Expenses and not Allocated to a Department Total Dealership Hours in a Year or Period Average Per Hours Dollars per Tech A- Hours Billed Five Techs @ 40 hr * 52 wk Billed $ = Service Labor Sales B- Productive or Clock Hours Billed Hours (A) C- Non-Productive Hours* D- Total Hours Paid (B+C) Productivity or Recovery = A / D G- Repair Parts Sales H- Service Labor Sales
Gross Profits Percent of Sales
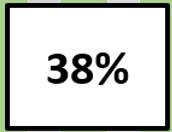
41% 38% 36% 34% 32% 31% 30% 26% 24% 23% 22%
Total Expenses Percent to Sales
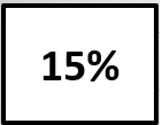
10% 14% 20% 22% 22% 23% 23% 24% 29% 31% 34%
Operating Profits as a Percent of Sales
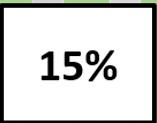
22.0% 12.1% 9.7% 9.3% 8.7% 7.6% 4.4% 4.0% 2.7% 2.4% 0.8%
263% 125% 124% 112% 106% 100% 99% 94% 84% 84% 47% Absorption of Total Expenses
w/o Captial GM$
A B

A = Product Mix of Sales
B = Gross Profits by Product Category
1 3 8 9 10 11 12 13 14 15 16 17 18 21 22 23 24 25 26 27 28 29 60 61 62 63 64 65 66 B C D E F G H I J K L N O P Q R S 1 2 3 4 5 6 7 8 9 10 Mean Low High Top 30% GAP Product Mix Sales 21% 19% 15% 34% 11% 36% 11% 54% 42% 21% 27% 11% 54% 44% Service 18% 14% 15% 4% 2% 16% 11% 18% 12% 12% 12% 2% 18% 17% Parts 25% 24% 33% 9% 15% 23% 12% 23% 19% 20% 9% 33% 27% Consumables 37% 39% 37% 47% 78% 33% 44% 17% 15% 47% 39% 15% 78% 57% Non-Dairy 5% 14% 11% 0% 9% Total 101% 101% 100% 99% 100% 100% 100% 101% 101% 99% 98% Gross Profits Sales 29% 28% 30% 18% 39% 41% 21% 25% 14% 25% 26% 18% 39% 37% -11% Service 27% 21% 48% -28% 20% 6% 27% 12% 4% 33% 17% -28% 48% 36% -19% Parts 34% 27% 47% 25% 59% 30% 36% 42% 41% 38% 25% 59% 49% -11% Consumables 39% 35% 30% 50% 20% 49% 27% 19% 31% 32% 32% 19% 50% 46% -14% Non-Dairy 45% 30% 53% 17% 38% Total 34% 30% 38% 36% 22% 41% 26% 23% 24% 32% 31% 22% 38% 38% -7% Range Product Mix Gross Profits
]
A B

A = Total Expenses as a Percent of Sales
B = Operating Profit / Return on Sales
1 2 3 4 5 6 7 28 29 30 31 32 33 34 35 36 37 38 39 40 41 42 43 44 45 46 47 A B C D E F G H J K M N O P Q R 1 2 3 4 5 6 7 8 9 10 Name Advanced Bob's Dairy Resources Redeker Veternarian's United Dairy Great Lakes Alliance Farm Systems Milk Barn Location WI WI CO WI TX IA MI CO MN PA Developer Jeff Peissig Jeff Peissig Keith Benner Beth Venard Brenda Haedge Jay M. Mary DeKam Jon Roth Nick Hemauer Matt Young Sales 27% 21% 83% 0% Service 32% 30% 79% 42% Parts 26% 15% 67% 13% Consumables 32% 23% 12% 9% 17% Non-Dairy 22% 12% Mean Low High Top 30% GAP G & A 24.1% 20.4% 14.2% 10.3% Total 29.4% 21.6% 34.3% 24.1% 21.6% 31.2% 23.4% 20.4% 14.2% 10.3% 23% 10% 34% 15% 8% Sales 3% 7% -44% 21% Service -19% -46% 100% -54% Parts 8% 13% -42% 17% Consumables 7% 12% 11% 10% Mean Low High Top 30% GAP Non-Dairy 22% 5% Total 4.4% 8.7% 4.0% 12.1% 0.8% 9.7% 2.4% 2.7% 9.3% 22.0% 7.6% 0.8% 22.0% 15.0% -7% 2nd Draft / Not Complete Total Expenses as a Percent of Sales Total Expenses as a Percent of Sales Range Operating Profit as a Percent of Sales Operating Profit as a Percent of Sales Range
Tech Productivity Percent by dividing total hours billed by total hours paid to technicians on W2. Sometimes refered to as 'Recovery.'
Tech Efficiency Percent by dividing the total hours billed by the productive or clock hours of the technicians.
Wage Multiplier Service customer shop rate billed to customers divided by average technician hourly rate.
Parts to Labor Ratio Dollars of parts sales ratio to labor sales dollars.
Absorption Percent of total dealer expenses that can be 'absorbed by gross profits from all departments except wholegoods.
53 A B C D E F G H I J K L N O P Q R S 53 54 55 56 57 58 59 60 61 62 63 64 65 66 67 68 1 2 3 4 5 6 7 8 9 10 Number or Technicians 5.0 5.0 5.0 6.5 3.5 9.0 29 A Hours Billed to Customers 24568 18614 9155 4185 3671 9126 4361 16730 19631 13511 B Productive / Clock Hours 30600 27000 11080 6156 10718 14500 7877 19260 41385 16037 C Non-Productive Hours 4760 4200 1400 2070 764 2000 750 1800 5020 9223 D Total Hours (B+C) 35360 31200 12480 8226 11482 16500 8627 21060 46405 25260 Mean Low High Top 30% GAP Tech Productivity 69% 60% 73% 51% 32% 55% 51% 79% 42% 53% 57% 32% 79% 74% -17% Tech Efficiency 80% 69% 83% 68% 34% 63% 55% 87% 47% 84% 67% 34% 87% 85% -18% Wage Multiple 2.0 2.1 2.6 1.5 3.9 1.4 2.7 1.4 2.5 2.8 2.3 1.4 3.9 3.1 -80% Parts to Labor Ratio $1.36 $1.68 $2.25 $3.96 $0.93 $2.02 $0.67 $1.88 $1.59 $1.82 $0.67 $3.96 $2.74 -$0.92 Absorption 94.2% 106.4% 98.5% 123.9% 84.1% 84.2% 100.3% 47.0% 125.3% 263.0% 113% 47% 263% Footnote: A technician working a 44-hour week would have 2288 annual paid hours / a 40-hour week would be 2080 hours paid annually.
Dealer Example of Closing GAPS to the Average Dealer
1 2 3 4 5 6 7 8 9 10 11 12 13 14 15 16 17 18 19 20 21 22 23 24 25 26 27 28 29 30 A B C D E F G H I J K L M N O P Q Revenue Mix Sales 27% 16% -11% Service 12% 18% 6% Parts 20% 26% 6% Consumables 39% 31% -8% Other 9% Total 98% 100% Margins Sales 26% 19% -7% 112,000 $ 7% x (16% x $10M) A Service 17% 27% 10% Parts 38% 30% -8% 104,000 $ 4% x (26% x $10M) B Consumables 32% 28% -4% 4% x (31% x $10M) C Total 31% 26% Operating Expenses 23% 29% 6% 6% x $2.164M $129,840 C Technician Statics Productivity 57% 69% 12% Efficiency 67% 75% 8% Wage Multiple 2.3 3.3 1 340,000 $ $129,840 Total 124,000 $ Parts ,half of gap closure Opportunity
Dealer Mean This Dealer GAP Revenue Opportunity $10 MM Margin Opportunity Other Opportunity
Sales Manager 9x3 Assessment
- Tracks GP$ per Sales Rep & coaches on improvement using a defined incentive plan
1) Manage existing Sales Reps
- Evaluates performance at least annually
- Hold Weekly Sales Meetings
Develop & Manage Sales People
Dealership Rating
2) Add Sales capacity
Dealership Rating
3) Develop & maintain Customer Value Proposition
Dealership Rating
4) Promote Company
- Identifies & recruits new sales personnel
- Establishes agreed to sales, margins & turn targets that lead to increased productivity
- With Management, establishes compensation plan that support dealership goals & objectives
- Develops good working relationships & communications with Service & Parts Managers so handoff after sale is smooth & seamless
- Develops and implements a promotion plan for WG sales that uses multiple media & campaigns
Sales & Marketing Planning
- Takes the lead for the dealership with local ag shows, customer clinics and other events that promote the entire dealership
Dealership Rating
5) Ensure enterprise selling to A&B Accounts
Dealership Rating
6) Manage Inventory
- Coaches a "Discovery Call" process (or equivalent), ensure that each Sales Rep has identified Top 10 Customers and opportunities for all products & services...
- …and has an agreed Action Plan for each.
Sales Administration
Dealership Rating
7) Manage Sales Administration
Dealership Rating
Vendor Contact 8) Coordinate with Vendors
Dealership Rating
Personal Development 9) Develop one's self
Dealership Rating
- Regularly monitors inventory turns and aging to achieve planned targets
- Has good system to consistently evaluate Used equipment
- Knows and meets Department Gross & Net Margins which include expense targets
- Supervises Sales Administration staff (if any)
- Provides forecasts and orders to OEM's system
- Is aware of and leverages all various Vendor sales & marketing programs, including Used
- Commits to continuous learning about management and coaching
- Actively manages own time
- Tracks Metrics for performance improvement (Participation, Close Rate, Share) & communicates with Sales Reps daily on individual lead / quotes / deals
- Travels with a Sales Rep at least 2 days a week and/or Coaches / Role Plays before key calls
- Assesses each Rep's motivations and behaviors & provides regular coaching
- Agrees with & tracks activity for Conquest prospects with each Sales Rep
- Uses on-boarding & training processes for all new hires
- Trained in interviewing & uses a team approach
- Collaboratively builds and monitors each salesperson's training and development plan to ensure their continued growth & productivity
- Acts as a catalyst for processes that engage a total dealership approach to sell all products & services
- Creates & demonstrates a culture that the Wholegoods Sales department is the biggest promoter of the dealership's Product Support departments
- Works with all Managers to data mine Descending Sale Lists & other customer data to identify marketing opportunities
- Has identified different promotions to different target markets
- Coaches all new hire Sales Reps to A level benchmark performance within 3 years
- Uses formal assessment tools eg. Caliper
- Ensures that the entire WG Sales Department knows and communicates the total value of the dealership in all their activities
- Provides training for all new dealership personnel on dealership's value proposition
- Drives a competitive acquisition process that includes individual meetings, demonstrations and plant tours

- Drives the analysis to identify all A & B customers / prospects
- Has a dealership plan on who will call on them and how often
- Builds the B2B processes & culture to sell to professional producers
'- Has instilled a customer profiling process leading from the 'Discovery Calls' process
- Has a disciplined approach to monitoring and selling Used
- Measures and drives a pre-sell approach
- Achieves New Turns of 2X and Used of 3X
- Achieves Expense targets: Personnel than 50% of Gross Profit (which includes Sales Admin as well as Sales Rep compensation), Occupancy of 5% and Operating of 25%
- Develops strong links between each Sales Reps activity, forecast provided & specifications of machines ordered
- Achieve a pre-sell of major products of > 50%
- Has a personal development plan
- Achieves own and dealership plans for development & training (minimum 1 week per year)
- Has a defined competitive acquistion process
- Leverages a Customer Relationship Management system to monitor customer / prospect interactions, and identify opportunities

- Implements a certified Pre-Owned offering
- Achieves New Turns of 3X and Used of 4X
- Develops all Sales Administration processes to support Sales Reps, achieve targets, and increase time for Sales Manager to actively manage Sales Reps.
- Achieves highest levels of sales achievement and recognition from various vendors
- Achieves a good balance of work achievement, personal fulfillment, and ability to develop others to sell successfully
Level 100 - Foundation Level 200 - Manager Level 300 - Professional Nine Roles Responsibilities Good Better (Includes everything in Foundation Level) Best (Includes everthing in Foundation & Manager Level)


