Coaching Equipment Dealers to Peak Performance DELAVAL LEVEL 100 PARTS AND SERVICE WORKBOOK AND LEARNING GUIDE 2023

Workbook & Learning Guide Service & Parts Manager Level 100 © Copyright 2023, Machinery Advisors Consortium. All Rights Reserved Page 2 MAC Contacts: Russ Green Russ.green@machineryadvisors.org 859-475-7133 Bill Hoeg Bill.hoeg@machineryadvisors.org 262-227-0759 www.machineryadvisors.com
Workbook & Learning Guide Service & Parts Manager Level 100 © Copyright 2023, Machinery Advisors Consortium. All Rights Reserved Page 3 Table of Contents Table of Contents ............................................................................................................................................ 3 1. Introduction to Service & Parts Manager Level 100.......................................................................... 4 2. Introduction to the Business of Service & Parts ............................................................................. 14 A) PEOPLE – Manager Development ............................................................................................................. 18 1. Workshop Design Principles ........................................................................................................... 18 2. Personal Time Management .......................................................................................................... 19 B) PARAMETERS - KPIs / Benchmarks ............................................................................................................ 26 3. Basic Financials and Dealership KPIs .............................................................................................. 27 4. Service KPIs / Benchmarks ............................................................................................................. 34 5. Parts KPIs / Benchmarks ................................................................................................................ 48 C) PROCESSES ............................................................................................................................................... 56 6. Service Processes ........................................................................................................................... 57 7. Parts Processes .............................................................................................................................. 60 8. The Customer Satisfaction Process ................................................................................................. 64 D) Personnel – Employee Development ........................................................................................................ 66 9. Basic Coaching ............................................................................................................................... 67 10. Leading and Managing ................................................................................................................. 70 11. Dealership and Personal Action Plans .......................................................................................... 71
1. Introduction to Service & Parts Manager Level 100 The Tiered Curriculum Approach
The intent of this workshop is to begin your training as part of the Tiered Curriculum Approach (TCA). TCA will increase or upgrade your effectiveness as a Parts or Service Manager resulting in a professionally operated, customer-focused, efficient, and profitable department.
Level 100 is the foundation of the TCA approach - it is the first of a building block approach that provides a path for new, newer, or existing managers who want to progress to higher levels of performance. Each program is consistent in approach and is personalized to each person’s needs. This may be your first time as a manager and no prior experience is assumed. Others may have management experience but not as a Service or Parts Manager in a Dairy Equipment dealership.
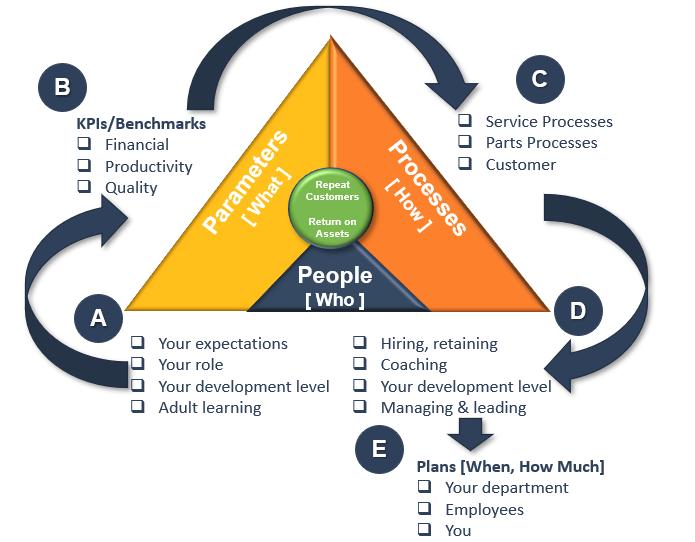
The focus of TCA is “How to Get it Done” – meaning that the emphasis throughout your training is how to get the work of your department done through the people that you hire and coach. A Balanced Dealership combines People, Processes, Planning, and the use of Best Practices to make a significant difference in the operation and performance of your department, resulting in meeting the key Parameters of retaining customers and generating a high Return on Assets.
© Copyright 2023, Machinery Advisors Consortium. All Rights Reserved Page
Workbook & Learning Guide Service & Parts Manager Level 100
4
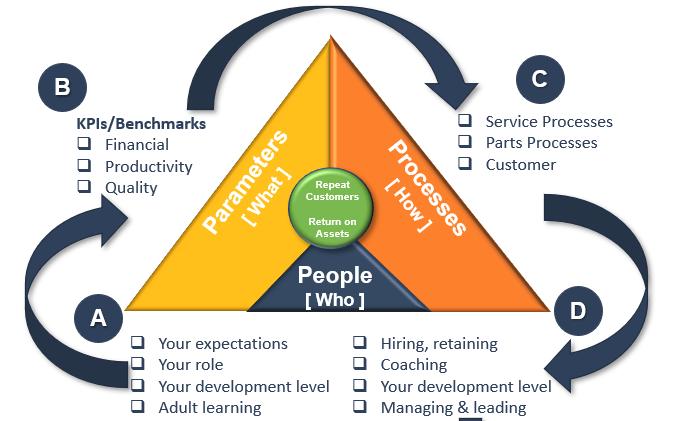
Parameters – “What” numbers to shoot for? What is “best practice” to achieving the desired results?
Processes – “How” to achieve the results of Repeat Customers & Return on Assets by balancing Sales, Quality and Productivity
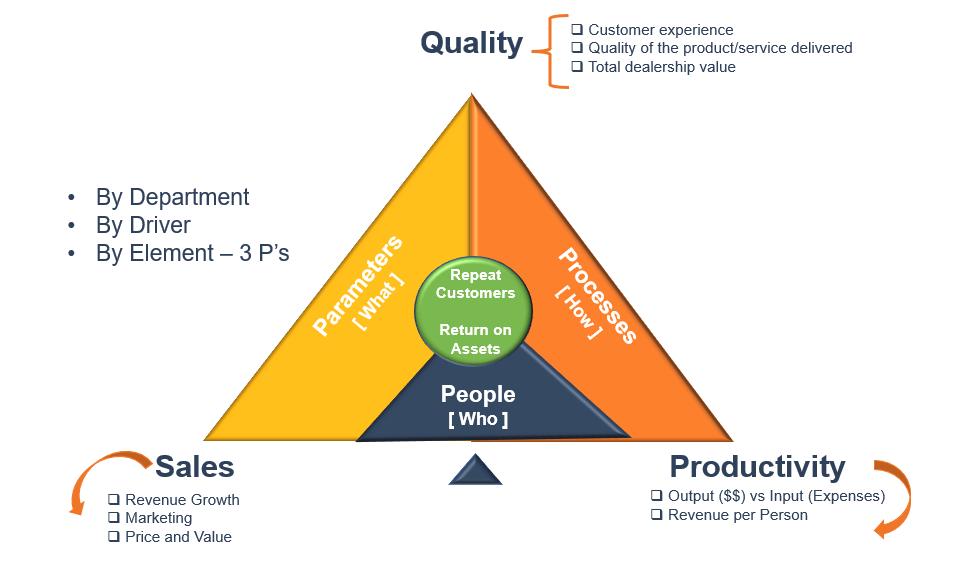
People – “Who” are the people who get work done by interacting with customers, machines, and systems. Plus how they are led.
TCA training will do its best to help you identify tools within your own operating systems on “How to Get it Done” in the area of Service and Parts to improve your dealership. Equally important is to identify the DeLaval systems and programs that can assist you in achieving your goals of customer satisfaction and financial success.
© Copyright 2023, Machinery Advisors Consortium. All Rights Reserved Page
Workbook & Learning Guide Service & Parts Manager Level 100
5
CONTINUOUS TRAINING PROCESS
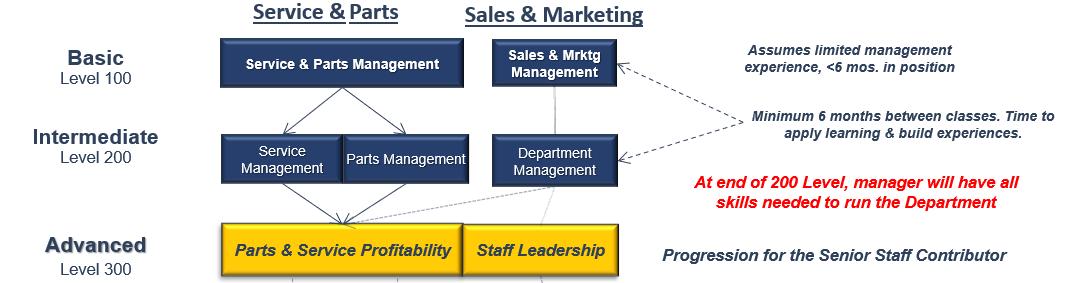
Tiered Curriculem Appoach (TCA) provides different, progressive levels of learning that facilitate a path for your continuous training.
Level 100 provides the basic foundation.
• Little or no previous management experience is assumed.
• It focuses on Service or Parts Managers who are new to their position, desire to move and work into that position, or just had to figure everything out independently.
• Explanations are provided for the basics parameters and processes for Financial Productivity and Management.
• Service and Parts Managers train together so they each learn the basics of the other’s department.
Level 200 is the Intermediate Level
• It assumes that participants have progressed from Level 100 and build on that information and learning.
• Participants should have a minimum of 6 months in their position with some operating experience.
• It focuses on all of the areas that either a Service Manager or a Parts Manager needs to succeed in effectively running their department.
Level 300 is the Advanced Level
• Participants should be experienced Managers in Service or Parts.
• It provides a refresher and exposes them to leading-edge or new business practices or technologies.
• Training can be done either individually (Service Management 300, Parts Management 300) or together with the store’s management team (Parts and Service Profitability 350).
© Copyright 2023, Machinery Advisors Consortium. All Rights Reserved Page
Workbook & Learning Guide Service & Parts Manager Level 100
6
Between each training level, participants should take advantage of other training in their dealer Business systems and DeLaval systms and programs.
You may also want to participate in a Service and Parts Dealer Improvement Group (DIG) a group of Service and Parts Managers who meet every 6 months to share Best Practices and compare their progress. There are DIGs operating and are successful in providing a way for Managers to share their problems with others, hear solutions, and revise their plans to improve.
Section Take Aways
At the beginning of each section, there is a summary of what you should take away as key points from that section. Because this workshop is the foundation for the TCA, knowing what to expect for the next level is important. So we will also state what the Take Aways are for Level 200.
Depending on the situation, the instructor may decide to cover questions about Level 200 content in this workshop or defer to the next training.
© Copyright 2023, Machinery Advisors Consortium. All Rights Reserved Page
Workbook & Learning Guide Service & Parts Manager Level 100
7
Workbooks and Manual
1) Workbook and Learner’s Guide
• Follows the flow of the two day training;
• Provides space for completing exercises and making notes;
• Builds as a ‘living document’ for you to use between training workshops and to build upon in future training;
• Prepares Action Plans in the last section as the deliverable for this Workshop;
Action Plans
“How to Get it Done” means making plans and then implementing them. There are two types of Action Plans to be done by the end of this workshop, and to be implemented by your participation at the Level 200 training.
1) Individual Actions Plans
• What you as a developing Service or Parts Manager should do to be able to develop and improve;
• May include other things like tracking your time, taking Web-based training, 3rd party training, or just doing things differently;
2) Department Action Plans
• Based on what your Department should do to improve performance in retaining customers and improving Return on Assets (ROA);
• Should also include individual Employee Coaching plans;
• May link to other dealership planning activities and/or your participating in a Dealer Improvement Group (DIG);
© Copyright 2023, Machinery Advisors Consortium. All Rights Reserved Page
Workbook & Learning Guide Service & Parts Manager Level 100
8
You are important! As part of the management team of your dealership, you play an important role in the success of your dealership and its customers. The performance of the department(s) for which you are responsible is vital to your dealership’s performance in the marketplace and its financial results.
The purpose of this learning session is to help improve your ability to make your dealership more successful
We commit to you that we will:
Help you make good use of the time you invest in this curriculum.
Focus on skills and knowledge that will help you in your job
Be open and responsive to your questions and concerns.
Exercise 1:
Introductions Class members will introduce themselves (or each other) and should include:
• Name, background, & dealership.
• Expectations for this session.
• Something unique about themselves.
Write down something unique about them (or yourselve):
© Copyright 2023, Machinery Advisors Consortium. All Rights Reserved Page
Workbook & Learning Guide Service & Parts Manager Level 100
9
Workshop Ground Rules
1. “Turn it off, turn it off!” – please help minimize disruptions by keeping cell phones, pagers, laptops, PDAs, etc. turned off or on mute/silent, with the exception of breaks and meal times.

2. “I think I’ll just observe” – your active involvement is important to your learning. All participants are of equal status as learners. Please be involved, share ideas, and enter into discussions.
3. “What happens in Vegas stays in Vegas” – information, especially dealership financial data, shared by each participant should be treated with respect and confidentiality.

4. “May I be excused? My brain is full” - – Learning and retention are enhanced by breaks. Please respect start, end, and break times. Time will be allowed during the lunch break to return phone calls, etc.

5. “Pass the endorphins, please” – Learning can be enhanced by humor. Appropriate, respectful humor is acceptable ... it's OK to have fun while we learn!


© Copyright 2023, Machinery Advisors Consortium. All Rights Reserved Page 10
Workbook & Learning Guide Service & Parts Manager Level 100
Exercise 2: Basic questions about Service & Parts?
Don’t fear the pre-test; this is for me as a trainer. I need to know what areas to really slow down on so you fully understand the material. I assure you; the post test will be simple after we cover the training material in full.
Let’s take about 10 minutes and answer some basic questions about Service & Parts? Just circle your answer from the choice: a, b, c, d, e
1. What is the role of the Key Performance Indicators (KPIs) for dealerships?
a) Tools to increase Service & Parts department sales.
b) Tools to control Service & Parts department expenses.
c) Tools to increase Service & Parts department absorption.
d) Tools for establishing benchmarks and goals for the Service & Parts department.
2. One of the most critical items to a dealership’s survival is:
a) Market share
b) Cash flow
c) Owners’ equity
d) Operating margin
3. Service and Parts’ KPIs include:
a) Sales as a percentage of total dealership sales, and sales per employee
b) Gross margin %
c) Absorption
d) Expense Ratios
e) All of the above
© Copyright 2023, Machinery Advisors Consortium. All Rights Reserved Page
Workbook & Learning Guide Service & Parts Manager Level 100
11
4. The cost of parts shown in a dealership’s financial records is determined by:
a) The manufacturer that supplies the parts to the dealership
b) The parts manager
c) Various accounting practices, which may vary between dealerships but attempt to show the true cost of the part.
d) A percentage deducted from the selling price of the parts
5. Benefits of Service, Repair Parts, Consumables, Liners & Tubes, and other parts’ absorption include:
a) Increased gross margin on Capital goods
b) Improved dealership stability and Capital goods marketing flexibility
c) Operation of Capital goods on a breakeven basis
d) Eliminations of departmental expenses
6. Service technician recovery/productivity rates measure:
a) Ratio of customer labor rate to the technician wage rate
b) Percentage of service tech paid hours billed to customers
c) Percentage of jobs on which the technician beats assigned times
d) Percentage of available time that is actually billed
7. The calculation of active parts turnover takes into account:
a) Lost sales
b) Parts returns
c) Parts with no recent demand
d) LIFO costing
© Copyright 2023, Machinery Advisors Consortium. All Rights Reserved Page
Workbook & Learning Guide Service & Parts Manager Level 100
12
8. General overhead expenses of the dealership should be:
a) Absorbed in the dealer principal’s account
b) Charged to capital sales
c) Charged only to the departments that are used for calculating absorption
d) Need to be included when calculating absorption
9. What is the role of the Service & Parts Manager?
a) Managing to keep the owner happy
b) Managing to keep DeLaval happy
c) Managing to keep the customer happy
d) Managing for increased profit!
e) All of the above with emphasis on (d)!
10. The suggested goal for service, parts, consumables, Liners & tubes, and other parts’ absorption is to cover:
a) 100 to 140% of the dealership’s operating and interest expenses
b) 81 to 99% of the dealership’s operating and interest expenses
c) 61 to 80% of the dealership’s operating and interest expenses
d) 40 to 60% of the dealership’s operating and interest expenses
Let’s take a look at all the answers!
© Copyright 2023, Machinery Advisors Consortium. All Rights Reserved Page
Workbook & Learning Guide Service & Parts Manager Level 100
13
Name ________________________________ Date _______________ Score ______
2. Introduction to the Business of Service & Parts
2.1: Unique Business now
Dairy dealerships are unique businesses for at least three reasons:
1. Capital, Service and Parts sales are cyclical.
Notes:
2. The dairy business is very capital intensive, and operational and time sensitive.
Notes:
3. A dealership consists of six (or seven) mutually, dependant businesses under one roof:
• Capital goods
• Architectural/Engineering (design, process flow, building/water/manure code management)
• Herd and data Management
• Service (Repair/Warranty/Install)
• Capital Repair Parts
• Distributor Services (Consumables, Liners & Tubes, Other supporting parts and equipment)
• Computer, robotic, and electronic Services
Notes:
© Copyright 2023, Machinery Advisors Consortium. All Rights Reserved Page
Workbook & Learning Guide Service & Parts Manager Level 100
14
2.2: Dealership Departments
Traditionally, many dealers viewed Capital goods sales as the core business, while Service and Parts functions were viewed as necessary functions to support capital goods sales.
Exercise 3: Rank the following six dealership functions based on how much attention your dealership’s management typically pays to each area (6 = most, 1 = least):
Capital goods sales
Parts sales
Consumable sales
Service sales
Herd Management
Parlor Architectural/Engineering Design/Build/Install
Q. What are some reasons many dealers give more attention to some dealership departments than to others?
Answer:
Q. What percentage of dealer owners do you think have at any time in their careers worked full-time in a parts department or a service department?
Answer:
Q. How have you seen dealership managers’ emphasis on Service and Parts change in recent years? (Check one) √
More emphasis: No change:
Less emphasis:
© Copyright 2023, Machinery Advisors Consortium. All Rights Reserved Page
Workbook & Learning Guide Service & Parts Manager Level 100
15
Categories Score
“I’m in the capital equipment business … it’s who I am.”
The effectiveness of service is dependent on parts and the volume of parts is dependent on service!
Reasons Capital sales are heavily emphasized in the industry:
1. Manufacturers have three major sources of profit:
a) Sales of new capital goods to dealerships
b) Sales of parts and consumables to dealerships
c) Interest charged on retail financing of new products and services they sale to dealers and/or customers
2. Capital sales can involve high risk and large dollars amount over a long period of time.
3. Many dealership managers and employees genuinely like capital equipment and dairy operation.
4. Lower percentage of dealership managers have worked full-time in a parts or service department (typical background is capital sales).
Importance of Service & Parts:
1. Product support (Service & Parts) is a key driver of customer satisfaction
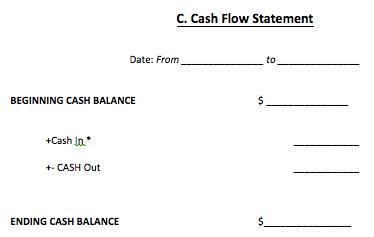
2. Service, Parts, and Consumables facilitate positive cash flow to the dealership.
3. The dealership department with the highest gross margin percentage (% of each sales dollar left after paying for the cost of time or items sold known as Cost of Goods Sold or COGS) is the service department.
4. The dealership department with the second highest gross margin percentage is repair parts department.
5. The dealership department that typically has the highest credibility with customers is the service department.
6. The dealership department that typically has the greatest amount of personal contact with customers is the consumables department.
© Copyright 2023, Machinery Advisors Consortium. All Rights Reserved Page 16
Workbook & Learning Guide Service & Parts Manager Level 100
Workbook & Learning Guide Service & Parts Manager Level 100 © Copyright 2023, Machinery Advisors Consortium. All Rights Reserved Page 17 Workshop Schedule and Sequence Time Section Exercises Day 1 AM A PEOPLE – Manager Development Expectations, Current Skill Level, Time Management Day 1 PM B PARAMETERS – KPIs / Benchmarks Calculating KPIs for your own Dealership Day 2 AM C KPIs / Benchmarks-“What If” Study: PROCESSES – Service, Parts, Customer Case Study Day 2 PM D Personnel – Employee Development Day 2 PM E PLANS – You, Your Department Developing SMART plans
A) PEOPLE – Manager Development
1. Workshop Design Principles
5 Principles of adult learning:
1. Adults see themselves as workers and independent beings even when they are “learning” new things. They have their own ideas, and they are the ones who decide what is and what is not important.
2. Adults have the experience of their years, and that experience is very useful in helping them and others learn, because everyone’s experience is different.
3. Adults are motivated to learn by milestones in their lives (new job, birth of a child, etc.).
4. Adults try to learn in order to solve problems or meet immediate needs. They want solutions that they can apply quickly in their own lives.
5. Learning is affected by every dimension of the person - physical, emotional and intellectual. For example, a person who is hungry or was just given shocking news will not be in the best frame of mind to learn.
Note how these principles are built into the Workshop.
© Copyright 2023, Machinery Advisors Consortium. All Rights Reserved Page
Workbook & Learning Guide Service & Parts Manager Level 100
18
2. Personal Time Management
For a Service & Parts Manager the most precious things during a day is “your” time – the time to achieve or make significant changes in your Service & Parts Department People and Processes so that you can devote more time to your real duties as Service & Parts Managers.
2.1: Service & Parts manager duties:
As manager of the Service & Parts Department, you are required to perform many duties. Generally, a Service & Parts Manager is responsible for:
• Customer relations.
• Staff supervision, training, and development.
• Sales and marketing.
• Managing the Department.
• Relations with other departments in the dealership and with the manufacturer (i.e. Warranty);
• Financial results.
Of course, each of these duties could be broken down further and the list extended to include:
• Writing reports and preparing budgets.
• Planning and management of activities or promotions.
• Problem-solving.
• Dispute resolution, etc.
In addition, from this workshop, you should understand that you play an important role as an agent of transformation (change). This means you will have to evaluate your department and implement any necessary changes.
Because you have so many duties, it is essential that you determine the amount of time you currently spend on each one; this will enable you to effectively manage your department and complete the many tasks you are personally responsible for. The following exercise will help you conduct an initial evaluation of the time you spend on some of your duties or activities.
© Copyright 2023, Machinery Advisors Consortium. All Rights Reserved Page 19
Workbook & Learning Guide Service & Parts Manager Level 100
Exercise 4: Evaluating my Time as Service & Parts Manager
Objectives:
• To determine the percentage of time you would like to spend on each type of activity as a Service or Parts Manager.
• To determine the percentage of time you think you actually spend on each type of activity.
• To identify ways of achieving your targets.
Instructions:
• Read the list of activities in the exercise on the following pages.
• Determine: The percentage of time you would like to spend on each type of activity as Service & Parts Manager; The percentage of time you think you actually spend on each type of activity.
• Identify ways of achieving your targets.
• Compare your results with all your colleagues. Discuss different ways of redistributing your time.
Length: 15 minutes
© Copyright 2023, Machinery Advisors Consortium. All Rights Reserved Page
Workbook & Learning Guide Service & Parts Manager Level 100
20
EVALUATING MY TIME AS PARTS & SERVICE MANAGER ACTIVITY
1. Meeting with dissatisfied customers
2. Supervising employees’ work
3. Planning promotions
4. Reviewing orders
5. Analysing reports
6. Analysing productivity reports
7. Miscellaneous meetings
8. Approving claims
9. Dealing with the manufacturer
10. Closing Work Orders
11. Other Activities:
12. 13.
TOTAL: 100% 100%
This initial evaluation of the way you use your time is only a rough estimate, but it does give you a fairly good idea of which activities take up the most time in your schedule. It also identifies areas in which you need to make changes. Ideally, of course, you would spend the bulk of your time on real management duties. How in your opinion, would your time best be allocated? What are a manager’s real duties?
Workbook & Learning Guide Service & Parts Manager Level 100
Page 21
© Copyright 2023, Machinery Advisors Consortium. All Rights Reserved
of time
like to spend on these activities
of time
I spend on these activities
of achieving this target percentage
%
I would
%
I think
Ways
2.2: Time Consumers:
Time consumers are minor events or short activities that take precious minutes of your time often needlessly or at inappropriate/critical slots during the day. If you don’t pay attention to time consumers, you may find yourself at the end of the day feeling you have accomplished nothing. The ideal solution is to devise a flexible strategy you are comfortable with to deal with these situations.
EXERCISE 5: TIME Consumers
Objectives:
• To identify the biggest time consumers in your daily work.
• To come up with possible solutions.
Instructions:
• Read the list of Service & Parts Managers’ biggest time consumers. As a group, try to come up with solutions or STRATEGIES FOR DEALING with these time consumers.
• Add your own examples and solutions to the list.
Length: 30 minutes (Do as many as possible and complete the exercise later if necessary.)
Conclusion:
Because you have so many tasks, you have to take the time to analyse the way you actually manage your work time.
If you are to spend time coaching your employees, you will need to use different management methods. Examples include:
• Management by priority.
• Management by objective.
• Delegation.
• Coaching.
© Copyright 2023, Machinery Advisors Consortium. All Rights Reserved Page 22
Workbook & Learning Guide Service & Parts Manager Level 100
Workbook & Learning Guide Service & Parts Manager Level 100
Page 23 Notes
© Copyright 2023, Machinery Advisors Consortium. All Rights Reserved
EXERCISE 5: TIME CONSUMERS
Workbook & Learning Guide Service & Parts Manager Level 100
Copyright 2023, Machinery Advisors Consortium. All Rights Reserved Page 24
©
OF TIME CONSUMERS SOLUTIONS 1. Meetings 2. Telephone calls 3. Emergencies (fires to be put out) 4. Reports 5. Routine tasks 6. Paperwork and reading 7. Interruptions and questions from employees 8. Visitors (representatives, suppliers, coworkers, friends, etc.) 9. Lack of planning and confusion among priorities
EXAMPLES
11. Indecision (always coming back to the same subject)
12. Lack of information
TIME CONSUMERS
13. Confusion in roles and responsibilities
14. Tendency to always put things off
15. Other time wasters: 16.
Workbook & Learning Guide Service & Parts Manager Level 100
Page 25
© Copyright 2023, Machinery Advisors Consortium. All Rights Reserved
EXERCISE 5:
(cont.) EXAMPLES OF TIME CONSUMERS SOLUTIONS
10. Inability to say no and tendency to want to do too much
17.
B) PARAMETERS - KPIs / Benchmarks
3. Basic Financials and Dealership KPIs
1
3.1: Basic Financial Terms and Dealership KPIs:
1 – Service Trend / Sales growth: (Similar for Parts)
2 – Service COGS Targets
3 – Service Gross Margin
4— Service Expense Ratios
5 – Service Return on Sales
6 – Service absorption


7 – Service Sales Contribution
8 - Wage Multiplier / Billing Ratio, and
9 – Shop Productivity / Recovery
10 – Service Sales by Customer Type (Internal, Warranty, Customer Repair, Customer Maintenance & Inspection)
© Copyright 2023, Machinery Advisors Consortium. All Rights Reserved
Workbook & Learning Guide Service & Parts Manager Level 100
26
Page
– Parts Trend / Sales growth: (Similar for Service)
Parts COGS Targets
Parts Gross Margin 4 – Parts Expense Ratio 5 – Parts Return on Sales 6 – Parts Absorption 7 – Parts Sales Contribution 8 – Parts Turns, including Total/Raw, Active and True Turns 9 – Parts Department Productivity 10 – Parts Sales to Service Sales Ratio
2 –
3 –
Ten (10) Basic Financial Terms—For the Income Statement and Balance Sheet
1 - Sales/Revenue: The number of products or services sold.
2 - Cost of Goods Sold (COGS): A measure of how well a company controls the cost of purchasing the goods or services it sells. It is determined by the invoices received less discounts (Parts), or by the amount of Technician wages paid (Service) the higher the gross profit margin is, the better the company is thought to control its purchasing costs.
3a - Gross Margin/Profit: Sales (Revenue) less COGS
3b – Gross Margin %: Gross Profit divided by Sales (Revenue)
4a - Expenses: All of the costs associated with running the dealership. Remember that the Technicians’ wages are in Service COGS.
4b – Expense Ratios: Department Expenses ÷ Department Revenues
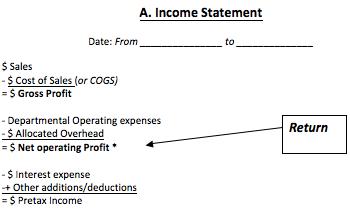
5a - Net Profit or Net Operating Income or Net Returns: Gross Profit minus Expenses. The net amount makes “The Bottom Line”. It answers the question: How much money are we making running the business?
Also is the numerator for ratios whose names begin with return on, such as Return on Sales,
5b – % Return on Sales: Net Profit ÷ $ Total Sales (Revenue)
6 - Absorption: The percentage of the total dealership expenses covered by the Gross Profit of Service, Repair Parts, Consumables, and must of the time “Other farm” Departments. The word comes from the idea that the GP of recurring revenue (Service and Parts) can ‘absorb’ the total Expenses of the dealership. So if sales of capital goods does not generate Gross Profit, then the dealership will be sustainable.
7a - Sales Contribution: The percentage of Revenue that each Department contributes to the total Dealership Sales. Department Sales (Revenue) ÷ $ Total Dealership Sales (Revenue)
7b – Parts Sales to Service Sales Ratio: Parts Sales sold by Techs ÷ Service Labor Sales
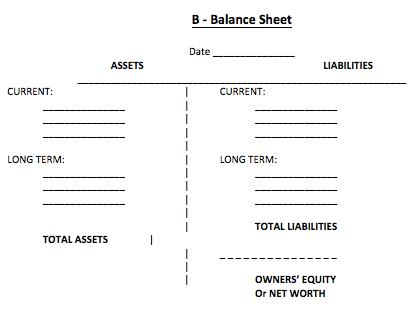
Balance Sheet
8 – Asset, Liabilities, Stockholders Equity, and Retained Earnings
9 - Return on Assets: Net Profit ÷ by Total Assets
10 - Turns: Indication of how well the inventory ‘turns over” is during a 12-month period. This calculation is the number of times the shelf stock is sold and replaced. It is calculated by dividing the total of all products Cost of Goods Sold (COGS) (Service COGS not included) in a period by the Average Total Assets used to produce the Sales.
© Copyright 2023, Machinery Advisors Consortium. All Rights Reserved
Workbook & Learning Guide Service & Parts Manager Level 100
Page 27
1. COGS Service is Tech W-2 (T-4) wage only. Benefits are in personnel.
2. Personnel – Compensation, Benefits, Insurance, workmen’s comp. Anything related to people
3. Operating – Anything that is not Personnel or Occupancy includes Recoverable Expenses
a. (Freight, Vehicle, and Technology Fees)
4. Occupancy – Rent, Heat, Light, Power, etc. Anything related to the facility or building.
5.Capital Sale Completion Absorption is an additional indicator designed especially for the dairy industry to show the potential cash absorption needed to complete a capital sale started this year. It assumes that it will take 3 years from design, permitting, construction, and installation to close the sale of a new parlor. As a result, it accounts for 3 years of capital expenses by taking the current total capital expense and multiplying it times two, and then adding it to total expenses used in the standard absorption calculation. This becomes an indicator whether expenses can be covered if there are no additional capital sales for 3 years given parlor life cycles.
Workbook & Learning Guide Service & Parts Manager Level 100 © Copyright 2023, Machinery Advisors Consortium. All Rights Reserved Page 28 Basic Financials & Dealership KPIs—Income Statement Parts and Service KPI 2] thru KPI 7] formulas found on page 27
the above Income Operating Statement gets made. See the Formulas in the left column below Sales Mix 17% 14% 19% 47% 3% Absorption 98.9% Sales $1,600,700 100% $1,298,756 100% $1,851,000 100% $4,544,000 100% $309,000 100% $9,603,456 100% COGS $1,280,560 $922,931 $958,818$3,180,800 $216,300 $6,559,409 Gross Profit $320,140 20% $375,825 29% $892,182 48% $1,363,200 30% $92,700 30% $3,044,047 32% Expenses Personnel $289,863 18% $343,865 26% $123,980 7% $725,915 16% $15,430 5% $222,200 $1,721,253 17.9% Operating $21,988 1% $147,308 11% $131,070 7% $349,140 8% $21,630 7% $230,000 $901,136 9.4% Occupancy $4,344 0% $4,254 0% $41,028 2% $63,492 1% $7,684 2% $10,389 $131,191 1.4% Total Expenses $316,195 19.8% $495,427 38.1% $296,078 16.0% $1,138,547 25.1% $44,744 14.5% $462,589 $2,753,580 28.7% Operating Profit $3,945 0.2% ($119,602) -31.8% $596,104 32.2% $224,653 4.9% $47,956 15.5% ($462,589) $290,467 3.0% Total Sales Dept. Service Parts Consumables Non-Dairy Eq. G&A Dept Sales/Total Sales = Sale Contribution 16.7%13.5%19.3%47.3%3.2% Capital Servi ce R epair Parts C ons uma bl esOther General & Admin Totals Revenues (Sales) 1,600,700 $ 1,298,756 $ 1,851,000 $ 4,544,000 $ 309,000 $ 9,603,456 $ Subtract Cost of Goods Sold (COGS) (1,280,560) $ (922,931) $ (958,818) $ (3,180,800) $ (216,300) $ (6,559,409) $ equals Gross Margin (GM) 320,140 $ 375,825 $ 892,182 $ 1,363,200 $ 92,700 $ 3,044,047 $ Gross Margin/Revenue = GM % 20.0%28.9%48.2%30.0%30.0% 31.7% Subtract Expenses G & A Expense Personnel Expense 289,863 $ 343,865 $ 123,980 $ 725,915 $ 15,430 $ 222,200 $ 1,721,253 $ Expense/Revenue = Expense Ratio 18.1%26.5%6.7%16.0%5.0% 17.9% Operating Expense 21,988 $ 147,308 $ 131,070 $ 349,140 $ 21,630 $ 230,000 $ 901,136 $ Expense/Revenue = Expense Ratio 1.4%11.3%7.1%7.7%7.0% 9.4% Occupancy Expense 4,344 $ 4,254 $ 41,028 $ 63,492 $ 7,684 $ 10,389 $ 131,190 $ Expense/Revenue = Expense Ratio 0.3% 0.3%2.2%1.4%2.5% 1.4% Total Expenses (316,195) $ (495,427) $ (296,078) $ (1,138,547) $ (44,744) $ (462,589) $ (2,753,579) $ Total Expense/Revenue = Expense Ratio 19.8%38.1%16.0%25.1%14.5%4.8%28.7% GM - Expenses = Net Profit, Operations 3,945 $ (119,602) $ 596,104 $ 224,653 $ 47,956 $ 290,468 $ Net Profit/ Revenue = Return on Sales 0.2%-9.2%32.2%4.9%15.5% 3.0% Repair Parts Sales to Service Sales Ratio(Parts Sls/Service Sls 1.43 $ ServiceParts ConsumablesOther Total Absorption Service GM + Parts GM + Consumables GM + Other GM divided by Total expenses Current Cash Absorption by Dept 13.6%32.4%49.5%3.4%98.9% Includes extra 2 yrs, est. Capital Expense Capital Sale Completion Absorption 11.1%26.3%40.3%2.7%80.4%
How
Exercise 6: Illustration of Basic Financial Terms and Calculation of Dealership KPIs
What is the formula for any expense ratio? _______________________
What is the formula for calculating the absorption contribution for Repair Parts? ______________________ For Service? ____________________ For the total Dealership? ___________________________________
What is the formula for Departmental Sales Contribution? ________________________________________
What do you have to subtract from Gross Margin to get Net Profit? _________________________________
What is the Formula for departmental return on Sales? ___________________________________________
What are the three main expense categories that we want to keep track of?
What makes up Service Cost of Goods Sold (COGS) _______________________________________________
Service KPI #6] & Parts KPI #6] Absorption formula found on page 27
Capital sales usually have a 3-plus year cycle versus Service and Parts real-time cash generation. If capital sales are sporadic or get delayed, they may be unable to produce enough margin to cover any overhead of the dealership. The service sales department and the different parts sales departments should produce a gross margin that absorbs all overhead. This is called Service & Repair Parts, Consumables, and Other Parts Absorption or Service and Parts Absorption
(Service gross margin + repair parts gross margin + consumables gross margin + other gross margin) ÷ (Total operating expense + interest expense) = Absorption
The guideline for service & parts absorption is 100% - 140+ %. Dealerships should target absorption of 100% or greater.
Note: The initial Guideline is 140% for Dealership absorption and 100% for Capital Sales Absorption.
Q. Why is absorption important when the Capital sale takes 3 or 4 years to complete? What does it do for the dealership when the Capital sale is closed?
© Copyright 2023, Machinery Advisors Consortium. All Rights Reserved
Workbook & Learning Guide Service & Parts Manager Level 100
29
Page
Q.
What are some of the drivers of absorption?
Workbook & Learning Guide Service & Parts Manager Level 100 © Copyright 2023, Machinery Advisors Consortium. All Rights Reserved Page 30 Exercise 7: Service & Parts Absorption Service Sales $1,600,000 - Service COGS $750,000 = Service Gross Margin Repair Parts + Consumables Sales + Others Sales $5,700,000 - Repair Parts + Consumables+ Other Farm COGS $3,700,000 = Repair Parts +Consumables + Other Farm Gross Margin Service Gross Margin + Parts Gross Margin ÷ Operating Expenses + Interest $2,725,000 = Service & Repair Parts Absorption
of absorption?
What is your reaction to this level
KPI #9]
– Calculating Return
on Assets (ROA) formula found on page 27.
Assets are “everything the dealership owns.” Because they represent money invested by owners or creditors, the key business question is, “Is the dealership producing a return sufficient to justify the total asset investment?”
The KPI for the dealership is a minimum of 15% which includes Parts and Service Assets.
To calculate ROA, we use the following formula:
$ Net operating income ÷ $ Total assets = % Return on assets. In the example above, ROA is: _______________
KPI
#10] -- Calculating Turns formula found
on page 27
Assets in the form of Inventory are sold (or turned over) to produce Revenue. The number of times that the inventory turns is calculated simply by:
Total Sales Cost of Goods Sold ÷ $ Total Inventory = Turns In the example above, Turns are: _______________
In Parts, we might use a more sophisticated calculation for inventory by taking Average Monthly Inventory.
© Copyright 2023, Machinery Advisors Consortium. All Rights Reserved Page
Workbook & Learning Guide Service & Parts Manager Level 100
31 Total Sales/Revenue $10,500,000 Cost of Goods Sold $6,800,000 Gross Margin $3,700,000 Operating Expenses $2,800,000 Net Operating Income Cash & Receivables $700,000 Inventories $3,300,000 Total Current Assets Long term Assets $1,200,000 Total Assets Current Liabilities $3,500,000 Long Term Debt $500,000 Total Liabilities Owners’ Equity $1,200,000 Liabilities + Equity
Dealership KPI Customer Satisfaction –
Q. Why is repeat business (loyal customers) so important? Measuring customer satisfaction:
Formal: Surveys
Questionnaires
Individual customer interviews
Focus groups
Informal: Employee conversations
Customer Retention Data Mining
Post-sales follow-up
Post-service follow-up-other
Q. How can you ask customers about your department in a way that lead them to give you an honest comparison to your competitors?
Customer problems & dissatisfaction:
• The #1 reason customers defect – “I felt like no one really _______________ my __.”
• Over ____% of the time, a customer problem solved _____________ and _________________ increases customer satisfaction.
Q. Think about one person in your department(s) that is not a leader in customer satisfaction. How would you bring the subject up, and what would be the first commitment you would request of that person?
© Copyright 2023, Machinery Advisors Consortium. All Rights Reserved Page
Workbook & Learning Guide Service & Parts Manager Level 100
32
“Idon’tjustwantsatisfiedcustomers.Iwantthemsohappythey won’teventhinkaboutgoingsomewhereelse.”
Customer Lifetime Value
• Attracting a new customer costs _____ times as much as retaining current ones.
• Customer loyalty leads to repeat business and develops “customers for life.”
• The “lifetime value” of customers can be estimated.
Exercise 8 - Customer Lifetime Value:
Calculate the “lifetime value” of the following customer. One for a 10,000-cow herd and one for a 500-cow herd.
Age 35, expects to continue until at least age 65
How many capital Purchases will they make? Cost of the Purchase?
Average amount of Service and Repair parts per year will they need?
Average number of Consumables per year will they require?
Workbook & Learning Guide Service & Parts Manager Level 100
Page 33
© Copyright 2023, Machinery Advisors Consortium. All Rights Reserved
“Lifetime value” of this customer (not including inflation) 10,000 cow = $ _______________ 500 cows = $ ______________
Notes
“Customerscomplain aboutabusinessforlotsofreasons. Buttheyusually complain toabusinessforonlyonereason.”
4. Service KPIs / Benchmarks
Workbook & Learning Guide Service & Parts Manager Level 100 © Copyright 2023, Machinery Advisors Consortium. All Rights Reserved Page 34
Service KPIs 1 – Service and Parts Trend / Sales growth 2 – Service COGS Targets 3 – Service Gross Margin 4— Service Expense Ratios 5 – Service Return on Sales 6 – Service absorption 7 – Service Sales Contribution 8 - Wage Multiplier / Billing Ratio, and 9 – Shop Productivity / Recovery 10 – Service Sales by Customer Type (Internal, Warranty, Customer Repair, Customer Maintenance & Inspection)
Workbook & Learning Guide Service & Parts Manager Level 100
Page 35 Notes
© Copyright 2023, Machinery Advisors Consortium. All Rights Reserved
Service & Parts KPI #7] Sales as % of Total Dealership Sales (or Contribution-Sales Mix) KPI formula found on page 27 Referenced on pages 34 and 48
One common way to analyze parts, and service sales is to compare the sales of a department to total dealership sales:
The Initial guidelines for parts sales as a percentage of total dealership sales is approximate: Repair Parts 25%; Consumables 38%; and other 1%
Formula: Department Parts sales ÷ Total dealership sales = Parts as % of Total sales
The initial guidelines for service sales as a percentage of total dealership sales is approximate: 20%
Formula: Service sales ÷ Total dealership sales = Service as % of Total sales
Parts or service sales failing to meet the guidelines for % of total dealership sales does not necessarily mean these departments are performing poorly. Any time a guideline is missed, we should ask two questions:
1. Is there some sort of business or economic cycle?
2. Is there a reasonable explanation?
Notes:
© Copyright 2023, Machinery Advisors Consortium. All Rights Reserved Page
Workbook & Learning Guide Service & Parts Manager Level 100
36
Exercise 9: Service & Parts Sales % of Total Sales
Q. Based on these numbers, how is the parts department performing? How is the service department performing?
Workbook & Learning Guide Service & Parts Manager Level 100 © Copyright 2023, Machinery Advisors Consortium. All Rights Reserved Page 37
Answers in italics Year All Parts & Consumables Sales Total Sales % of Total Yr. 1 $5,805,000 $9,370,000 ____% Yr. 2 $4,998,000 $8,410,000 ____% Yr. 3 $6,617,000 $10,180,000 ____% Yr. 4 $7,480,000 $11,690,000 ____% Yr. 5 $8,294,000 $12,760,000 ____% 5 yrs. $33,194,000 $52,410,000 63.3% Year Service Sales Total Sales % of Total Yr. 1 $1,445,000 $9,370,000 ____% Yr. 2 $1,360,000 $8,410,000 ____% Yr. 3 $1,640,000 $10,180,000 ____% Yr. 4 $1,750,000 $11,690,000 ____% Yr. 5 $1,870,000 $12,760,000 ____% 5 yrs. $8,065,000 $52,410,000 15.4%
A healthy dealership usually has a healthy balance between departments, as each department generates its appropriate share of sales and margins.
Q. What are some “reasonable explanations” (other than good or bad performance on the part of the parts or service department) that could cause parts or service sales as a percentage of dealership total sales to rise or fall?
Department Sales as % of Total Dealership Sales (my dealership):
Using your dealership numbers, calculate your dealership’s Service, Repair Parts, Consumables, and Other sales as a % of total dealership sales:
1) Divide each department’s sales by total dealership sales
2) Enter this number on your Dealer Action Plan
© Copyright 2023, Machinery Advisors Consortium. All Rights Reserved Page
Workbook & Learning Guide Service & Parts Manager Level 100
38
Service & Parts KPI #1] Sales Trend / Growth KPI referenced on page 34 and 44
A dealership Service and Parts Department should plan to increase 10 to 15% each year.
Price increases are a part of this increase but the increased capital goods market, expanded service offerings (Inspections) and hiring of additional Technicians are ways the best dealers achieve these increases.
For your own dealership, what was your increase in Service and Parts Sales for this year compared to last year?
What increases do you have planned for next year?
Service KPI #3] Gross margin % KPI Reference found on page 34
$ Revenue
- $ Cost of goods sold Gross Profit ÷ Revenues = Gross margin %
= $ Gross Profit
Gross margin percentage measures how many cents of every dollar of sales are left after paying for the tech wage.
The formula for gross margin percentage is: $ Gross margin ÷ $ Revenue Sales
Typically, gross margin percentage is highest in the service department, and second highest in the part department.
The initial guideline for Service Gross Margin percentage is 55+%.
Q. Since the formula for gross margin is sales minus cost of goods sold, what are the only two things that can increase gross margin?
1) ____________________________________________________________________
2) ____________________________________________________________________
There are two Ratios that can affect either 1) Increased Sales, or 2) Reduced (or more productive) Cost of Goods Sold.
© Copyright 2023, Machinery Advisors Consortium. All Rights Reserved Page 39
Workbook & Learning Guide Service & Parts Manager Level 100
Service KPI #8]
Wage Multiplier / Billing Ratio KPI Reference found on page 34
Wage Multiplier is calculated by the formula.
Formula: Shop Rate ÷ Average Technicians Wages $
Initial guideline of wage multiplier KPI is 2.8 to 3.
Average Technician Wage is the total wages paid (W-2 in the US, T-4 in Canada) ÷
Hours worked. Both include Overtime. Because of the demand for Technicians in general, and in the Heavy Equipment Industry in particular, wages vary widely around the continent, so this Ratio is very important to be able to generate the GP % of 55%
Q - Some dealerships achieve a Ratio of 2.8 or higher. Why would this make it possible to attract more or better Technicians?
© Copyright 2023, Machinery Advisors Consortium. All Rights Reserved Page 40
Workbook
& Learning Guide Service & Parts Manager Level 100
Total
__________________________________ Wage Multiplier Productivity or Recovery Profitbility Techs $ Rates Hours Sold/Tech Revenue Revenue 7X$101 X1706 =' $1,203,754 2.8 82% Techs Hours/Year/40 hour week Cost of Goods Sold (COGS) 7X$36.00X2080 =' $524,160 Gross Profit or Gross Margin $679,594 56.5%
Service KPI #9 Productivity—Recovery Rate Reference found on page 34
Hours Sold/Billed1706
Tech's Responsibility
Hours Assigned1706
Manager Responsibility
Hours Paid/Payroll 2080
95% to 105% Efficiency
82% Productivity
KPI targets or Recovery
82% Appplication
Approved Non-billable 374Hours (18% of Time)
Allowed Time 208 Vacation, Holidays, Personal Time
Expensed Time 166 Training, Meetings, Rework
Given a 40 hour Work Week
50 Hour work weeks allow for obtaining a higher productivity rate. If you don’t assigned hours, then available hours less meetings and rework should be used. Repair time Targets should still be given to each Tech for each Work Order to help the Service Manager Schedule time.
Hours Sold/Billed2188
Tech's Responsibility
Hrs Assigned/Available2188
Manager Responsibility
Hours Paid/Payroll 2576
95% to 105% Efficiency
85% Productivity
KPI targets or Recovery
85% Appplication
Available before meetings and rework 2288
Approved Non-billable 383Hours (15% of Time)
Allowed Time 208 Vacation, Holidays, Personal Time
Expensed Time 175 Training, Meetings, Rework
Given a 50 hour Work Week
© Copyright 2023, Machinery Advisors Consortium. All Rights Reserved
Workbook &
Guide
Learning
Service & Parts Manager Level 100
Page 41
}
}
}
}
Example of KPI’s 3] Gross Profit Margin, 8] Wage Multiplier, and 9] Productivity—Recovery
References found on page 34
$/Hour Billed What could cause that to
$/Hour Paid What could cause that to change?
Workbook & Learning Guide Service & Parts Manager Level 100 © Copyright 2023, Machinery Advisors Consortium. All Rights Reserved Page 42
________________________________________________________________________________ ________________________________________________________________________________ ________________________________________________________________________________ Wage Multiplier Productivity or Recovery Profitbility Techs $ Rates Hours Sold/Tech Revenue Revenue 7X$101 X1706 =' $1,203,754 2.8 82% Techs Hours/Year/40 hour week Cost of Goods Sold (COGS) 7X$36.00X2080 =' $524,160 Gross Profit or Gross Margin $679,594 56.5% Hours
cause that to change?
Billed What could
change?
Hours
change?
Paid What could cause that to
7b – Parts Sales to Service Sales Ratio: Repair Parts Sales÷ Service Labor Sales Formula found on page 27
For every service hour sold, there are repair parts sold along with that. If your parts sales to service sales ratio is a $1.25-for-Service Dollar sold as shown in this example then if you have service sales of $1,203,754 then the repair parts sold in the process would represent $1,504,692 resulting in the service techs generating $1,221,283 worth of Gross Margin for the dealership.
Research of current stores shows the “Parts Sales to Service Sale ratio is between $.98 per dollar to $1.50 per dollar.
Workbook & Learning Guide Service
Page 43
& Parts Manager Level 100 © Copyright 2023, Machinery Advisors Consortium. All Rights Reserved
Wage Multiplier Productivity or Recovery Profitbility Techs $ Rates Hours Sold/Tech Revenue Revenue 7X$101 X1706 =' $1,203,754 2.8 82% Techs Average Hourly Wage Hours/Year/40 hour week Cost of Goods Sold (COGS) 7X$36.00X2080 =' $524,160 1.25 Parts to $1 Labor Gross Profit or Gross Margin $679,594 56.5% Service Labor Gross Profit $679,594 Plus Parts $1.25 X $1/Labor X 45% $541,689 $1,504,692 Repair Parts GM @ 45% Total Gross Profit Generated $1,221,283 Parts included
Budgeting and Available Tech Hours
Like capital equipment and the different parts groups, the service sales department buys at wholesale and sells at retail. However, there are two important differences:
(1) Instead of “things”, the department buys and sells technician labor.
(2) Technician labor purchased by the dealership is totally perishable. Therefore:
• Technician labor bought but not sold (billed) is a non-recoverable loss
• Extra labor cannot be stockpiled for use in times of high demand.
The Recovery-Productivity KPI measures, for each technician, the percentage of available time (hours paid to work as a Technician) that is actually billed. Target on a 50 week is 85%; Target for a 40 hour week is 82%.
Notes:
© Copyright 2023, Machinery Advisors Consortium. All Rights Reserved
Workbook & Learning Guide Service & Parts Manager Level 100
Page 44
Tech Time Availability Average Tech hourly Wage Std Service Time Available Hrs/Wk Total Hours 32.50 $ 5,200.00 $ Vacation Weeks/Year 52.00 Hour/week 32.50 $ 1,560.00 $ PTO Vacation/Sick PTO (4.00) 40160.00 32.50 $ 2,600.00 $ Training Holiday-weeks (1.20) 4048.00 32.50 $ 4058,240.00 $ Regular Time Training weeks (2.00) 4080.00 48.75 $ 1021,840.00 $ Overtime weeks available 44.80 502,240.00 Hours available to bill 65.00 $ 4 3,120.00 $ 12 2,576 Total Paid Hours/year/ tech weekends on call DoubleOvertime Meeting weeks (1.00) Rework Target 50(50.00) 84.9% Recovery 92,560.00 35.93 $ Rework weeks (1.00) 2.232%50(50.00) Average Annual Tech Wage Ave. Hour Wage wih overtime Total Billable Weeks 42.80 2,140.00 Hours Available 101.00 $ Shop Rate 48 on call double overtime hours Working days Days less rework&meetings Weeks available/year 42.80 502,188.00 Billable hours/tech with double overtime 224.00 5 214.00 Hours available/Tech 2,188.00 Work Days 224 Billed Days equivalent 214 9.77 Number of Techs 7.00 101.00 $ Shop Rate 220,988 $ Could be billing/year/tech 220,988 $ 12 18,416 $ Billing Monthly Total Real Billable Hours available 15,316.02 1,546,918 $ Max Potential Months
KPI #9] Technician Productivity or Recovery Rate Reference found on page 34
The formula: Total hours billed ÷Total hours paid.
The guideline for individual technician productivity or recovery rate is 82% based on a 40 hour week. 85% for a 50 hour Week.
Examples of acceptable unavailable time:
Department meetings
Training sessions
Vacations & Sick leave
Legal Holidays
Other: ______________________________________
Examples of unacceptable unavailable time
Writing Work Order work description when not punched on the work order
Waiting at the parts sales department
Giving “free” technical advice
The excess time that is written off
Excess time waiting for technical support or assistance.
Other: ______________________________________
Service KPI #10] Service Sales by Customer Type Reference found on page 35
Service labor can be billed to customers, internal, or warranty. The percentage billed to each is called the service sales mix.
The initial guideline for service sales mix is:
• Retail customers 70%
• Internal/Installations (goes in COGS of Capital) 20%
• Warranty 10%
© Copyright 2023, Machinery Advisors Consortium. All Rights Reserved Page
Workbook & Learning Guide Service & Parts Manager Level 100
45
Q. A customer calls your dealership and asks to speak to the technician (by name) who last worked on his/her parlor. How should the call be handled?
Q. During the up cycles of the industry, many dealerships are selling and delivering more new Parlor (capital) Equipment. Consequently, their Service Sales Mix is heavily weighted toward Internal (install) and Warranty. How should a dealership and the Service Department react when the cycle moves to the downside?
Exercise 10:
Calculate for Service
Calculate for Repair Parts, Consumables, and Other
Service Productivity or Recovery for My Dealership
Using your dealership numbers, calculate your dealership’s recovery rate:
1) Calculate hours of labor billed:
Total service labor sales ÷ Retail hourly labor rate
2) Calculate recovery rate: Hours billed ÷ Labor hours paid to technicians.
3) Enter this percentage on Dealership Action Plan
Note:
Q – Can there be a target for Revenue per Technician? ________________________
Q – What should be the target for your dealership? ____________________________
Workbook & Learning Guide Service & Parts Manager Level 100
Page 46
© Copyright 2023, Machinery Advisors Consortium. All Rights Reserved
Service & Parts KPI #7] Service & Parts Absorption Reference found on pages 27, 34, and 48 and Formula found on page 29
Workbook & Learning Guide Service & Parts Manager Level 100 © Copyright 2023, Machinery Advisors Consortium. All Rights Reserved Page 47 Notes
5. Parts KPIs / Benchmarks
Workbook & Learning Guide Service & Parts Manager Level 100
Copyright 2023, Machinery Advisors Consortium. All Rights Reserved Page 48
©
Service
Parts KPI #1] Sales Trend / Growth
Parts KPI
Sales
% of Total Dealership Sales
Contribution or Sales Mix)
the Service
36.
– Parts Trend / Sales growth: (Similar for Service)
– Parts COGS Targets 3 – Parts Gross Margin 4 – Parts Expense Ratio 5 – Parts Return on Sales 6 – Parts Absorption 7 – Parts Sales Contribution 8 – Parts Turns, including Total/Raw, Active and True Turns 9 – Parts Department Productivity 10 – Parts Sales to service Sales Ratio
Parts KPIs
&
Service &
#7]
as
(Sales
Both are covered in
KPI section pages 34, 48 and Formula is on
1
2
Parts KPI #3] Gross margin % Reference found on page 48
$ Sales
- $ Cost of goods sold $ Gross margin ÷ $ Sales = Gross margin %
= $ Gross margin
Gross margin percentage measures how many cents of every dollar of sales are left after paying for the item sold.
The formula for gross margin percentage is: $ Gross margin ÷ $ Sales
Typically, the Parts department generates the second-highest Gross Margin.
The guideline for repair parts’ gross margin percentage is 45% to 48%. Guidelines for consumables and others is 30%
Q. Since the formula for gross margin is sales minus cost of goods sold, what are the only two things that can increase gross margin?
1) _______________________________________________________________________________________
2) _______________________________________________________________________________________
Exercise 11: Parts Gross Margin % (my dealership):
Using your dealership numbers, calculate your dealership’s parts gross margin %:
1) Calculate Repair parts gross margin dollars; Consumables gross margin dollars: The formula: Parts sales - parts cost of goods sold
2) Divide gross margin $ by total parts sales
3) Enter this percentage on you Dealer Plan
© Copyright 2023, Machinery Advisors Consortium. All Rights Reserved
Workbook & Learning Guide Service & Parts Manager Level 100
Page 49
Parts KPI #8] Inventory Turn Reference found on page 48
Parts inventory is often a dealership’s largest paid asset. Properly managing parts inventory is extremely important because it directly impacts:
o Fill rates
o Lost sales
o Customer satisfaction
o Obsolescence
o Shop efficiency
o Working capital
o Cash flow
o Return on assets
Parts Turnover
Turnover is simply the ratio between parts cost of goods sold and inventory (the average number of times a part “turns over” annually). This is called Total or Raw parts Turn. The traditional industry practice is to measure parts turnover as:
The formula: Parts Cost of Goods Sold (COGS) or Parts sales @ cost ÷ Average 12-month Parts inventory (booked at cost)
Q. Why does turnover calculation use parts sales at cost, rather than at retail?
Q. What does “Average 12 months” mean? Why is it used, rather than the current inventory?
Active Parts Turnover:
Another way to measure parts turnover is “Active Parts Turnover,” calculated as:
The formula: Parts sales @ cost ÷ (Average 12 Month Parts inventory – Inactive* inventory)
Inactive parts are those that have had no sales demand in 18 to 36 months. Do not include, “if Dairy goes down if part is not available”, types of parts in that inactive parts list if you still have the equipment in your territory.
© Copyright 2023, Machinery Advisors Consortium. All Rights Reserved Page 50
Workbook & Learning Guide Service & Parts Manager Level 100
Q. For any dealership, which turnover calculation would yield a lower number of Turns (total parts turnover or active parts turnover)?
Q. What would you conclude if your dealership’s total parts turnover is significantly different from your active parts turnover?
True Parts Turnover:
A newer way to measure parts turnover is “True Parts Turnover,” calculated as:
The formula: (Parts sales @ cost x Stock order ratio) ÷ Average 12-month Parts inventory
Q. Why does this measure add the step "x Stock order ratio"?
Q. Which type of turnover measurement would you recommend? Why?
Exercise 12: Parts Turnover (my dealership):
Using your dealership numbers, calculate your dealership’s parts turnover:
1) Calculate total (raw) parts turnover:
Parts cost of goods sold ÷ Average 12-month parts inventory.
2) Calculate active parts turnover: Active inventory = Average 12-month parts inventory – inactive parts
Parts cost of goods sold ÷ active inventory.
3) Calculate true parts turnover: (Parts cost of goods sold x stock order ratio) ÷ Average 12-month parts inventory
Fill rates & Lost Sales: Inventory Replenishment and More:
In anticipation of digging deeply into Level 200, it is important to become familiar with Fill Rates and Lost Sales. The key to improving fill rates may or may not be an increase in inventory. Fill rates can be improved by tracking and managing lost sales. Lost sales should be added to actual sales to calculate the number of “hits” that determine whether a part is stocked.
Workbook & Learning Guide Service & Parts Manager Level 100
Page 51
© Copyright 2023, Machinery Advisors Consortium. All Rights Reserved
Lost sales:
How does your DMS track lost sales? ________________________________________
Does tracking them affect any other performance indicators?
Repair Parts stocking considerations
Capital Equipment Marketing Strategy
Number and types of parlors being supported.
Influenced by on Hits given a certain period of time.
The time it takes to order and receive the part order cycles and safety stock.
The quantity used in the repair.
Related items used in the repair.
Repair Life Cycle
Does the failure shut the operation down?
Consumables stocking Considerations
Based on Herd Management Techniques
Delivery cycles
The time it takes to order and receive product order cycles and safety stock.
Risk of running out if delivery cycles are pulled ahead (1 or 2) weeks.
Potential to be an impulse item.
Potential new procedure leading-edge products
Value-added products that can be delivered faster and more conveniently than buying groups and direct-ship companies
Liners and Tubes
Recondition versus Replacement
The number of Milking cycles to change out.
The time it takes to order and receive the product—order cycles and safety stock.
The time it takes to recondition components.
Potential transition products
Value-added services that can be delivered faster and more conveniently than buying groups and direct ship companies.
Other
Is synergistic to any part of the dairy/farming operation?
Is it an impulse item?
Time it takes to order and receive product—order cycles and safety stock
Is it a non-competitive entry into the operation type of product?
Potential transition products
Value added product or service that cannot be delivered by a buying group and/or direct-ship company
© Copyright 2023, Machinery Advisors Consortium. All Rights Reserved Page
Workbook & Learning Guide Service & Parts Manager Level 100
52
Parts KPI #9] Sales per Employee Parts department Productivity Reference found on page 48
A profitable department must generate enough margin to pay its own expenses, and contribute to the total dealership. The only way to generate margin is to generate sales, and a common way to evaluate sales is to measure sales per department employee.
Parts sales per employee:
When calculating parts sales per employee, we must include all employees in the parts department. If an employee is shared by two departments, each department typically counts the person as 1/2.
The formula is simple: Departmental annual sales ÷ total departmental employees.
Consumables, Other, Liners and Tubes = $1,000,000
Repair Parts, = $ 1,000,000
Exercise 13: Parts Sales per Employee (my dealership):
Using your dealership numbers, calculate your dealership’s parts sales per employee:
1) Divide repair parts sales by total parts department employees. Do the same for consumables.
2) Enter this number on Dealer Plan
© Copyright 2023, Machinery Advisors Consortium. All Rights Reserved
Workbook & Learning Guide Service & Parts Manager Level 100
Page 53
Case Study—to be handed out
Calculate the following KPIs for the Repair Parts, Service and Consumables Departments
I. Sales Contribution for all departments (5 Calculations)
II. COGS % for Service, Repair Parts, and Consumables
III. Gross Margin % for Parts, Service, Consumables,
IV. Return on sales for all departments including the total dealership (6 Calculations)
V. Expense Ratios for Parts, Service and Consumables only (4 Calculations for each Department)
VI. Absorption for total dealership, plus by Service, Repair Parts, Consumables, and Other Equipment (5 Calculations)
VII. Repair Parts Sales to Service Sales Ratio
VIII. Recovery-Productivity of Service
IX. Efficiency of Service of Service Techs
X. Application of the Techs’ Time
© Copyright 2023, Machinery Advisors Consortium. All Rights Reserved
Workbook & Learning Guide Service & Parts Manager Level 100
Page 54
Initial Targted KPIs
Workbook & Learning Guide Service & Parts Manager Level 100 © Copyright 2023, Machinery Advisors Consortium. All Rights Reserved Page 55
DeLaval KPI Targets as a % of Sales Capital Service Repair Parts Consumables Other Sales Contribution 16.0%20.0%25.0%38.0%1.0% Gross Margin 20.0%55.0%45.0%30.0%30.0% Expense Ratios Personnel 12.5%19.5%7.0%15.0%10.0% Operating 4.0%10.0%8.0%8.0%8.0% Occupancy 0.5%0.5%5.0%2.0%4.0% Total Expense Ratio 17.0%30.0%20.0%25.0%22.0% Return on Sales 3.0%25.0%25.0%5.0%8.0% Assumes 50 Hours/week Parts Sales per Parts Person Other Initial KPI Targets Consumables 1,000,000 $ Productivity/Recovery 85% Repair Parts 1,000,000 $ Efficiency 94-100% Parts Turns Wage Multiplier 2.8 to 3.0 Consumables 8 times Parts Sales to Service Sales ratio $1.50 to $1.00 Repair Parts 2 times Expense Absorption 130% to 140% Tube & Liners 4 Times Capital Sale Completion absorption 110% Other Parts 3 Times
C) PROCESSES
Processes are the key to how to get things done in the Service or Parts Department. The Processes affect the Objectives of:
• Increased Sales
• Optimal Productivity, and
• High Quality which will achieve the goals of “Repeat Customers” and “High Return on Assets”
© Copyright 2023, Machinery Advisors Consortium. All Rights Reserved Page
Workbook & Learning Guide Service & Parts Manager Level 100
56
6. Service Processes
Processes – The 3 W’s – affect most of the other parts of a Balanced Service Department
a. Work Order Management & Scheduling
b. Work in Process (WIP)
c. Warranty Administration and Recovery
Discuss as a Class and/or in Groups.
© Copyright 2023, Machinery Advisors Consortium. All Rights Reserved
Workbook & Learning Guide Service & Parts Manager Level 100
57
Page
Workbook & Learning Guide Service & Parts Manager Level 100 © Copyright 2023, Machinery Advisors Consortium. All Rights Reserved Page 58 List Your Current Service Scheduling and Work Order Processes. What are some of the barriers and challenges that you face?
Work Order Management
Four Function Processes
1) Service Scheduling Management; Work Order (WO) Management; Confirm estimated hours versus actual hours; close WOs within next business day and Customer Communication/Satisfaction/Collection
2) Problem Diagnosing/Estimates/ Segmentation (Compliant, Cause, Correction); Do inspections; and Testing/Confirming Repair
3) Co-Diagnosing and Segmenting (Parts); Parts Search/Availability/Procurement; Deliver parts to Techs if Techs don’t already have the parts; Co-Diagnose with Tech any unexpected cause finding; Handle core, warranty processes, and administration; Add or take parts off WO by segment—real time; Inventory parts on service trucks and reconcile daily; Continued WO status reporting to Service Writer and/or Service Management
4) Service Writing/WO Management; Take initial service call; Confirming time punches and work descriptions real-time, splitting out Warranty WOs and setting up structure to match SRT Codes and Times; Assist in closing WO within next business day after the testing is completed.
Diagnostics Estimate and Work Order Format
Developing SRT Times for Repairs Segment Work Orders
1) Travel
2) Diagnoses or Confirm diagnoses
3) Total inspection of the unit
4) Customer Communication
5) Equipment clean-up
6) Disassemble Equipment
7) Repair complaint
(If more than one complaint or issue, there should be a separate disassemble, repair, and reassemble segment for each complaint)
8) Reassemble Equipment
9) Test
10) Final clean-up Includes Tools, and final notes 11) Travel
© Copyright
Workbook & Learning Guide Service & Parts Manager Level 100
Page 59
2023, Machinery Advisors Consortium. All Rights Reserved
Parts Processes
Workbook & Learning Guide Service & Parts Manager Level 100 © Copyright 2023, Machinery Advisors Consortium. All Rights Reserved Page 60
Workbook & Learning Guide Service & Parts Manager Level 100 © Copyright 2023, Machinery Advisors Consortium. All Rights Reserved Page 61
List The Parts ordering processes and stalking criteria that you currently use.
There are 6 components to the Parts pyramid:
The first 3 Components of the Parts pyramid are targeted at: 1] High Quality, 2] Increased Sales, and 3] Improved Productivity
1. Quality
a. Have the part or ordering it right the first time.
b. The quality of the customer experience in dealing with the Parts Department.
i. How well do we communicate: internal & external?
c. Quality of the product and/or the service received?
2. Sales
a. Number of ordering parts from stock or non-stock orders?
i. Are we using our ordering process in the right manner OEM?
b. This is directly affected by your level of service and your customer retention. The true measure of customer satisfaction is whether the customer comes back.
i. Have we used our DBS basic reports in the right manner?
ii. How is our Gross Margin and Turns?
iii. Willing to pay for the value your OEM or your service provides.
c. Sales to customers and the Service team
i. Understanding needs
ii. Offering options
iii. Providing expertise that ship-direct companies or buying groups can’t provide.
d. Pricing-Value
i. There are three formulas that we must always keep in mind when dealing with the pricing of our parts which are:
1. The value must be greater than or at least equal to the price the customer has to pay;
2. The ratio between supply and demand.
3. Long term Sales stream versus one-time sale
Workbook & Learning Guide Service & Parts Manager Level 100
62
© Copyright 2023, Machinery Advisors Consortium. All Rights Reserved Page
3. Productivity
a. Parts people:
i. Number of people versus the number of technicians.
ii. Number of delivery trucks.
iii. Number of parts people versus the number of orders of any kind
b. Efficiency:
i. Are we able to keep our people busy? Is it interfering with the quality of work or performance? Are we giving the right part the right demand?
The second three (4, 5, 6) are targeted at how to achieve the Objectives.
4. People
a. Recruiting and Hiring
b. Training and developing
c. Performance versus objectives
d. Leadership
5. Parameters – knowing the targets.
a. Inventory and Order – Retail Inventory Management
b. Links to Service / Feeding the Techs
c. Sales, Productivity and Quality targets
d. Profitability, including absorption.
e. Assets & Cash Flow
6. Processes – How People get things done and meet the Objectives
a. Inventory and Ordering
b. Margin and Expense Control
c. Customer/Service Relations
© Copyright 2023, Machinery Advisors Consortium. All Rights Reserved
Workbook & Learning Guide Service & Parts Manager Level 100
Page 63
8. The Customer Satisfaction Process
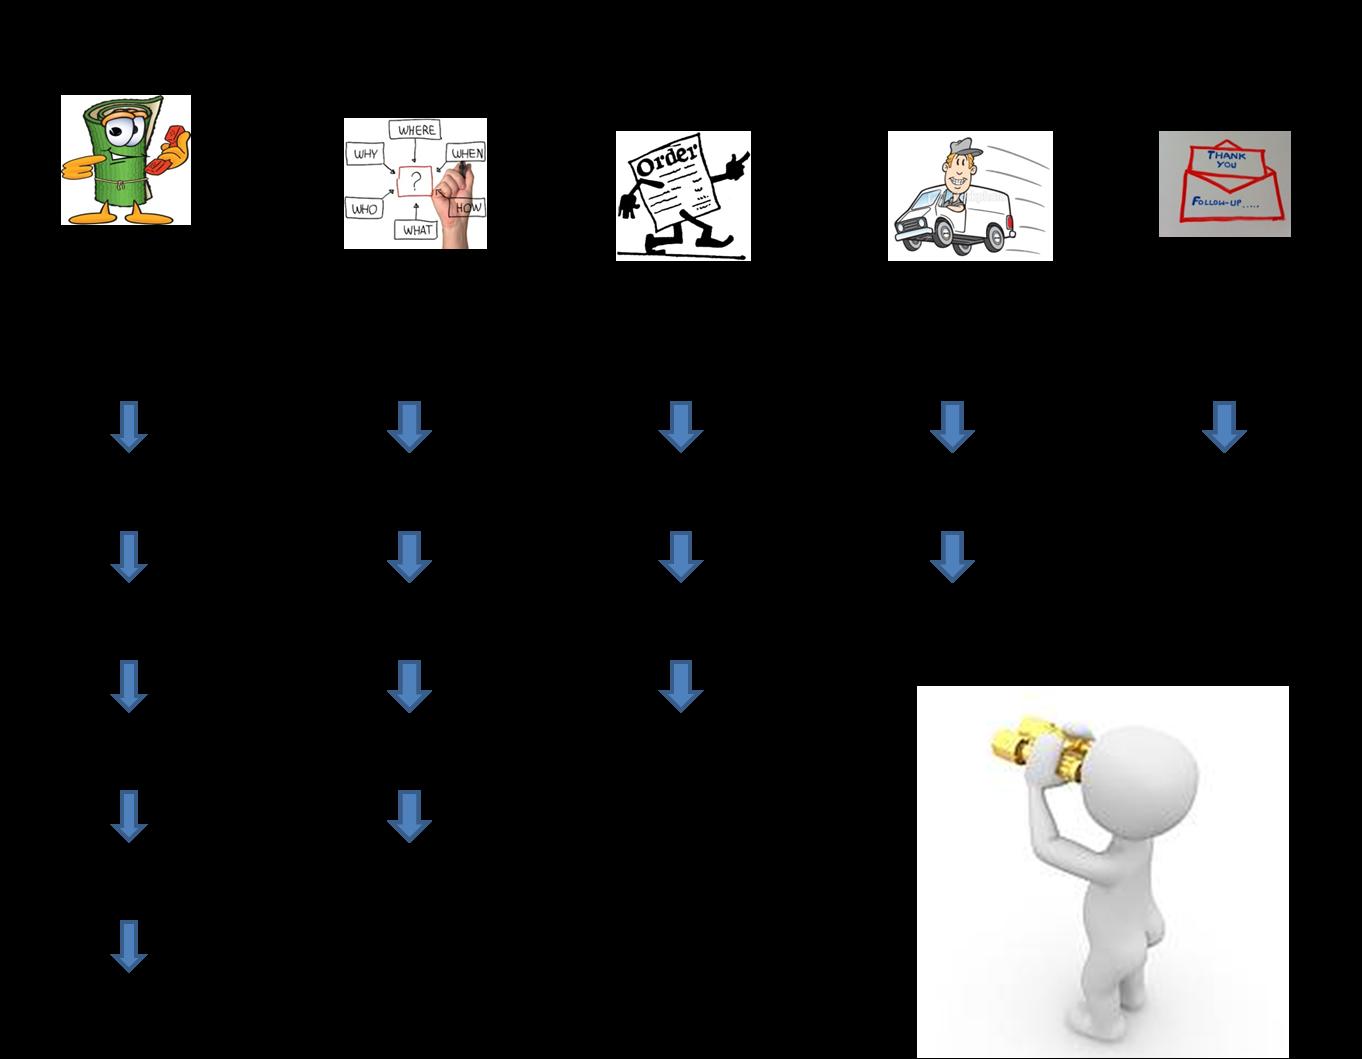
Let’s take a look at SERVICE & PARTS CUSTOMER SATISFACTION PROCESS!
Customer Satisfaction: A key Dealership KPI is Customer Satisfaction, which most generally is determined by a survey of customers – a so-called CSI (Customer Satisfaction Index). However, Customer onsite visits and DMS data mining looking at customer retention can also assist and may give faster feedback.
© Copyright 2023, Machinery Advisors Consortium. All Rights Reserved
Workbook & Learning Guide Service & Parts Manager Level 100
64
Page
8.1: Define moments of truth
Definition: Every time a customer comes in contact with any aspect of the Dealership Team (Capital, Service, Repair Parts, Consumables, etc.) organization and forms a perception of the quality of the services provided is: A MOMENT OF TRUTH!
Service and Parts manager should involve their employees because:
They are the ones closest to the problem.
They are the ones closest to the solution.
8.2: Service satisfaction survey results
An American firm recently performed a survey to measure how customers feel about the service treatment they receive. This research had for objective to gather information on the performance of Service & Parts personnel. The following is a summary of the main concerns revealed by this survey.
SERVICE & PARTS PERSONNEL:
Arrogant attitude!
Act like they doing you a favor!
They project an image of indifference toward the customer. In the same survey, done by the firm, there was an objective to gather information on Customer Retention following the warranty period. Here are the conclusions.
Warranty forces the customer to the dealer.
Once exposed, customer satisfaction levels decline and they want out of the dealership after the warranty period, no matter if the cause of the problem was major or small. They would try to go anywhere else before they would go back to the dealership!
Customers have no trust in a dealership where they don’t understand the price and the value!
In conclusion, we are falling in a deep hole, customer retention is the battle of our future, and this training will help you in changing the customer perception and get us closer to world-class performance.
© Copyright 2023, Machinery Advisors Consortium. All Rights Reserved Page 65
Workbook & Learning Guide Service & Parts Manager Level 100
Workbook & Learning Guide Service & Parts Manager Level 100 © Copyright 2023, Machinery Advisors Consortium. All Rights Reserved Page 66 D) Personnel – Employee Development People also includes • Potential • Attitude • Knowledge • Training
9.Basic Coaching
9.1: Definition of coaching:
Coaching is a workplace training technique introduced in the United States in the early 1940s. During the Second World War, the need for qualified workers led war industries to develop a training program that could be applied in-house. The aim of the program was to enable supervisors to quickly train a large number of people with no experience. One of the techniques devised for the program was meant to help supervisors convey their knowledge and become “teachers”. That technique ultimately gave rise to coaching.
Coaching consists in establishing a relationship of trust between a supervisor and an employee so that the employee can:
Acquire knowledge.
Develop skills.
Change work habits.
You must help your employees find solutions to problems and meet the established performance objectives. Employee coaching is based on the principle that a boss is responsible for the success or failure of his employees. If employees are ineffective in their work, you will be directly affected because you will not be able to meet the objectives you or your boss, have set for you. It is up to you to take whatever measures are needed to help your staff succeed.
9.2: Communication Styles: Introvert and extroverts
Identify whether you team members are Extroverts or Introverts
© Copyright 2023, Machinery Advisors Consortium. All Rights Reserved
Workbook & Learning Guide Service & Parts Manager Level 100
67
Page
EXERCISE 14:
Objectives:
A GOOD COACH IS...
Define different terms that describe the many roles of a good coach.
Describe situations when you need to take on one of these roles.
Think about your perception of the role of a coach.
Instructions:
Review the list of words used to describe a good coach that appears on the page. Add any word that you think describes a good coach, a good coach’s qualities, methods, etc.
Define each term in your own words and give an example of a situation where you need to take on that role while being a coach.
Identify in your own life, someone that was an effective coach to you, and what you found to be most effective
© Copyright 2023, Machinery Advisors Consortium. All Rights Reserved
Workbook & Learning Guide Service & Parts Manager Level 100
Page 68
A GOOD COACH
a leader a teacher a decision-maker a motivator a guide a mentor a trainer
IS...
Key Coaching areas I need to do with Team Members. How will I start?
Workbook & Learning Guide Service & Parts Manager Level 100 © Copyright 2023, Machinery Advisors Consortium. All Rights Reserved Page 69
10.Leading and Managing
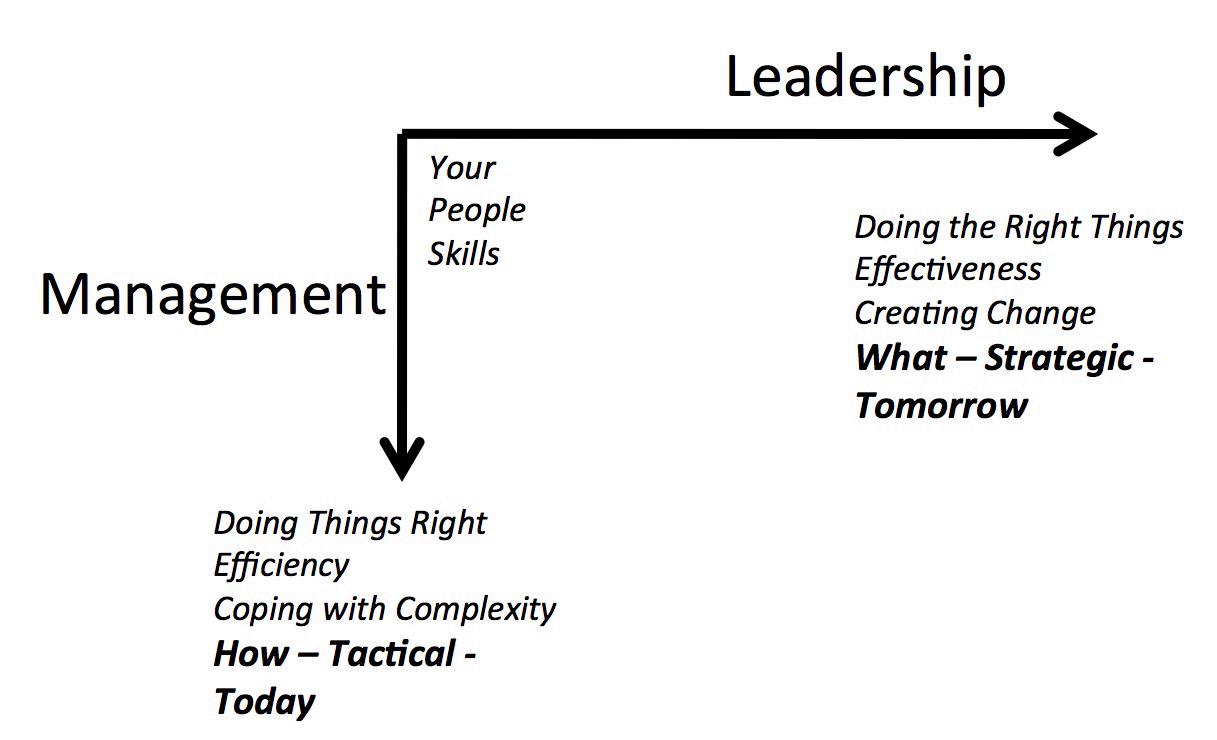
Workbook & Learning Guide Service & Parts Manager Level 100 © Copyright 2023, Machinery Advisors Consortium. All Rights Reserved Page 70
11.Dealership and Personal Action Plans
You will have to do your own analysis of your KPIs regarding benchmarks that we provided to you using your financial data. Be familiar with this data, and define what your department needs to do to meet or exceed the benchmarks. Bring back your results for the 200-level Parts or Service Manager Courses.
You will have to do your own department analysis. Compare what you are doing versus the KPIs benchmarks! Bring back your results for the 200-level Parts or Service Manager Courses.
© Copyright 2023, Machinery Advisors Consortium. All Rights Reserved Page
Workbook & Learning Guide Service & Parts Manager Level 100
71
Your Action Plans
Workbook & Learning Guide Service & Parts Manager Level 100 © Copyright 2023, Machinery Advisors Consortium. All Rights Reserved Page 72
S)pecific M)easure A)ctions R)esponsible T)iming
For your Department For your Employees – their Individual Coaching Plans For you – Your development Plan before Level 200 Training
Workbook & Learning Guide Service & Parts Manager Level 100 © Copyright 2023, Machinery Advisors Consortium. All Rights Reserved Page 73 Notes
