
11 minute read
Alona Nad, Lukas Rybok, Thomas Kowoll, Jan Bachmann, Ted Nuorivaara: Applying new

from Materia 4/2022

Applying new instrumentation at GTK Mintec. Part 1: Inline elemental analysis for process control
ALOITUSKUVA Mini-pilot operation during the test campaign with the inline elemental analysis
KUVA ALONA NAD

Figure 1. The structure of GTK Mintec
GTK Mintec in brief
GTK Mintec is comprised of a mineral processing pilot plant as well as of process mineralogy and bench-scale processing laboratories for minerals, ores, geomaterials, and circular economy materials, as illustrated in Figure 1. It belongs to the Circular Economy Solutions unit, which is the largest unit within Geological Survey of Finland. Its main purpose is to develop innovations for mineral grinding and beneficiation processes and to provide research services for different industries. The research unit is positioned between small laboratory scale and mini-pilot scale studies and large industrial performance. Every year, it is possible to run up to 10 different pilot plant -scale projects and it should be pointed out, that for each test run, a specific process flow sheet needs to be designed. The pilot plant is fully customizable and can be operated 24/7 with a maximum crushing capacity of 40 tons/ hour, and a flotation capacity of 5 tons/hour.
To obtain the necessary information for a pilot plant test, a laboratory examination phase is typically carried out. After the benchscale testing, the viability of the methods used in a beneficiation process can be further assessed with mini-pilot or pilot-scale tests. The feeding capacity of a mini-pilot run is usually 10–50 kg/h with a total sample size of 400–2000 kg.
For a typical pilot plant test operation, the required sample amounts between 50 and 500 tons while the throughput of the flotation process is approximately 0,2–5 tons/ hour. The pilot plant allows for flexible testing of an entire process or optimizing a specific part of it. GTK Mintec pilot plant services include multiple unit operations that can be readily combined into a functional full-scale process suitable for the customer’s needs [1].
The technology used in mineral processing is now evolving and modern technologies have become available which have the capacity to revolutionize the ways by which the mineral processing plants are designed and operated. On one hand, it causes challenges in adapting off-the-shelf digital solutions, which are focused mostly on industrial-scale sites where the processing circuit does not dramatically change over time in contrast to a constantly varying pilot plant. On the other hand, it provides plenty of opportunities to test the existing and develop new solutions for the digitalization of mineral processing plants [2].
Inline elemental analysis for process control
The goal of process control in mineral processing is to optimize the recovery of valuable minerals while maintaining the quality of the concentrates delivered to the following beneficiation steps [3]. However, conventionally the effect of adjusted process parameters can only be measured indirectly by means of constant monitoring of the concentrate composition, which is usually done by batch laboratory analysis of the process stream samples. Despite the high accuracy of the lab equipment, this approach has many drawbacks, such as high costs, long waiting time between sampling and receiving the results, along with a high probability of sampling errors which can greatly deteriorate the analysis results.
Thus, an increasingly common alternative to such laboratory analysis are inline and online elemental analyzers [4]. They have the advantage of offering immediate measurements and allowing continuous 24/7 material monitoring. Furthermore, if properly installed, they are capable of providing comparable results to lab analysis of periodically drawn samples [5]. These devices are typically based on (but not limited to) the X-ray fluorescence (XRF) principle [6], and Prompt Gamma Neutron Activation Analysis (PGNAA). The commercially available XRF-based devices for inline and online elemental analysis in slurries include the likes of Boxray [7], Courier [8], FLORIDA [9], and PERI [10], while AllScan [11], Gs Omni [12], and the X1-XP analyzer [13] are representatives of PGNAA based systems. Other technologies employed in elemental analysis of slurries are laser-induced breakdown spectroscopy (LIBS), as in the SlurryView analyzer [14], as well as combinations of several of the measurement principles mentioned above, oftentime together with other technologies, such as near-infrared (NIR) spectroscopy [15, 16].
In this study, the FLORIDA XRF analyzer for liquids and slurries was used [9]. The analyzer is developed by J&C Bachmann GmbH and adapts the industryproven XRF analysis used in chemical laboratories for plant conditions. As shown in Figure 2, the device consists of a control cabinet housing the power supplies and computing hardware, a sensor-head containing an X-ray tube, a silicon drift detector (SDD), and a cooling system. Attached to the sensor-head is a spool piece with a measuring window, which allows the sensor to be installed directly on a process pipe. For setup and full data access, the FLORIDA XRF system includes a web-based user interface. It provides current and previous measurement data as well as current and older spectra. The spectra and measured concentrations can also be exported for further analysis which is especially beneficial for research or pilot testing purposes. The data can then be used to train AI models for process control or multi-sensor fusion. For process integration, the real-time concentrations are
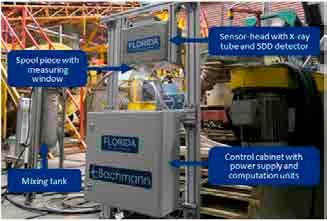
Figure 2. FLORIDA XRF analyzer during the test campaign at GTK Mintec plant.
provided via a Modbus/TCP standardized interface [17].
Test campaign
The goal of the measurement campaign was twofold: to highlight the stability of XRF-based inline elemental analysis in an in-situ application, and to empirically demonstrate the errors introduced by material sampling for process control [5]. A mini-pilot scale mineral process test was carried out at the Geological Survey of Finland (GTK) Circular Economy Solutions unit, GTK Mintec, for a copper-nickel ore. In the test work, approximately 1650 kg of copper and nickel containing ore was processed in a mini-pilot scale beneficiation circuit which consisted of grinding and flotation circuits. During the 4 days long campaign, the process was operated for approximately 27 hours and 30 minutes in total, and 21 test points were sampled at regular time intervals.
As illustrated in Figure 3, the mini-pilot process consisted of a grinding circuit with a rod mill, a ball mill, and a Sweco-sieve with a #150µm screen mesh, followed by a flotation circuit. The flotation circuit consisted of two conditioners and rougher copper flotation. Two cells, each of 50 liters, flotation machine OK-0.05 and ? were used for roughing copper flotation. In this study, the copper rougher concentrate was mixed in the mixing tank and pumped through a pipe segment installed in the FLORIDA XRF device in order to obtain an XRF spectrum of the copper concentrate slurry every 60 seconds (see Figure 2). Simultaneously, the outflow of the device had been sampled for laboratory analysis of the copper concentrate slurry chemical composition.
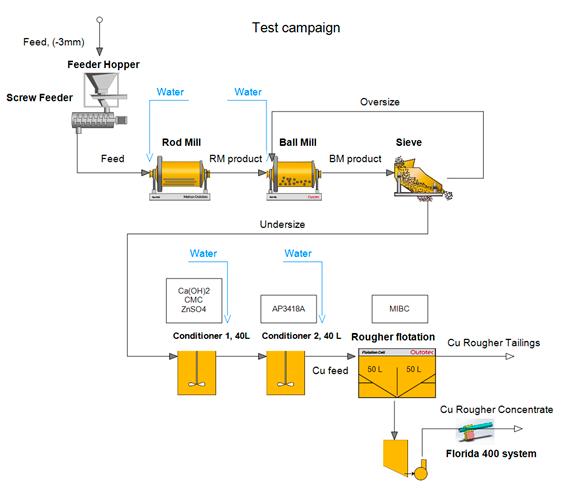
Figure 3. Flowsheet of the mini-pilot process
The spectra corresponding to the sampling times were then used to construct all the calibration curves.
Throughout the experiments, the evaluation metric, the mean absolute error (MAE) and the mean absolute percentage error (MAPE) were reported. In this context, the MAE is a measure of errors between the elemental concentration reported by a chemical laboratory analysis and the FLORIDA XRF.
Test results
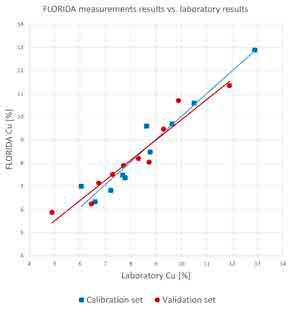
Following the principles of proper validation (PPV) [18], two sample sets were collected: a training (i.e., calibration) set, and a test (i.e., validation) set. The calibration set spectra were used to learn the calibration model, which in turn was used to construct the calibration curve depicted in Figure 4. This calibration model was then applied to the samples in the validation set to determine its validity.
The overall accuracy of the analyzer is in line with previous laboratory experiments [5], with a MAPE of 5% on the calibration set and 6% on the validation data.
In the final experiment, a longer-term measurement with FLORIDA XRF to qualitatively demonstrate its capability was con-
Figure 4. Cu calibration and validation curves obtained with a training, and a separate test data set of the measurements of ore slurries at GTK Mintec (for calibration mode: MAPE = 5%, MAE = 0.36%; for validation mode: MAPE = 6%, MAE = 0.43%)
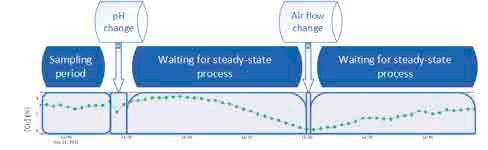
Figure 5. Evolution of the measured Cu concentration in a copper concentrate slurry over the course of an hour
ducted. To this end, the previously described calibration model was applied to the spectra obtained from the copper concentrate slurry to measure the copper concentration within the slurry and plotted the evolution of the Cu concentration over the course of one hour, during which parameter changes of the flotation process were performed. This plot is presented in Figure 5, where the impact of the parameter changes on the Cu concentration can be clearly observed. This further underlines the viability of inline elemental monitoring as an alternative to the error-prone and time-consuming laboratory analysis of samples regularly taken from the product stream.
Discussion
The tests conducted at GTK Mintec have highlighted the two main features of using inline elemental analysis for process control in a mineral processing plant: the high performance of the system which is comparable to a batch laboratory analysis of the process stream samples and the high temporal resolution of the analyzer’s measurement data which allows for much faster process control and, therefore, increases yields of a beneficiation plant.
At first, the performance of the measurement system was tested to understand the accuracy and variability of the results to be used for a direct process control in the beneficiation plant. The result quality from the FLORIDA XRF system was shown to be comparable to the results gathered by sam-
pling for laboratory analysis while also being able to receive the results within 1 minute of the analysis of the sample. Thus, the tool was especially useful during the test campaigns, but not limited to it.
During the test, the high rate of process information was evaluated and the data quality was confirmed. At this stage, the data was, however, not yet utilized as a tool for real-time process control.
The next step to use the continuous (24/7) elemental process information is to do a fast adjustment of the process to adapt to the variations in the feed material and other parameters. This approach, i.e., the adjustment of the process based on the current feed quality, is expected to maximize the yield despite both feed and process variability.
Such quick information will decrease the pressure on the lab turnaround time for process control and instead allow the lab to primarily provide highly specialized, and detailed chemical analyses to do long-term adjustments to the process, such as to adjust for slowly changing mineralogy.
GTK Mintec’s continuously developing research infrastructure enables close co-operation with modern technologies and measuring equipment manufacturers. Innovative solutions, state-of-the-art technologies, as well as separate equipment on different scales could be tested in our research facilities in Outokumpu.
If you are interested in hearing more about these developments at GTK Mintec contact Alona Nad, e-mail: alona.nad@ gtk.fi.
AUTHORS: ALONA NAD, LUKAS RYBOK,
THOMAS KOWOLL, JAN BACHMANN, TED NUORIVAARA
References

1. https://www.gtk.fi. Available online: https:// www.gtk.fi/en/research-infrastructure/outokumpu-mineral-processing-pilot-plant-and-laboratories/ (Accessed on 23 August 2022). 2. Nad, A.; Jooshaki, M.; Tuominen, E.; Michaux,
S.; Kirpala, A.; Newcomb, J. Digitalization
Solutions in the Mineral Processing Industry:
The Case of GTK Mintec, Finland. Minerals 2022, 12, 210. https://doi.org/10.3390/ min12020210 3. Hodouin, D.; Jämsä-Jounela, S.-L.; Carvalho,
M. T.; Bergh, L. State of the art and challenges in mineral processing control, Control Engineering Practice 2001, 9(9), pp. 995-1005. https://doi.org/10.1016/S09670661(01)00088-0. 4. Oosthuizen, D. J.; Craig, I. K.; Jämsä-Jounela,
S.-L.; Sun, B. On the current state of flotation modelling for process control. IFAC-PapersOnLine 2017, 50(2), pp. 19-24. https://doi. org/10.1016/j.ifacol.2017.12.004 5. Rybok, L; Kowoll, T.; Thomas; A. Nad, A.;
Bachmann, C. Online elemental analysis for process control in the mineral processing industry. TOS Forum 2022, 11, pp. 131-137. https://doi.org/10.1255/tosf.142 6. Beckhoff. B.; Kanngießer N.; Langhoff N.;
Wedell R.; Wolff H. Handbook of practical
X-ray fluorescence analysis, 1st ed.; Springer Science & Business Media 2007. https:// doi.org/10.1007/978-3-540-36722-2. 7. Boxray Online Elemental Analysis. Available online: https://www.xore.se/xrf-analyzers-online-elemental-analysis/(Accessed on 30 August 2022). 8. Courier 5X/6X SL Analyzer. Available online: https://www.mogroup.com/portfolio/courier5x6x-sl-analyzer/ (Accessed on 30 August 2022). 9. FLORIDA Analyzer. Available online: https:// jcbachmann.com/products/florida/ (Accessed on 30 August 2022). 10. PERI Online Slurry Analysis System. Available online: https://www.flsmidth.com/en-gb/ products/peri-online-slurry-analysis-system (Accessed on 30 August 2022). 11. AllScan Slurry Analyzer. Available online: https://realtimeinstruments.com/products/ allscan/allscan-slurry-mineral-processing/ (Accessed on 30 August 2022). 12. GS Omni Analyzer. Available online: https:// www.thermofisher.com/order/catalog/product/GSOMNI (Accessed on 30 August 2022). 13. X1-XP Analyzer. Available online: https://sabiainc.com/on-pipe-slurry-x1-xp/ (Accessed on 30 August 2022). 14. SlurryView Analyzer. Available online: https:// www.lyncis.lt/online-slurry-analyzer/ (Accessed on 30 August 2022). 15. Khajehzadeh, N.; Haavisto, O.; Koresaar, L.
On-stream mineral identification of tailing slurries of an iron ore concentrator using data fusion of LIBS, reflectance spectroscopy and XRF measurement techniques. Minerals
Engineering 2017, 113, pp. 83-944. https:// doi.org/10.1016/j.mineng.2017.08.007 16. Wang, Q.; Li, F.; Jiang, X.; Wu, S.; Xu, M. Onstream mineral identification of tailing slurries of tungsten via NIR and XRF data fusion measurement techniques. Analytical Methods 2020, 12(25), pp. 3296-3307. https://doi. org/10.1039/D0AY00322K. 17. Modbus Organization. MODBUS Messaging on TCP/IP Implementation Guide: V1. 0b.
Modbus Organization, 2006. 18. Esbensen, K. H.; Geladi, P. Principles of proper validation: use and abuse of re-sampling for validation, Journal of Chemometrics 2010, 24(3–4), pp. 168-187. https://doi. org/10.1002/cem.1310.
Laatu Nopeus Luotettavuus
● kemialliset analyysit ● mineraloginen tutkimus ● materiaalien karakterisointi ● konsultointi +358 41 3131 646 info@xrayminerals.fi
www.xrayminerals.fi
X-ray Mineral Services Finland Oy a member of the Hafren Scientific Group of Companies


