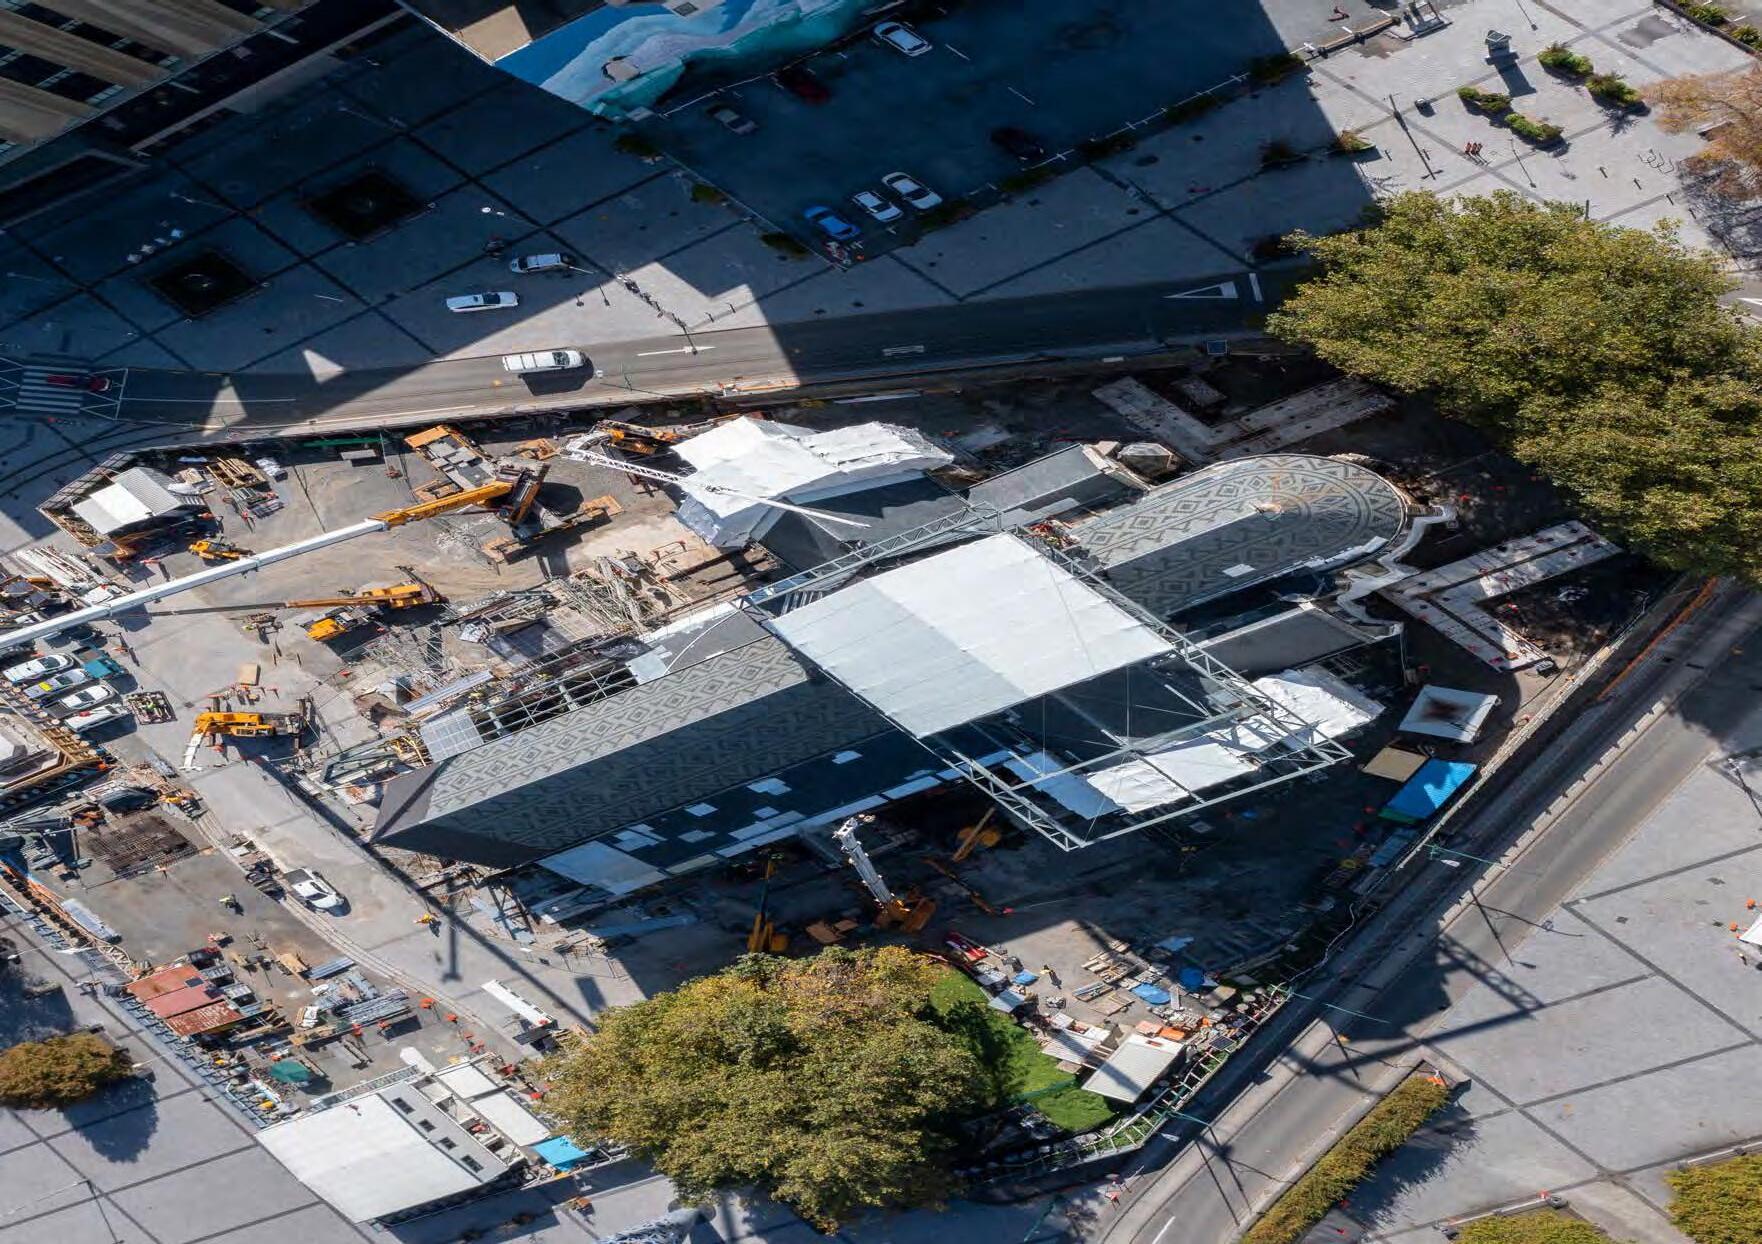


For more than 25 years, Mainmark have been developing and delivering noninvasive level correction and ground improvement solutions throughout Australasia, having successfully completed thousands of projects, from homes, critical infrastructure and civil engineering applications, through to large scale projects such as the re-levelling of the 33,000 tonne Christchurch Art Gallery. Mainmark won the International Project of the Year Award at the 2016 Ground Engineering Awards.
Mainmark’s ground improvement using engineered resin injection, is suitable for both liquefaction mitigation in seismically active areas and also for general bearing capacity enhancement under static conditions, beneath existing structures and greenfield applications Resin injection is proven to be effective, fast, clean, non-invasive and able to be applied with minimal business disruption to occupants
Mainmark’s Terefirm® resin injection Ground Improvement works primarily as a result of densification of the soil from an aggressively expanding polyurethane resin – although other secondary effects such as improvement in composite stiffness, cementation, and horizontal stress increases are also present
Typically, injection tubes are installed into the ground via small 12-20mm penetrations at regular intervals across the target area of treatment At each injection point material is injected into the target treatment zone to create the resin soil matrix The Area Replacement Ratio (ARR), target treatment zone, injection array, injection sequence and other project specific criteria are all designed to site specific conditions. Actual injection methodology can consist of ‘top down’ or ‘bottom up’, static or continuous injection In a typical ‘bottom up’ installation, the tube is withdrawn either in set stages with set volumes of material injected at each stage, or it is withdrawn slowly on a continuous basis, with set volumes of material being injected per unit length that the tube is withdrawn All injection parameters are monitored, captured and recorded throughout the operation via automated wireless equipment
During injection of the treatment zone, the low viscosity resin both permeates the soil and also penetrates under pressure along planes of weakness within the soil profile. The material reacts after injection, rapidly expanding to many times it original volume . The expansion of the injected material results in compaction of the adjacent soils due to new material being introduced into a relatively constant soil volume


It should be noted that this process does not produce regular columns or ‘bulbs’ of material distributed down the vertical injection line . Instead it typically results in a ‘veining’ of expanded material distributed through the soil mass as dykes, sills or networks of sheets or plates; typically tens of millimetres thick
Resin injection has been used by Mainmark globally for the lifting or level correction of buildings for over 25 years Expanding resin mixes are injected into the ground at relatively shallow depths, resulting in ground heave and building lift
Mainmark’s resin injection was initially tested within the 2013 Science Trials undertaken by the NZ Government within the Christchurch ‘Red Zone’ . These trials showed an increase in liquefaction resistance via a number of measures The overall density of the soil increased, as measured by Cone Penetration Testing (CPT) tip resistance The composite stiffness of the improved soil block increased, as measured by shear wave velocity testing . The cyclic strains in the soils during shaking were decreased, as measured during T-Rex testing. Pore pressure response and liquefaction induced settlements were significantly reduced during the shaking and blasting trials .
The release of internationally peer- reviewed research has found that Resin Injection is a proven method for increasing soil density, foundation bearing capacity and mitigating liquefaction . Mainmark initiated a series of trials over a four-year period in Christchurch, New Zealand’s liquefactionaffected ‘Red Zone’, with partial funding from the Earthquake Commission (EQC) and the Ministry of Business, Innovation and Employment (MBIE) .
These field trials revealed that Mainmark’s ground improvement and liquefaction mitigation solution, Terefirm Resin Injection, demonstrably improves the density and stiffness of the ground and increases the resistance of the soils to liquefaction It is proven to be a viable and cost-effective solution for improving ground bearing capacity and is particularly suitable for application underneath existing structures to address ground vulnerability and liquefaction .

After the Canterbury Earthquake Sequence, a ground improvement programme was established to determine the viability of shallow ground improvement techniques beneath existing structures The programme was conducted with joint funding from MBIE and EQC This research attracted many national and international academics, who were involved in the delivery of the trials and/or peer reviewing the results .
The purpose of this programme was to determine the efficiency of several shallow ground improvement methods by undertaking full scale construction trials on residential properties in the red zone of Christchurch Each ground improvement technique was analysed with consideration to the practicality, cost and degree of improvement achieved .
The first part of the programme consisted of the science trials which tested a variety of techniques that reached improvement from various different mechanisms. Resin injection was analysed as a densification mechanism. The following technologies were included in the trials:
• Rapid impact compaction
• Geopier Rammed Aggregate PierTM System
• Driven timber piles
• Low mobility grout
• Resin injection
• Reinforced gravel raft
• Reinforced soil-cement raft
• Permeation grouting (construction trial only – method was unsuccessful and therefore not tested)
• Horizontal Soil Mixed (HSM) beams (experimental new method for existing houses) but has potential limitations and constraints
The science trials involved Terefirm Resin Injection into liquifiable soils at three sites in Christchurch . Kentledge concrete blocks were loaded on top of the site to provide a load similar to that of a two storey residential property
The effectiveness of the trials was determined through extensive before and after ground testing and earthquake simulations. The “earthquakes” were simulated through blast tests or the T-Rex machine .
The blast testing involved a series of explosive charges that were set up in the ground surrounding the trial area . The entire depth of the ground in the trial zone was instrumented . When these explosions were set off, they simulated an earthquake by sending waves through the treated ground. The T-Rex machine is a specially designed truck that simulates an earthquake by manually shaking the ground .
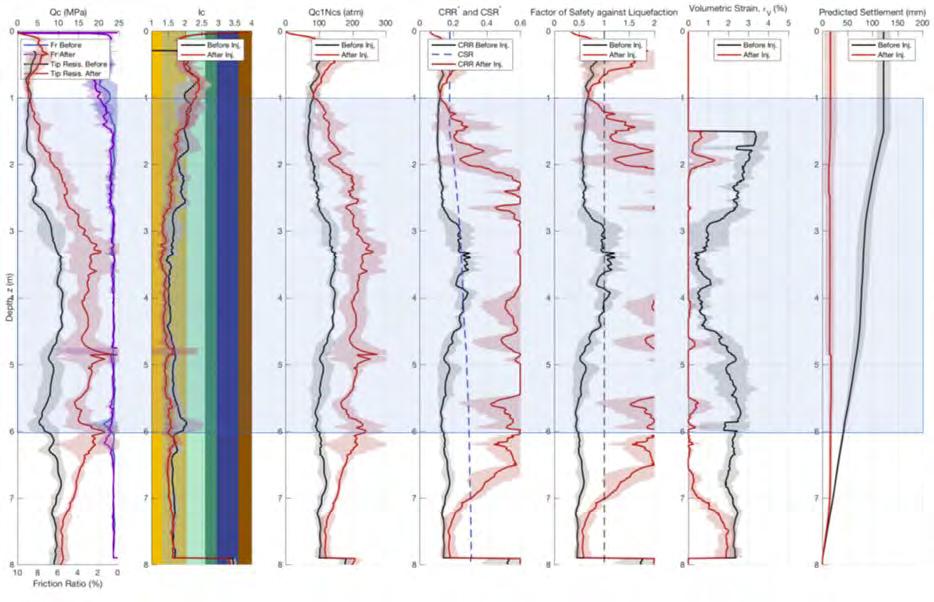
The results showed that Terefirm Resin Injection is highly effective in sandy soils of Ic < 2, as experienced in the red zone . The results from the trials seen in Figure 1 show that Resin Injection was the most effective technology to reduce differential settlement, and among the top 3 at reducing total settlement (although the top 2 in this category could not be applied beneath an existing structure) .

The results from the trials showed an average increase in qc1Ncs of 70% which resulted in a factor of safety against liquefaction > 1 .5 for the whole treatment depth, as shown in Figure 1 . The observed increase in soil density and strength validated that Terefirm can mitigate or reduce liquefaction-induced settlement.
The liquefaction triggering method used in this report is Boulanger and Idriss (2014). The preimprovement Ic was used in determining post-improvement qc1Ncs, CRR, FS, and settlement, as recommended by the aforementioned authors
The predicted vertical settlement for a range of PGA was also analysed, as seen in Figure 2 This shows there was a significant reduction in predicted settlement across a wide range of PGA values, including beyond the Christchurch 500-year return period design earthquake.

Further testing of Terefirm was also analysed by before and after ground investigations and blast testing in one of the trial areas several years later, in early 2020 The same methodology was used to compare the behaviour of untreated ground, nearby the trial zone . This testing concluded the level of improvement remained consistent over the 4 years following the treatment
Even though the trials were focused on liquefaction mitigation, they also concluded that Terefirm can be used for bearing capacity improvement . The research ultimately led to the inclusion of Resin Injection as a liquefaction mitigation solution in the MBIE Module 5: Ground Improvement of Soils Prone to Liquefaction document (Campbell Keepa, 2017)

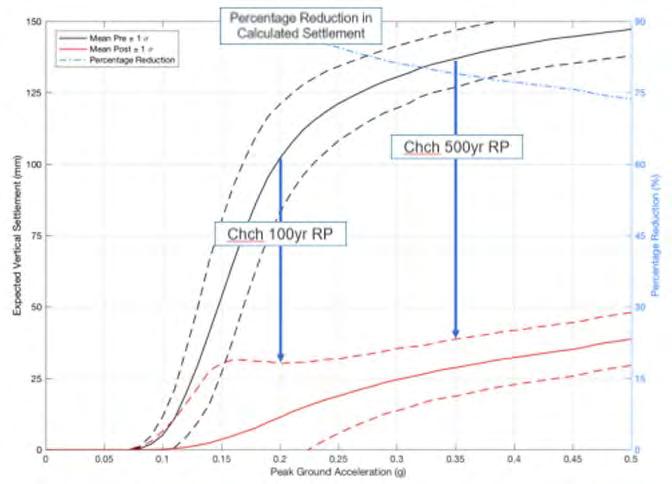 Figure 4. Timeline of milestone Terefirm projects


N.J. Traylen Geotech Consulting (NZ) Ltd, Christchurch.

R. Wentz Wentz-Pacific Ltd, Napier
S. van Ballegooy Tonkin & Taylor Ltd, Auckland.
T. Hnat Mainmark Ground Engineering Ltd, Christchurch.
L. M. Wotherspoon Dept of Civil and Env. Engineering, Univ of Auckland.
ABSTRACT: Of the few practical methods currently available for liquefaction mitigation beneath existing structures, injected expanding resin is showing promise. Following on from the successful commercial application of this method at a building refurbishment project in Christchurch in early 2016 (the subject of a companion paper at this conference), a controlled study has been carried out on the efficacy of this ground improvement technique. In the study, three test sites in Christchurch were selected for the construction of injected resin test panels. The test sites are within the Christchurch ‘Red Zone’ and are considered representative of some of the more liquefaction-prone soils in the city. The pre- and post-improvement soils at the trial sites were assessed using a variety of methods, primarily Cone Penetrometer Testing (CPT), Direct-push crosshole testing (shear wave and compression wave velocity), and dilatometer testing (DMT) to examine the effects of the injected materials on the density and stiffness of the soils, and therefore their likely liquefaction resistance. This paper presents some of the findings of that study.
Resin injection has long been used internationally for the lifting or ‘level correction’ of buildings. For this purpose, expanding resin mixes are injected into the ground at relatively shallow depths, resulting in ground heave and building lift. It is logical to expect that this resin injection and expansion process also results in compaction or densification of the ground (in a similar way to compaction grouting). As such, resin injection potentially has uses in liquefaction mitigation projects or other applications where ground densification is required.
The aim of this study was to examine whether resin injection is a viable form of ground improvement, primarily for liquefaction mitigation. This has been achieved through a series of trial injection panels, where pre-injection and post-injection soil density and stiffness have been compared via cone penetration testing (CPT), Direct-push cross-hole testing (Vs/Vp, Wotherspoon et. al. 2015) and dilatometer testing (DMT). The results of other relatively recent testing and commercial application of resin injection for liquefaction mitigation are also briefly discussed (the 2013 EQC Ground Improvement Trials, and a 2015/2016 commercial building upgrade project).
2017 NZSEE ConferenceResin injection provides liquefaction mitigation primarily as a result of densification of the soil from an aggressively expanding polyurethane resin product (although other secondary effects such as improvement in composite stiffness, cementation, and horizontal stress increases are also present).
With this method, injection tubes are driven into the ground at regular intervals, and at each injection point an injection port is attached to the injection tube. Multipart materials are mixed at specific pressures and temperatures at the nozzle, and the live composite material (‘resin’) is then pumped down to the base of the tube, where it enters the soil matrix. Either ‘top down’ or ‘bottom up’ methods can be employed. In a typical ‘bottom up’ installation the tube is withdrawn either in set stages with set volumes of material injected at each stage, or it is slowly withdrawn at a uniform rate, with set volumes of material being injected per unit length of withdrawal.
The low viscosity resin is injected at controlled pressures and penetrates the soil mass along pre-existing planes of weakness or through fracturing of the soil mass. The resin also permeates the soil mass to a limited extent depending on the porosity of the soil. The resin mix chemically reacts soon after injection (at controllable ‘rise’ times), rapidly expanding to many times its original volume and changing from a fluid form to a solid one. The expansion volume can be in the order of 5 – 15 times injected volume, or more if required, depending on soil density, confinement pressure, and the resin material selected. The looser the soil, the greater the expansion for a given resin mix. The expansion of the injected material results in compaction of the adjacent soils, due to new material being introduced into a relatively constant soil volume.
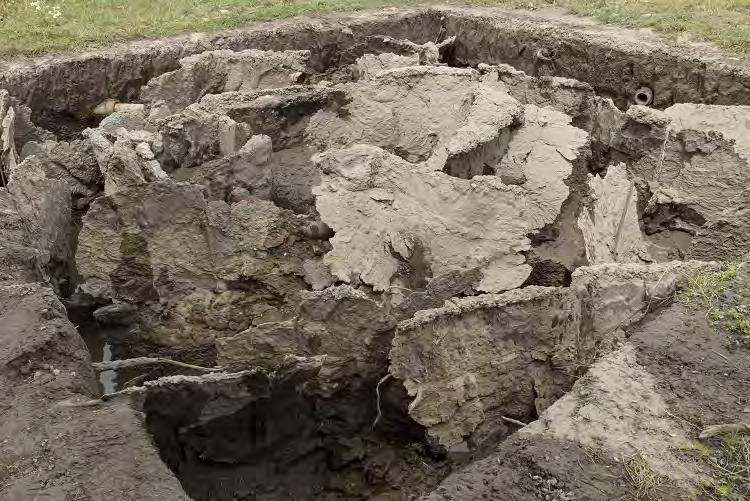
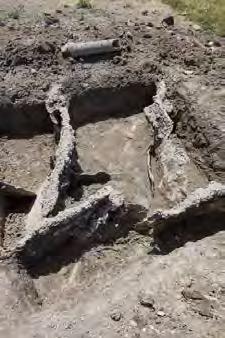
The resin injection process typically results in a ‘veining’ of material distributed through the soil mass as dykes, sills or networks of sheets or plates, typically tens of millimetres thick (refer to Figure 1).
Ground strengthening by resin injection has been previously used in Turkey (Erdemgil et al, 2007). Liquefaction mitigation by resin injection in New Zealand has been examined in some
detail on two recent occasions. A preliminary trial was carried out as part of the 2013 EQC Ground Improvement trials. Resin injection was also used on a 5400m2 commercial building rehabilitation project in 2015/2016. The method is currently being considered for several other commercial ground strengthening projects.
3.1 2013 EQC Ground Improvement Trials
A series of ground improvement trials were undertaken in Christchurch by EQC (in prep) in the latter half of 2013, to examine the performance of various forms of ground improvement for liquefaction mitigation. The trials included a preliminary examination of resin injection. The resin injection panel that was tested showed an increase in liquefaction resistance by a number of mechanisms: (i) the overall density of the soil increased, as measured by CPT tip resistance, (ii) shear wave velocity testing showed that the composite stiffness of the improved soil block increased, (iii) the cyclic strains in the soils during shaking were decreased, as measure during vibroseis T-Rex testing, and (iv)pore pressure response during shaking was significantly decreased. The result of these effects was that the ground surface settlements during blasting trials were also much reduced.
Three adjoining large format retail buildings that suffered liquefaction-related settlement damage in the 2010-2011 Canterbury Earthquake Sequence (up to 160mm differential settlement across the 90m by 60m combined building footprint) were relevelled, repaired, and upgraded in late 2015 and early 2016. The first stage of the remediation works consisted of liquefaction mitigation by densification and stiffening of the underlying shallower soils (treating variously to 4m or 7m depth) by Mainmark Ground Engineering Ltd, using their TeretekTM resin injection methodology.
Early results from test panels at this site are discussed in Traylen et al (2016), and the results from the production phase injection are discussed in a companion paper at this conference (Hnat et al., 2017). The production phase injections resulted in increases in qc1Ncs in the order of 40%, and decreases in calculated free-field settlements in the treated zones of 40-80% at 100 year return periods of shaking (M7.5, 0.2g).
The project demonstrated that resin injection is a technically viable technology for ground improvement, and is particularly useful for liquefaction mitigation or ground densification beneath existing structures. Furthermore, the low level of intrusion required to carry out the process was a particular benefit for this operation, as the three retail outlets (including a busy supermarket) were able to continue trading, virtually uninterrupted, through the busy Christmas trading period.
The 2013 EQC Ground Improvement Trials were carried out in eastern Christchurch in the abandoned ‘Red Zone’ of Avondale and Bexley. This land is some of the worst affected from the Canterbury earthquakes (due to liquefaction-induced damage). If a ground improvement method is successful in this land, then it is likely to be successful in most other liquefiable areas with comparable soil types. It was logical therefore to revisit those sites for the purposes of carrying out these new ground improvement trials.
The sites used were adjacent to some test areas used in the EQC trial process (see Figure 2) , but selected to avoid areas which had been affected by the installation of other ground im-
provement methods and instruments, and also to avoid areas directly affected by liquefaction-inducing blasting trials that were carried out in 2013. A summary of the sites that were used in this study are provided in Table 1.

3 – Breezes Rd, Avondale
4 – Ardrossan St, Avondale
Silty sands and some silts overlying clean sands at 3.5 - 4.5m
Silty sands and sandy silts overlying clean sands at 2.5m depth.
6 – Onepu St, Bexley A predominantly sandy site
2-5 MPa in the upper 3m; 11 MPa to 5m depth; 5 to 11 MPa to 8m depth.
1-4 MPa in the upper 3-4m; 10 - 12 MPa down to 7m; 4 to 10 MPa to 8m depth.
Increasing from 2-4 MPa at 1m depth to 10-12 MPa at 4m depth; 7-11 MPa to 5m depth; 10-14 MPa to 8m depth.
* measured Sept – Nov 2016 ** van Ballegooy et al (2014a)
5 TEST PANEL LAYOUTS AND TESTING REGIME
Each of the 8m x 8m test panels was set out with a 1.2m triangular grid of resin injection points (Figure 3). Prior to injection, in-situ tests were carried out to establish baseline conditions for the soils (see Table 2). The tests were CPT, direct-push crosshole (Vs/Vp), dilatometer (‘DMT’) and plate load tests (‘PLT’). Borehole drilling, and laboratory testing was also carried out to determine soils fines contents. Vs/Vp tests were performed across injection points and between injections points to characterise the composite properties of the soil and resin, and the properties of the soil between the improvements. Given the nature of the installation and the development of sheets the ‘between’ tests may also characterise some of the composite soil-resin properties. CPT and DMT were used to characterise the soil between injection points.

Plywood was laid over the ground (over a layer of compacted gravels) and then concrete blocks were laid to give a 14 kPa general surcharge load. Welded steel plate was placed over the blocks to give a relatively stable working platform. Additional blocks were then laid to superimpose a 28 kPa strip footing load. Pilot holes were drilled and cored through the steel plate, concrete blocks, and plywood to allow the installation of the grout tubes into the ground.
The surcharge loads were selected to model both a 2-level unreinforced masonry building (‘URM’), as well as a large format commercial building. In each case an assumed 10 kPa floor load was used. (Analysis demonstrated that the concrete blocks along with an additional 28 kPa ‘footing’ strip load created foundation / floor surcharge stresses generally in the midrange of those for the modelled buildings).
The ground was then treated with injected resin by first applying a ‘capping layer’ (to provide confinement to the material being injected into the improvement zone) and then injecting from 6m depth on a ‘bottom up’ basis with set volumes of resin injected at 0.5m intervals. After a period of at least 2 weeks (to allow any excess pore pressures to stabilise) the concrete blocks were removed, and post injection CPT, Vs/Vp, DMT and PLT testing was carried out. One of the spacing trial panels was also partially exhumed to expose the resin veins in the ground (see Figure 1).
For this project, there was no attempt made to control ground heave or to restrict angular distortions in the overlying blocks, as there was no adverse consequences from heave. Ground heave was therefore observed, averaging 40 to 70mm (std dev = 30mm) across the three sites. 70% of the lift was created during the injection of the capping layer in the upper 1 to 1.5m of the ground profile.
Ground heave would not typically be a concern where this technology is to be applied to cleared sites, as long as this does not loosen the soils targeted for treatment. (The 2013 EQC Ground Improvement Trials demonstrated that this was not an issue for resin injection, although it was an issue for shallow compaction grouting using LMG). Also, ground heave and general surface disturbance using resin injection is noticeably less than that for other technologies such as stone columns or driven piles. In cases where a building also requires level correction, some controlled ground heave can be beneficial. In other cases allowances will need to be made so that the building can accommodate some changes in final floor level. For heavy buildings, or on sites where the soils are only being treated below 2m depth, significant ground heave may not occur at all. For the commercial project discussed in Section 3.2, controlled lift was utilised in those areas of the building that also required level correction; in other parts of the building a cut-off criterion were used (2mm at individual injection locations and 10mm total over 6mx6m panels).

There is a clear trend of increased soil densities and stiffness at all sites, with the level of increase varying with soil characteristics. Improvements in the soils are noticeable up to a metre below the base of treatment. Table 3 provides a summary of results across all three sites. Table 3 Averaged Increases in parameters within the treatment zones
*Modulus of Subgrade Reaction
CPT qc increased on average 80 - 100%. This was an improvement of about 4 - 12 MPa (in the order of 5 MPa at Sites 3 and 4, and 10 MPa at Site 6). This corresponds to increases in relative density (Dr) in the order of 30%. Given these increases in CPT qc, static bearing capacities for shallow foundations have necessarily increased, and static settlements decreased at the subject sites (Schmertmann (1970, 1978)). Modulus of Subgrade Reaction (k) increased 50 to 90%.
Figure 5 provides a summary of qc1Ncs at each site before and after improvement. There is clear variability in the change in these values at each site through the different soil types, but on average there is a 65 - 75% increase - approximately 50 atm at Sites 3 and 4 and 100 atm at Site 6. Liquefaction consequences have therefore significantly decreased, as discussed in Section 6.2.

Shear wave velocities (Vs) increased on average 40%. This was in the order of 50 to 75 m/s at Sites 3 and 4, and 75 to 100 m/s at Site 6. This has resulted in an approximate doubling of soil shear stiffness.
DMT vertical drained constrained modulus (MDMT) increased 50 – 100 MPa at Sites 3 and 4, and 100 – 200 MPa at Site 6 (130 – 220% overall improvement). Dilatometer testing also showed an increase in horizontal stress index KD of about 80%, and therefore an increase in the at rest lateral earth pressure coefficient, K0. (Marchetti et al., 2001). This implies further potential increases in the resistance of the soils to liquefaction, due to increased horizontal stresses (Salagado et al., 1997, Harada et al., 2010) – however the longevity of this effect is currently unknown and the degree of additional improvement is still the subject of debate (and therefore this has not been taken account of in the assessments in Section 6.2 below). The averaged results from all site investigation methods at Site 3 are presented in Figure 6. (Similar trends were evident at Site 4 and better results at Site 6, but these have been omitted here due to space constraints for this paper).

The CPT data was analysed for liquefaction triggering potential, using the method of Boulanger & Idriss (2014), with free-field settlements being computed using Zhang et al (2002). The results for Site 3 are presented in Figures 7 and 8 below, with a selection of return period events for Christchurch highlighted. Not surprisingly, given the increase in qc values shown in Figure 5, considerable reductions in settlements and LSN (van Ballegooy et al., 2014b) are indicated. At the 25-year return period improvement reduces these values by 90%, and as the return period rises to 500 years this reduction is still over 70%.
Across all three sites, calculated liquefaction settlements and LSN values have reduced by 50 – 80%. The implied surface damage potential for these sites from liquefaction is therefore significantly reduced.


7 CONCLUSIONS
The results of the study demonstrate that resin injection can be an effective ground improvement method for mitigation of liquefaction potential, and also for increasing foundation bearing capacities in sandy soils (including the siltier sands – e.g., sandy soils with CPT IC values up to about 2.0). Significant improvements in soil density and stiffness have been achieved. It has been noted that decreasing fines content, and increasing confining pressures, lead to better densification effects in treated soils. While the fines content of a soil deposit may constrain the applicability of this technology to any particular site, confining pressures can be applied through the use of portable kentledge on a site.
This trial and a commercial application have shown that the resin injection ground improvement methodology can be successfully applied for liquefaction mitigation or bearing capacity enhancement to cleared sites as well as to ground beneath existing buildings, structures, and infrastructure assets (for which there are currently few viable options).
This research project was jointly funded by Mainmark Ground Engineering (NZ) Ltd (Mainmark), EQC and MBIE. Mainmark also provided all equipment, materials, and site management for the project. We thank all parties for providing both the research funding, as well as the data for this paper. CPT, DMT testing, and borehole drilling was carried out by McMillan Drilling Ltd. The crosshole geophysical testing was carried out by the University of Auckland, using LandTest Ltd rigs to advance the geophones. Central Testing Services Ltd provided laboratory soil testing services for the project.
Boulanger, R.W. & Idriss, I.M. 2014. CPT and SPT based Liquefaction Triggering Procedures. Report No
UCD/CGM-14/01 Dept of Civil & Environmental Engineering, College of Engineering, University of California at Davis.
Erdemgil, M., Saglam, S., Bakir, B. 2007. Utilization of Highly Expansive Polymer Injection to Mitigate Seismic Foundation Failure for Exisitng Structures. Proc. 8th Pacific Conference on Earthquake Engineering. EQC (in prep). Ground Improvement Trials Report.
Harada, K., Orense, R., Ishihara, K., Mukai, J., 2010. Lateral Stress Effects on Liquefaction Resistance Correlations. Bulletin of the NZ Society for Earthquake Engineering, Vol 43, No.1, March 2010.
Hnat, H., Traylen, N., Wentz, R, van Ballegooy, S., 2017. Resin Injection for Seismic Liquefaction Mitigation Beneath Existing Commercial Buildings in Christchurch NZSEE Conference 27-29 April 2017, Wellington NZ. Marchetti S., Monaco P., Totani G. & Calabrese M. 2001. The Flat Dilatometer Test (DMT) in Soil Investigations. Report by the ISSMGE Committee TC16.Proc. IN SITU 2001, Intnl. Conf. On In situ Measurement of Soil Properties.
Salgado, R., Boulanger, R. W., and Mitchell, J. K. 1997. Lateral stress effects on CPT liquefaction resistance correlations. Journal of Geotechnical and Geoenvironmental Engineering, ASCE, 123(8), 726-735.
Schmertmann, J.H. 1970. Static Cone to Compute Static Settlement Over Sand. Journal of Soil Mechanics and Foundation Design, ASCE, Vol 96, SM3
Schmertmann, J.H. 1978. Guidelines for Cone Penetration Test: Performance and Design. FHWA-TS-78-209 report, US Dept of Transportation.
Traylen, N., van Ballegooy, S., Wentz, R. 2016. Liquefaction Mitigation beneath Existing Structures Using Polyurethane Grout Injection.
NZSEE Conference 1-3 April 2016 Christchurch NZ
(a) van Ballegooy, S., Cox, S. C., Thurlow, C., Rutter, H. K., Reynolds, T., Harrington, G., Fraser, J., Smith, T. (2014) Median water table elevation in Christchurch and surrounding area after the 4 September 2010 Darfield Earthquake: Version 2, GNS Science Report 2014/18, April 2014
(b) van Ballegooy, S., Malan, P., Lacrosse, V., Jacka, M., Cubrinovski, M., Bray, J. D., O'Rourke, T. D., Crawford S. A., Cowan, H. 2014. Assessment of liquefaction-induced land damage for residential Christchurch. Earthquake Spectra, February 2014, 30 (1), 31-55.
Wotherspoon, L.M., Cox, B.R., Stokoe, K.H., Ashfield D.J., Phillips, R.A. (2015) Utillizing direct-push crosshole testing to assess the effectiveness of soil stiffening caused by installation of stone columns and Rammed Aggregate Piers. 6th International Conference on Earthquake Geotechnical Engineering 1-4 November 2015 Christchurch NZ.
Zhang, G., Robertson, P., & Brachman, R. 2002. Estimating liquefaction-induced ground settlements from CPT for level ground. Canadian Geotechnical Journal, 39(5), 1168-1180.
Northwood Supa Centa is a large 33,000m2 shopping centre in Christchurch, New Zealand, that is home to a number of big brand retailers . The shopping complex had experienced liquefaction-induced subsidence following the 2010-2011 Canterbury earthquake sequence. The connected structures experienced approximately 50 mm of global settlement and up to 160 mm of further differential settlement.
The repair solution required the combination of ground improvement beneath the existing structures to address the weak, liquefiable soils and re-levelling to address the subsidence of the structure. In conjunction with a superstructure retrofit scheme, the buildings achieved the design target of 100% NBS (New Building Standard) .
The project required to meet significant operational challenges due to the copping centre’s large floor areas, and the client’s request for work to be carried out at night to minimise business interruption to retail trading .

Mainmark undertook the ground remediation works at Northwood Supa Centa using JOG Computer-Controlled Grouting to re-level the foundations, and Terefirm Resin Injection for liquefaction mitigation. The Terefirm ground improvement portion played a critical role in the success of this retrofit project, and will be the focus for the following sections.
• Trial: Multiple small-scale on-site trials were conducted.
• Target: A qc1Ncs value based on the spatial liquefaction performance .

• Treatment Depth: Varied from 4 to 7m below ground level (bgl)
• Ground Conditions: Variable soils, sandy to clayey
• Heave Limit: 20 mm global heave .
As Terefirm is typically used as a preventative liquefaction mitigation technique, Mainmark’s project designs require the use of predictive models for determining the performance of a building during a seismic event. The Supa Centa project offered a unique opportunity for Mainmark to compare predictive models against the experienced deformations
The design for any Terefirm project relies on CPT data across the footprint of the target area. The more CPT data there is, the more the design can be refined. The Supa Centa had a large quantity of CPT data with 39 pre-improvement CPTs and 45 post-improvement CPTs. The design based on the pre-improvement data allowed for the expected settlement across the footprint to be mapped This showed an expected global settlement of 50 mm, as well as 140 mm of further differential settlement as in Figure 5.
A key assumption of this approach was that the pre-improvement CPT data was representative of the ground conditions recorded prior to the Canterbury earthquake sequence . The predicted settlement map was then compared against the experienced settlement . The computed vertical settlement model closely matches the observed settlement of the structure, with 180 mm and 160 mm respectively towards the northern centre of the structures In both cases, the focus of ground improvement would be along the north-western sides of the structure, in line with what was experienced. This project offered an insight into the real-life application of predictive settlement models, and how those measure against an experienced event Figure 6 shows the lift plan based on the settlement contours of the structure .
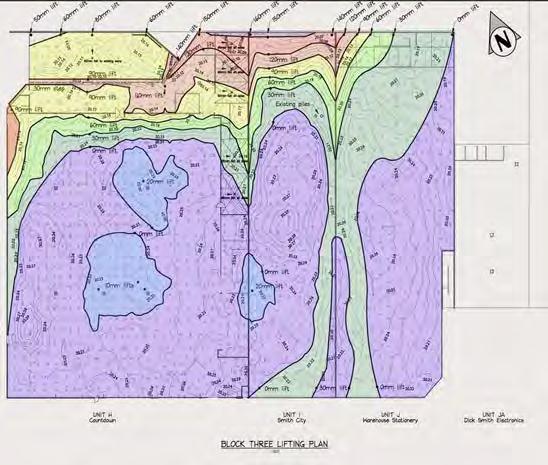
The expected and observed performance of the structures vary significantly across the footprint. Terefirm was an ideal solution as it offers a flexible design which can be tailored specifically for the site with a high level of accuracy. The treatment depth varied from 7 m to 1 m bgl according to the soil profile across the footprint of the structure, as shown in Figure 7. A specifically tailored design not only allowed for the reduction in further liquefaction-induced settlement but also created a more uniform soil profile which will minimise the extent of differential settlement in future seismic events.
 Figure 6. Lift plan based on experienced differential settlement.
The ground improvement results from the Supa Centa can be seen in Table 1 It can be seen that there was a 50% increase in qc1Ncs for I c values less than 1 8 A limiting factor in achieving the higher levels improvement demonstrated through the Red Zone Trials was the need to limit building uplift due to injection to less than 10mm This was particularly constraining in higher Ic soils, which exhibit higher heave for a constant injection volume proportionally to lower Ic soils
The Supa Centa project also helped the team refine some operational designs, such as the grid spacing . The original square grid design was changed to a triangular grid which ensures there is no ‘long diagonal’ This optimises the improvement as the injected material improves a consistent area per injection point. The location of the post-improvement ground tests were also moved to the point furthest from the surrounding injection points, as shown in Figure 8 This means each test is recording the area with least improvement, which will provide a conservative result

T. Hnat
Mainmark Ground Engineering Ltd, Christchurch.
N.J. Traylen
Geotech Consulting (NZ) Ltd, Christchurch.
R. Wentz
Wentz-Pacific Ltd, Napier
S. van Ballegooy
Tonkin & Taylor Ltd, Auckland.
ABSTRACT: At the 2016 NZSEE Conference, a paper was presented on the innovative use of injected resin as a ground improvement method beneath a set of existing commercial building structures in Christchurch (Traylen, van Ballegooy, and Wentz 2016). The paper discussed the results of pre-production trial panels that had been constructed for that project. This follow-up paper provides further data and conclusions from the project from the production phase of the resin injection. During this phase, the foundation and floor areas beneath the fully operational buildings were treated with injected expanding resin, and the resulting soil improvement was verified using cone penetrometer testing (CPT). The data shows a significant improvement in soil density throughout the depth of treatment, with a corresponding reduction in liquefaction potential. This was a successful outcome for the project, and demonstrates the potential for this technique to be used for mitigation of liquefaction beneath existing structures.
As reported in Traylen et al (2016), a relatively large commercial complex (5,400 square metres, consisting of a supermarket, and two ‘big brand’ retail outlets) which suffered liquefaction-related settlement damage in the 2010-2011 Canterbury Earthquake Sequence has been relevelled and seismically strengthened. As part of the works, liquefaction mitigation was carried out by Mainmark Ground Engineering Ltd, to densify and stiffen the underlying shallower soils (treating variously to 4m or 7m depth) using their TeretekTM resin injection methodology. The objective of the ground improvement works was to reduce liquefaction-induced damaging differential settlements at ULS levels of shaking, as well as to reduce the commercial operational risks for tenants occupying the buildings, by enhancing performance at SLS levels of shaking. Traylen et al (2016) reported results from several preliminary trial panels that were installed in advance of the main injection works. This aim of this addendum paper is to present the results from the main production injections, which were carried out after the writing of the 2016 paper.
The resin injection soil improvement mechanism is described in both Traylen et al (2016) and in a companion paper in this conference, Traylen, Wentz, van Ballegooy, Hnat & Wotherspoon (2017). In summary, it is a soil densification mechanism driven by the expansion of an injected polyurethane resin product (although other secondary effects such as improvement in composite stiffness, cementation, and horizontal stress increases are also present).
 2017 NZSEE Conference
The expanding resin injection process typically results in a ‘veining’ of expanded material distributed through the soil mass as dykes, sills or networks of sheets or plates, typically tens of millimetres thick (as shown in Figure 1). The expansion of these veins is what results in densification of the soils.
Over a period of four weeks a total of five preliminary trial panels were carried out (four adjacent to the foundation line external to the building, and one internal trial panel under a shop floor), as previously described in Traylen et al (2016). Based on the trial panel results a production injection methodology was selected by the ground improvement contractor


From the buildings’ performance during the 2010 -2011 Canterbury Earthquake Sequence, and also from assessment of CPT and soils laboratory data, the client’s geotechnical consultant had identified two distinct ‘domains’ within the project footprint The southern part of the site (‘Domain 2’) was siltier than the northern part – it had significantly better liquefaction performance, and therefore did not require as much improvement. In the northern ‘Domain 1’ a target performance specification based on qc1Ncs was used for the production works
Between February and April 2016, the resin injection process was implemented beneath the buildings, at approximately 3700 injection points. In Domain 1, the depth of treatment beneath foundations was 7m, and 4m under the more lightly loaded floor slabs (based on the performance requirements for those two different areas). The primary objective in Domain 2 was to reduce the potential effects of differential stiffness performance between it and the treated Domain 1 areas. The depth of treatment was reduced (tapering over a 20m transition zone to avoid a step change in performance) to 4m beneath foundations and nil beneath floor slabs, with a requirement to inject similar volumes of material per metre depth as was achieved in Domain 1, also limited by ground heave cutoff criteria
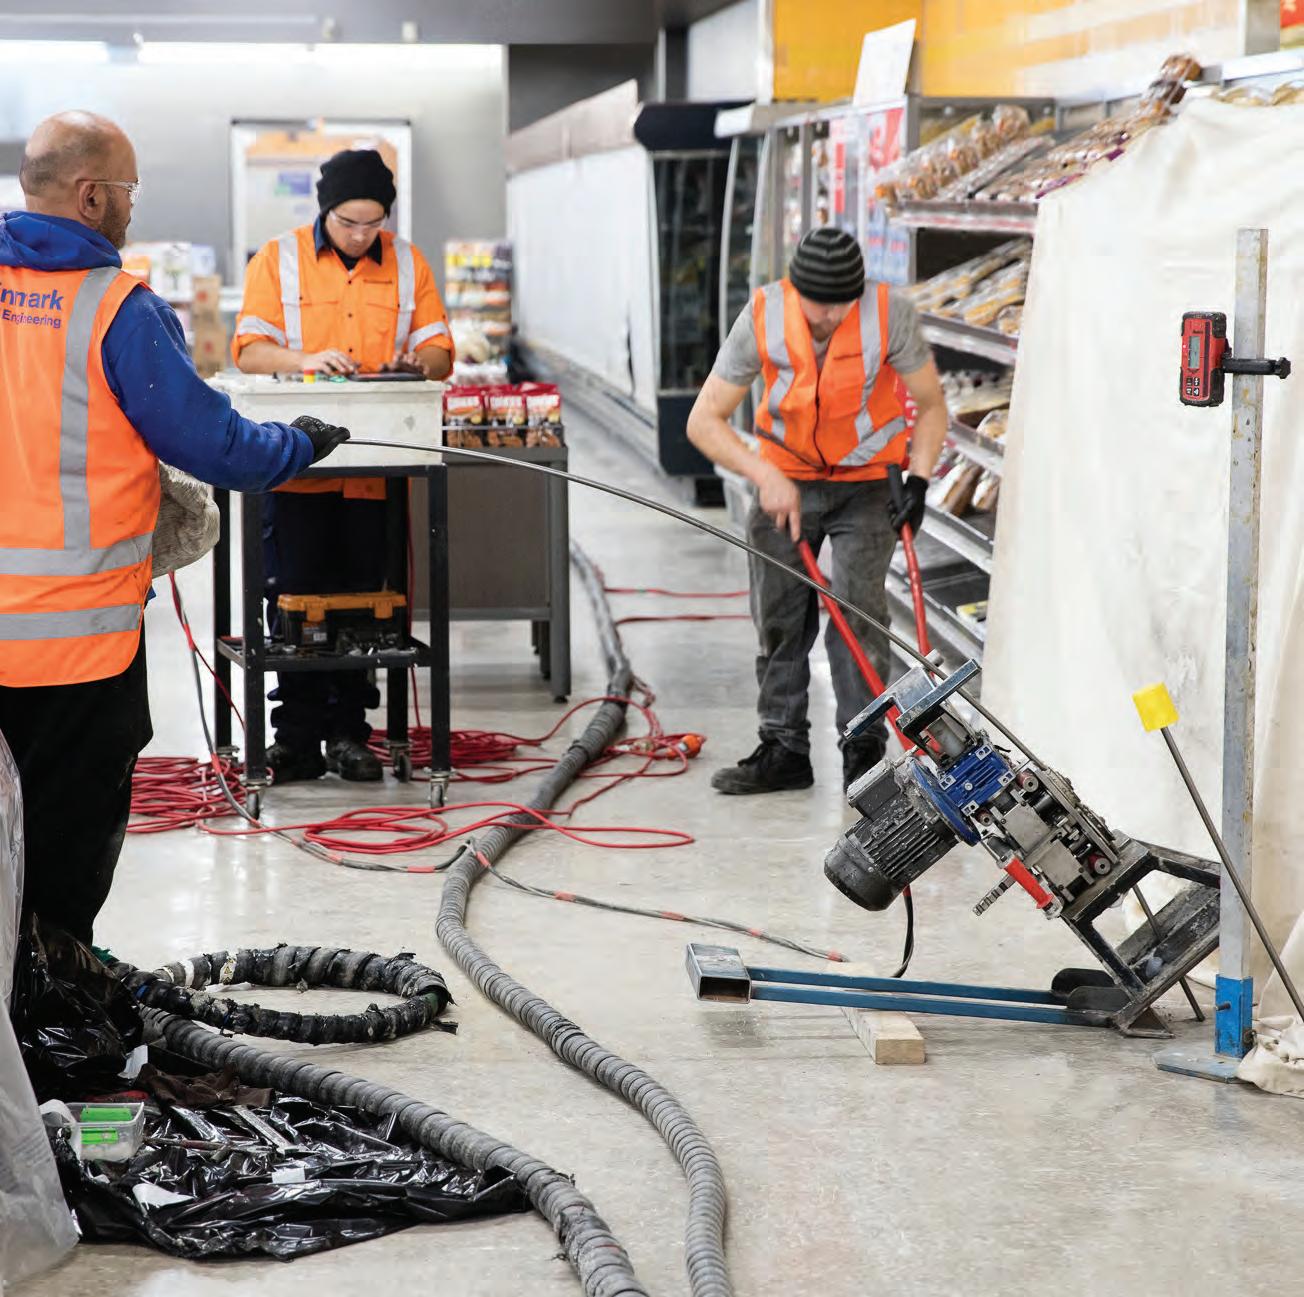
The subject buildings are tenanted by businesses with high retail turnover (particularly over the Christmas period), and as such the client required the works to be carried out with minimal disruption to the tenants and their customers The works that were internal to the buildings were therefore carried out in a continuous series of night-time possessions, between the hours of 6pm and 5am.
To minimise the night-time noise pollution impacts on nearby residential properties, the power generation plant and resin pumps were housed in custom-built shipping containers. At the beginning of each shift the injection area for the night had to be cleared, secured, and protected before bringing


in the injector apparatus and delivery hoses, and before the end of each shift the process was reversed, ready for the daily opening of the retail outlets for the tenants’ customers. Despite these constraints, the ground improvement works were installed inside and around the buildings, including in and around food storage, display, and handling areas, with relative ease and cleanliness.
Pre-
The results show that the soils responded to the resin injection with an increase in soil density and therefore an increase in liquefaction resistance. The individual data was variable, but in each case the tested location passed the specification requirements by either meeting the CPT target criteria (designed to reduce settlements to acceptable levels for the strengthening works, rather than eliminate liquefaction triggering entirely), or in Domain 2 by meeting the volume injected/heave limit criteria
and (in most locations) also meeting the Domain 1 CPT criteria. When the data is aggregated (from a total of 30 CPT test locations), the patterns that emerge show a general trend of increasing soil density (see Table 1). Looking at the entire dataset, the average increase in qc1Ncs values is 37%. (The qc1Ncs value is a CPT derived strength parameter that also takes account of both the soils fines content, and its depth below ground level). To give an indication of what this means in more relatable terms, this averaged qc1Ncs data (both pre- and post-injection) was run through a liquefaction settlement analysis, and for a theoretical soil with a qc1Ncs profile averaged from those 30 locations, the calculated ‘free field’ settlement within the treated zone is reduced from about 50mm to virtually nil at SLS levels of shaking (95% reduction), and from 110mm to 40mm at ULS levels of shaking (65% reduction).
The individual CPT test locations show a more varied response in soil density (Figure 4); however the averaged data provides insight into the reduction of liquefaction potential as a whole. A random sample of four of the test locations on the exterior of the building were also individually analysed, and on average these showed a 70% settlement reduction at SLS (25-year return period event for Christchurch) and 60% at ULS (500-year return period), within the treated zone. An intermediate limit state (ILS) corresponding to a 100-year return period event is also considered in Table 1 below.

The data in Table 1 above and Figure 2 below are from 30 CPT locations across the 5400m2 footprint of the building complex.

The data confirms that ground improvement by resin injection did result in meaningful increases in soil density, and reductions in anticipated settlements to acceptable levels This site (and therefore the supported foundations) are expected to perform significantly better in a future large earthquake event than if the ground had been left untreated. For this set of buildings the combination of the ground improvement and structural strengthening resulted in an assessed ‘100% NBS’ capacity.
This project has shown that resin injection is a viable technology for ground improvement in the appropriate soil conditions, and is particularly useful for liquefaction mitigation beneath existing structures. Furthermore, the low level of intrusion required to carry out the process was a significant benefit for this operation as the three retail outlets (including a busy supermarket) were able to continue trading through the busy Christmas trading period.
Since the time of this project, a detailed field research study into the efficacy of resin injection as a ground improvement method for mitigation of liquefaction has been carried out, as discussed in Traylen et al (2107).
Boulanger, R.W. & Idriss, I.M. 2014. CPT and SPT based Liquefaction Triggering Procedures. Report No UCD/CGM-14/01 Dept of Civil & Environmental Engineering, College of Engineering, University of California at Davis.
Robertson, P.K. and Wride, C.E. 1997. Cyclic Liquefaction and its evaluation based on SPT and CPT. Proceedings, NCEER Workshop on Evaluation of Liquefaction Resistance of Soils.
Traylen, N., van Ballegooy, S., Wentz, R. 2016. Liquefaction Mitigation beneath Existing Structures Using Polyurethane Grout Injection. NZSEE Conference 1-3 April 2016 Christchurch NZ
Traylen, N., Wentz, R., van Ballegooy, S., Hnat, T., Wotherspoon, L.M. (2017). Research Results from a Study into Resin Injection for Seismic Liquefaction Mitigation NZSEE Conference 27-29 April 2017 Wellington NZ
Zhang, G., Robertson, P., & Brachman, R. 2002. Estimating liquefaction-induced ground settlements from CPT for level ground. Canadian Geotechnical Journal, 39(5), 1168-1180.


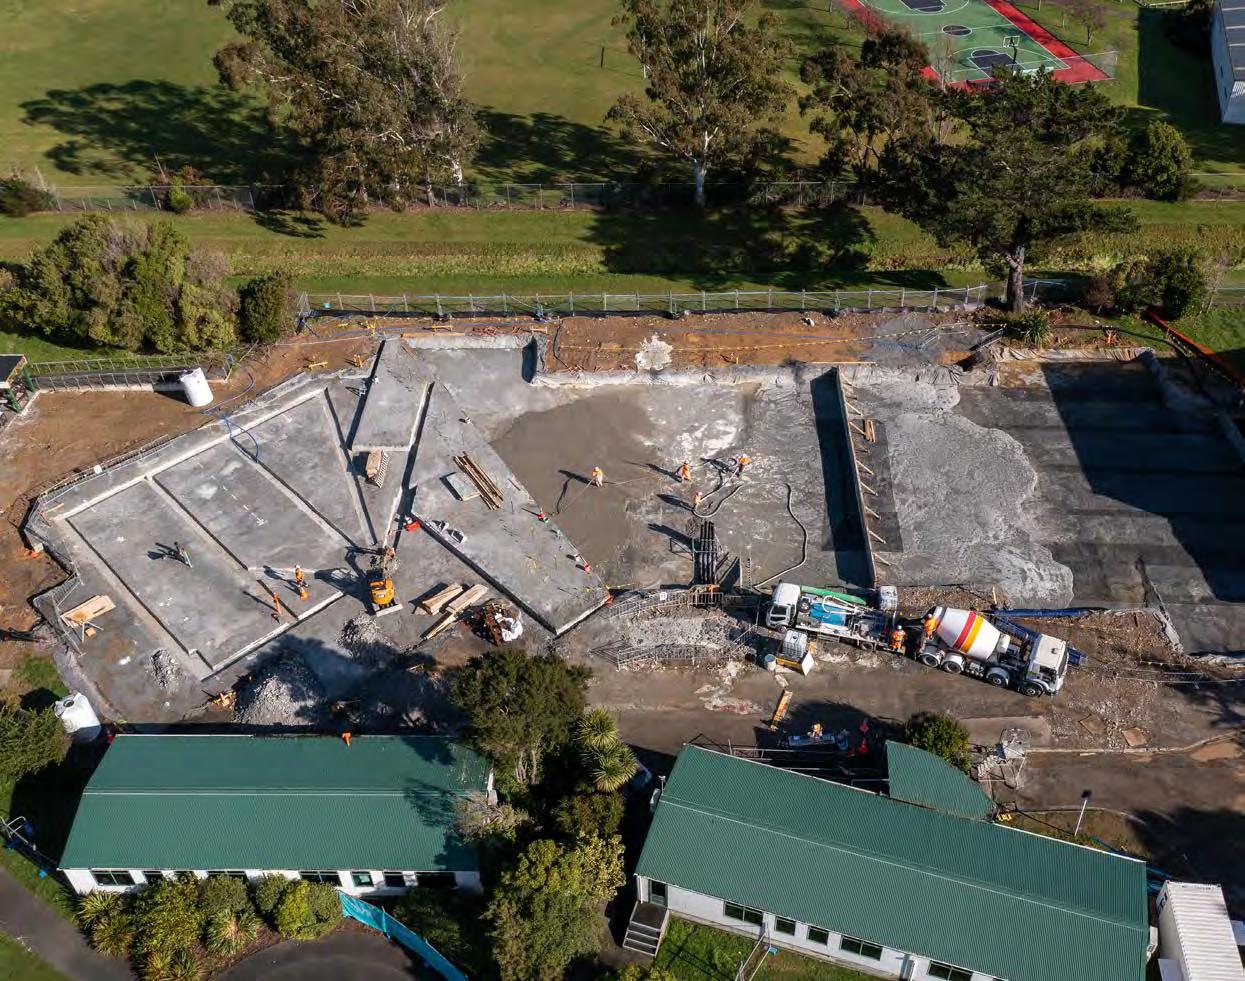
The Seaview Wastewater Treatment Plant is located in New Zealand’s North Island near an active seismic fault . The facility treats up to 53 million litres of water daily, servicing around 146,000 residents in Upper Hutt and Lower Hutt as well as a large number of local industries
The plant was built in 2002 to the engineering standards of the time, helping to ensure it had the ability to withstand seismic events, and prevent wastewater from escaping into the ocean . It is jointly owned by the Upper Hutt and Hutt City Councils In response to recent changes to the Seismic Prone Building Act Amendment 2016, Wellington Water proactively sought a long-term solution to strengthen the ground underneath the Seaview Wastewater Treatment Plant, further improving the resilience of the critical infrastructure
Under Wellington Water’s Regional Specification for Water Services, pumping stations and treatment plants must achieve an IL4 performance, meaning the building and connected hydraulic services must remain operational following a significant seismic event. Therefore, the ground beneath the existing milliscreen and pumping station building at the plant required improving in order to reduce the risk of liquefaction-induced settlement as a result of a future seismic event
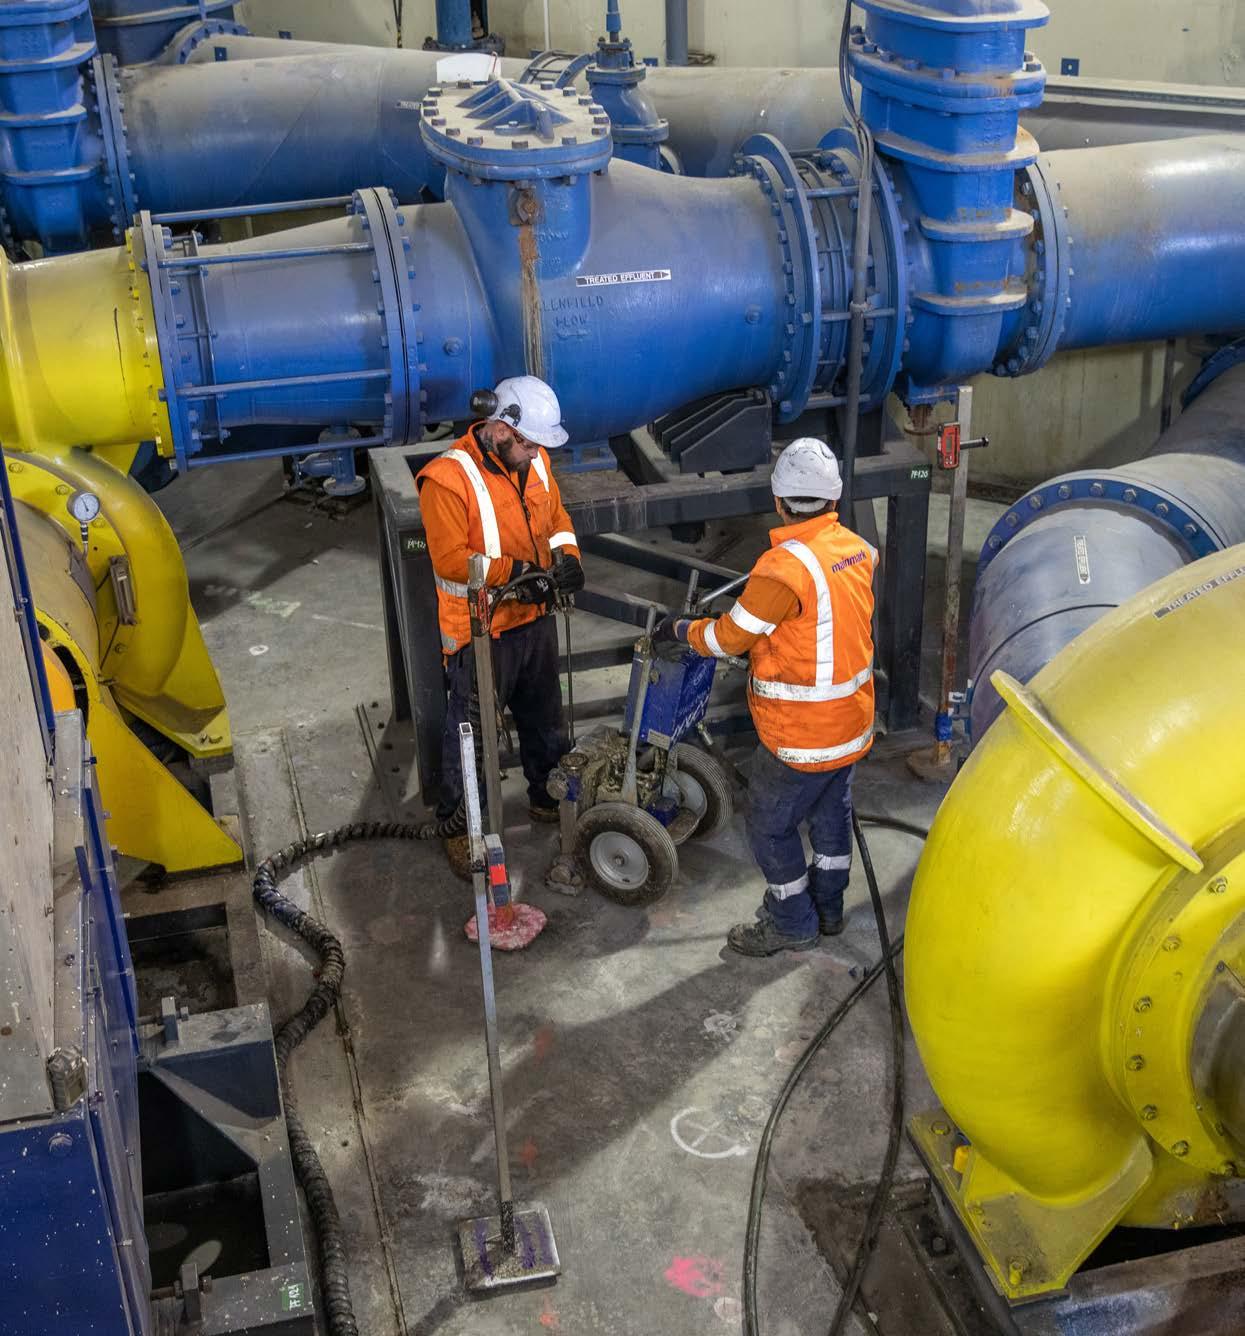
The facility had a number of rooms containing large pumps, generators and other sensitive computer and electrical equipment, making it nearly impossible to strengthen the facility’s resilience to earthquakes using conventional invasive methods such as stone columns, screw piles or jet grouting. Wellington Water selected Mainmark’s Terefirm Resin Injection after an open tender process, due to its unique and proven ability to be applied under existing structures
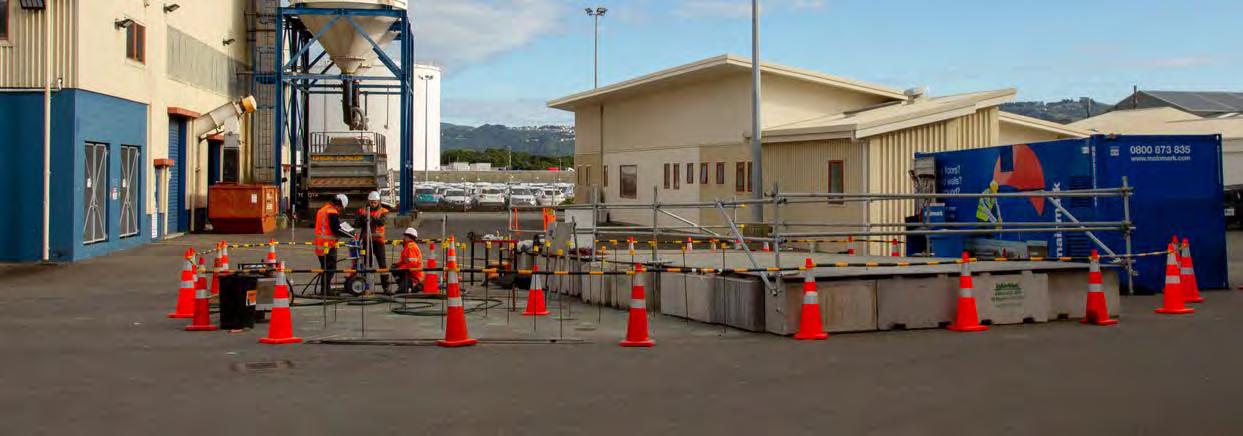
The Seaview Wastewater Treatment Plant is an IL4 building that must remain operational after a 500-year return period seismic event. Having developed a proven track record following the Red Zone trials and the Supa Centa, Mainmark was contracted to perform ground improvement for liquefaction mitigation beneath the plant
Project overview:
• Trial: 10 x 10 m trial pad
• Target: A percentage improvement in qc1Ncs and/or a target qc1Ncs value
• Treatment Depth: Varied from 1.5-6 m and 1.5-8 m bgl.
• Ground Conditions: Spatially variable soils
• Heave Limit: 20 mm global heave
Rather than focusing on a specific percentage target of improvement, this project aimed to create a spatially uniform crust beneath the structure while also increasing the overall soil strength. The post-improvement CPT results can be seen in Table 2.
This site had unique operational challenges relating to services risk and access The plant had 3 hours of storage before untreated wastewater would overflow into Wellington harbour, so highrisk injection zones had to be clearly identified and planned for. This was overlapped with the accessibility for that zone to determine an overall level of risk
The Seaview WWTP project provided valuable data for soils with Ic ranges greater than 2 3, which were rarely present at the Red Zone trials The data shows that while the level of improvement does decrease with increasing Ic, this is offset by a proportional reduction in liquefaction triggering potential in higher Ic soils. The final data was processed to update the predictive models relating to the target strength increase to the soil type and quantity of material injected
Following the successful application of Terefirm Resin Injection, the facility now meets 55% NBS at the required importance level standard (IL4) for continuing to function following a large seismic event .


Tristan Reynard, Project Director for the Seaview project said Mainmark delivered an ideal solution for the challenge . “Upgrading this plant while it keeps operating presented a unique challenge, which Mainmark’s solution helped us to address Wellington Water is now evaluating the use of this technology on another important water treatment plant We look forward to continuing to work with Mainmark for ground improvement works in the future . ”


T. Hnat
Mainmark Ground Engineering NZ Ltd.
As part of the Wellington Water Ltd Seismic Strengthening programme, the Seaview Waste Water Treatment Plant (WWTP) Pump Station and Milliscreen Buildings required Serviceability Limit State (SLS2) performance to be during a 1:500 year earthquake.
The sewage for the Hutt Valley passes through the Milliscreen (as it enters the treatment plant) and Pump Station (high pressure outfall to Pencarrow) as part of the sewerage treatment process (for approximately 100,000 people). Failure of either building would result in overflow to the Wellington Harbour.
Detailed serviceability criteria was provided by the structural engineer regarding the performance level of the foundation systems during the design level earthquake to maintain operation.

A detailed geotechnical investigation was completed of the site to assess the risk of liquefaction and liquefaction related damage. It was found that during the SLS2 event building damage was likely to exceed the criteria provided.
A range of options were considered for ground improvement beneath the existing structure, including traditional piles, jet grouting, permeation grouting, bio-calcification, and resin injection. Due to a range of technical issues, building access, and fiscal limitations, resin injection methodology presented by Mainmark was chosen as the preferred option.
This paper presents the detailed design, verification works, construction supervision and quality control for the selected resin injection approach utilised by Mainmark.
Coffey Services (NZ) Ltd were engaged by Wellington Water Ltd to assess the risk of seismic induced damage to the Pump Station and Milliscreen buildings at the Seaview Waste Water Treatment Plant, Lower Hutt, Wellington.
The selected ground improvement method was required to achieve satisfactory performance as per the design tolerances specified by the client, an extract of which is provided in Section Error! Reference source not found. below, at the following design earthquake levels.
• 100% NBS for SLS1 & SLS2 based on the structures being importance level (IL4) with a design life of 50 years.
For the ULS design case prevention of collapse is required. Specific Damage Criteria was not set.
• 55% of the New Building Standard (NBS) for ULS based on the structures being importance level (IL4) with a design life of 50 years.
The following table provides an extract of the critical design tolerances following an assessment completed by the structural engineer, client and WWTP operators.
The site is nearly level with only small, localised rises or falls across the site, and predominantly covered in hard standing including asphalt or concrete surfaces. Some minor areas of grass are present.
Inside, the milliscreen plant the area is broken into two levels. The milliscreens are located on the upper level, and the lower (ground floor) level comprises a range of uses (see photo below), from pipes, pumps to an open workshop area at the western end.
The pump station building can be split into three main areas: transformer bay, main pump room (see photo below) and a wet well
295 - Resin Injection for Liquefaction Mitigation of an existing Waste Water Treatment Plant
2019 Pacific Conference on Earthquake Engineering and Annual NZSEE Conference
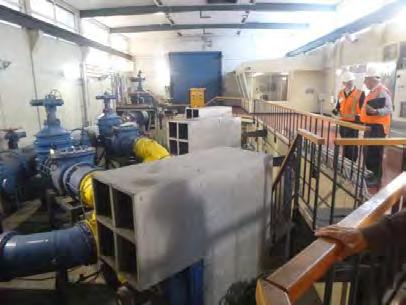
During the initial assessment and design process it was identified that due to the extremely restricted access to parts of the buildings, early contractor engagement would be critical.
The site is underlain by Reclamation Fill overlying Marginal Marine Sediments. At depth, the site is underlain by the Hutt Aquiclude and the Hutt Aquifer.
Groundwater monitoring identified a level of 1.85m below ground level (bgl), with a design groundwater level of 1.5m bgl utilised in the assessments.
The following Peak Ground Accelerations (PGA) were utilised in the design process:
295 - Resin Injection for Liquefaction Mitigation of an existing Waste Water Treatment Plant 2019 Pacific Conference on Earthquake Engineering and Annual NZSEE Conference 3
 Figure 1: Photos of the Pump Station & Milliscreen Buildings (Milliscreen – Left, Pump Station – Right)
• SLS1 – 6.2 Meff,, 0.09 PGA.
• SLS2 – 7.1 Meff,,0.35 PGA.
• ULS – 7.1 Meff,, 0.34 PGA.
Ground motions experienced at selected sites near the WWTP during the Kaikoura (2016) Earthquake tabulated below.
Table 3: Ground motions during Kaikoura earthquakes
Following an initial assessment, it was identified that the design criteria would exceed the performance criteria and that some ground improvement would be required. It was preferred that the Hutt Aquiclude was not penetrated and therefore a ‘thickened crust’ solution was proposed. Utilising the concept of a thickened crust and the performance criteria, a performance specification was developed with an estimated depth of improvement to 6m bgl. The tender was split into Separable Portion 1 (Design) and Separable Portion 2 (Construction). Separable Portion 2 would only be awarded following completion of SP1, which included a verification trial and Detailed Design (both discussed below).
During the tender process, options for ground improvement included Jet Grouting, Bio-Calcification, and Resin Injection. Bio-calcification was not considered due to the lack of New Zealand experience and potential time frames for development/testing. Jet grouting, even with small rigs, was still limited to approximately 70% of the building footprint, with large critical areas inaccessible. Resin Injection (Mainmark) provided access to all areas, with enough existing data to allow for detailed design to progress.
Once the contract was awarded, the detailed design and verification process was completed. This section summarises the detailed design approach.
The ground improvement works and associated verification testing was assessed based on a relative improvement in behaviour across the site, using the Kaikoura earthquake (KE, 0.18g, 7.8M) event (November 2016) as a benchmark for expected ground behaviour.
There will be two key components to the design and verification of the ground improvements:
1. Simplified Assessment
2. Elastic Plastic Assessment
295 - Resin Injection for Liquefaction Mitigation of an existing Waste Water Treatment Plant
2019 Pacific Conference on Earthquake Engineering and Annual NZSEE Conference 4
The following steps were undertaken to complete the simplified assessment.
1. Liquefaction Assessment (Boulanger & Idriss, 2014) to refine the parameters PL and Cfc based on the Kaikoura earthquake event with the following maximum values assessed to a total depth of ~12 m:
2. Comparison of the fines content with the lab test data, the Probability of Liquefaction (PL) factor and the Fines Correction (Cfc) factor have a significant impact on the liquefaction and subsequent damage assessments.
3. Once the correction factors are addressed, post ground improvement target will be assessed as follows:
a. Modify the qc1N value to reflect ground improvement.
b. Note: Ic & Fines Content (FC) % will remain the same as the pre-ground improvement profile. Typically, increasing qc (tip bearing) value will reduce Ic and FC accordingly, often shifting silts and clays into a different soil classification, which would not be a true representation of the improvement.
c. Assess the post ground improvement profile for liquefaction using the SLS2 earthquake conditions and reassess against the following criteria:
4. Post Ground Improvement Criteria for an SLS2 event over the treated depth (minimum 6m). Liquefaction occurring below 6m is considered to have a low impact on the existing structures. The key to the post ground improvement criteria is the improvement of the treated zone to produce index values (as below) less than the KE during the higher SLS2 design event with a margin to act as a factor of safety.
a. Free Field Settlement < Settlement during the KE.
b. LPI < LPI during the KE.
c. LPI – Isihara < LPI-Isihara during the KE
d. LSN < LSN during the KE
e. CTL < CTL during the KE
f. Crust Thickness > Crust Thickness during the KE
5. Carry out a parametric assessment to assess the sensitivity of the ground improvement to varying improved depth and/or qc1Ncs values. It should be noted that the above assessment has limited capacity to directly assess building movement or damage against the structural damage criteria provided. It is a simplified solution and provides an overall comparison of the site pre-and post-ground improvement.
Reinforcement from the resin columns/planes was not considered in the design.
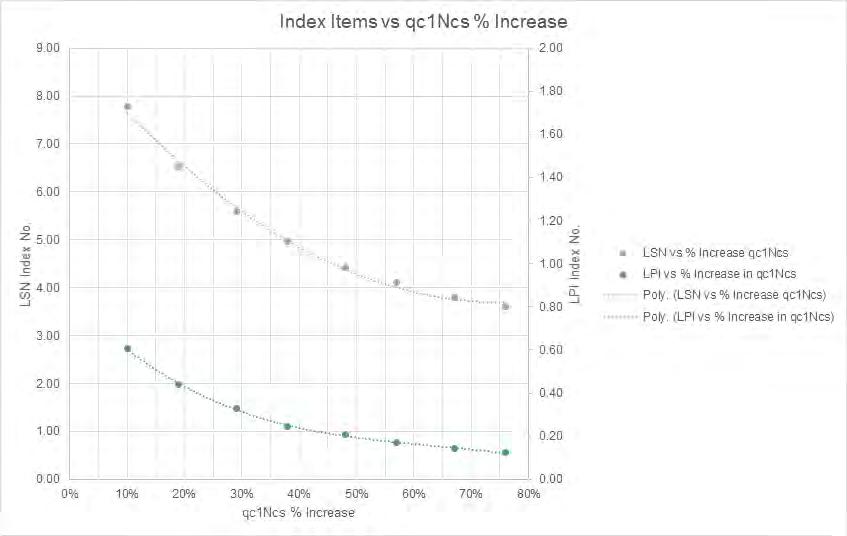
To assess the appropriateness of the recommended 50% increase in qc1Ncs, an assessment was completed by varying the % increase in qc1Ncs against LSN and LPI over the treated thickness. There is a marked decrease in the reduction in index values with increase qc1Ncs (see Figure 2 below).
2019 Pacific Conference on Earthquake Engineering and Annual NZSEE Conference 5
Over the majority of the site, if qc1Ncs is increased beyond 50/60%, there was a nominal improvement over the site’s susceptibility to liquefaction.
Modifying treatment depth was also assessed, with the results producing a typically linear relationship between depth of treatment and reducing index values.
The following section outlines the initial methodology to the Elastic-Plastic Assessment utilising Plaxis 2D. The following general notes are made about the development of the profile and soil properties:
• An overall LPI was derived based on the post-treatment CPT results (see verification trial below).
• Stiffness reduction factor for liquefied soils applied to hardening soil young’s modulus (E ref50, Erefur and Erefoed) was based on the LPI and initial assessed at 0.16.
• The volumetric strain for the liquefied marine sand and marine silt layers was based on the liquefied marine sand and silt layers. Volumetric strain was utilised to assess the free field case.
• The micropiles modelled as Embedded Beam Rows (very high point loads in discreet areas).
During the course of a design review process, the stiffness reduction value for all liquefied layers utilised a β value of 0.02. Checks were completed using a higher value of 0.05 to check sensitivity. Where the lower reduction value was utilised, the volumetric strain was not applied.
The result of the Plaxis Assessment confirmed the simplified assessment and had general agreement that a treatment depth of 1.5m to 6.0m bgl would provide a sufficiently thick crust to achieve the performance criteria.
However, locally high point loads from micropile groups required additional treatment to 8.0m below ground level to prevent excessive differential movement.
Resin Injection is a ground improvement technique designed to be used under existing structures to provide an increase in liquefaction resistance. Densification of the injected soil occurs primarily as a result of an expanding polyurethane resin product. Detailed testing of the technology was carried out in 2013 and 2016 by MBIE and EQC as part of a large-scale liquefaction ground improvement trial. The outcome of the trials has seen the technology included in the MBIE Module 5: Ground Improvement of Soils Prone to Liquefaction. As previously stated, secondary effects such as improvement in composite stiffness cementation, and horizontal stress increases have not been considered.
Injection tubes are driven into the ground through small penetrations ( up to 20 mm) at regular intervals, and at each injection point material is injected into the target treatment zone to create the resin-soil matrix. During injection of the treatment zone, the low viscosity resin both permeates the soil to a limited extent, and also penetrates under pressure along planes of weaknesses within the soil profile. The material reacts soon after injection, rapidly expanding to many times its original volume. The expansion of the injected material results in compaction of the adjacent soils, due to new material being introduced into a relatively constant soil volume.
An injection array was marked out across the entire treatment area, on a regular grid spacing with reference points. An indicative layout of the Trial area is shown in Figure 3. In-ground service scanning was undertaken to ensure no adverse impact on services from the drilling and injection process. Any injection locations that coincide with adjacent services can be readily relocated.
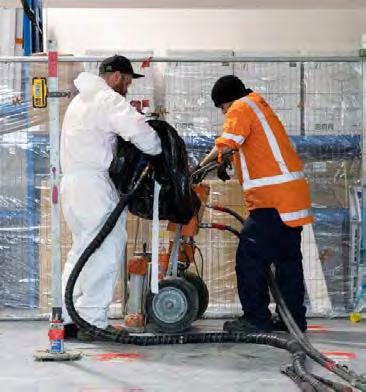
Penetrations to enable injection works are limited to 20mm in diameter. Standard, hand-held rotary hammer drills are sufficient to enable drilling through floor slabs and footings. Mainmark utilise custom drill lengths of up to 2.5m as standard. Another benefit of this low-impact drilling method is that damage to steel reinforcement is minimised. If required, control strategies can be used to mitigate any concrete dust generation.
All injection tubes used for material delivery are 16mm in diameter, and can be installed in continuous or coupled segmented lengths. This enables installation to depths greater than the available head room. Injection tubes are easily installed using hand-held rotary hammer drills. Injection tubes installed below the water table are fitted with sealed driving tips to prevent ingress and blockage prior to injection. Each injection tube is removed upon completion of that location’s treatment.
Injection material is generated within self-contained mobile plant (20ft containerised), which can be located up to 100m from the intended injection locations. Sealed hoses transport the material from the plant to the delivery point.
The level of improvement targeted determines the following key parameters:
1. Injection sequence
2. Injection volumes (e.g. per vertical metre)
3. Target improvement / densification
4. Tube extraction rate (static or continuous)
5. Allowable structure movement
Items 2 – 5 form part of the injection cut-off criteria, in addition to any other requirements.
A capping layer is typically required to provide increased confinement for the ground improvement zone. This is injected first, and is followed by injections into the remaining ground improvement zone, as shown in Figure 5. A tube extractor can be used for continuous material injection.

Geophysical testing was carried out before and after ground improvement. This included boreholes, CPT, direct-push crosshole testing (DPCT), and earth pressure cells. The post-improvement testing was carried out 14 days after injection completion to account for pore water pressure dissipation. However, the earth pressure cell data showed that dissipation effects were complete within 7 days post-injection works.
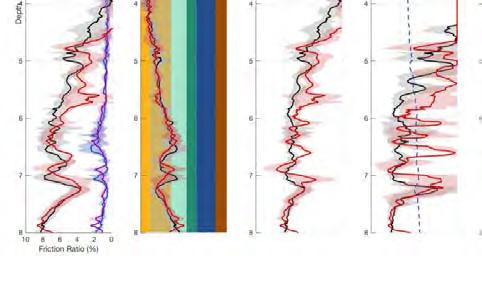
From the CPT analysis, an increase of 30% in qc1Ncs was measured in the top 3m, a 3% increase in the gravel layer from 3 – 5m, and an 18% increase from 5 – 6m. As noted in Traylen et al. (2017), a general trend of decreasing efficiency of improvement can be seen in the soils with a higher starting q c1Ncs values. However, as shown for the SLS2 case in Figure 6, these soils already have a factor of safety greater than 2. As such, the final design will seek to increase efficiency by reassigning the injected material from the 3 – 5m zone to the zones directly above and below.
The DPCT data showed an increase in Go of 16% in the top 3m, a 7% increase from 3 – 5m, and a 24% increase from 5 – 6m, noting a similar trend as the CPT analysis, however with increased effectiveness in the deeper, more confined sand layer. No significant trends were observed in the degree of saturation (V p data) pre- and post-injection.
Coffey’s initial involvement with the project dates to 2014, while Mainmark became involved from early 2018. During this time events such as Kaikoura, and lessons learnt from the Christchurch Sequence have greatly changed the way we approach these critical projects. Some of these lessons are listed below:
• More testing up front – 10-20 additional CPT’s would have provided a better understanding of site variability.
• Large scale lab testing of the affect resin seams has on the rotation of soil particles.
• Mass permeability of the resin block.
• Site testing to allow benchmarking of Plaxis Results.
• Limitations of Pseudostatic Plaxis Assessment.
Although further research/testing is required to establish a better understanding of the impact the resin is having on the soil behaviour during a seismic event, there is clear indications of an improvement in soil behaviour and a reduction in susceptibility to liquefaction.

The simplified assessments, Plaxis pseudo-static assessment and the data collected from the verification trial shows ground improvement meets the Performance Criteria.
In general, liquefaction occurring below 6m is considered to have a low impact on the existing structures. Although total reconsolidation settlement will continue to increase with increasing acceleration.
- Resin Injection for Liquefaction Mitigation of an existing Waste Water Treatment Plant
2019 Pacific Conference on Earthquake Engineering and Annual NZSEE Conference 10



O’Connell’s, a large retail, dining and office complex in Queenstown, New Zealand, was undergoing a multi-million dollar redevelopment to revitalise the entire site, including a new external facade and internal layout modifications. O’Connell’s was originally opened in 1988 as Queenstown’s first major shopping centre. The new development aims to blend luxury retail with contemporary dining experiences
As O’Connell’s is located in the heart of Queenstown and is an iconic local destination, the owners, Skyline Enterprises, felt it was important that the 4,000 m2 building upgrade was earthquake resilient, particularly given Queenstown’s relative proximity to the Alpine Fault line
As part of the redevelopment, O’Connell’s Mall needed to achieve an 80% NBS rating through structural and geotechnical improvements A geotechnical solution that would improve earthquake resilience and mitigate liquefaction was an essential requirement for the O’Connell’s redevelopment to achieve the desired NBS rating
The project engineers identified that the building required a nonliquefiable crust 1-5 m beneath the basement. As O’Connell’s consisted of 5 levels including a basement, undertaking the work presented significant challenges with very few feasible options available
Timing was also a crucial factor in the redevelopment . The building was closed during the works and the project needed to maintain a strict schedule in order to fit with peak trading windows.

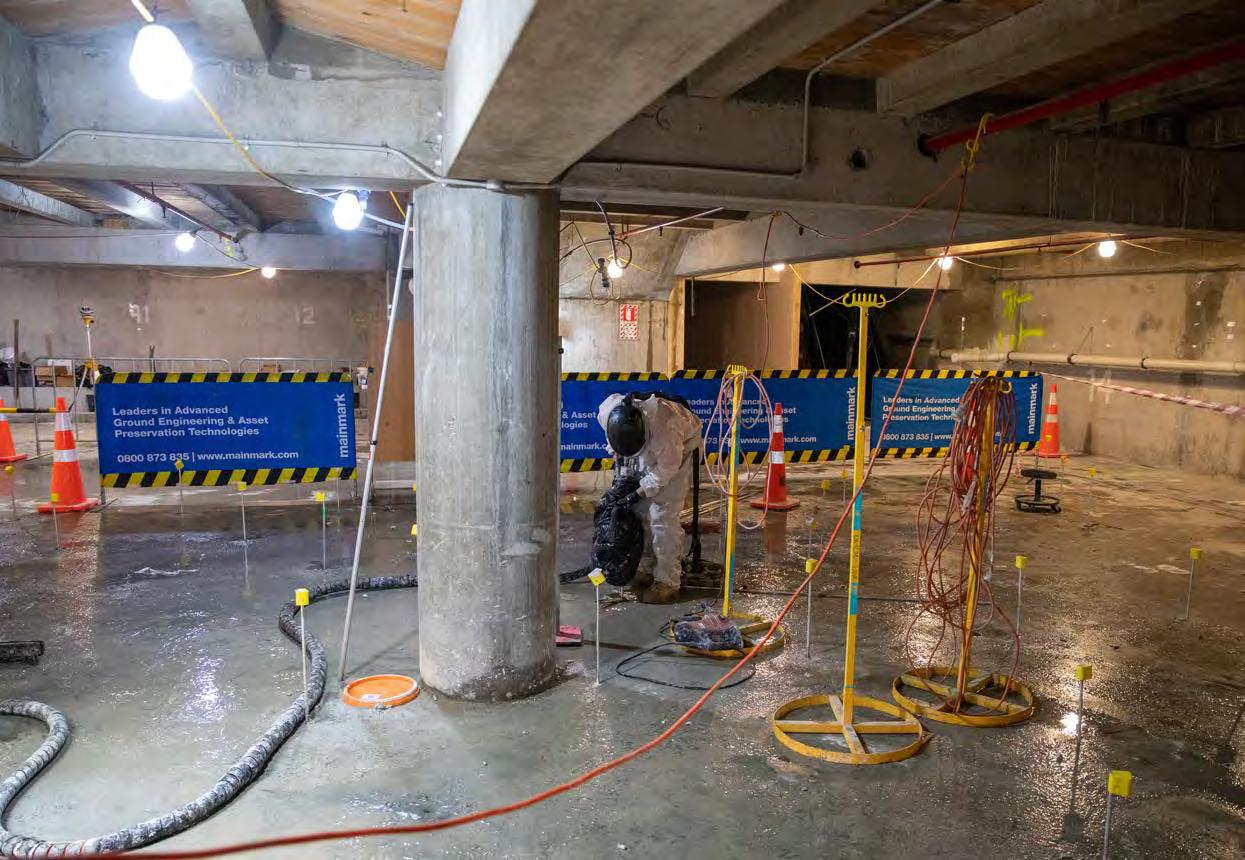
Mainmark’s Terefirm Resin Injection solution was identified as the best approach for this complex project As it was imperative for the O’Connell’s centre to be fully operational within 18 months, time-consuming excavation work and the use of heavy machinery was ruled out. Access issues created further complications as the building’s basement was just 2 .1 m in height in some areas, and there was only one vehicle entrance ramp which was blocked by scaffolding. The heave tolerance on the building also required careful planning and coordination, with the basement slab, walls, and columns requiring constant monitoring throughout the ground improvement process
This successful project was the second largest Terefirm treatment project to be completed by Mainmark, after the Seaview Wastewater Treatment Plant liquefaction mitigation project which was completed in 2019 Skyline Enterprises general manager of developments, Steve McLean, said all dealings with Mainmark were prompt and efficient.

“Mainmark took the time to carefully explain the technical aspects of the project and provide information about past projects utilising the same approach. This was key to us then trialling their Terefirm resin injection solution. After the trial’s success, it was an easy decision for us to proceed with their product as we had proof that it would achieve the result we wanted.
“We were impressed with Mainmark’s professionalism and accuracy and thanks to Terefirm we were able to achieve our goals for this project in terms of performance, cost and timing.”
With the operational and technical knowledge gained from six years of Terefirm projects, Mainmark were contracted to perform the ground improvement beneath O’Connell’s mall in Queenstown. The building required structural and geotechnical retrofit strategies to achieve a 80% NBS rating. The geotechnical upgrades included stiffer basement ground beams in addition to ground improvement to create a 5 m non-liquefiable crust.
Project overview:
• Trial: 1 trial
• Target: 30% increase in qc1Ncs .
• Treatment Depth: 5 m bgl .
• Ground Conditions: Spatially variable soils, sandy to silty .
• Heave Limit: global and lateral differential heave limits.
To confirm the Terefirm methodology for the site, Mainmark first conducted a 3-week ground improvement trial prior to undertaking the full scope of work . This included testing a 6m x 6m panel zone with 39 resin injection points to validate the design
For the initial design of the O’Connell’s mall project, no specific heave tolerance was given by the consultants, so long as there was no significant differential movement introduced across the building footprint (i e global heave was acceptable) However, after the completion of the first quarter of the ground improvement, architectural requirements were brought to light that resulted in the introduction of a 20 mm global heave tolerance . As the amount of heave experienced correlates to the quantity of material injected, the Resin Injection quantities were decreased to reduce the heave
The OCM project was split into 16 zones, each approximately 100 m2, and Table 3 shows the improvement experienced based on CPT and DPCH results Zone A was treated with no heave tolerance and the results show that there was an average increase of 88% in qc1Ncs and 76% in G0 In the remaining zones, where heave tolerances limited the quantity of material injected, the average increases in qc1Ncs and G0 were 57% and 51% respectively
In all cases, the levels of improvement achieved during the Production phase exceeded the initial results of the Trial phase. This is expected due to higher cumulative densification effects during Production phases .
Due to the mid-project design change, the results are interesting as they provide a clear example of how heave tolerances directly affect amount of improvement achievable. For Zones B, C, and D, more improvement could have been achieved if the 20 mm global heave limit had not been required All Zones achieved the minimum 30% improvement target, however had the tolerance been more stringent this would have resulted in certain Zones not meeting the design requirements


Crosby, Georgia - Mainmark Ground Engineering, Christchurch, New Zealand, gcrosby@mainmark.com
Hnat, Theo - Mainmark Ground Engineering, Christchurch, New Zealand, thnat@mainmark.com

Abstract: Queenstown, New Zealand is a high seismic risk area with liquefaction prone soils. As part of the full redevelopment of a four-storey shopping mall in the centre of Queenstown, a seismic strengthening programme was undertaken to increase the structure’s seismic rating to 75% NBS. In addition to extensive superstructure works, the retrofit design included ground improvement through Resin Injection for liquefaction mitigation. The geotechnical strengthening works were carried out to create a 5 m non-liquefiable crust beneath the structure by increasing the equivalent clean sand penetration resistance, qc1Ncs, by 30%. This case study demonstrates the adequacy of liquefaction mitigation through Resin Injection and how incorporating ground improvement into seismic strengthening design can improve a structure’s performance with a more cost-effective solution.
Keywords: Seismic Strengthening, Retrofit, Ground Improvement, Resin Injection


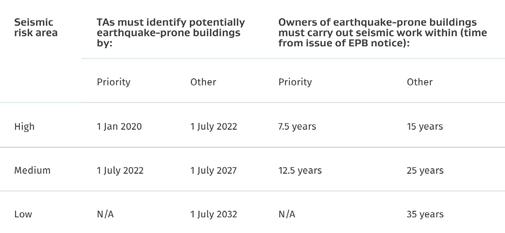
After the devastating Christchurch earthquake sequence in 2010 and 2011, the New Zealand government took steps to address the potential for further loss of life and extensive business interruption in the event of future earthquakes. The Building (Earthquake-prone Buildings) Amendment Act (2016) requires buildings that are identified as potentially earthquake-prone to undergo remedial works within a risk-based timeframe. The country is split into high, medium, and low seismic risk areas and the timeframe to complete the seismic upgrades is dependent on which risk zone a structure is located in. As shown in Figure 1, the timeframes given to building owners range from 7.5 to 35 years depending on the building’s location and priority level.
Earthquake-prone buildings are identified through a seismic building rating system developed by the New Zealand Society of Earthquake Engineers (NZSEE, 2014). This system assigns a percentage rating of New Building Standard (%NBS), as seen in Table 1, to a structure after a seismic inspection has been carried out
If a building receives a %NBS rating of less than 34%, its owners are legally required to undertake seismic strengthening works or demolish the structure (Parliment New Zealand, 2016). Some owners have also been opting to increase the seismic resilience of their structures to above 67% NBS, as a higher score can add value to the property in regard to leasing and insurance (Ferner, 2018).
A central city shopping centre in Queenstown, New Zealand had to undergo seismic strengthening to increase its %NBS rating. The strengthening works consisted of structural and geotechnical upgrades. This paper explores the application of the geotechnical solution that was implemented and how the performance of the ground relates to the structural design.
The site of the shopping centre is located in close proximity to several fault systems. An analysis determined the soil profile between 2.5 m and 19 m below the basement floor is liquefiable under both ULS and 67% ULS loads, except for a few minor layers. An assessment of the residual strength of the soil once it has liquefied showed an estimated bearing capacity of less than 50 kPa. This means that the building loads will exceed resistance and bearing failure is likely. This will occur under both 67% NBS and ULS loads. Therefore, to ensure the structural strengthening elements can perform as designed both during and after a seismic event, the ground improvement portion of the design was incorporated.
The ground improvement solution was carried out in the basement of the mall. The injection points were drilled through the slab at 1.2 m triangular spacings which was determined to be the most efficient design spacing during the EQC (Earthquake Commission) trials. The treatment depth of the soils was between 1.5 – 5 m in the liquefiable soils directly below the footings. This zone was chosen to be treated to mitigate the possibility for liquefaction triggering and the resultant reduction in bearing capacity. In order to achieve an overall building performance of 75% NBS, the target for ground improvement was a minimum increase in the normalised cone resistance, qc1Ncs of 30%.
Following four years in development, and with extensive trials and testing completed, the internationally peer reviewed report for the Resin Injection Ground Improvement Research Trials was released in June 2017. The trials were jointly funded by New Zealand industry bodies, MBIE and EQC, and were carried out in the Christchurch Red Zone, where the worst liquefaction-induced building damage was observed during the Christchurch earthquake sequence (Cubrinovski et al., 2011). The results showed that significant improvement was achieved in soils with a soil behaviour type index (Ic) less than 2.1, and a reduced level of improvement for Ic values up to 2.3 (Traylen et al., 2017). The findings regarding Resin Injection for ground improvement and liquefaction were a significant development for the ground engineering industry in New Zealand, which now has a new ground improvement methodology to consider when addressing at-risk buildings and structures susceptible to weak soil conditions.

Resin Injection for liquefaction mitigation is a soil densification mechanism driven by the expansion of an injected polyurethane resin product (although other secondary effects such as improvement in composite stiffness, cementation, and horizontal stress increases are also present). The expanding resin injection process typically results in a ‘veining’ of expanded material distributed through the soil mass as dykes, sills or networks of sheets or plates, typically tens of millimetres thick (as shown in Figure 2). The expansion of these veins is what results in densification of the soils (Traylen et al., 2017).
The extent of ground improvement is verified through ground investigations conducted before and after Resin Injection. The tests conducted on each project can vary depending on the client’s requests, however, cone penetration tests (CPT) and direct-push crosshole tests (DPCH) are the standard forms of testing.
Fig. 2 - Veining of expanded resin in groundDue to the central location on the main street of Queenstown, access into the shopping centre was heavily restricted. A crane was constructed within the building footprint, and provided the primary means of loading building supplies into the construction zone. The equipment required for Resin Injection was lifted directly into the basement, as seen in Figure 3. The crane remained founded in the centre of the basement for the duration of the retrofit works.

A trial was conducted prior to the full works to validate the Resin Injection design for the site. The trial consisted of an injected 3x3 m area of an injection array with pre- and postimprovement CPT and DPCH testing for verification. The trial reached the target improvement level of 30% increase in qc1Ncs and discovered that the site had a spatially variable soil profile, which was notable even within the 9 m2 trial area. As a key parameter in the design is the soil behaviour type, a variable soil profile meant that the final injection approach needed to both accommodate for these variations across the building footprint and also be reflected in the interpretation of results.
The basement was split into 16 zones (as shown in Figure 4) which determined the order of treatment. Each zone had a set of before and after improvement ground investigations which allowed for the improvement across the whole footprint to be determined by the average of each zone.
Fig. 3 – Resin Injection equipment being craned into the shopping centre
order to operate in the basement. The testing rigs utilised the ground-floor beams as a reaction force to anchor from, as seen in Figure 5 a). Another obstacle was the lack of access to the areas beneath the crane, ramp, and perimeter floor beams, as seen in Figure 5 b). These soils were still able to be treated due to the manoeuvrability of the equipment and by utilising angled injection.

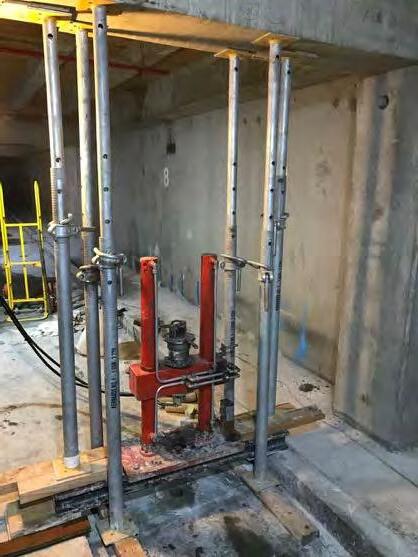 Fig. 5 – a) CPT portable rig and b) angled injection under floor beam
a)
b)
A key constraint with any Resin Injection ground improvement project is the relationship between degree of improvement and heave. Heave is when the structure begins to lift as a side effect of the densification process. The likelihood for heave increases with Ic and can be monitored with floor level surveying. Heave tolerances are often provided in the design, and these specify the global and differential heave allowances of the structure. The global heave is the amount of lift experienced by the structure as a whole and the differential heave is the difference in lift experienced across the footprint of the structure.
The initial design for this project did not specify any heave tolerances but differential heave was to be monitored and reported frequently. However, after the completion of Zone A (the lower four regions on Figure 3), architectural requirements were introduced that resulted in the specification of a 20 mm global heave tolerance. As the amount of heave experienced correlates to the quantity of material injected and the soil behaviour type, the Resin Injection quantities were decreased to reduce the heave.
CPT and DPCH testing provided the information for which the results were analysed. CPT testing was performed at the centroid of the triangular grid of injection points. Therefore, the test records the change in strength at the point of least improvement, offering a conservative value for the soil profile directly in line of the CPT. In comparison, DPCH testing provided an averaged stiffness reading across a 2 m span of the soil profile. This means that the composite stiffness from the injected material is included in the reading. The two tests offer complimentary results that can provide a better understanding when analysed together.
The degree of improvement was determined by comparing the percentage increase in qc1Ncs and the small strain soil stiffness, G0. The liquefaction triggering procedure by Boulanger and Idriss (2014) was used to analyse the CPT data. As recommended in this procedure, the pre-improvement Ic values were used when determining the liquefaction triggering postimprovement. The stiffness of the soil was estimated through the Equation 1 (Robertson et al., 2015) using the shear wave results from the DPCH data.
The test results for each Zone are summarised in Table 2. The results show significant variability of the soil behaviour type across the footprint of the structure, with Ic ranging from 1.74 – 2.27. As experienced in a range of other projects, a reduction in the quantities of material injected is required to manage heave in higher Ic soils. This reduction results in less overall improvement, which is reflected in the results for Zone B3 and D4, which had Ic > 2 and experienced the lowest increase in qc1Ncs. While the relationship between Ic, heave, and improvement is clear, there are also other factors that contribute to the level of improvement achieved.
The relationship between the increase in qc1Ncs and the increase in G0 was not well correlated. Despite a wide range of percentage increases in qc1Ncs values, the post-improvement Vs (and therefore G0) was relatively uniform. This would suggest that there is a point of diminishing returns from a material quantity and resultant level of improvement standpoint. In summary, Resin Injection resulted in a reasonably uniform soil stiffness beneath the structure. In addition, all Zones met the target increase in qc1Ncs of 30% to satisfy the design requirements.
The averaged pre- and post-improvement liquefaction assessment for all zones is shown in Figure 6. The analysis demonstrates a clear increase in qc1Ncs throughout the treatment depths of 1-5 m, in addition to showing that the averaged soil behaviour type is within an ideal range for Resin Injection. The predicted vertical settlement of the soil from the design earthquake (PGA 0.4g, Mw 6.3) is also calculated through this analysis. The average predicted settlement pre-improvement was 125 mm and 75 mm post-improvement.

Another approach to visualise the level of improvement is by varying the PGA, as shown in Figure 7. While the liquefaction analysis shown in Figure 6 only displays the design earthquake, Figure 7 shows expected settlement of the improved soil over a range of potential PGA values. This demonstrates that if a smaller earthquake event were to occur, the reduction in expected settlement is still significant. The structure post-improvement will have a reduction in settlement for all PGA values greater than 0.15g which has many
Following the ground improvement research trials, Resin Injection was recognised as a viable solution to increase the bearing capacity of soil and reduce the potential for liquefaction beneath existing structures. This approach offers large benefits for seismic retrofit of structures, as the strengthening design can be limited by low bearing capacity and / or liquefiable soils.
Resin Injection has been incorporated into numerous seismic upgrades of earthquake-prone buildings in New Zealand, including this upgrade of a 4-storey shopping centre in Queenstown. This project highlighted the constraints in achieving the specified level of improvement and the importance of performing both CPT and DPCH testing. Despite the introduction of mid-project heave limitations, all Zones surpassed the required 30% increase in qc1Ncs and a large increase in soil stiffness was experienced.
This case study demonstrates that incorporating Resin Injection for liquefaction mitigation into the design for seismic upgrades is an effective and low-impact approach. The inclusion of ground improvement in the seismic design increased the resilience of this structure not only by reducing the potential for liquefaction induced damage, but also by ensuring that the extensive structural strengthening would perform as designed.

- Boulanger, R., Idriss, I. (2014). CPT and SPT Based Liquefaction Triggering Procedures. University of California.
- Cubrinovski, M., Bradley, B., Wotherspoon L., Green, R., Bray, J., Wood, C., Pender M., et al. "Geotechnical aspects of the 22 February 2011 Christchurch earthquake." Bulletin of the New Zealand Society for Earthquake Engineering 44, no. 4 (2011): 205-226.
- Ferner, H. (2018). A Seismic Building Rating System - The new Zealand Experience. Auckland.
- Traylen, N., Wentz, R., van Ballegooy, S., Hnat, T., Wotherspoon, L.(2017). Research Results from a Study into Resin Injection for Liquefaction Mitigation. NZSEE.
- NZSEE, NZGS, SESOC. (2014). Guidance for Territorial Authorities and Property Owners on Initial Seismic Assessments. Ministry of Business, Innovation and Employment.
- Parliment New Zealand. (2016). Building (Earthquake-prone Buildings) Amendment Act.
- Robertson, P., Cabal, K. (2015). Guide to Cone Penetration Testing for Geotechnical Engineering Gregg Drilling and Testing Inc.
Resin Injection Ground Improvement as part of the Seismic Strengthening of a


The Waterloo Water Treatment Plant provides a large majority of the Wellington regions potable water . After an earthquake event the performance of this structure is vital to ensure drinking water is available to the region The plant had interbedded silty sand layers that were prone to liquefaction which would result in differential settlement. There was also large variability in the depths and sizes of these liquefiable soil layers across the footprint of this structure .
A Terefirm resin injection trial was conducted to determine its suitability for the project. The target was to not only reduce the expected settlement but provide a more uniform soil profile to reduce the expected differential which is key for the intricate pipe network system within the structure

Following the completion of the Seaview WTP, Wellington Water engaged Main- mark for another critical infrastructure project requiring seismic upgrades In 2021, Mainmark completed a Terefirm trial for the Waterloo Water Treatment Plant.
Project overview:
• Trial: 1 trial
• Target: non-liquefiable crust.
• Treatment Depth: 10 m bgl .
• Ground Conditions: Spatially variable, interbedded silty / clayey sands
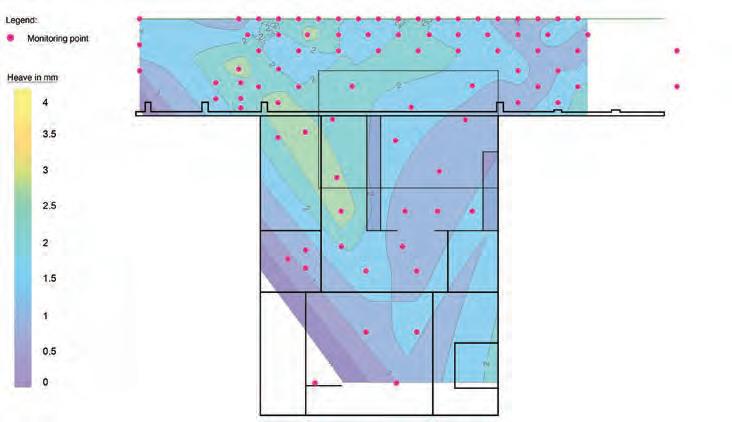
• Heave Limit: 2 mm heave on vital structures
This trial had a number of elements that complicated the design . The plant was operational, and a 2 mm heave limit was placed on the pipe structures The plant was also adjacent and parallel to the rail corridor as seen in Figure 10, with which was also limited to 2 mm of heave
Extensive monitoring was undertaken to ensure the heave was kept within tolerance . Survey pegs were set up within and surrounding the trial pad These locations were monitored during injection to measure the lift in real time Levels were then taken post injection to produce heave maps as seen in Figure 11 . These maps create a clear picture of the recorded lift .
 Figure 10 Proximity of the Waterloo WTP to the rail corridor
In addition, the soil at this site was heavily interbedded and spatially variable Interbedded soil layers require an altered approach as injection into layers of Ic > 2 4 resulted in no improvement yet exhibited the most heave. Therefore, when injecting into interbedded soil profiles avoiding the high IC layers is required
The Waterloo WTP trial approach accounted for the interbedded soil profile. The treatment depth was targeted to the sandy soil layers from 7 – 10 m This targeted approach allowed for the target amount of material to be injected into the liquefiable layers, as seen in Figure 12, without exceeding the stringent heave limitations in place . This approach resulted in a 36% improvement in qc1Ncs for the sandy layers as seen in Table 4
The WWTP trial provided more data which is being processed to further refine the Terefirm design models . These models will allow for some projects to go ahead without trial, given the appropriate soil conditions However, the complicated nature of the surface structures and soil profiles involved in this project clearly highlighted how valuable a trial is for refining a specific engineered solution when dealing with complex projects .
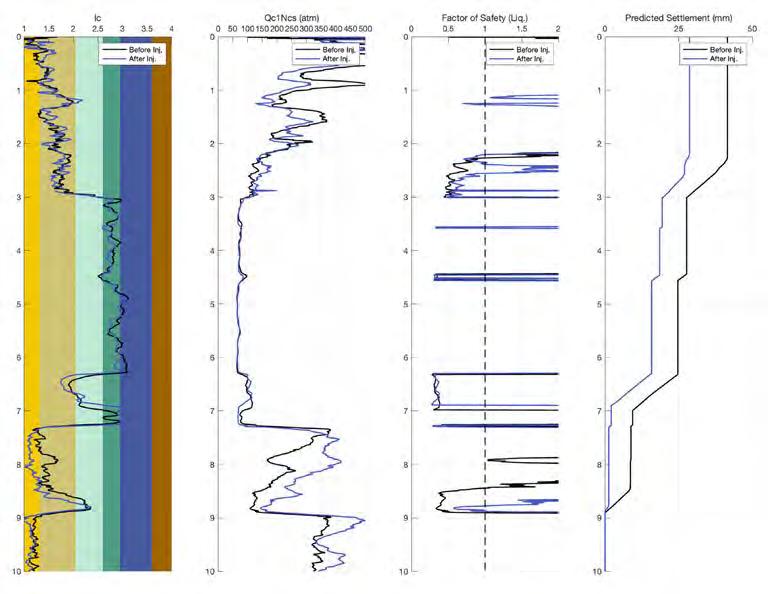 Figure 12. Pre- and post-improvement CPT analysis for Waterloo WTP.


Nick J. Traylen, B.E., FEngNZ, CPEng,1 Frederick JWentz, M.Sc. PE, GE, CPEng2, Sjoerd Van Ballegooy, Ph.D.,3 Liam M. Wotherspoon, Ph.D.,4 Theo Hnat, B.E.,5 and Russell Deller6
1Geotech Consulting Ltd, Unit 4, 6 Raycroft Street, PO Box 130-122,Christchurch8141, New Zealand; e-mail: ntraylen@geotech.co.nz
2Wentz-Pacific Ltd, PO Box 415, Napier 4140,New Zealand; e-mail: rwentz@wp-geo.co.nz
3University of Auckland, Private Bag 92019 Auckland Mail Centre,Auckland 1142, New Zealand; e-mail: l.wotherspoon@auckland.ac.nz
4Tonkin + Taylor Ltd,105 Carlton Gore Road,PO Box 5271 Wellesley Street,Auckland 1141, Zealand; e-mail: SVanBallegooy@tonkintaylor.co.nz
5Mainmark Ground Engineering Ltd, 108 Bamford St,PO Box 282,Christchurch 8140, New Zealand; e-mail: thnat@mainmark.com
6Mainmark Ground Engineering Ltd, 169 Sailors Bay Rd, PO Box 191,Northbridge NSW 1560, Australia;e-mail: rdeller@mainmark.com
Noting that injection of expanding resin mixtures into the ground has long been used worldwide for the re-levelling of buildings that have suffered foundation deformations, the aim of this study was to examine whether the same process could also be a viable form of ground improvement, primarily for liquefaction mitigation. Acontrolled field investigation was carried out into the efficacy ofthis ground improvement technique, in which three test sites were selected for the construction of resin-injected test panels. The pre- and post-improvement soils at all three sites were assessed using a variety of methods. The results of thestudy show that significant improvements in soil density and stiffness were achieved, thus demonstrating that resin injection is a viable ground improvement method in the right soil conditions.
There are few practical methods currently available for liquefaction mitigation beneath existing structures. One such method that has now been shown to be viable is the injection into the ground of expanding resin.This methodis commonly used for the lifting or ‘level correction’ of buildings. For this purpose,expanding resin mixes are injected into the ground at relatively shallow depths to induce ground heave and building lift. It is logical to expect that this process also results in compaction or densification of the ground (in a similar way to compaction grouting). As such, resin injection was seen as potentially having application for liquefaction mitigation or other situations where ground densification is required; particularly whereaccess is limited such as within existing buildings.
A peer-reviewed field study of the resin injection process was carried out at three sites located in Christchurch New Zealand within the residential ‘Red Zone’ (considered representative of some of the more liquefaction-prone soils in the city). At these sites a series of resin injection test panels were installed, and pre-injection and post-injection soil density and stiffness were measured using cone penetration testing (CPT), geophysical testing (Vs and Vp testing), dilatometer testing (DMT)and plate load testing This paper presents the findings from the field study. The results of other relatively recent testing and commercial application of resin injection for liquefaction mitigation are also briefly discussed

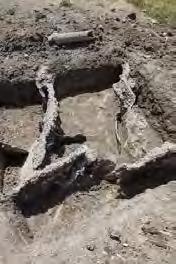
Injection tubes are driven into the ground at regular intervals, and at each injection point an injection nozzle is attached to the injection tube. Composite resin material is pumped under pressure to the base of the tube, where it enters the soil matrix. In a typical ‘bottom up’ installation the tube is withdrawn either on a continuous basis with set volumes of material being injected per unit length, or in set stages with set volumes of material injected at each stage.
The low viscosity resin penetrates the soil mass along pre-existing planes of weakness or through fracturing of the soil mass The resin mix reacts chemically soon after injection, changing from a fluid to an (inert) solid and expandingrapidly up to many times its original volume. The degree of expansion dependsonthe soil density, confinement pressure, and the resin material selected, and can be in the order of 5 to 15 times the injected volume. The expansion process results in compaction of the adjacent soils, due to new material being introduced into a relatively constant soil volume. The mitigation mechanism therefore is primarily from densification of the soil, although secondary effects including cementation of soil particles and an increase in soil stiffness (i.e., the “composite” stiffness of the soil/resin) are also present
The resin injection process was observed to result in a ‘veining’ of material distributed through the soil mass as dykes, sills or networks of sheets or plates, typically tens of millimetres thick (Figure 1)
In 2013 a series of ground improvement trials were undertaken in Christchurch by the New Zealand Earthquake Commission (EQC - in press) to examine the performance of various forms of ground improvement, primarily for application in the repair and rebuild of the Christchurch residential building stock following the 2010-2011 Canterbury Earthquake Sequence. This study included a preliminary examination of resin injection - a single panel was tested and showed an increase in liquefaction resistance by a number of mechanisms. CPT tip resistance measurements demonstratedanoverall increase in density of the soil, as illustrated in Figure 2. Shear wave velocity (Vs) testing indicated that the stiffness of the improved soil block increased. Truck-mounted vibroseis (e.g. T-Rex) testing showed a reduction in cyclic shear strain in the improved soils along with a significant reduction in excess

pore pressure generation. Subsequent large-scale blast testing to induce liquefaction settlement showed a significant reduction in ground surface settlement within the resin test panel relative to the unimproved ground.
Following on from the 2013 EQC trials, the resin injection technology was used in 2015/2016 for the relevelling, repair, and upgrade of three adjoining large format retail buildings in Christchurch that had suffered liquefaction-related settlement damage in the Canterbury Earthquake Sequence The first stage of the remediation works consisted of liquefaction mitigation by densification and stiffening of the underlying shallower soils by Mainmark Ground Engineering Ltd, using their TeretekTM resin injection methodology. The low level of intrusion required to carry out the process was a particular advantage for this operation (Figure 3), as the three retail outlets (including a large supermarket) were able to continue trading uninterrupted through the busy Christmas trading period.


The project objective was to densify the silty sand soils beneath the building in the upper 4 to 7m, to reduce or eliminate liquefaction triggering at the design level of ground shaking. The resin injections resulted in increases in qc1Ncs in the order of 40% (Figure 4), and decreases in calculated settlements in the treated zones of 40 to 80% at 100-year return periods of shaking (Traylen et al. 2016, Hnat et al. 2017).
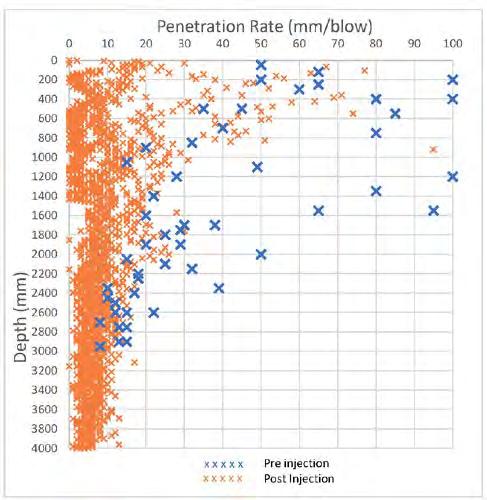
Another example of the commercial application of this technology is the 2017 application of resin injection for the purposes of ground densificationin the upper 4 metres of the soil profile, as part of the earthquake repair and upgrade of a retirement home in Christchurch. The preand post-installation testing was carried out with a simple dynamic cone penetrometer, and shows a noticeable increase in the stiffness of the treated soils; particularly in the cleaner sands below a depth of about 1m (Figure 5).

The 2013 EQC ground improvement trials were carried out in Christchurch in the abandoned ‘Red Zone’ of Avondale and Bexley. The three sites (sites 3, 4, and 6) used in this study were adjacent to the areas used in the EQC field trials described above but located to avoid areas which had been affected by the installation of other ground improvement methods and instruments, and also to avoid areas affected by liquefaction-inducing blasting trials that were carried out in the 2013study.
The soils at sites 3 and 4 were broadly similar and generally consisted of fine silty sand and sandy silt (with some interbedded thin silt layers) to a depth of about 3 to 4.5m, overlying clean fine to coarse sands. Fines contents at sites 3 and 4 ranged from approximately40 to 90% in the upper silty soils, and 1 to 3% in the lower sands. The soils at site 6 were notably less silty, consisting of interbedded sand and silty sand (fines content approximately 20%) in the upper 1.4m then clean fine to coarse sand(fines content 0 to 7%).The depth to groundwater at the three test sites ranged between 0.7m and 1.2m below ground level Pre-treatment CPT qc values ranged from about2 to 5 MPa in the upper 3 to 4m of the soil profile, and 5 to 14 MPa between 4 and8m depth.
Being primarily a field trial, only limited laboratory soils testing was carried out - the results of which are tabulated in Table 1below.
Figure 6 below presents particle size distributions for the sandier soils at each site; more detailed soil behaviour types can be inferred for each site form the CPT derived Ic parameter, and densities from the qc data as shown in Figures 9 and 10.
Each of the 8m x 8m test panels was set out with a 1.2m triangular grid of resin injection points (Figure 7). The tests carried out wereCPT, direct-push crosshole (Vs/Vp), DMT and plate load tests. Borehole drilling and sampling, and laboratory testing was also carried out to determine soils fines contents. Table 2 summarizes the number of tests carried out at each testpanel.


Plywood was laid on the ground (over compacted gravel) and then concrete blocks were laid to give a 14 kPa surface load. This load was intended to approximate a floor/slab load within a typical commercial building – or a load that could be applied by the ground improvement contractor to provide additional confining pressure.Steel plate was placed over the blocks to provide astable working platform. Additional blocks were then laid to superimpose a 28 kPa strip footing load. Pilot holes were drilled and cored through the steel plate, concrete blocks, and plywood to allow the installation of the grout tubes into the ground.
The ground was treated with injected resin by first applying a ‘capping layer’ from 0.5 to 1.5m, and then injecting from 6m depth upwards on a ‘bottom up’ basis. After a “rest period” of at two weeks the concrete blocks were removed, and post-injection testing was carried out. The test panel at site 3 was partially exhumed to expose the resin veins in the ground (Figure 1).

The trial showed a clear trend of increased soil densities and stiffness at all sites, with the level of increase varying with soil characteristics. Improvements in the soils are noticeable up to a metre below the base of treatment. CPT qc increased on average 80 to 100%, or about 4 to 12 MPa This corresponds to increases in relative density (Dr) in the order of 30%. Modulus of
Subgrade Reaction (ksb) increased 50 to 90% (from plate load tests). Shear wave velocities (Vs) increased on average 40% -(50 to 75 m/s) at Sites 3 and 4, and 75 to 100 m/s at (the sandier) Site 6; indicating an approximate doubling of soil shear stiffness. Dilatometer testing showed an increase in horizontal stress index KD of 50 to 150%. Table 3 provides a summary of results across all three sites.

The averaged results from all site investigation methods at Site 3 are presented in Figure 9.

There is variability in the change in qc1Ncs values at each site through the different soil types; on average, there is a 65 to75% increase - approximately 50 atm at sites 3 and 4 (the “siltier” sites), and 100 atm at site 6. The data therefore indicates a correlation between degree of improvement with soil type (e.g. Ic value), with sandier soils undergoing a greater degree of improvement than the siltier materials. Experience in Christchurch and elsewhere is that this is to be expected for a treatment method where the primary mechanism of improvement is densification.
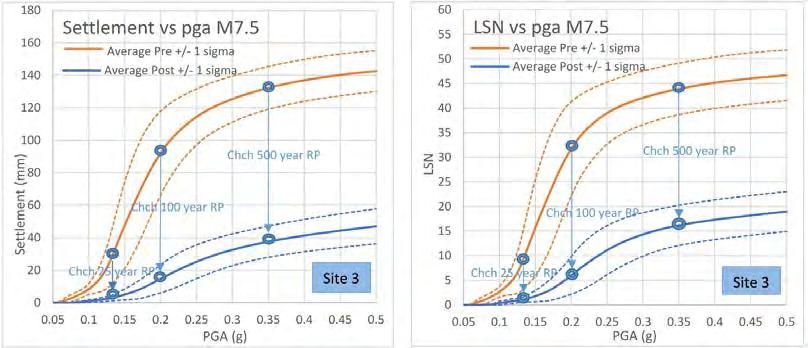
There was no attempt made to control ground heave at the test panels (given there was no adverse consequence to this), and the ground heave that was recorded averaged 40 to 70mm across the three sites (70% of the lift was created during the injection of the capping layer in the upper 1 to 1.5m of the ground profile). Ground heave and general surface disturbance from injection was observed to be noticeably less than that for other technologies such as stone columns, compaction grouting and driven piles. Experience in Christchurch, New Zealand is that some controlled ground heave can be beneficial in cases where a building also requires level correction. In other cases, allowances need to be made so that the building can accommodate some changes in final floor level. For heavy buildings, or on sites where the soils are only being treated below about 2m depth, significant ground heave may not occur.
The CPT data was analysed for liquefaction triggering potential, (Boulanger & Idriss,2014), andfree-field settlements (Zhang et al.2002). The results for site 3 are presented in Figure 11, with a selection of return period events for Christchurch highlighted. Considerable reductions in settlements and liquefaction severity number, LSN (van Ballegooy et al., 2014) are indicated. At the 25-year return period there is a reduction in these values of approximately 90%. As the return period increases to 500 years, the reduction is still over 70%. Across all three sites, calculated liquefaction settlements and LSN values were reduced by 50 to 80%. The magnitude of reduction in these values suggests that the implied surface damage potential for these sites from liquefaction is significantly reduced.
The results of this study, as well as application in two commercial projects, demonstrate that resin injection can be an effective ground improvement method for mitigation of liquefaction potential, and also for increasing foundation bearing capacities, in sandy soils (including the siltier sands – e.g., sandy soils with CPT IC values up to about 2.0). Significant improvements in soil density and stiffness have been demonstrated. It has been noted that decreasing fines content, and increasing confining pressures, lead to better densification effects in treated soils. While the fines content of a soil deposit may constrain the applicability of this technology at any particular site, confining pressures can often be applied through the use of portable kentledge if necessary
This trial, and commercial application of the technology have shown that the resin injection ground improvement methodology can be successfully applied for liquefaction mitigation or bearing capacity enhancement to cleared sites as well as to ground beneath existing buildings, structures, and infrastructure assets (for which there are currently few viable options).
A comprehensive research report on these trials (Traylen, 2017) is available through the New Zealand Geotechnical Society (NZGS) website (www.nzgs.org).
Boulanger, R.W. & Idriss, I.M. (2014).“CPT and SPT based Liquefaction Triggering Procedures”. Report No UCD/CGM-14/01 Dept of Civil & Environmental Engineering, College of Engineering, University of California at Davis.
EQC (in press). Ground Improvement Trials Report.
Hnat, H., Traylen, N., Wentz, R, van Ballegooy, S. (2017).“Resin Injection for Seismic Liquefaction Mitigation Beneath Existing Commercial Buildings in Christchurch”. NZSEE Conference 27-29 April 2017, Wellington NZ
Traylen, N., van Ballegooy, S., Wentz, R. (2016).“Liquefaction Mitigation beneath Existing Structures Using Polyurethane Grout Injection”. NZSEE Conference 1-3 April 2016 Christchurch NZ
Traylen, N. (2017).“Resin Injection Ground Improvement Research Trials”. Research Report. www.nzgs.org/library/resin-injection-ground-improvement-research-trials/
van Ballegooy, S., Malan, P., Lacrosse, V., Jacka, M., Cubrinovski, M., Bray, J. D., O'Rourke, T. D., Crawford S.A., Cowan, H. (2014).“Assessment of liquefaction-induced land damage for residential Christchurch”. Earthquake Spectra, February 2014, 30 (1), 31-55.
Zhang, G., Robertson, P., & Brachman, R. (2002).“Estimating liquefaction-induced ground settlements from CPT for level ground”. Canadian Geotechnical Journal, 39(5), 1168-1180.
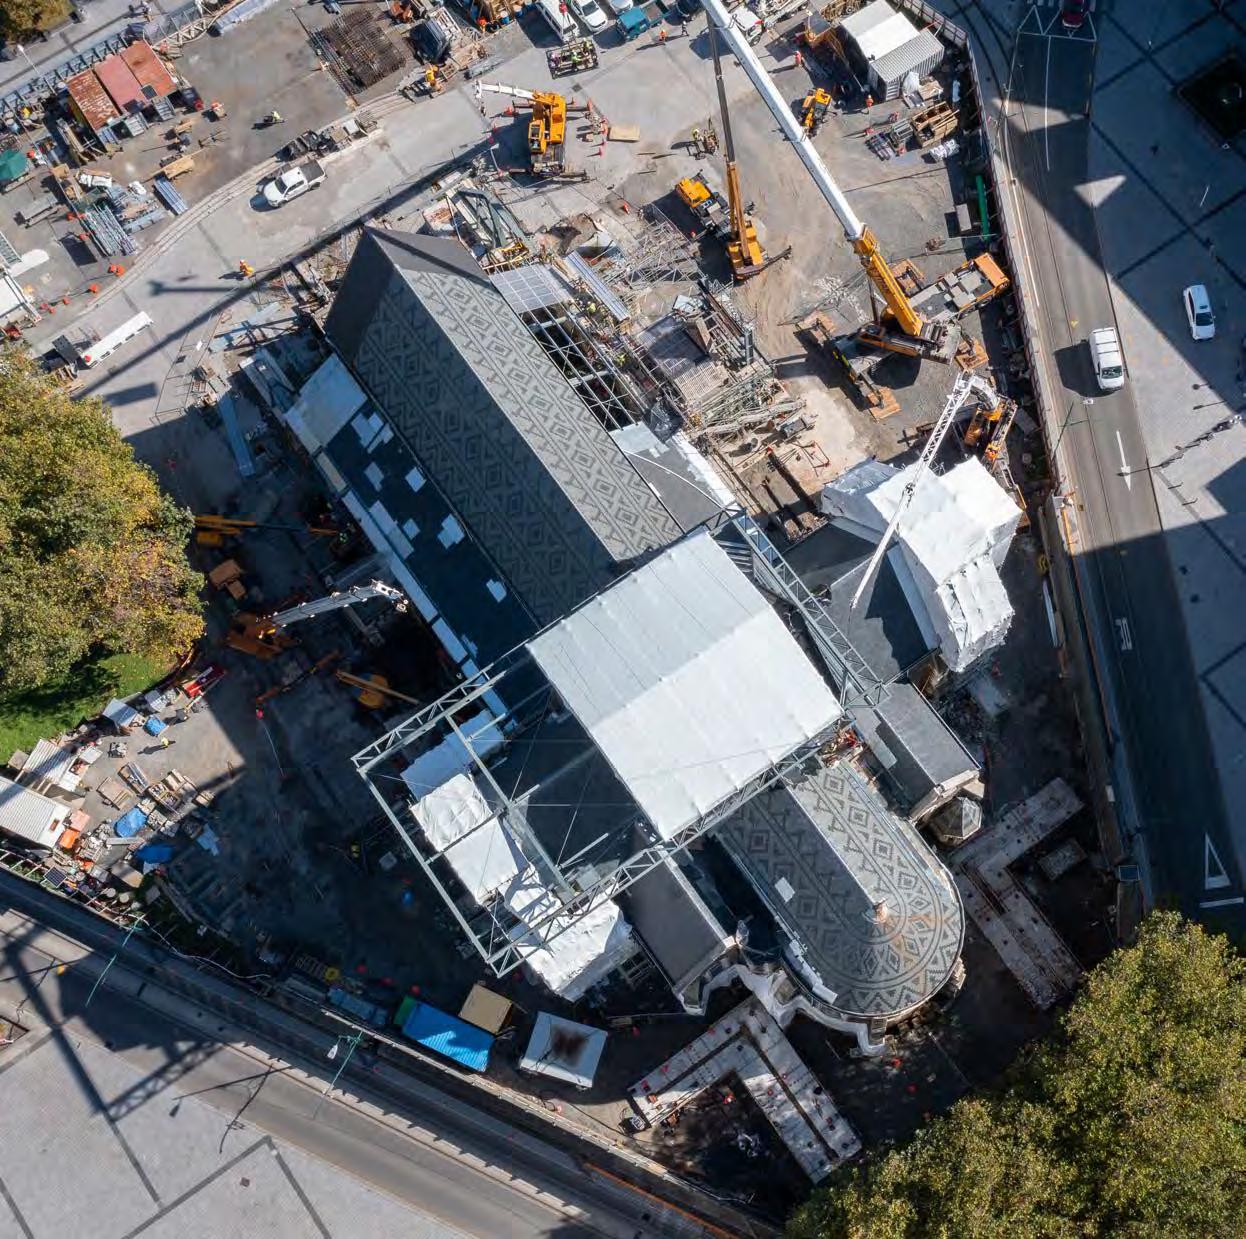
The Christ Church Cathedral, originally built in 1864, suffered devastating damage as a result of the 2011 6 .3 magnitude earthquake . In 2020, the rebuild works commenced to begin restoring the symbolic heart of the city
The first phase of the rebuild involved the stabilisation of the superstructure. The purpose of this phase was to make the structure as safe as possible to allow people inside to carry out strengthening works Part of this involved stabilising the end apse of the structure . The building assessment showed there was no viable load path for the unreinforced masonry walls, and in another earthquake of similar magnitude they would collapse Large foundation pads with steel frames were constructed to provide an alternative load path for the masonry walls, which then allowed for the retrofit works to be conducted The performance of these frames is vital as they carry all lateral load from the masonry walls
A geotechnical assessment revealed potentially liquefiable soils beneath the foundation pads of the apse’s steel frames The liquefaction potential of these soils needed to be reduced to ensure the foundations could provide the designed level of lateral support Mainmark were contracted to decrease the liquefaction triggering potential by increasing the qc1Ncs values of the soils beneath the foundations of both frames
Terefirm Resin Injection was conducted beneath both apse foundations from a depth of 1.7 m to 3 m below ground level
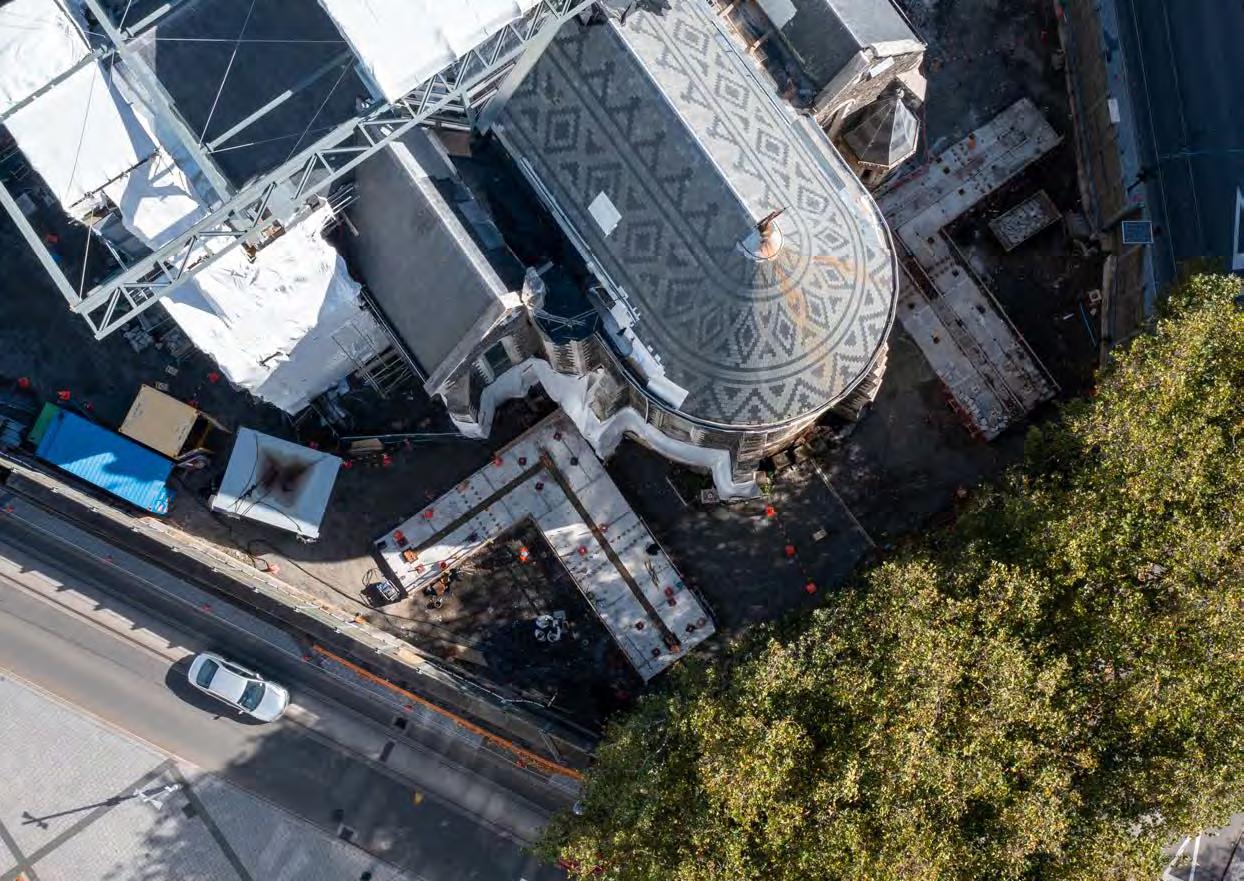
Project overview:
• Trial: A section of foundation was preliminarily injected and validated through CPT testing before commencing the rest of the pad’s injection
• Target: A qc1Ncs value based on the spatial liquefaction performance .
• Treatment Depth: Varied from 1 7 – 3 m below ground level (bgl)
• Ground Conditions: Variable soils, sandy gravel to silty sand
• Heave Limit: 7 .5 mm on foundation pad, 0 mm on cathedral
Mainmark was contracted to perform the works prior to the construction of the south foundation pad This allowed for the injection core holes of 50 mm to be cast into place as the slab was poured This decreased the operational timeline for this pad as the drilling of injection holes through the slab was not required .
The north foundation pad however, had been constructed prior to Mainmark’s involvement . These foundation pads had extensive steel reinforcement, as they were designed for large, concentrated lateral loads . With a typical foundation slab, the injection array can be slightly adjusted to avoid steel reinforcement, however, the reinforcement quantity and location within the slab provided significant disruption to the injection layout
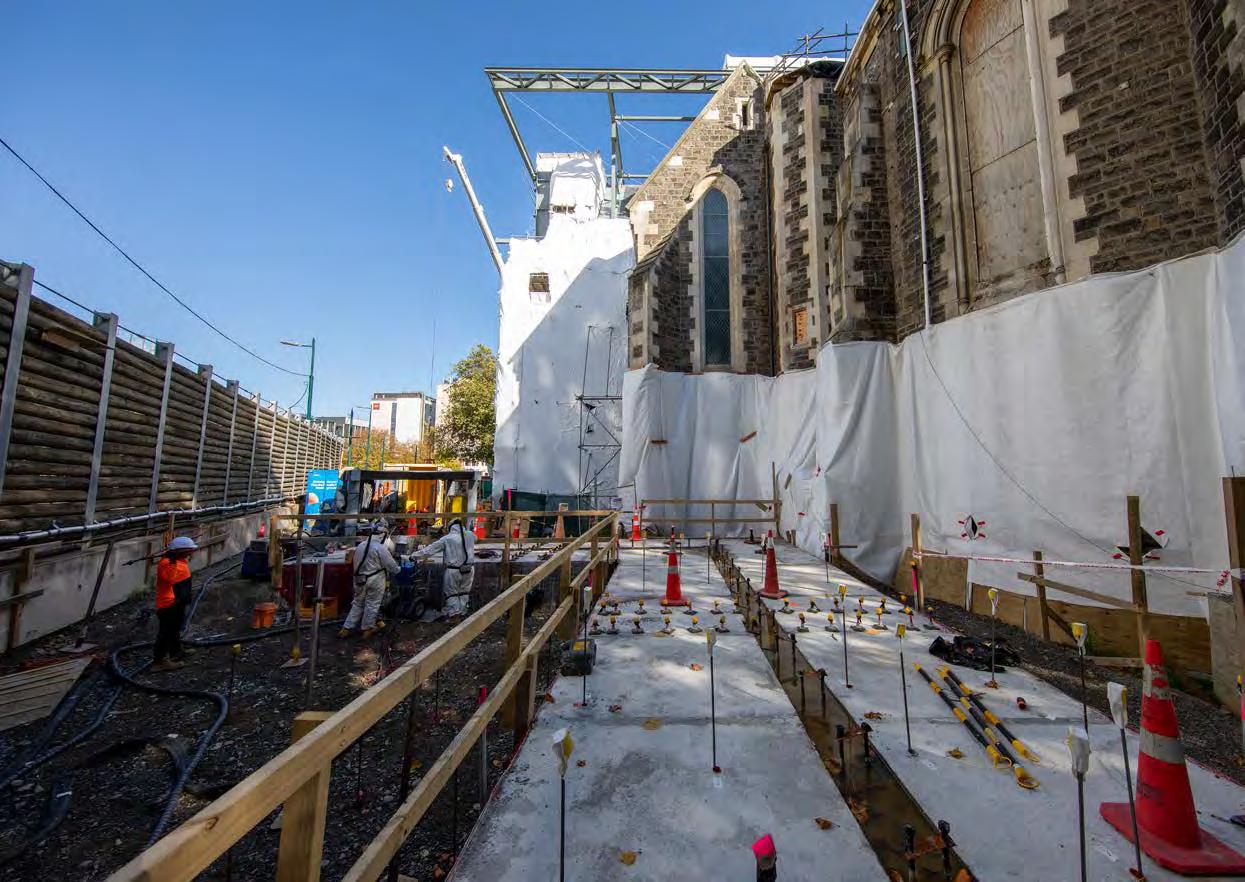
Based on extensive past project data, the optimal injection spacing for Terefirm Resin Injection is a 1 .2 m triangular grid . Since the standard injection layout for this project was not practical, alterations to the design were
made . The injection spacing was increased, which would have resulted in a reduction in improvement for the areas with the largest distance between injection points . To compensate for this, the material quantity was increased to achieve greater improvement in the injection zone of influence. The design specification needed to consider that there were small zones of reduced improvement However, the overall liquefaction risk remained low as these areas were surrounded by highly improved ground and were also spatially isolated within the foundation pad .

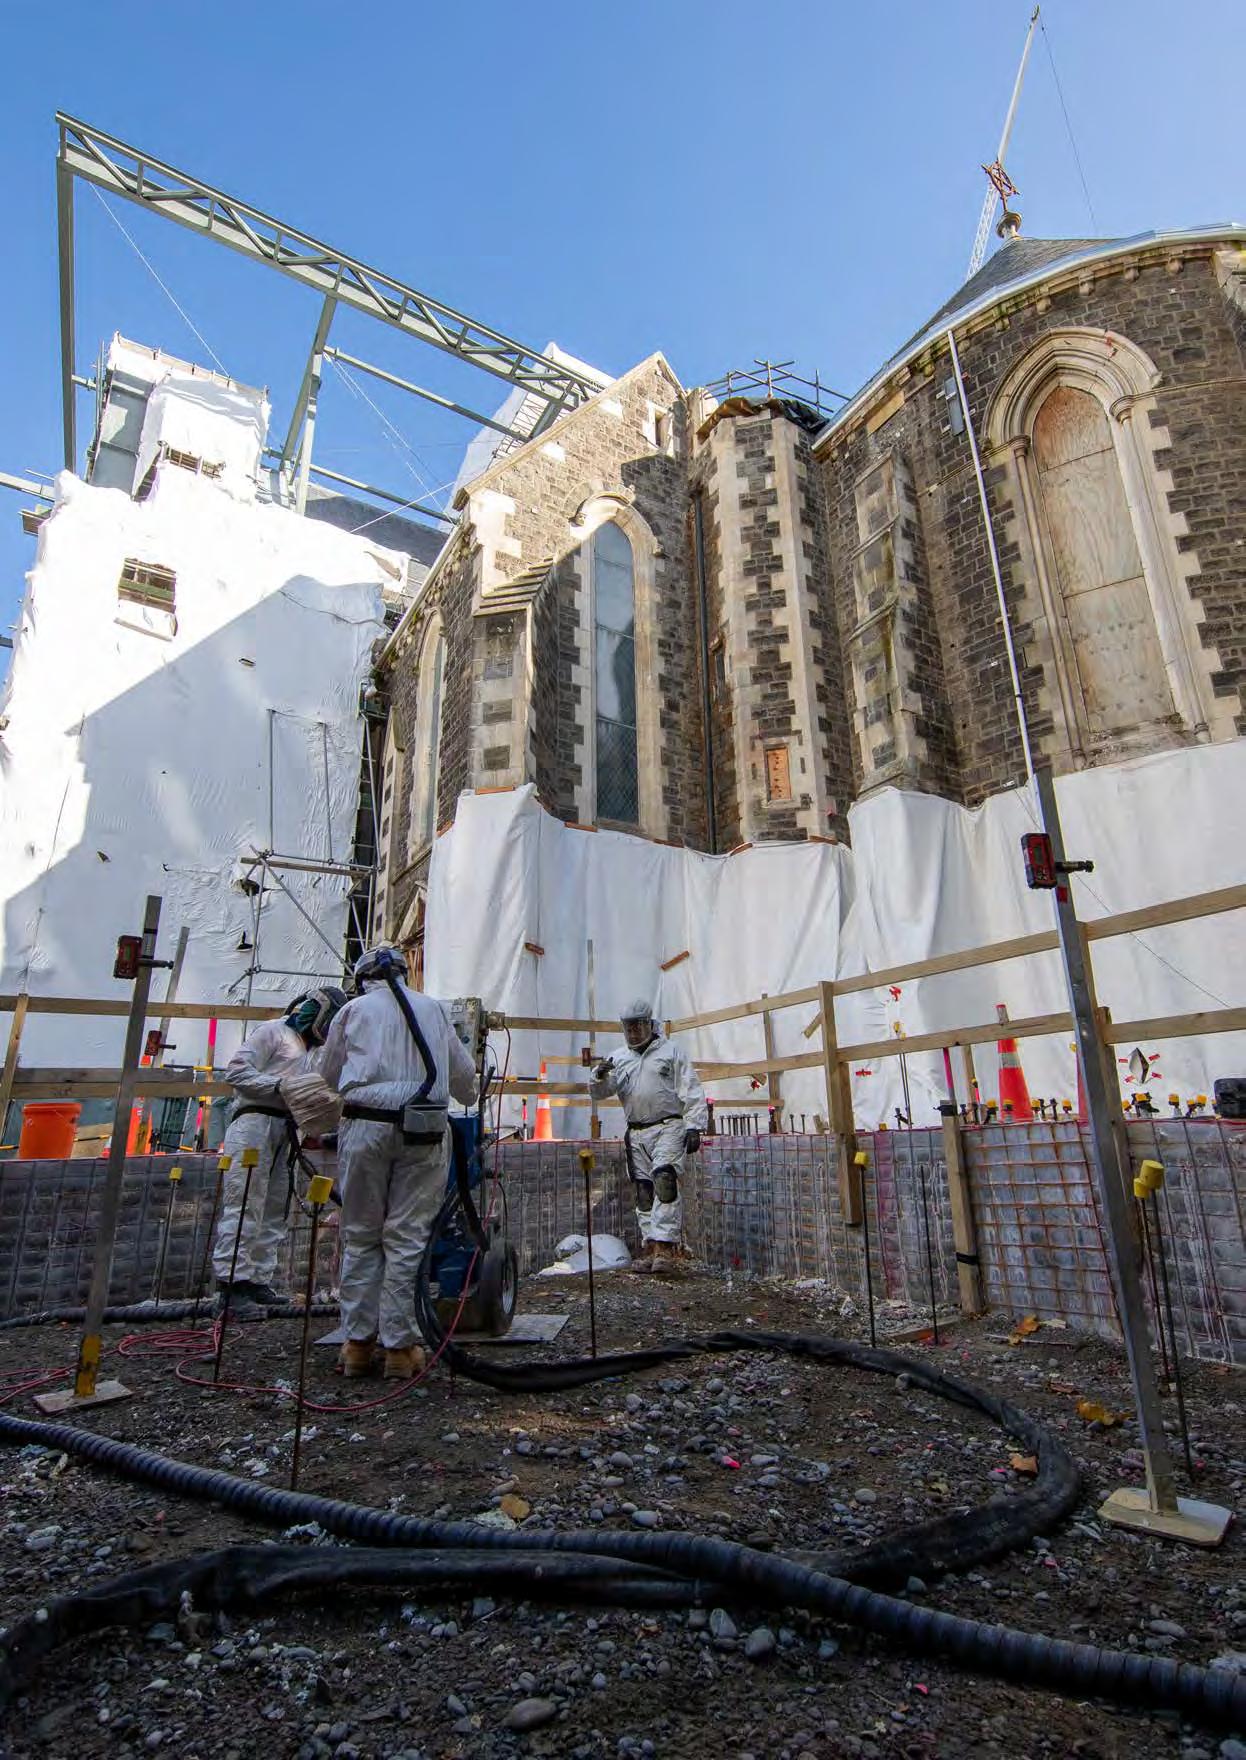
Comparison of the Degree of Soil Stiffening from Stone Column and Engineered Resin Installation Using Direct Push Crossshole Testing

Mainmark Ground Engineering Ltd, Christchurch.
This paper outlines a comparison of the results from a full-scale field testing program designed to assess the degree of soil stiffening resulting from the installation of shallow ground improvement techniques. Separate panels comprising stone columns and engineered resin injection were installed in soils ranging from clean sands to sandy silts at a number of sites in Christchurch, New Zealand for liquefaction mitigation. Direct-push crosshole tests were performed before and after ground improvement using custom-built cone sensors to measure compression wave (Vp) and shear wave (Vs) velocities at 0.2 m depth intervals. Tests were performed across the installation area to characterise the composite properties of the soil/column and soil/resin matrix, and in-between the installation area to characterise the properties of the soil within the improved zone. Generally, both methods were effective at stiffening clean sand soil profiles, with the effectiveness of the technique shown to reduce in soils with higher fines content. The absolute increase in stiffness and the effects of confinement is investigated for each technique. A significant lowering of Vp was identified at some sites after installation, indicating reductions to the degree of soil saturation. The change in the degree of saturation over time is discussed, as unsaturated soil conditions have the potential to increase liquefaction resistance.
A series of ground improvement trials were undertaken in Christchurch by EQC (in press) in the latter half of 2013, to assess the effectiveness of a range of shallow ground improvement methodologies. As part of that research, both stone columns (SCs) and resin injection (RI) were examined. Following on from that series of trials, further detailed testing was carried out on resin injection as a ground improvement method (Traylen et al., 2017).
To assess this stiffening effect, compression wave (Vp) and shear wave (Vs) velocity measurements were made throughout the depth of the ground improvement zones using direct-push crosshole tests (DPCT) with custom-built cone sensors containing a threedimensional geophone array. The properties of the virgin soil were characterised by testing before the installation of SCs and RI. Following ground improvement installation, testing was again carried out to characterise the properties of the improved zone, with a focus on both of the soil between the ground improvement installation points and the composite properties of the soil and the ground improvement elements (i.e. both SCs and RI). Along with DCPT, cone penetrometer tests (CPT) were carried out before and after installation to characterise the virgin soil and the soil between the improvement elements. This paper discusses and compares the degree of soil stiffening between the stone column installations and resin injection from four case study sites in Christchurch, New Zealand.
thesoilmatrix.Inatypical ‘bottomup’ installationthetubeiswithdrawneitheronacontinuousbasiswithsetvolumesofmaterialbeinginjectedperunitlength,orinpre-determined intervalswithsetvolumesofmaterialinjectedateachinterval.
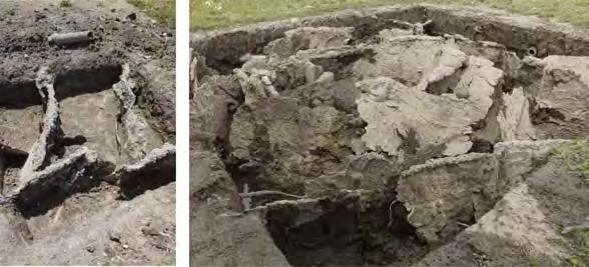
Both ground improvement methods provide liquefaction mitigation primarily as a result of densification of the soil. The resin injection achieves this from an expanding polyurethane resin injected into the ground, while the stone columns achieve this through the insertion of vibratory probe and deposition of aggregate. Other secondary effects such as increase in composite stiffness, increase in horizontal stresses and potential cementation are present for one or both of these methods.
Resin injection uses injection tubes which are driven into the ground at regular intervals, and at each injection point an injection nozzle is attached to the injection tube. Multipart materials are mixed at specific pressures and temperatures at the nozzle, and the live composite material (‘resin’) is then pumped down to the base of the tube, where it enters the soil matrix. Either ‘top down’ or ‘bottom up’ methods can be employed. In a typical ‘bottom up’ installation, the tube is withdrawn either in set stages with set volumes of material injected at each stage, or it is withdrawn slowly on a continuous basis, with set volumes of material being injected per unit length that the tube is withdrawn.
Theresinpenetratesthesoilmassalongpre-existingplanesofweaknessandbyfracturing thesoilmass.Theresinmixturereactschemicallysoonafterinjection;changingfromafluid toan(inert)solid.Themixtureis “tackfree” withinseconds,andis90%curedwithinanhour ofbeinginjected.Attheonsetofthereaction,themixturerapidlyexpandsuptoseveraltimes itsoriginalvolume.Thedegreeofexpansioncanbeintheorderof3to15timestheinjected volume,anddependsonthesoildensity,confinementpressure,andtheresinmaterialselected. Theexpansionprocessresultsincompactionofthesurroundingsoilsasaresultofnewmaterialbeingintroducedintoarelativelyconstantsoilvolume.Thegroundimprovementmechanismisprimarilydensificationofthesoil,however,secondaryeffectsincludingcementationof soilparticlesandanincreaseinsoilstiffness(i.e.,the ‘composite’ stiffnessofthesoil/resin structure)alsooccur.
Once injected, the low viscosity resin both permeates the soil to a limited extent, and also penetrates under pressure along planes of weaknesses within the soil profile. The resin mix chemically reacts soon after injection, rapidly expanding to many times its original volume. The expansion of the injected material results in compaction of the adjacent soils, due to new material being introduced into a relatively constant soil volume.
Duringthefieldtests,theresinwasobservedtopenetratethesoilmassasdykes,sillsor networksofsheetsorplatestypicallytensofmillimetresthickasshowninFigure1.
The stone column ground improvements tested were constructed using a dry bottom feed method and river gravel-derived aggregate with at least two broken faces. A vibroflot was first vibrated/pushed down to the desired depth of improvement, then compressed air feeds aggregate though the vibratory probe and out through its base. As the vibroflot is partially withdrawn, aggregate is delivered into the resulting void and the weight of the vibroflot is applied onto the aggregate in combination with a vibratory load. This process is performed in stages as the probe is progressively withdrawn towards the ground surface to form a column. This method is used to densify both the aggregate and the surrounding soil.
In2013,theNewZealandEarthquakeCommission(EQC)carriedoutaseriesofground improvementfieldtrialsintheabandonedChristchurch ‘RedZone’ suburbsofAvondaleand BexleyEQC(inpress).Thethreesitesusedinthisstudywerelocatedadjacenttotheareas usedintheEQCfieldtrials(testsites3,4,and6).Thenewsiteswerelocatedoutsideofthe areaswhichhadbeendisturbedbytheinstallationandtestingofgroundimprovements;particularlytheareasaffectedbytheliquefaction-inducingblastingtrialsthatwerecarriedoutin the2013study.
A detailed description of the direct-push crosshole testing procedure can be found in Wotherspoon et al. (2017). For this research, tests were performed to determine Vp and Vs as a function of depth using custom-built cone sensors containing a three-dimensional geophone array designed and constructed at the University of Texas. The geophones are housed in a stainless steel cone chassis with dimensions similar to a typical cone penetrometer test (CPT) tip. A source and a receiver sensor were advanced separately into the ground to the same depth using standard CPT rods and two small-scale cone penetrometer rigs. Data was acquired using a Data Physics ACE Quattro dynamic signal analyser connected to a laptop.
The test setup is shown schematically in Figure 1a, with the horizontal spacing between the source and receiver rods ranging from 1.5 – 1.9 m. At each test location the sensors were initially pushed to a depth of 0.4 m below ground level and the first test performed. The sensors were then both advanced at 0.2 m intervals to determine Vp and Vs down to at least 1 m below the depth of ground improvement installation. CPT operators continually monitored the rods to maintain their verticality during testing. An example of the setup in the field is presented in Figure 2. In this example one CPT rod is advanced using a tracked CPT rig that is secured into the ground using augers, while the other CPT is advanced using a portable ram secured with augers.
Thesoilsatsites3and4werebroadlysimilar;generallyconsistingoffinesiltysandand sandysilt(withsomeinterbeddedthinsiltlayers)toadepthofabout3to4.5m,overlying verycleanfinetocoarsesand.Finescontents(%passing75µsieve)atsites3and4ranged fromapproximately40to90%intheuppersiltysoils,and1to3%inthelowersands.The soilsatsite6consistedofinterbeddedsandandsiltysand(finescontentapproximately20%) intheupper1.4mthencleanfinetocoarsesand(finescontent ≤ 7%).Thedepthtogroundwateratthethreetestsitesrangedbetween0.7mand1.2mbelowgroundlevel.Pre-injection CPTqc valueswithinthetestpanelsrangedfromabout2to5MPaintheupper3to4mof thesoilprofile,and5to14MPabetween4and8mdepth.Pre-injectionVS valuesranged fromapproximately125to150m/sintheupper2.5to4moftheprofile,and150to170m/s below4m.

At each depth testing was performed using a hammer impact source applied to the top of the source rod, with three separate impacts performed at each depth and stacked to increase signal-to-noise ratio. This impact develops compression waves (P-waves) that travel down the length of the source rod to its cone tip. The vertically oriented sensor (SV) at the bottom of the source rod (Figure 1a) was used to trigger the data acquisition system, eliminating the need to determine the P-wave travel time from the source impact at the top of the rod to the wave arrival at the cone tip. The P-wave reaches the end of the rod and creates both radially propagating P-waves and horizontally propagating, vertically polarised shear waves (Shv-waves) at the base of the source that follow the path shown in Figure 1a. Shv-waves, referred to as simply S-waves hereafter, were detected by the vertically oriented sensor in the receiver rod (RV). In a similar fashion, P-waves were detected by the horizontal geophone in the receiver rod that was oriented in line with the travel path (RH1). The other horizontally aligned geophone (RH2) is not used in these analyses. A detailed summary of the calibration and data interpretation methodology is given in Wotherspoon et. al. (2015).
Tests were performed across each stone column and resin injection point to characterise the composite properties of the soil and the ground improvement, and in-between ground improvement installation points to characterise the properties of the soil within the improved zone (Figure 1b). In-between tests were positioned in order to characterise the soil that was furthest away from the SC elements, representing the soil in the improved zone that was likely to be least affected by the installation of these elements (i.e. the least improved soil). Tests were performed prior to ground improvement or outside the improved zone to characterise the virgin (or unimproved) soil properties. Similar spacing between source and receiver rods were used for the composite, improved soil zone and
virgin measurements at each test location. The post-improvement tests were performed approximately three weeks after SCs and RI installation in order to allow dissipation of any induced pore water pressures.
The details of case studies from four locations are presented in this paper. The installation characteristics and locations of the SCs and RI systems at each site are not the same, therefore we are not intending to directly compare results from site-to-site. Instead, the aim is to identify and compare general trends in the performance of the two systems. The first two sites are locations dominated by relatively cleans sands throughout the soil profile, while the second two sites have siltier material with higher fines content.
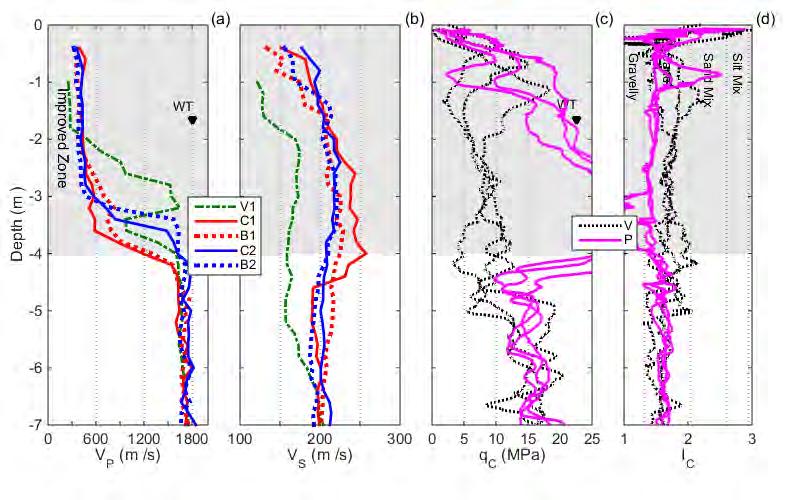
Figure 3 summarises the soil profile data from the crosshole (Vp and Vs) and the pre- and post-improvement CPT testing data (tip resistance qc and soil behaviour type Ic) at predominantly clean sand sites. The installation depth was up to 4m below ground level for SCs and from 1.5m to 6m below ground level for RI, as indicated by the shaded regions. The horizontal spacing between the source and receiver was approximately 1.7m. For the Vp and Vs data, V denotes virgin soil tests, C denotes composite tests (across the improvement element) and B denotes between tests (in-between the improvement elements). For the CPT data, V denotes virgin soil tests and P denotes post-improvement tests (located between the improvement elements).
behaviour
The above results show that there is a clear increase in Vs within and 0.5m below the ground improvement zone for all tests. It is notable that there is little difference in the composite and between Vs measurements, suggesting that the stiffness of the SC elements is not too dissimilar from the stiffness of the surrounding improved soil. Overall, the SC installation increased Vs by approximately 50 m/s throughout the improved zone, a 70-100% increase in Gmax. The Vp measurements are dominated by the degree of soil saturation, and indicate a slight reduction in the depth to saturation post-installation over most of the improved zone. In the virgin measurements there is a reduction in saturation at approximately 3 m depth, reaching saturation again at 3.5 m depth. Interestingly, the water table depth defined from CPTu data does not match the depth to saturation indicated by the virgin cross-hole test data (Vp = 1500 m/s). This trend was consistently noted across much of Christchurch by Wotherspoon et al. (2015), meaning the depth where the soil reaches full saturated is often 1-2 m below the depth of the hydrostatic water table.
Figure 4 summarises the pre- and post-improvement CPT tip resistance, soil behaviour type index, P-wave and S-wave velocity testing for the RI panel. Like the SC installation, CPT qc values within the ground improvement zone increased by 80-100%. Overall, the RI installation increased Vs by 50-75 m/s throughout the improved zone, an 80-100% increase in Gmax. There is minimal difference in the composite and between Vs measurements in three of the four post-investigations, suggesting that the stiffness of the RI area is similar to that of the improved zone.
The Vp measurements indicate a noticeable reduction in the extent of saturation post-installation over most of the improved zone. Postimprovement, this effect is attributed to the fact that the resin material is closed-cell and therefore interferes with the global Vp measurements by creating impermeable zones between the source and receiver.

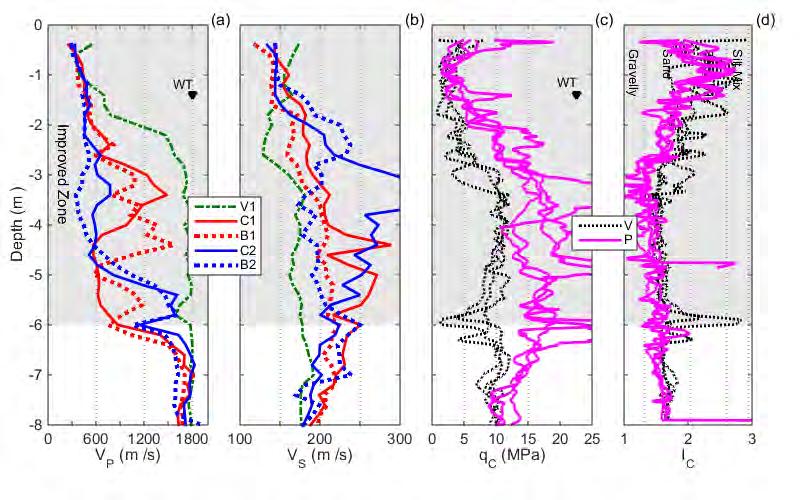
4.2
Soil conditions at these sites consist of interbedded sandy silt and fine silty sand with occasional thin silt layers to approximately 3 to 4m below ground level. Below this is a fine to coarse sand to approximately 7m, where interbedded siltier layers were present to the maximum depth of investigation of 8m below ground level. Laboratory testing of a sandy silt sample at 2m depth showed a FC of approximately 80%, while a silty sand sample at a depth of 4.2m had a FC of 45%. The lower sand unit at 5m and 6.5m had a FC of 2%. Figure 5 summarises the soil profile data, with the depth of SC installation indicated by the shaded region.
The crosshole measurements for these silty sand sites are summarised in Figure 5a and 5b. At the SC site, the virgin soil measurements are representative of the characteristics across the entire site above 2 m, however below this depth the measurements are likely more representative of Area 1. Above 2 m depth, in the most silty soils (typically 99% FC), the SC installation resulted in no stiffening of the ground compared to the virgin conditions, with the Vs in the improved zone equal to or less than the virgin soil Vs Below 2 m the performance was variable, with little-to-no improvement in Vs for tests B1 and C1, and an increase in Vs for tests B2 and C2 from 25 – 100 m/s relative to the virgin soil. Once again, there is little difference in the C and B Vs measurements throughout much of the improved zone. These variable results suggest that the stone column installation was not able to effectively stiffen the sandy silt and silt at this site, with the degree of improvement also varying spatially across the site due to soil variability.

The Vp measurements show a dramatic reduction in saturation at the site, with Vp reducing to approximately 600 m/s throughout much of the improved zone depth. Below the improved zone the soil quickly becomes saturated again, with pre- and post-installation measurements both indicating saturation. The bottom metre of the improved zone at the clean sand SC site discussed in the previous section was saturated post-installation, while at the silty sand SC site there is still clear desaturation. The differences in these characteristics at the two sites may be due to the higher fines content of the soil layers at the silty sand site, slowing the seepage rate of water from the surrounding area into the improved zone.
Pre- and post-improvement CPT soundings were also able to assess the level of improvement of the soil between the SCs in the two areas at the site. Figure 5c shows that above 2 m depth there is little difference in the pre and post qc values, similar to the Vs values described above. In Area 1 there is little difference in qc below 2 m depth, with some evidence of a reduction in qc from 2-4 m depth. In Area 2 there is a significant increase in qc below 3m depth due to SC installation, mirroring similar improvement indicated by the Vs measurements.
Figure 6 summarises the pre- and post-improvement CPT tip resistance, soil behaviour type index, P-wave and S-wave velocity testing for the RI panel at a silty sand site. Unlike the SC installation, CPT qc values within the ground improvement zone increased by 80100%. Overall, the RI installation increased Vs by 50-75 m/s throughout the improved zone, an 80-100% increase in Gmax Similarly to the clean sand site, there is minimal difference in the C and B Vs post-improvement measurements, suggesting that the stiffness of the RI area is similar to that of the improved zone. The silty sand RI site showed a relatively uniform degree of improvement in Vs measurements, more so than the CPT soundings which showed a smaller comparative degree of improvement at higher Ic values. Beyond approximately 1m below the base of the improved zone, the pre- and post-improvement tip resistance and Vs have similar values.
Similar to the clean sand RI site, the Vp measurements indicate a large reduction in the extent of saturation post-installation over the entire improved zone. Again, this is attributed to the closed-cell nature of the resin material
The result of the Plaxis Assessment confirmed the simplified assessment and had general agreement that a treatment depth of 1.5m to 6.0m bgl would provide a sufficiently thick crust to achieve the performance criteria.
However, locally high point loads from micropile groups required additional treatment to 8.0m below ground level to prevent excessive differential movement.
Resin Injection is a ground improvement technique designed to be used under existing structures to provide an increase in liquefaction resistance. Densification of the injected soil occurs primarily as a result of an expanding polyurethane resin product. Detailed testing of the technology was carried out in 2013 and 2016 by MBIE and EQC as part of a large-scale liquefaction ground improvement trial. The outcome of the trials has seen the technology included in the MBIE Module 5: Ground Improvement of Soils Prone to Liquefaction. As previously stated, secondary effects such as improvement in composite stiffness cementation, and horizontal stress increases have not been considered.
Injection tubes are driven into the ground through small penetrations ( up to 20 mm) at regular intervals, and at each injection point material is injected into the target treatment zone to create the resin-soil matrix. During injection of the treatment zone, the low viscosity resin both permeates the soil to a limited extent, and also penetrates under pressure along planes of weaknesses within the soil profile. The material reacts soon after injection, rapidly expanding to many times its original volume. The expansion of the injected material results in compaction of the adjacent soils, due to new material being introduced into a relatively constant soil volume.
An injection array was marked out across the entire treatment area, on a regular grid spacing with reference points. An indicative layout of the Trial area is shown in Figure 3. In-ground service scanning was undertaken to ensure no adverse impact on services from the drilling and injection process. Any injection locations that coincide with adjacent services can be readily relocated.
Penetrations to enable injection works are limited to 20mm in diameter. Standard, hand-held rotary hammer drills are sufficient to enable drilling through floor slabs and footings. Mainmark utilise custom drill lengths of up to 2.5m as standard. Another benefit of this low-impact drilling method is that damage to steel reinforcement is minimised. If required, control strategies can be used to mitigate any concrete dust generation.
All injection tubes used for material delivery are 16mm in diameter, and can be installed in continuous or coupled segmented lengths. This enables installation to depths greater than the available head room. Injection tubes are easily installed using hand-held rotary hammer drills. Injection tubes installed below the water table are fitted with sealed driving tips to prevent ingress and blockage prior to injection. Each injection tube is removed upon completion of that location’s treatment.
Injection material is generated within self-contained mobile plant (20ft containerised), which can be located up to 100m from the intended injection locations. Sealed hoses transport the material from the plant to the delivery point.
The level of improvement targeted determines the following key parameters:
1. Injection sequence
2. Injection volumes (e.g. per vertical metre)
3. Target improvement / densification
4. Tube extraction rate (static or continuous)
5. Allowable structure movement
Items 2 – 5 form part of the injection cut-off criteria, in addition to any other requirements.
A capping layer is typically required to provide increased confinement for the ground improvement zone. This is injected first, and is followed by injections into the remaining ground improvement zone, as shown in Figure 5. A tube extractor can be used for continuous material injection.
Mainmark is an internationally recognised leader in ground engineering and asset preservation, offering some of the most innovative and advanced solutions to address site specific challenges, such as sunken foundations, in the residential, industrial, commercial, civil and mining sectors.
Our expertise extends to the remediation or safe decommissioning of infrastructure and addressing ageing or decaying concrete and steel assets including culverts, tunnels, pipes, tanks and manholes
For more than 25 years Mainmark has led the world in developing and delivering advanced resin injection techniques for ground engineering, successfully treating more than 30,000 sites across Australasia . Mainmark was established in 1995 by Philip Mack, owner and chairman, focusing on a bespoke solutions for earthquake repair and remediation, and has more recently diversified and grown to be a globally recognised ground engineering and asset preservation company
The Mainmark group of companies has been in operation since 1995, with nine offices throughout Australia and New Zealand to service the region . We have a global footprint across 14 locations with more than 200 staff worldwide. We also operate whollyowned subsidiaries in Japan and the UK .
Our reputation has been built on providing unique solutions for complex problems, delivered cost effectively and efficiently. Our people are committed and focused on providing customers with superior service and quality outcomes, working to the highest standards of local and international compliance
We are an award-winning, privately-owned company with highly trained technicians and state-of-the-art equipment. Our solutions are all non-toxic, inert and environmentally neutral Every project is planned, supervised and executed by our own experienced personnel We warrant our products Companies of the Mainmark group present creative, effective solutions to many types of ground engineering and asset preservation problems across a wide range of sectors Some companies also provide related solutions for the building and construction industry Many of these solutions are unique to Mainmark and its associates .
Teretek is an engineered solution for re-levelling subsided structures that utilises a plural component, expanding polyurethane resin The expansion force of the material results in the controlled lift of structures, with a by-product of localised bearing capacity improvement through soil densification. The resin’s expansive properties and longevity also make it an ideal material to address voided soils and foundations, or for decommissioning underground utilities

JOG is a computer controlled, multi-point injection technique for re-levelling subsided structures. This solution uses cementitious grout materials to re-level structures, from residential houses to high-rise commercial buildings. The injected materials have a controlled set time which allows for the precise lifting of a structure .

Terefil is a technology used to create lightweight, cellular concrete (LCC) for large void fills. LCC output densities can range from 500 to 1,500 kg/m3 with strengths ranging from 0 5 to 5 MPa. The lightweight cementitious material sets within hours of placement, is flowable and self-levelling. LCC is routinely used for pipe infrastructure abandonment, retaining backfill, and shallow ground improvement in soft or liquefiable soils.
