13 March 2023
Karridale
Grasses and grazing management
1. How grasses grow and respond to defoliation –enhancing plant condition to contribute to soil health and pasture production - multi species
2. Grazing management to encourage pasture growth and soil health
3. Monitoring techniques to inform feed budgeting and grazing plans
All with a view to increasing productivity
Time Herbage Mass Low Quality High Herbage Mass Good to High Quality High Herbage Mass High Quality declining Herbage Mass High Quality Low
Grass Growth
Grass Growth Quality changes as plants grow
Time
Dig 75 – 80% 11 MJ ME/kg DM Dig 65 – 70% 9-10 MJ ME/kg DM Dig 55 – 60% 7-8 MJ ME/kg DM Dig 45 – 50% 5–6 MJ ME/kg DM
Optimal nutritive value
Optimal for plant persistence
Time Phase I Phase II Phase III Phase IV Dig 75 – 80% 11 MJ ME/kg DM 4,000 3,000 2,000 1,000 0 Dig 65 – 70% 9-10 MJ ME/kg DM Herbage mass (kg DM/ha) Dig 55 – 60% 7-8 MJ ME/kg DM Dig 45 – 50% 5–6 MJ ME/kg DM
Growth cycles
0 10 20 30 40 50 60 Jan Feb Mar Apr May Jun Jul Aug Sep Oct Nov Dec Pasture growth (kg/ha/day) Kikuyu Setaria/rhodes grass Naturalised Ryegrass Oats
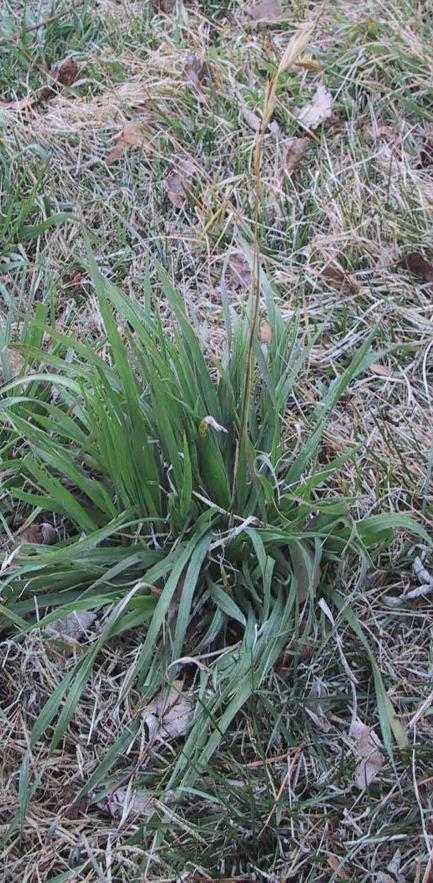
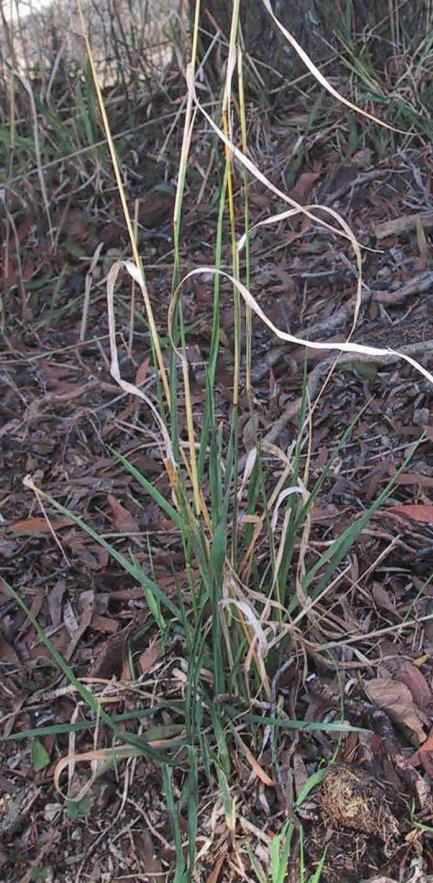
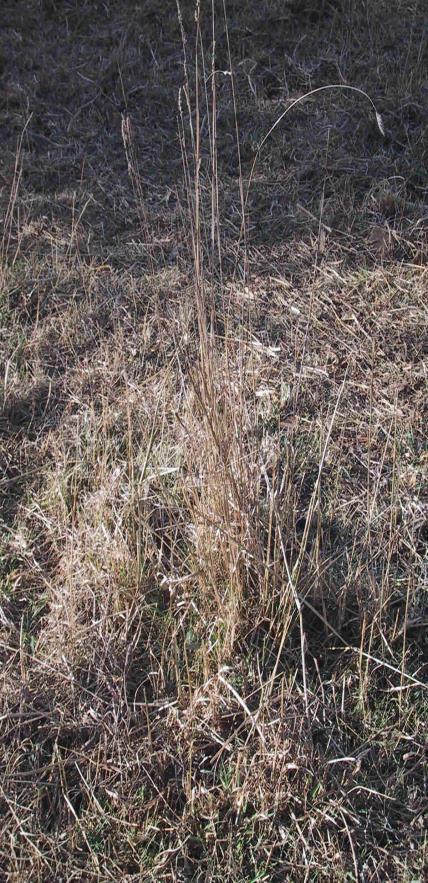
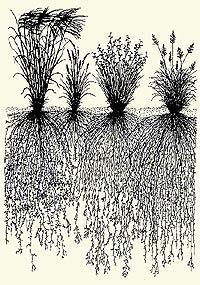
Tussock grasses
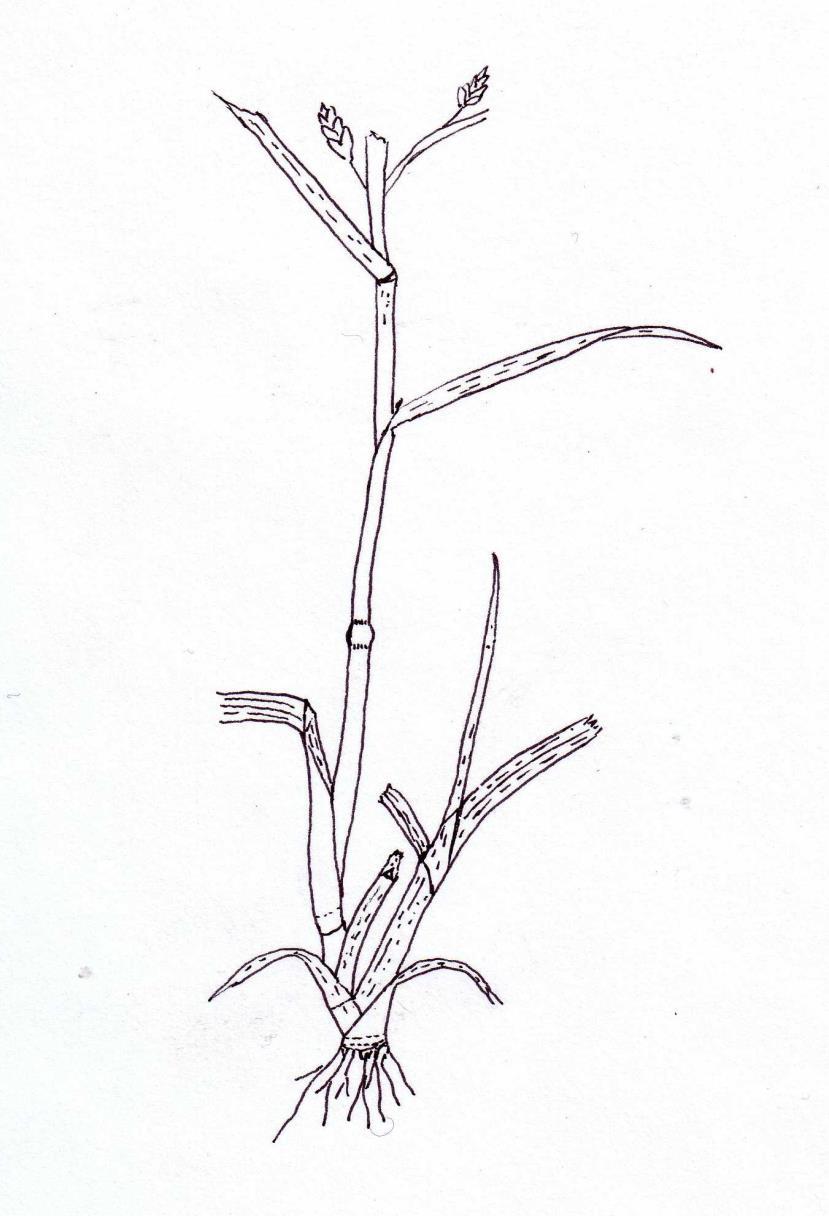
Tussock grasses are made up of a number of independent but connected units or tillers.
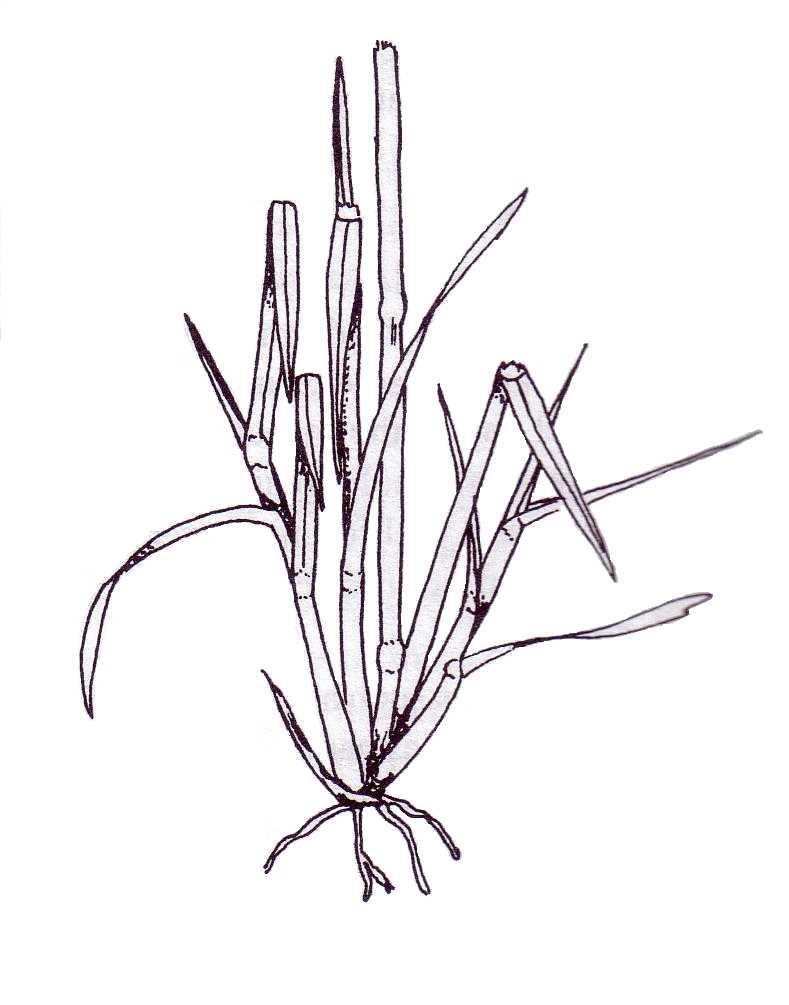
Growth points
Leaf sheath
Internodes
Basal node
Leaf junction Grass tiller
Leaf tips
Axillary bud
Next seasons tillers
Roots Young tiller Young tiller
Apical bud

Next seasons seed head
Basal node
et al 2002
Diagram of the basal growth point of Phalaris Adapted from Wheeler
 Axillary Bud
New tillers
New roots
Senesced leaf
Axillary Bud
New tillers
New roots
Senesced leaf
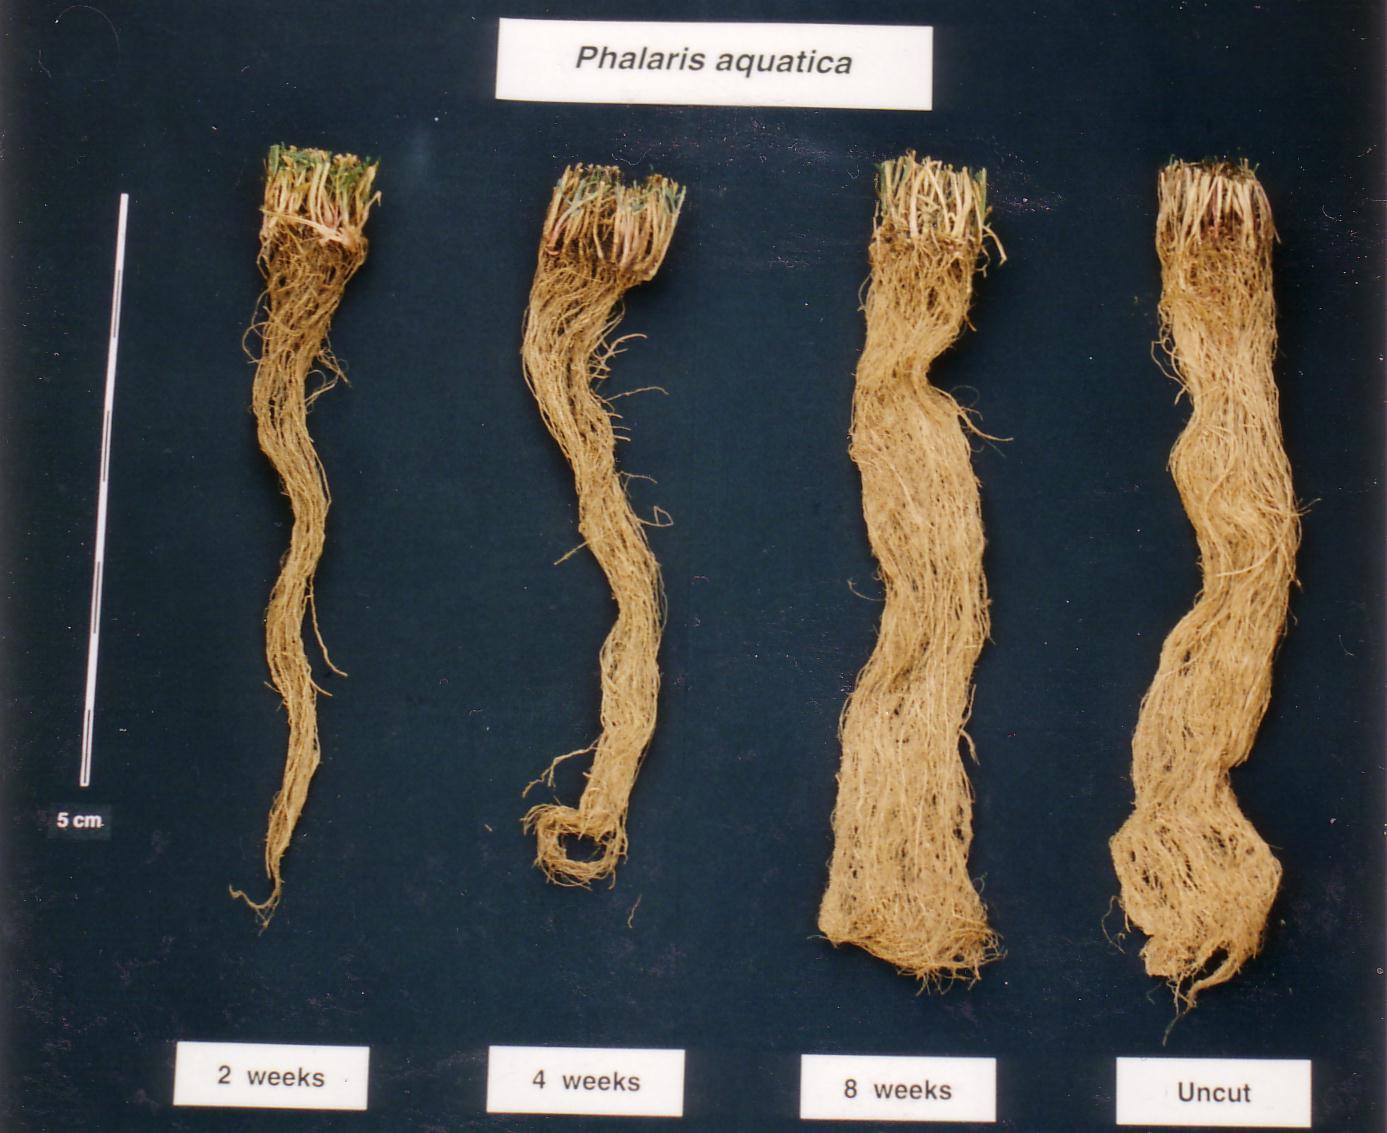
Effect of frequency of cutting on roots over 1 year 50cm
Shoot to root ratios
Controlled pot experiment where plants were cut to 3cm at 2, 4 or 8 week intervals or uncut over 12 months
-70 -50 -30 -10 10 30 50 70 2 weeks 4 weeks 8 weeks uncut Dry weight (g) shoots roots
Leaf removal and growth rates
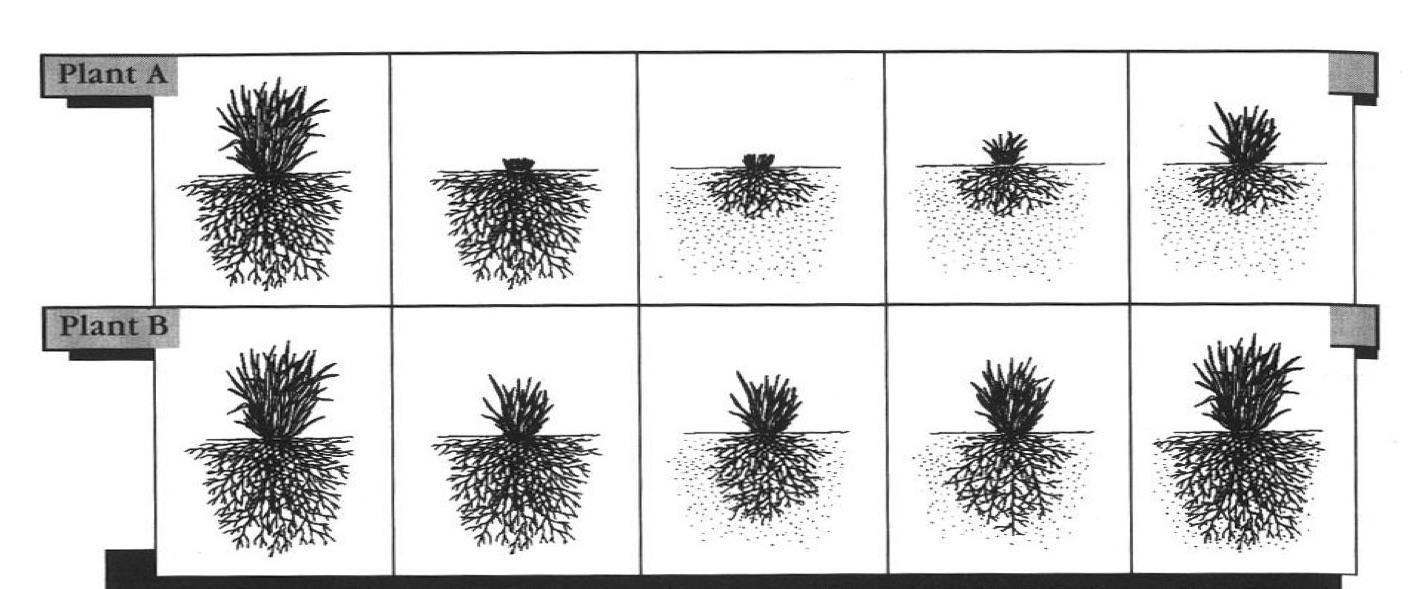
of defoliation Time
Plant B recovers much faster than Plant A Plant A much slower leaf regrowth Plant A much reduced root system Plants at start Extent
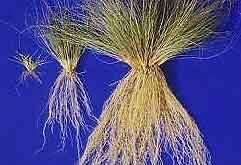
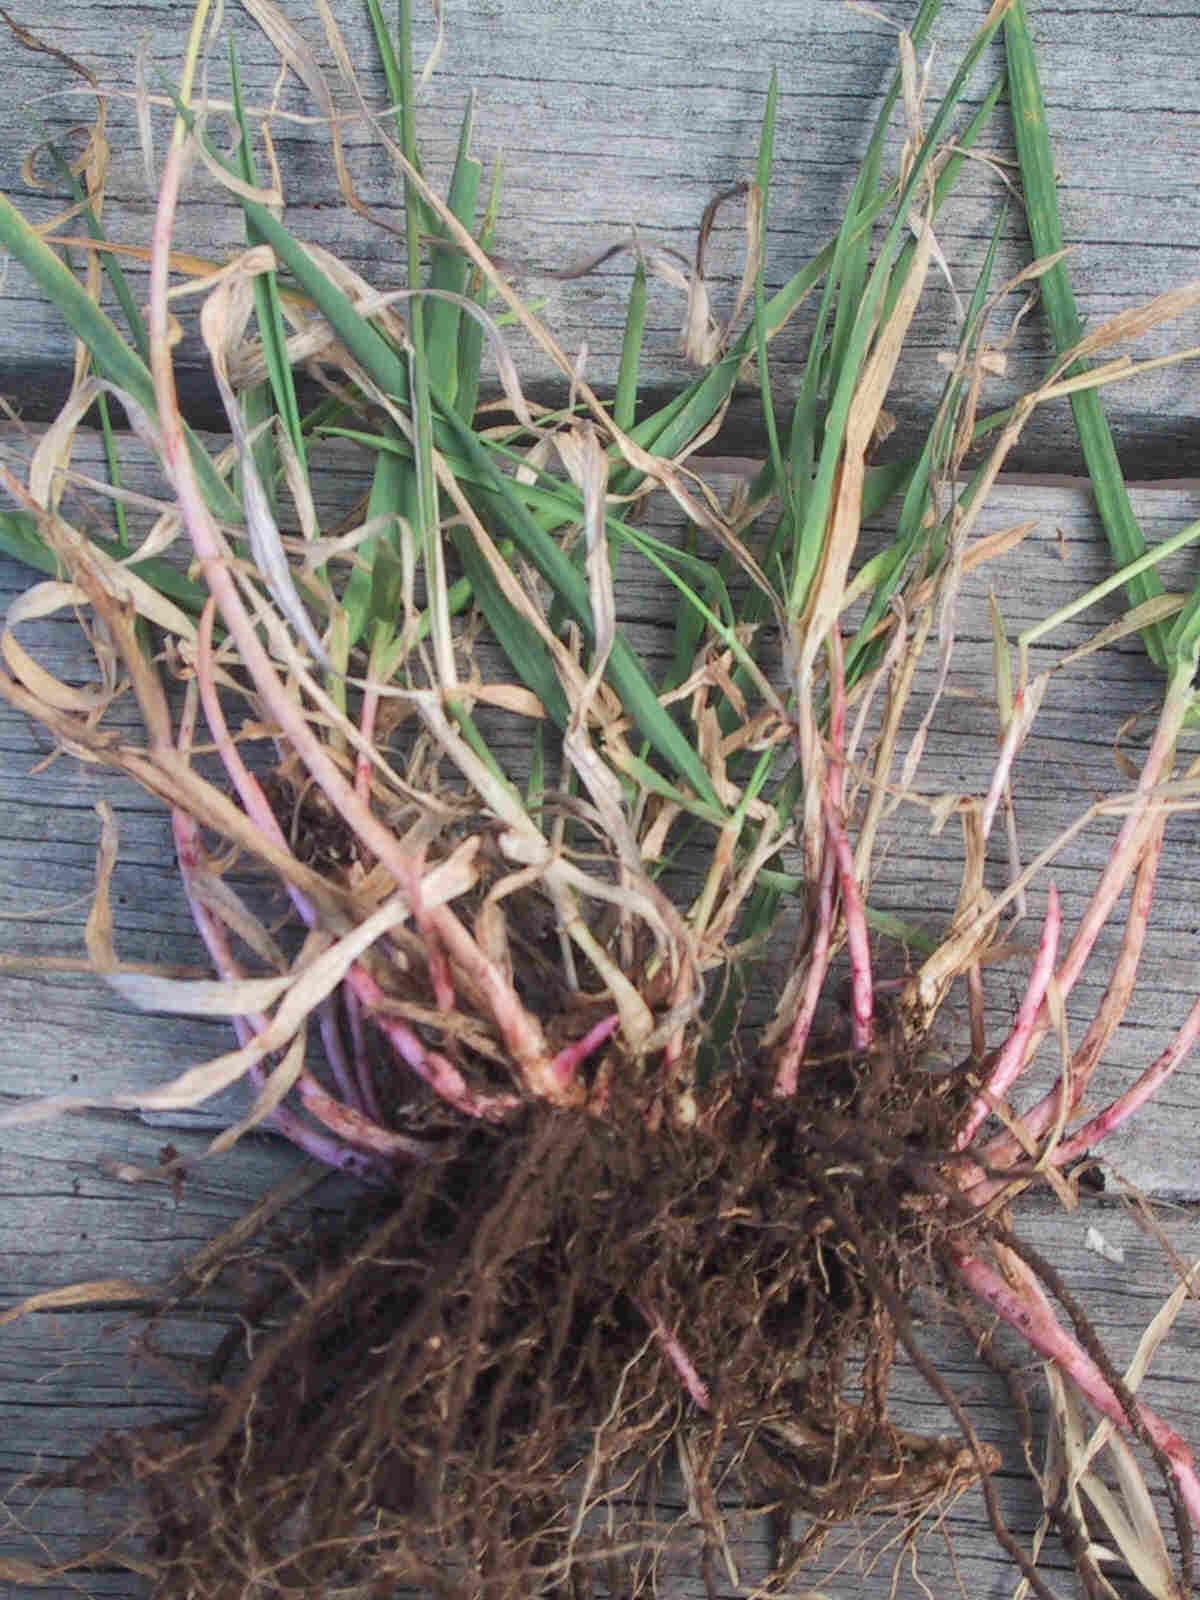
Plant material above the ground is a reflection of root material present below the ground
Photo: Christine Jones
Environmental influences on plant growth
0 10 20 30 40 50 60 70 80 0 50 100 150 200 250 Jan Feb Mar April May June July Aug Sept Oct Nov Dec P a s t u r e g r o w t h r a t e ( k g D M / h a / d a y ) R a i n f a l l ( m m ) Rainfall Temp PGR
Factors that influence plant growth
Sunlight: duration & intensity
Season Time since grazed Water infiltration rate
factors Plant factors Soil factors
Species Cation exchange capacity
Stage of
Fertility and pH
Height or
area Water holding capacity
Environmental
Rainfall: amount & distribution
Temperature
growth
leaf
Tree
Depth of topsoil
Soil type Residual herbage mass Compaction Slope Groundcover Organic matter and soil C Aspect Presence of weeds Biological activity Proximity to water
cover
Local Issues
Mediterranean environment – short defined growth period
Soil fertility
Low populations of perennial grasses
Low pasture species diversity
Absence of seed bank species diversity
High populations of undesirable species
Slow early season pasture growth rate
Lower than optimal pasture growth rate
Lower than optimal stocking rates
Need to feed hay or silage during summer
Low levels of residual herbage mass
Excessive rates of utilisation
Highest livestock demand at the most critical time for new season growth
Local Issues
Mediterranean environment – short defined growth period
Soil fertility
Low numbers of perennial grasses
Low pasture species diversity
Absence of seed bank species diversity
High populations of undesirable species
Slow early season pasture growth rate
Lower than optimal pasture growth rate
Lower than optimal stocking rates
Need to feed hay or silage during summer
Low levels of residual herbage mass
Excessive rates of utilisation
Highest livestock demand at the most critical time for new season growth
Solutions
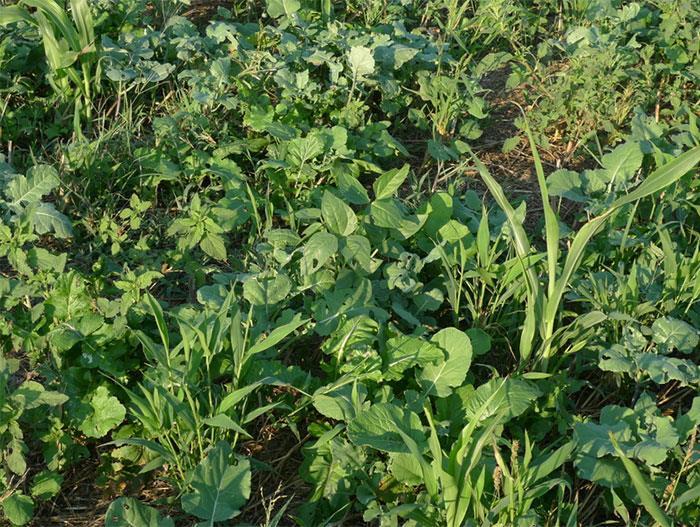
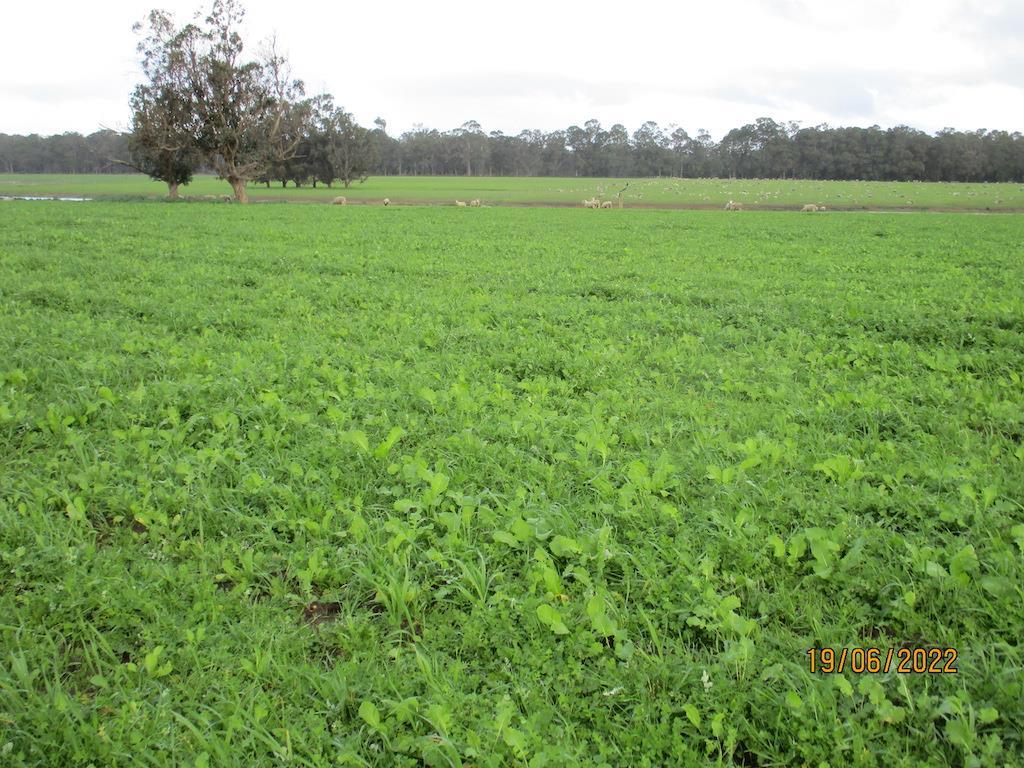
• Introduce species diversity – multi species planting
• Perennial and annual
• Different plant families
• Different growth cycles
• Planned grazing management
• Increase number of paddocks per mob
• Use stock density
• Plan recovery
• Plan residual herbage mass
• Control utilisation
Increase soil carbon Species selection
Your goals?
Production stability
Enhance ecosystem processes
Improve production
Species selection
Perennial grass
Annual grass
Legume Broadleaf
Establishment
Ground preparation
Grazing pre-planting
Planting
Weed control
Fertiliser decisions
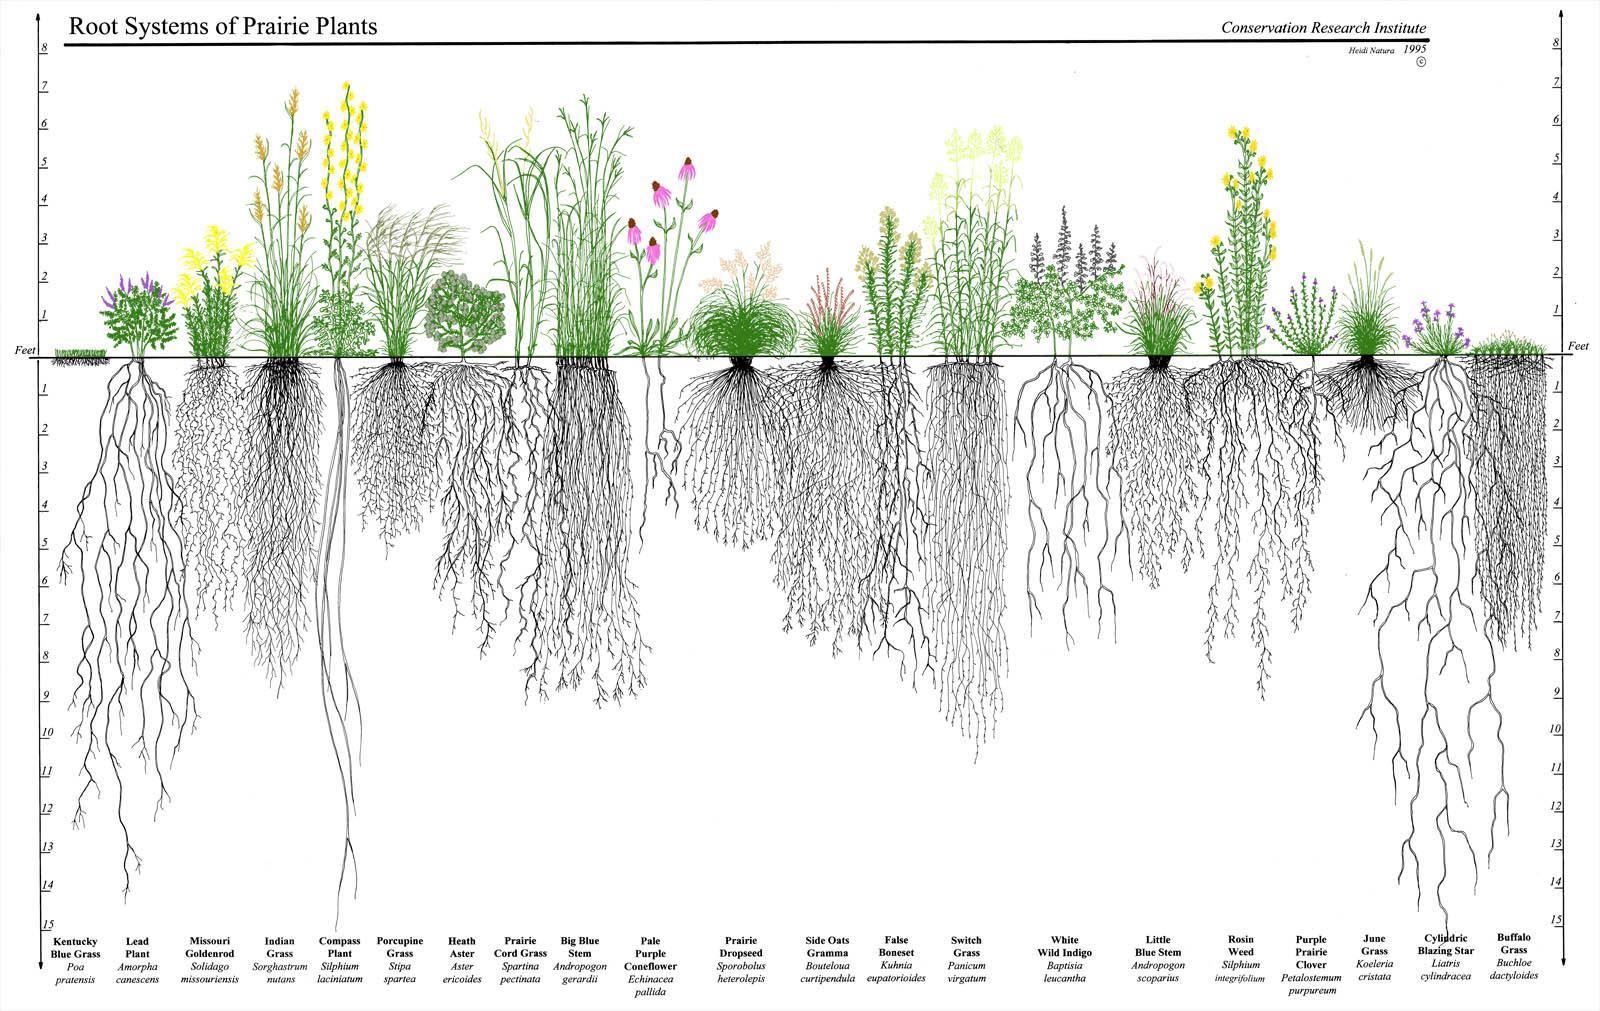
Water cycle
- Diversity of root architecture
- Diversity of root depth
- Improved soil structure
- Improved water holding capacity
Community dynamics
- More species, more resilience
- More even annual production
- Improved animal nutrition
- Plant species complementarity
Multi species
Advantages
Mineral cycle
- Biological activity
- Different species host a range of different microorganisms
- Aggregate stability
Energy Flow
- Species differ in growth cycles
- Increased photosynthetic capacity
- Increased plant growth
Diversity – Some examples
• Northern tablelands NSW :- 16 species / 0.25m2 quadrat
• Inverell:- 23 - 64 species /5m2 – total 135 species (43 grasses)
• Brewarrina:- 65 species (18 grasses)
• Cunnamulla:- 124 - 193 species recorded over 3-5 monitoring periods
• Coolatai:- Over 12 years, 295 plant species from 62 families including 84 grasses, 115 forbs and 25 legumes
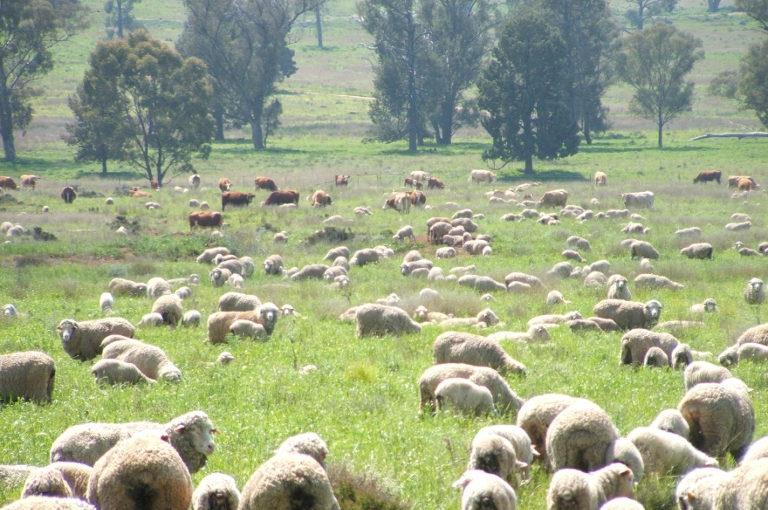
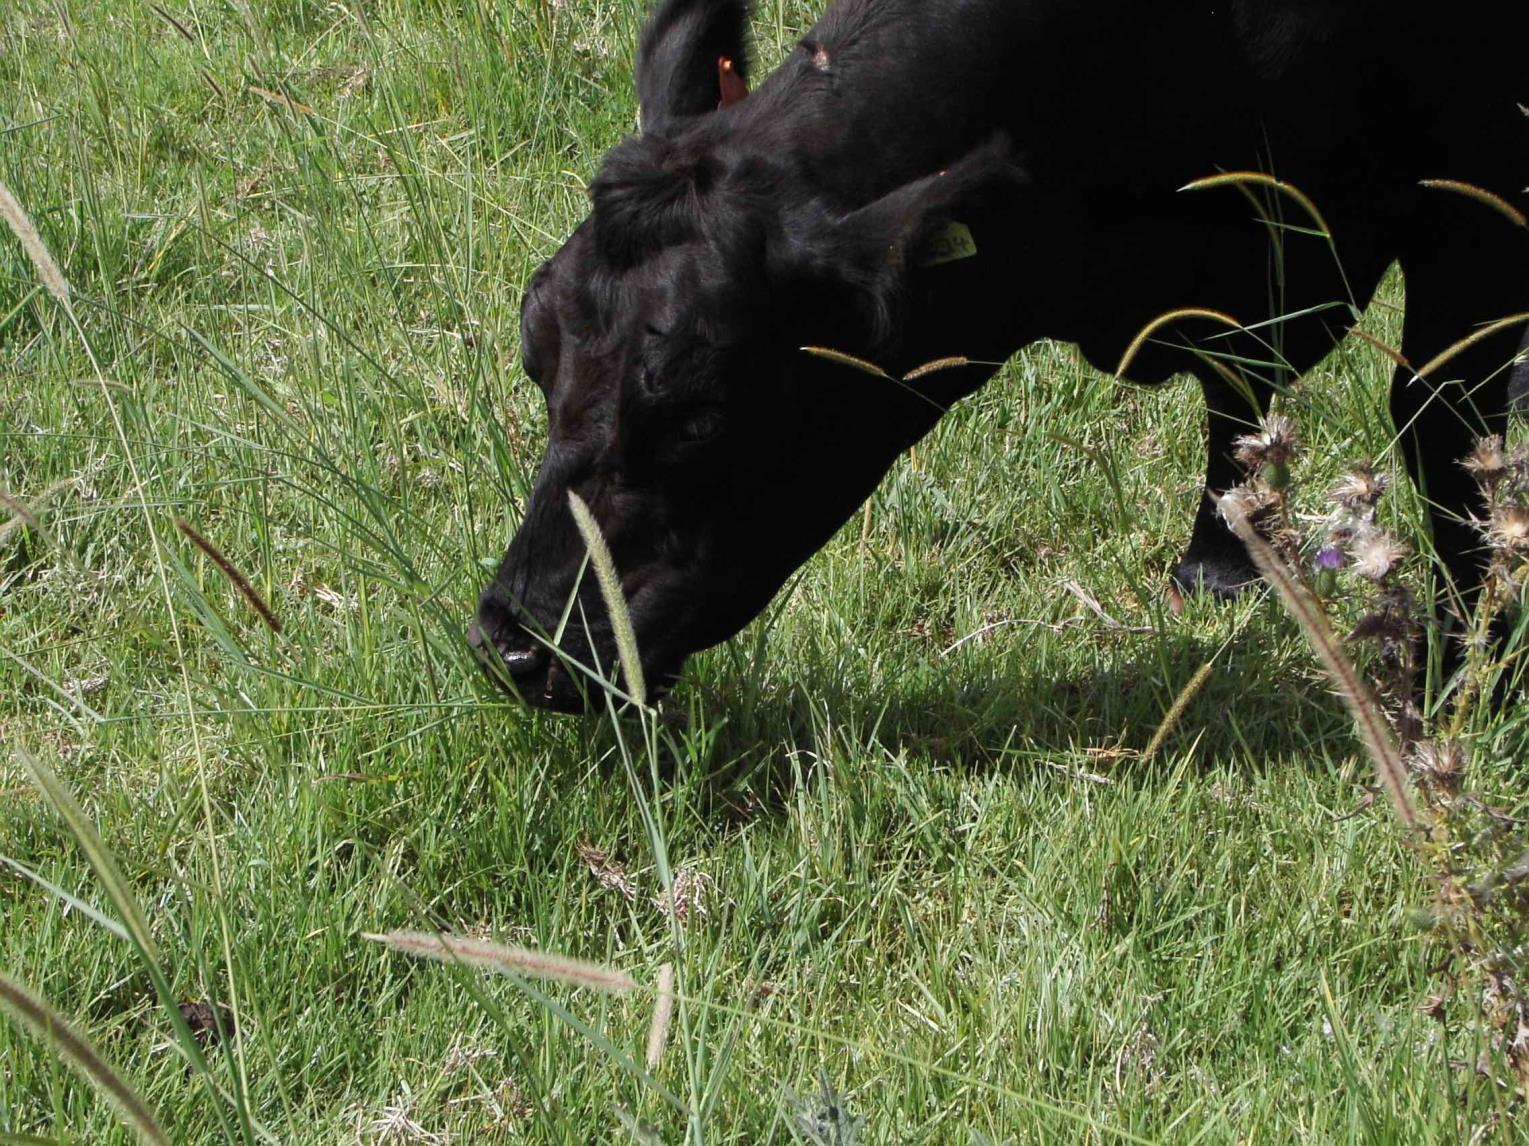
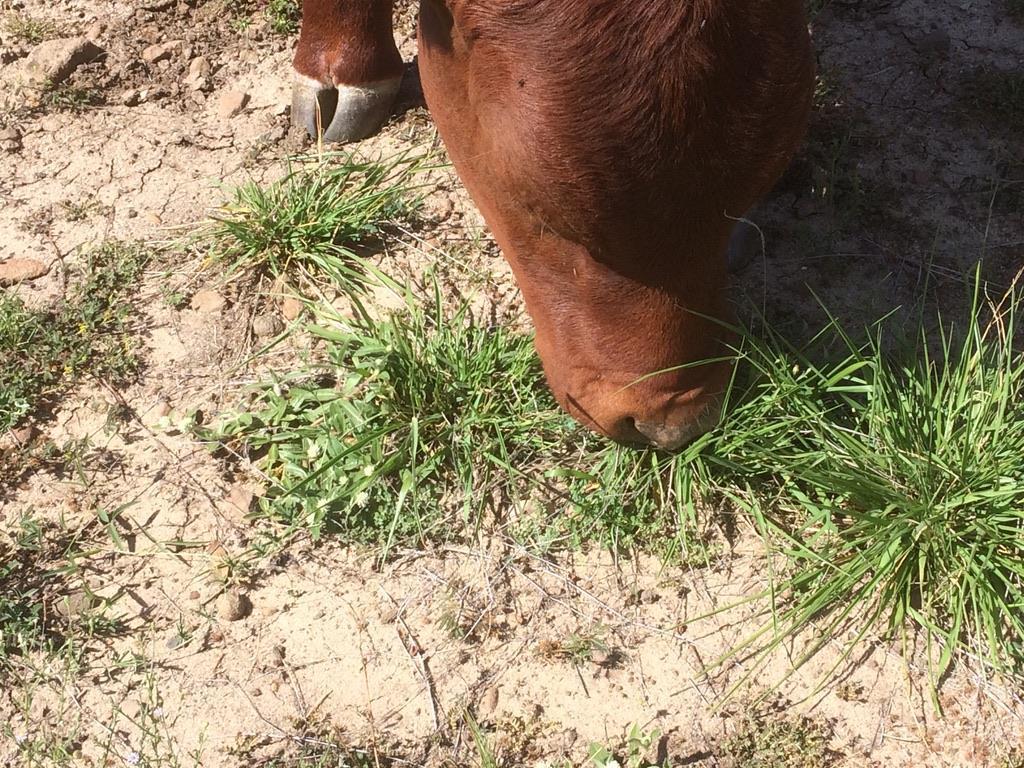
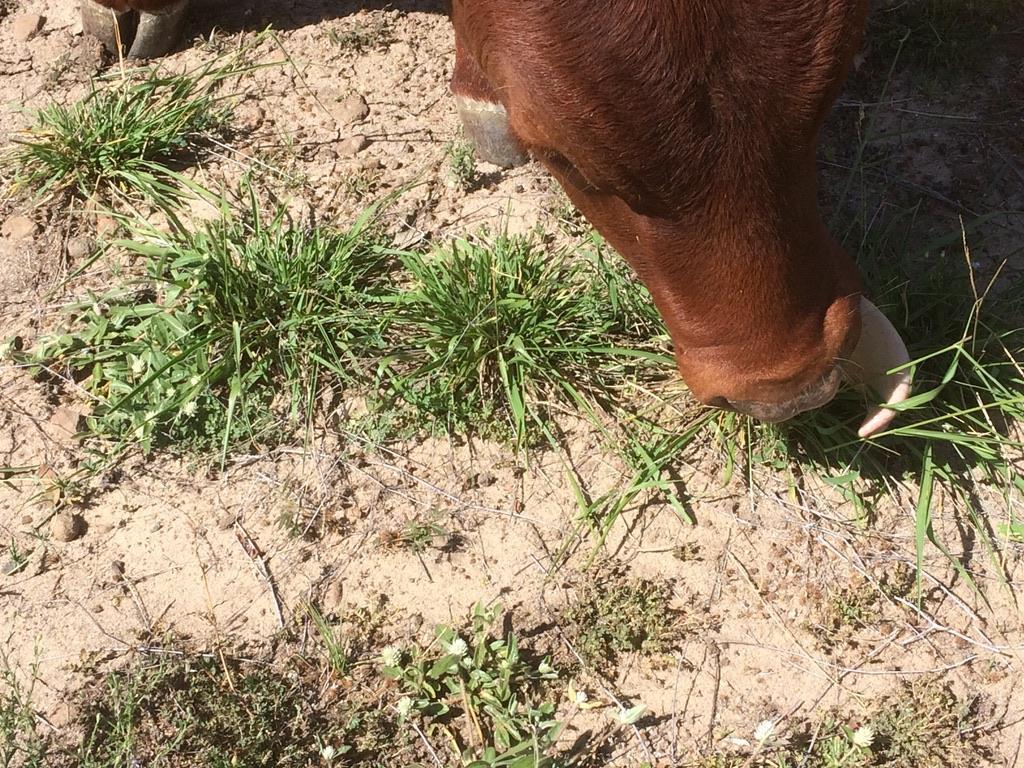
Grazers
• Selective
• One plant at a time
• Physical impact
• Conversion of nutrients
• Conversion of carbon
• Need to be managed
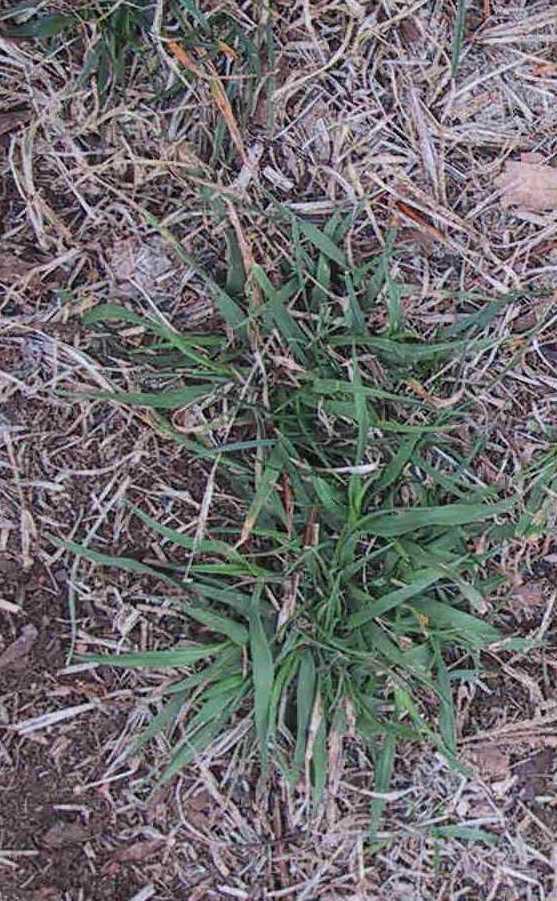
Healthy perennial grass plants
Increased root biomass
➢ Increase soil organic matter
➢ Increase biological activity
➢ Increase nutrient cycling
➢ Increase humus
➢ Increase plant growth rate
➢ Increase livestock carrying capacity
Sunlight, water & atmospheric C (primarily CO2)
plant residues
nutrients from animals
micro & macro organisms
decomposers
dung beetles
earthworms
mites
springtails
nematodes
mycorrhiza fungi
bacteria

plant roots
OM turnover
nutrient cycling
aggregate stability
soil porosity
soil structure
soil water
infiltration
plant growth
pasture production
active soil carbon
soil animals
micro-organisms
root exudates
stable soil carbon
humus - chemically protected C
physically protected C
Plant Competition
Pasture plants compete with each other for
Within a single plant competition is for
➢ Moisture
➢ Nutrients
➢ Nutrients
➢ Light
➢ Light
➢ Space
➢ Space
Features to remember
➢ With grasses, what you see above ground in terms of leaf biomass is reflected below in root biomass
➢ While the paddock is the management unit – change occurs one plant at a time
➢ Defoliation intensity and frequency can be compensatory
Plant and pasture growth
➢ There can be large differences in plant growth rate between paddocks with similar soil type and rainfall
➢ Grazing management (defoliation) is an important factor in controlling plant growth rate
➢ All grasses have the same basic sigmoidal growth pattern
➢ The growth rate and quality of pasture plants change through the seasons
➢ Different species have different growth cycles
➢ The capture of sunlight drives pasture growth
How can we use this knowledge of plant growth to optimise management of pastures and livestock?
The range of grazing strategies
• Continuous grazing
• Set stocking
• Rotational grazing ‘system’
• Strategic grazing
• Tactical grazing
• Techno grazing
• Cell grazing
• Planned holistic grazing
• Planned grazing
Spring growth rates of adjacent paddocks west of Guyra
0 5 10 15 20 25 30 Set stocked Controlled grazing Pasture growth rate (kg/ha/day)
South Australian trials 2001-2005
Set Stocking Planned grazing Stocking rate (DSE/ha) 2.4 4.2 Groundcover % 60 90 Infiltration rate (mm/min) 4 18
Influencing plant growth with management
4 key factors that are within your control
➢ Recovery period
Growing season
Non or slow growing season
➢ Graze period
➢ Residual herbage mass
➢ Stock numbers – stocking rate
Recovery period
➢ Critical considering the effect of defoliation on plants
➢ Will depend on pasture growth rate
➢ Distinction between rest and recovery
➢ Getting it ‘right’ is a challenge
Graze period
➢ Will be a function of the recovery period required
➢ Aim to avoid a second bite on growing plants
➢ When plants grow quickly graze period will be shorter and when growth is slow the graze period can be longer
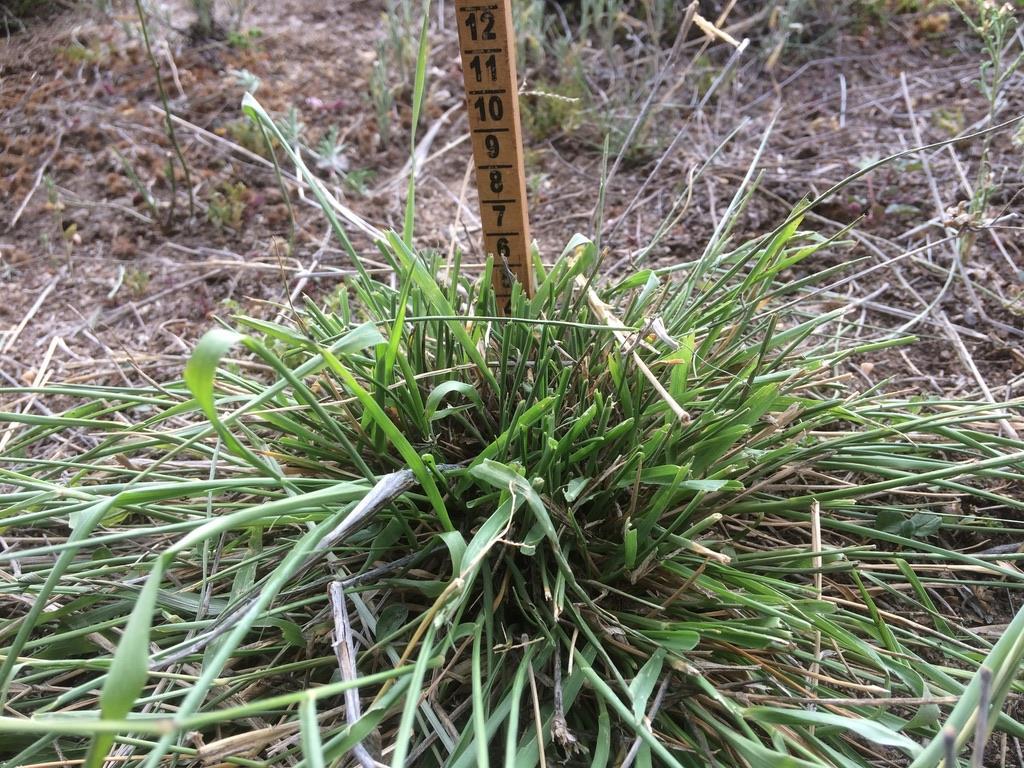
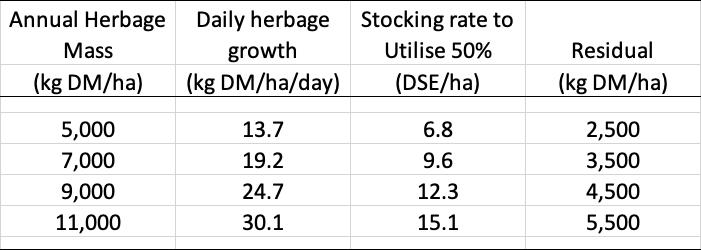
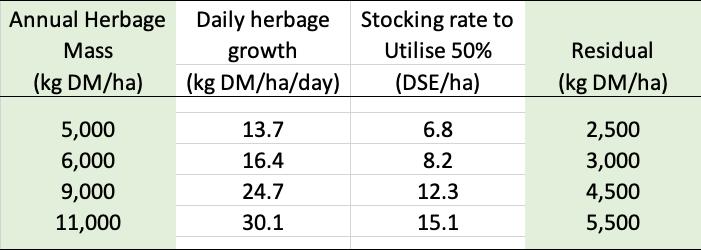
Residual herbage mass
Grazing ….. occurs one plant at a time
Residual leaf 5cm height
Pasture growth
0 10 20 30 40 50 60 70 80 0 50 100 150 200 250 Jan Feb Mar April May June July Aug Sept Oct Nov Dec P a s t u r e g r o w t h r a t e ( k g D M / h a / d a y ) R a i n f a l l ( m m ) Rainfall Temp PGR
Residual herbage mass
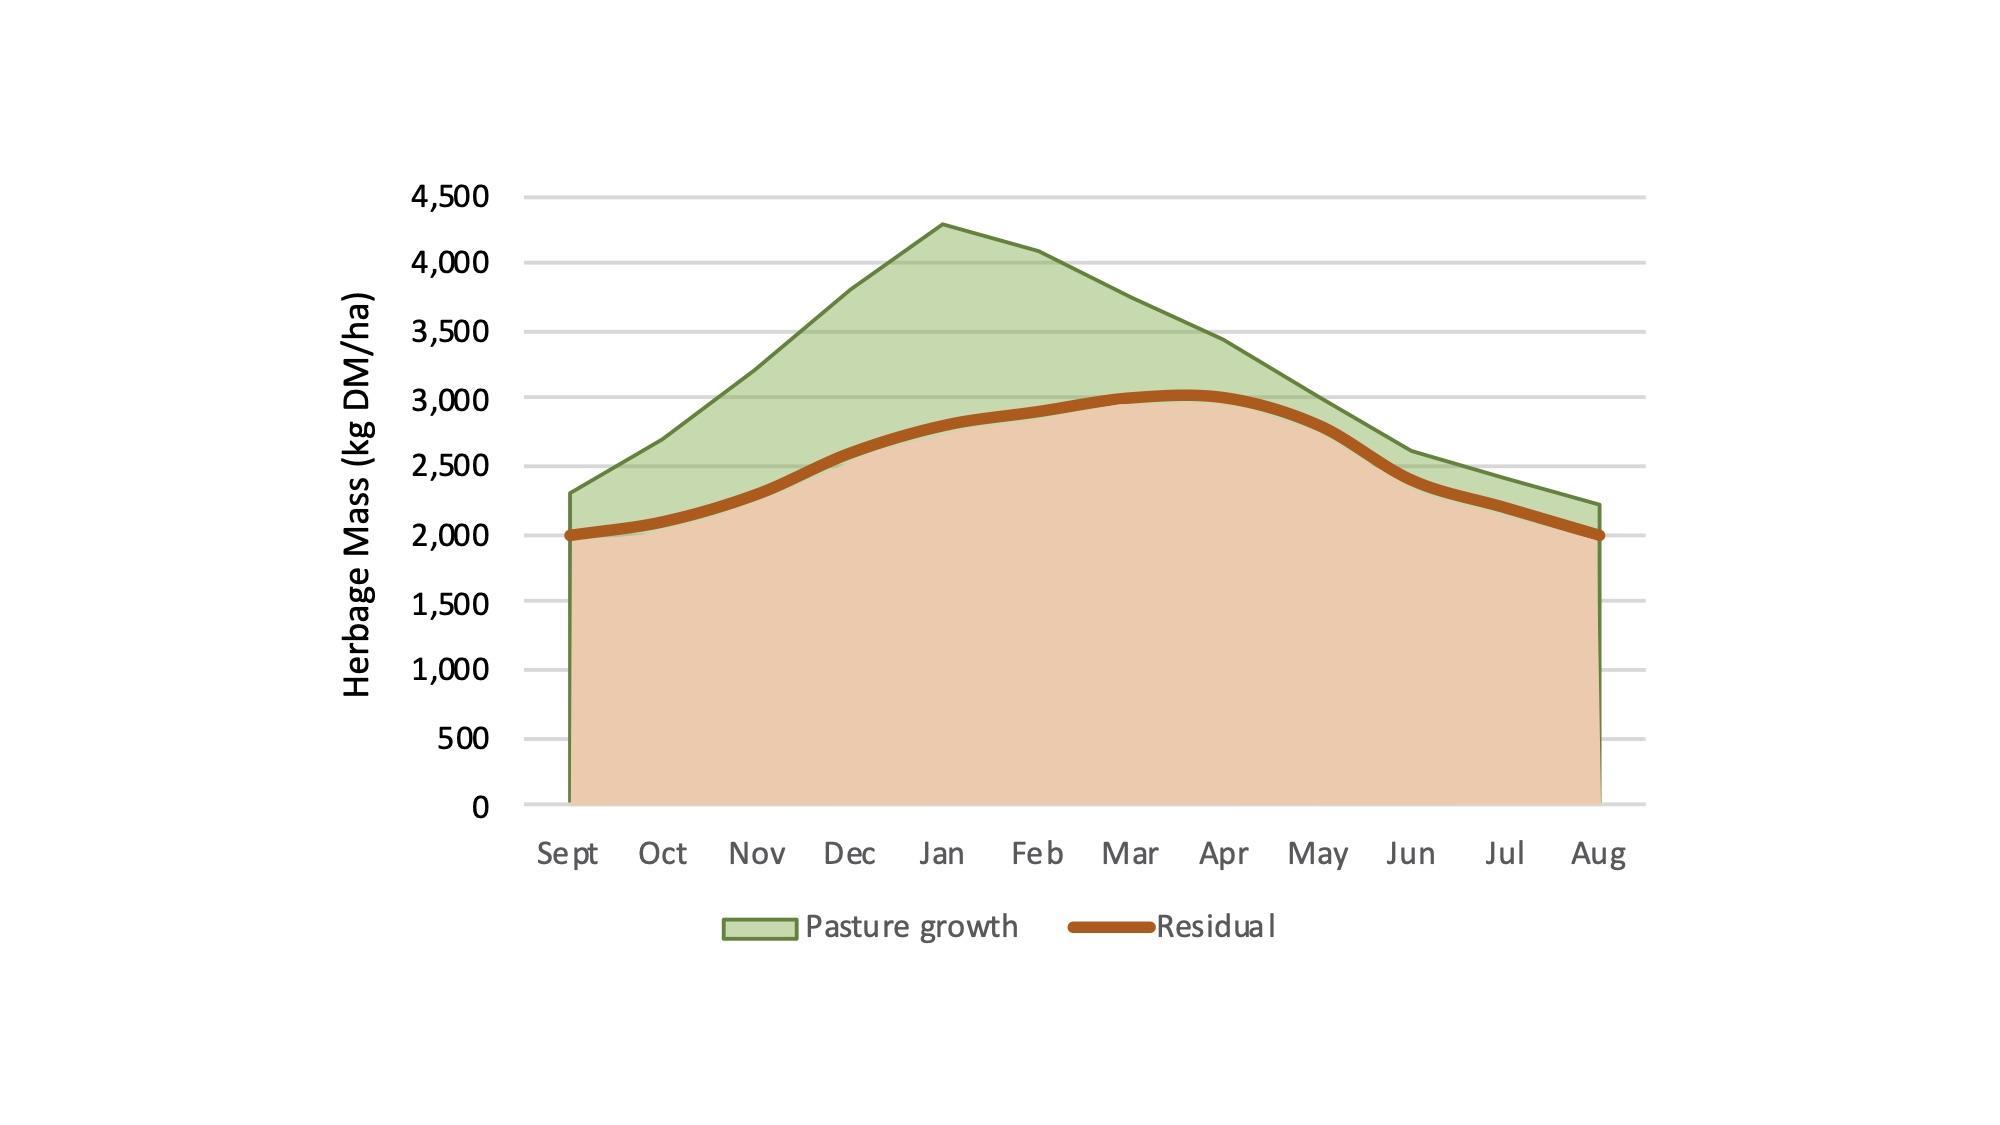
June July Aug Sept Oct Nov Dec Jan Feb Mar Apr May
The number of animals – Stocking rate
➢ Is the number of animals carried (DSE/ha)
➢ Usually calculated over a 12 month period
➢ Should always be matched to carrying capacity
➢ A key driver of enterprise profitability ?
Stocking rate had no effect on pasture growth rate
0 2 4 6 8 10 12 14 0 5 10 15 20 25 30 35 Pasturegrowthrate(kgDM/ha/day) Stocking rate (DSE/ha)
Pasture growth increases as utilisation rate declines
0 5 10 15 20 25 30 35 0 20 40 60 80 100 120 140 Utilisationrate(%) Pasture growth rate (kg DM/ha/day) Low utilisation High growth 19% High utilisation High growth 0% Low utilisation Low growth 26% High utilisation Low growth 55%
Grow more by leaving more
0 5 10 15 20 25 0 5 10 15 20 25 30 35 Pasturegrowthrate(kgDM/ha/day) Amountofdaily pasturegrowth leftaftergrazing (kgDM/ha/day)
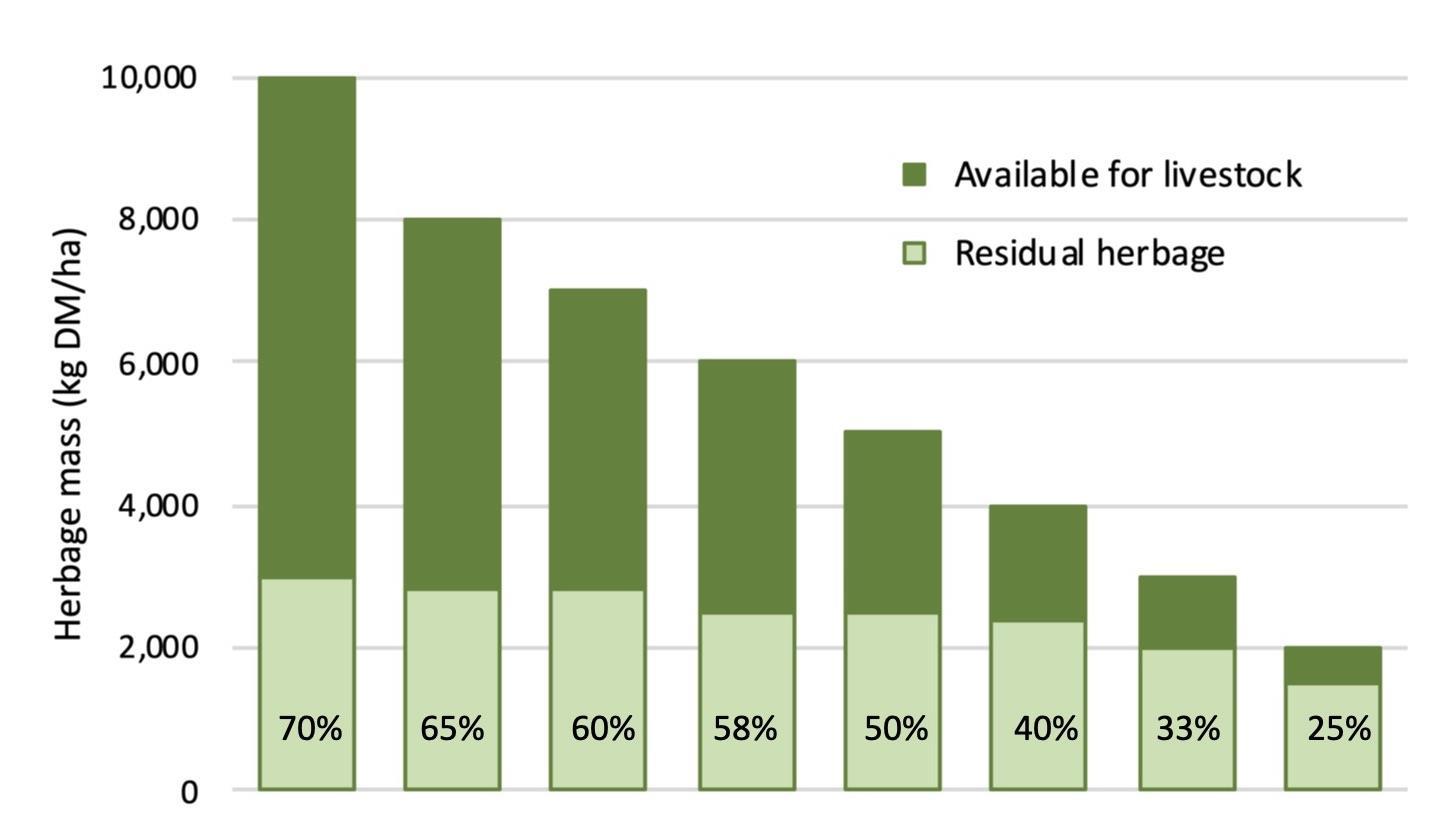
more
use more
leave more
Grow
-
-
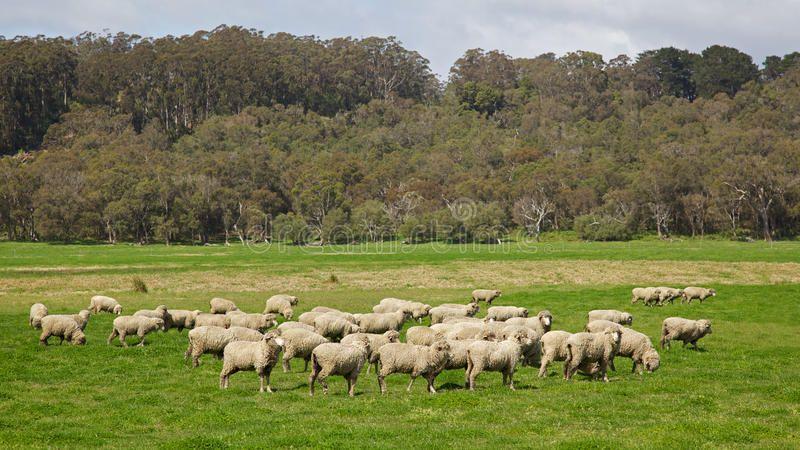
Selectivity - animal designed pastures
➢Animals are able to select from the pasture and graze ‘palatable’ plant parts and species.
➢Selective grazing modifies competition between plants in favour of less palatable species.
➢This allows unpalatable species to potentially better compete for water, nutrients and light.
Animal designed pastures
Animal grazing patterns
➢ Structure the vegetation and environment
➢ Change plant competitive interactions
➢ Influence mineral cycling
➢ Influence water use efficiency CAN BE MANAGED
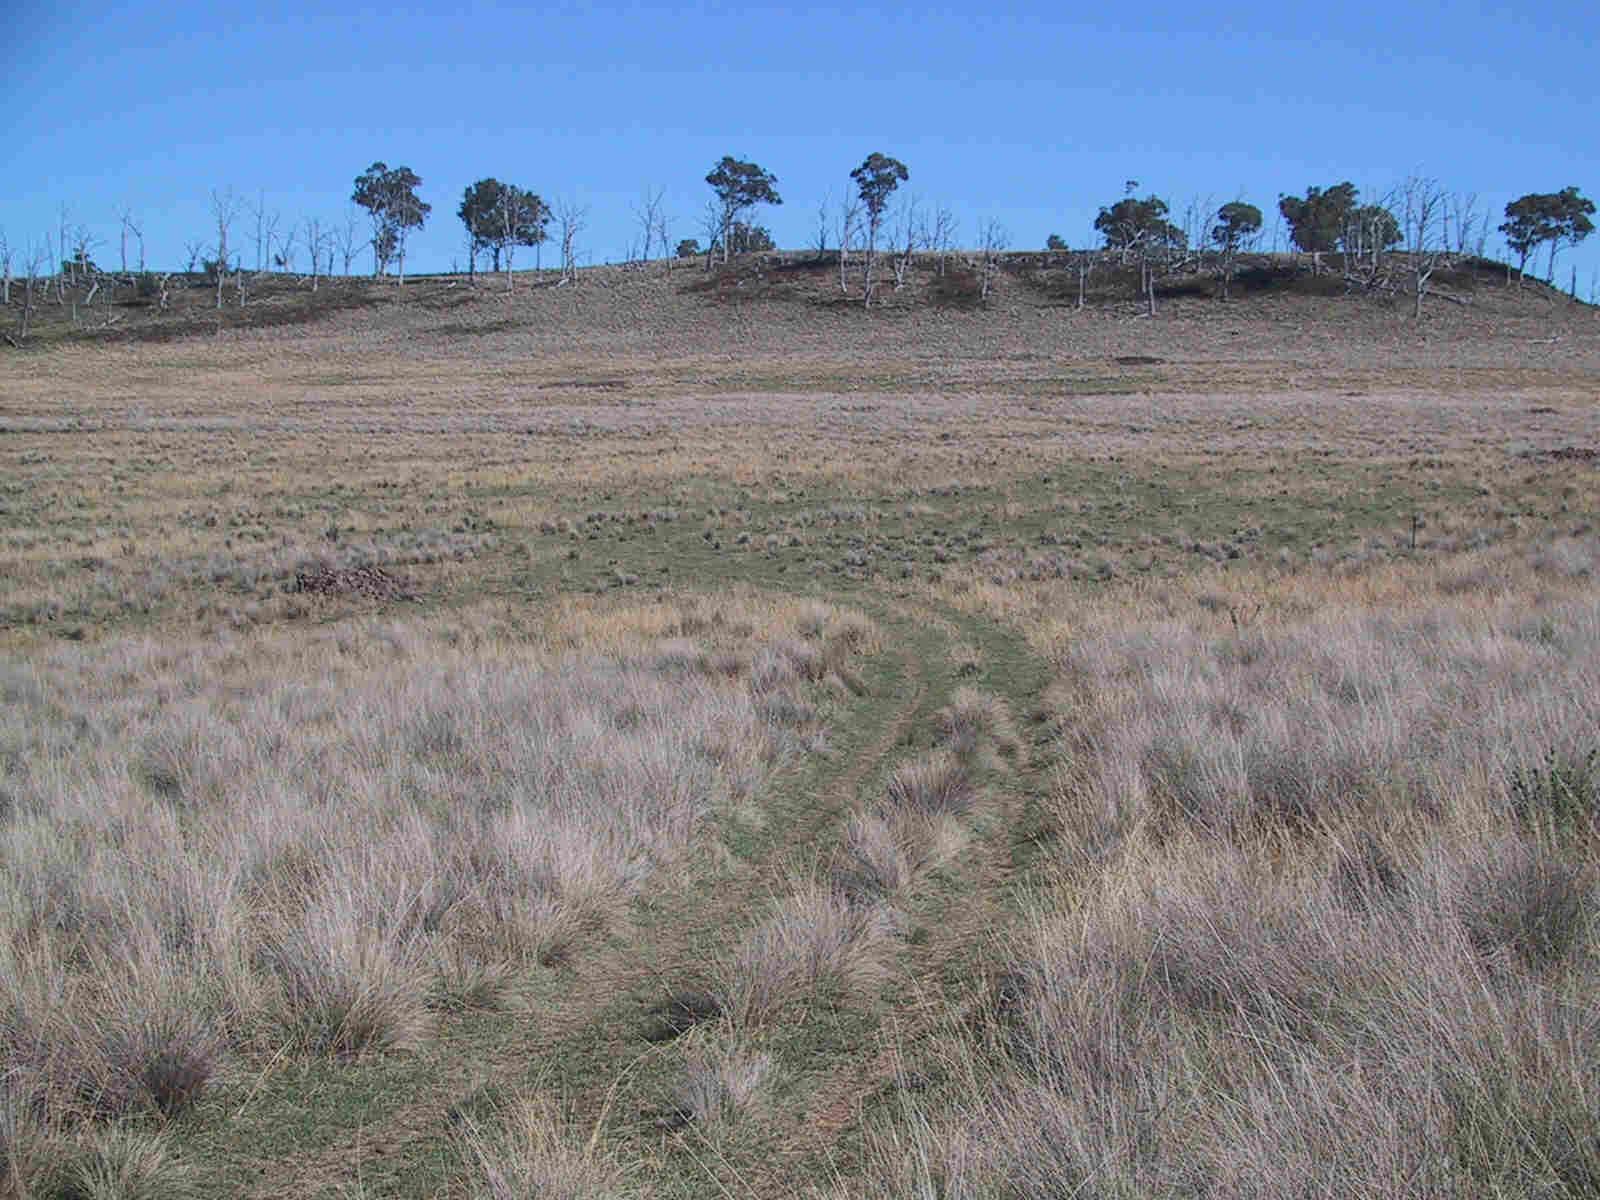
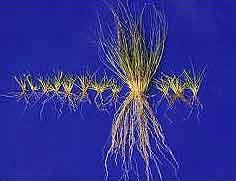
Remember: Plant material above the ground is a reflection of root material present below the soil surface
Photo: Christine Jones
Control of the grazing process
Planning the grazing allows you to control
➢ plant competition
➢ plant and pasture growth rates
➢ pasture utilisation
➢ pasture composition – species diversity
Control of the grazing process
Fewer & bigger mobs → more paddocks per mob
➢ Increases period between grazing events
➢ Provides relative advantage to selectively grazed species
➢ Provides potential to use stock density
➢ Provides potential to increase feed utilisation, stocking rate & pasture growth
Stocking rate & stock density
Uncontrolled grazing vs Controlled grazing
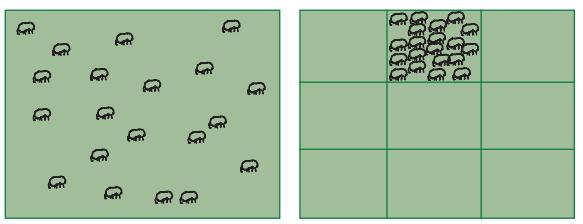
Same grazing area same number of stock
Stocking rate & stock density
Uncontrolled grazing vs Controlled grazing

1 paddock x 27 ha
ha
Stocked
@ 2.4 DSE Stocking rate = (100 x 2.4) = 8.9 DSE/ha Stocking rate = (100 x 2.4) = 8.9 DSE/ha 27 ha 27 ha Stocking density = (100 x 2.4) = 8.9 DSE/ha Stocking density = (100 x 2.4) = 80 DSE/ha 27 ha 3 ha
9 paddocks x 3 ha, total area = 27
Stocked with 100 ewes & lambs @ 2.4 DSE
with 100 ewes & lambs
Effect of number of paddocks

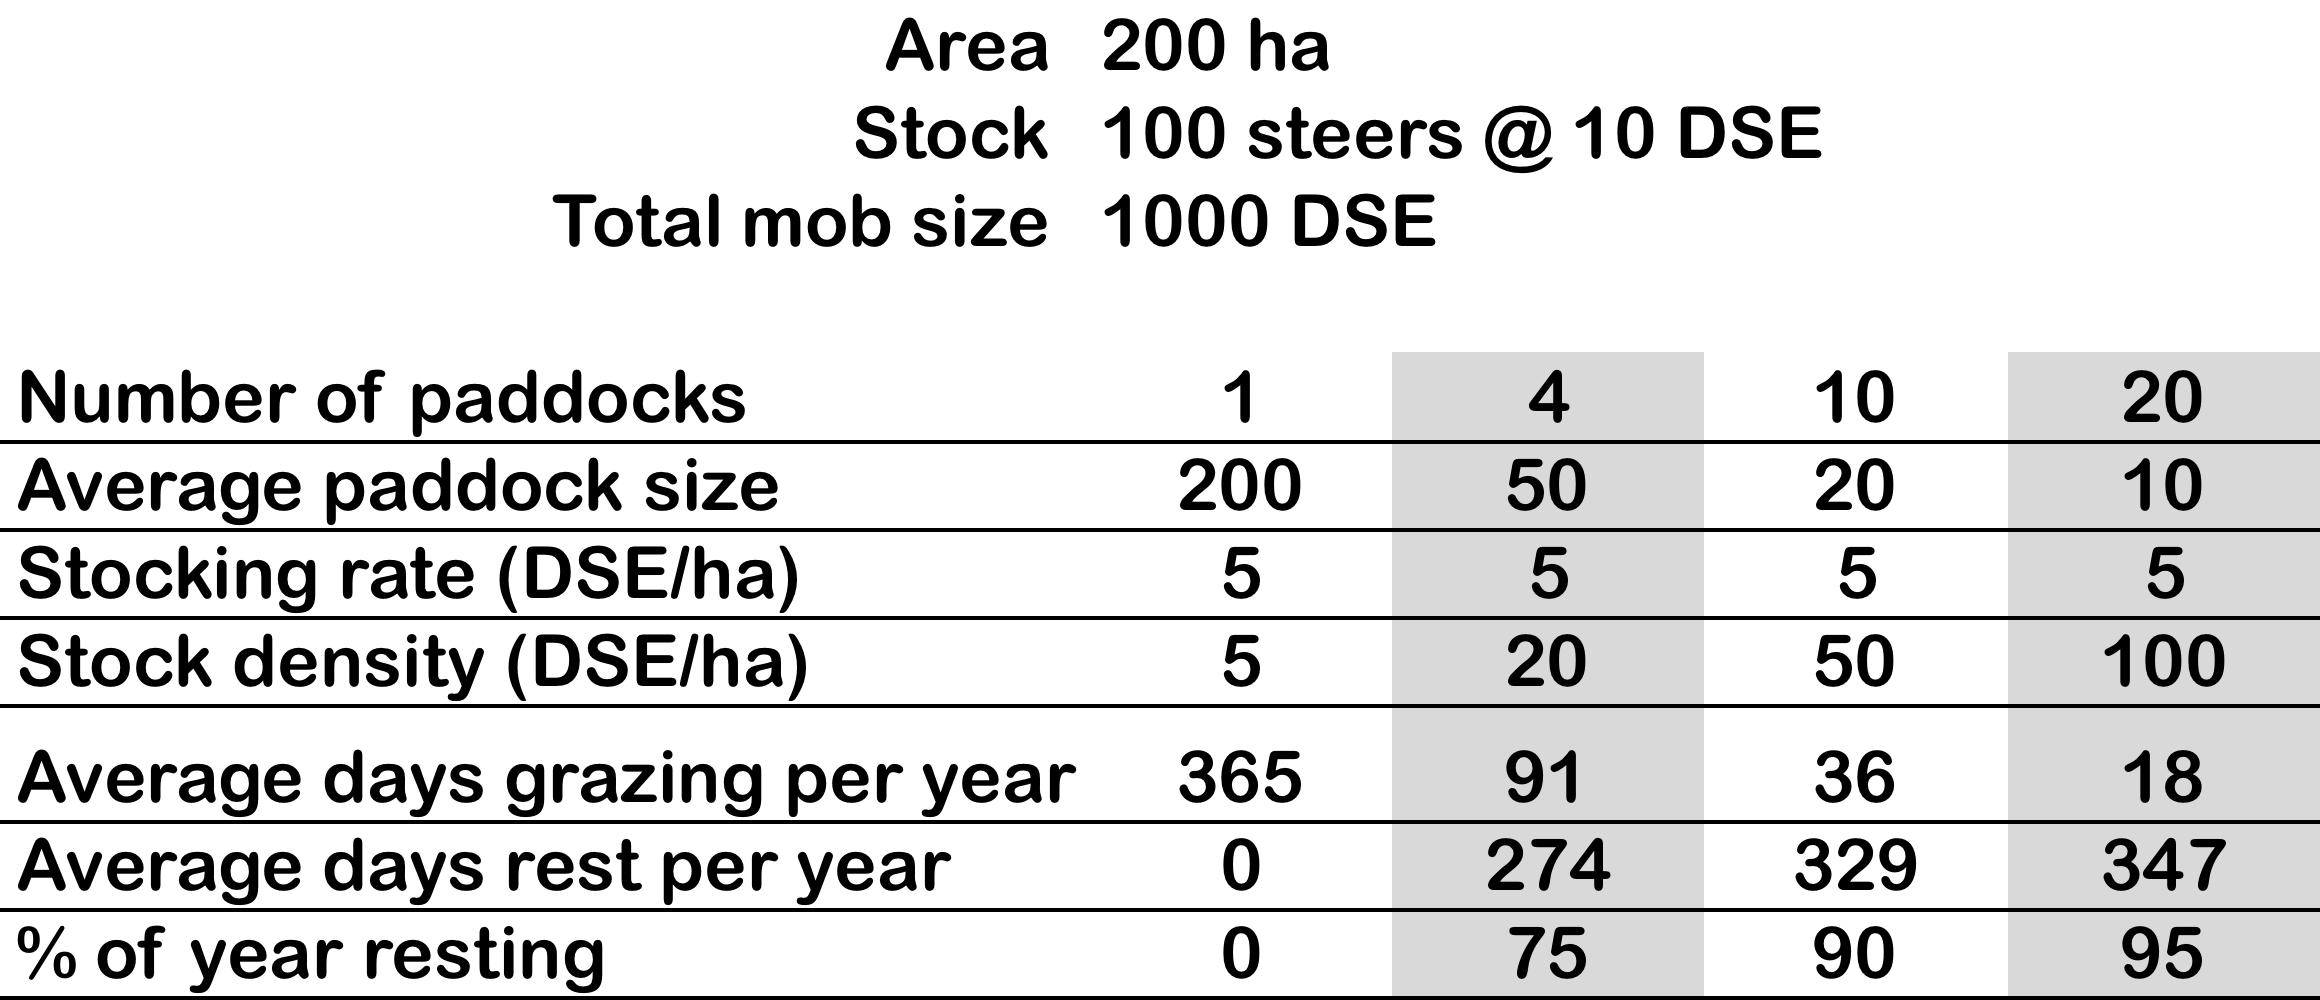
Effect of number of paddocks
Effect of number of paddocks per mob on the average graze period 15 1 3 5 7 20 1 2 4 5 25 1 2 3 4 30 1 2 3 3 35 1 1 2 3 40 1 1 2 3 0& 5& 10& 15& 20& 25& 30& 5& 10& 15& 20& 25& 30& 35& 40& A v e r a g e ' g r a z e ' p e r i o d ' ( d a y s ) ' Number'of'paddocks'per'mob' Recovery&period& &&&45&days& &&&75&days& &&&100&days& Adapted from Savory (1999) 5 10 15 20 25 30 35 40 30 25 20 15 10 5 0 45 days 75 days 100 days
Increasing paddocks per mob - advantages
➢ The capacity to use stock density to improve pastures and soil health
➢ More control over pasture utilisation
➢ More even pasture utilisation
➢ More plants impacted more evenly in any grazing event
➢ More even distribution of dung and nutrients
➢ More even plane of nutrition for grazing livestock
➢ Livestock move frequently onto fresh pasture
➢ Livestock become quiet to handle with frequent moves
➢ Regular inspection of stock to identify any health issues early
0 1 2 3 4 5 Time (days grazing) 3,000 2,000 (kg DM/ha) Desired residual @ 200 DSE/ha @ 50 DSE/ha Available 0 1 2 3 4 5 6 7 8 9 10 11 12 13 14 15 16 17 18 19 20 Time (days grazing) 3,000 2,000 (kg DM/ha) Desired residual Available herbage
risk of second bite
Stock density
Increased
Realistic stocking rates in the region
Realistic stocking rates in the region

Summary
➢ There are a limited number of factors that can be controlled by management
➢ Recovery period and rest period are not the same
➢ The graze period in any paddock will be a function of the required recovery period
➢ Utilisation has a significant impact on productive potential in short and long term
➢ Grow more – leave more – use more
➢ Stock density is an important tool to drive pasture change
➢ Today – reduce number of mobs ! Increase the number of paddocks per mob