9.1 million tonnage through shannon foynes port 2.1 million passengers through shannon airport
30,155 THIRD LEVEL ENROLMENTS
NUMBER OF GRADUATES
10,665
2,661
NUMBER OF APPRENTICES
While demand remains high, new housing supply is critically insufficient to meet requirements. In the run up to the General Election in 2024, it was widely reported that the last Government expected to build close to 40,000 homes in 2024. Not only did Ireland not meet this level of output, but output decreased from the previous year (down by 6.7%) reaching 30,366 completions in 2024.
However, Limerick and Clare were not affected by the national decline with both counties registering increases in housing output. Limerick completed 1,023 homes (+29.3% on the previous year). Clare also boosted completions by 34.2%. Tipperary was the only county in the Mid-West to decrease (-4.5%). However, at the regional Mid-West level housing completions were 20.4% up on the previous year.
While any increase in new home completions is welcome, Limerick is still far off meeting projected demand. The independent Housing Commission projects that Limerick will need annual completions of between 2,000 and 4,300 homes to adequately deal with the demand within the system.
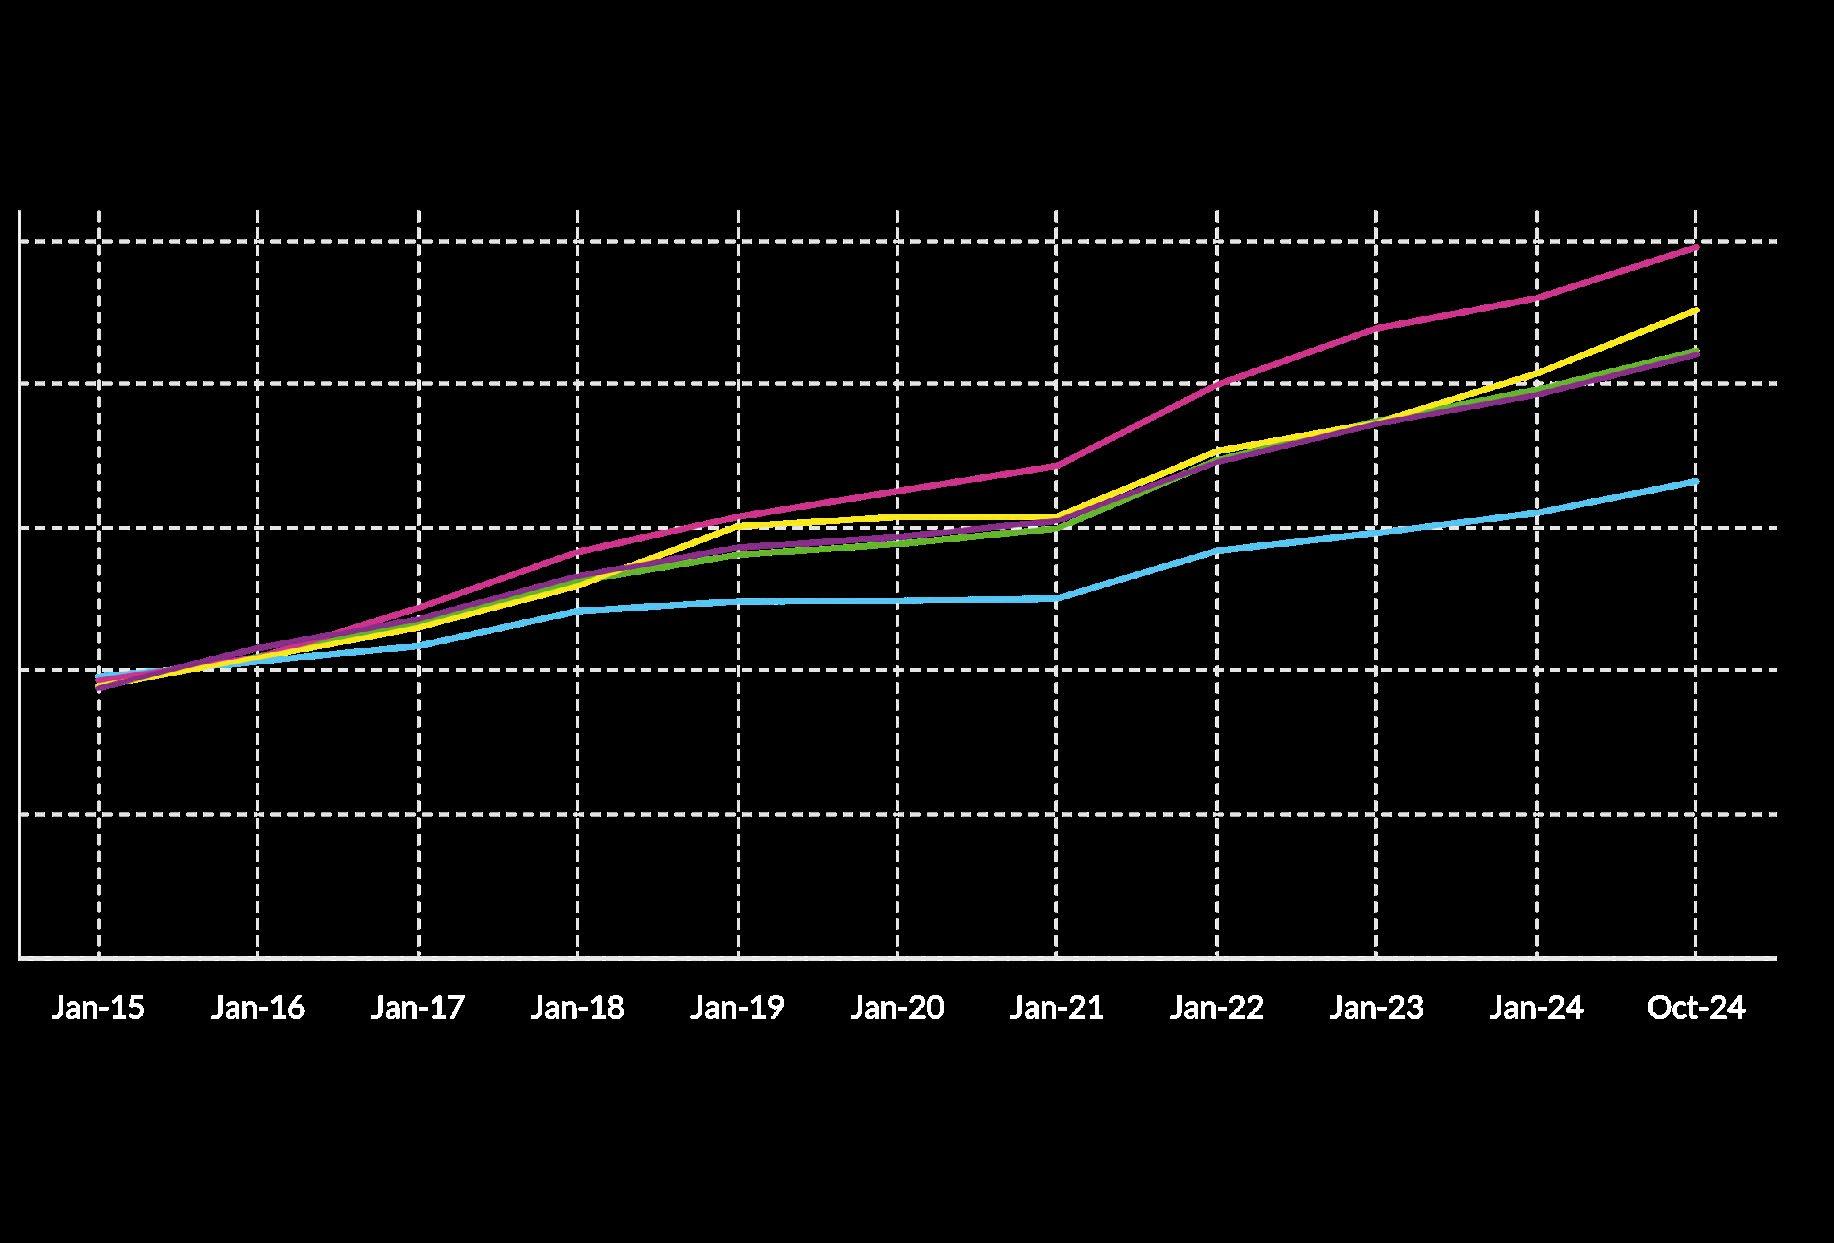
The ongoing supply issues in housing is unsurprisingly a key driver in the cost of purchasing homes (and renting). House prices continue to drastically increase, both nationally and locally. The Mid-West is rapidly outpacing the national trend. When looking at the Residential Property Price Index, national house prices increased by 10.0% in the last year alone. The Mid-West increased by 13.5%, reaching a series high in 2024 sitting at 225.9. House prices in the region are now 44.0% more expensive than in 2019.
Looking at counties individually, Limerick City is now 16.5% more expensive than it was for purchasing a new home in 2019 with an additional cost of almost €58,000. During this time Limerick County has seen an increase of almost €70,000 (+21.7%). While Tipperary and Clare have both seen significant increase of 47.7% and 34.0% respectively.
Price and supply issues are not only impacting purchasers, but also renters too. Limerick City rents have surged by 76.3% since 2020, now averaging €2,221 per month, making homeownership a more attractive option in some cases but still causing affordability issues for workers choosing to rent. Nationally, the increase was 37.8%. Limerick City is not the only location in the Mid-West to suffer rapid rental inflation. Limerick County (+68.3%), Co. Clare (+60.8%) and Co. Tipperary (+62.7%) are all experiencing similar trends.
There is heavy distortion in the housing market with the state increasing its reliance on the private sector to deliver social housing. In terms of new social housing, there has been a decrease in direct building by social housing providers, instead opting to enter into engagements with private landlords for rental, and builders / developers for the purchasing of homes. In Limerick, between 2022 and 2023 there was a 21.4% increase in the number of social homes rented through the private market. A similar issue is present in Clare with 51.4% of all new social homes in 2023 being sourced from the private market through the likes of leasing, the Rental Accommodation Scheme and the Housing Assistance Payment. Tipperary is following a similar trend, increasing its homes sourced through the private rental market by 25.0%.
Not only are various organs of the state entering agreements with private landlords for rental, but they are also purchasing homes from private developers. The purchase of homes by non-household entities peaked in Limerick in 2023 with 57.1% of housing transactions. In Clare, this was 54.3% and in Tipperary it was 33.3%.
IN
TER
EST
INGLY
There is also a price premium paid by household buyers, when comparing prices paid to nonhousehold entities.
Interestingly, there is also a price premium paid by household buyers, when comparing prices paid to non-household entities. In Limerick, in 2023, household buyers paid almost €20,000 more than non-household entities, in 2022 this was almost €70,000. While in Clare, non-household entities pay more than household buyers. This interference in the private rental and purchase market is decreasing overall supply available to workers that have no other choice but to buy and rent on the private market.
Concerningly, affordable housing (housing targeted towards workers) has yet to get going to any real extent across the Mid-West. As of Q3 2024, Limerick delivered 314 affordable homes, with 73.6% for purchasers and 26.4% for renters, including 61 new homes via Approved Housing Bodies. Clare and Tipperary delivered 85 and 79 affordable homes, respectively, with over 93% in both counties allocated to purchasers, primarily through the First Home Scheme and the Refurbishment Grant. Nationally, 5,862 affordable homes have been delivered across Ireland’s five cities since 2022, with Dublin (61.1%) and Cork (25.5%) leading. Purchaser schemes accounted for 68.3% of national delivery, while Dublin dominated cost rental delivery.
Overall, the stark gap between completions and demand requires a ramp-up in new home delivery, particularly for first-time buyers and young professionals. The overreliance on institutional purchases for social housing provision should be balanced with greater access for private buyers while boosting state capacity to deliver affordable homes directly, thus reducing reliance on the private market. In terms of affordability, the existing schemes, while helpful, are insufficient, requiring greater improvements in delivery to boost the affordable market cohort.
ENTERPRISE & EMPLOYMENT
‘THE MID-WEST CONTINUES TO EXPERIENCE RECORD EMPLOYMENT
LEVELS’
The Mid-West continues to experience record employment levels. 274,000 people were employed in the region in Q3 2024, an increase of 7.9% YoY. Unemployment across the Mid-West now sits at 4.5%, down from 5.2% in the previous year. Live register figures also show positive signs with the monthly number of people on the register decreasing from the previous year across all counties of the Mid-West. The industrial sector remains the largest sector for employment with 45,700 employees. In the most recent quarter, there were big employment gains for some sectors with Transportation & Storage (+71.1%) and Information & Communication (+41.8%).
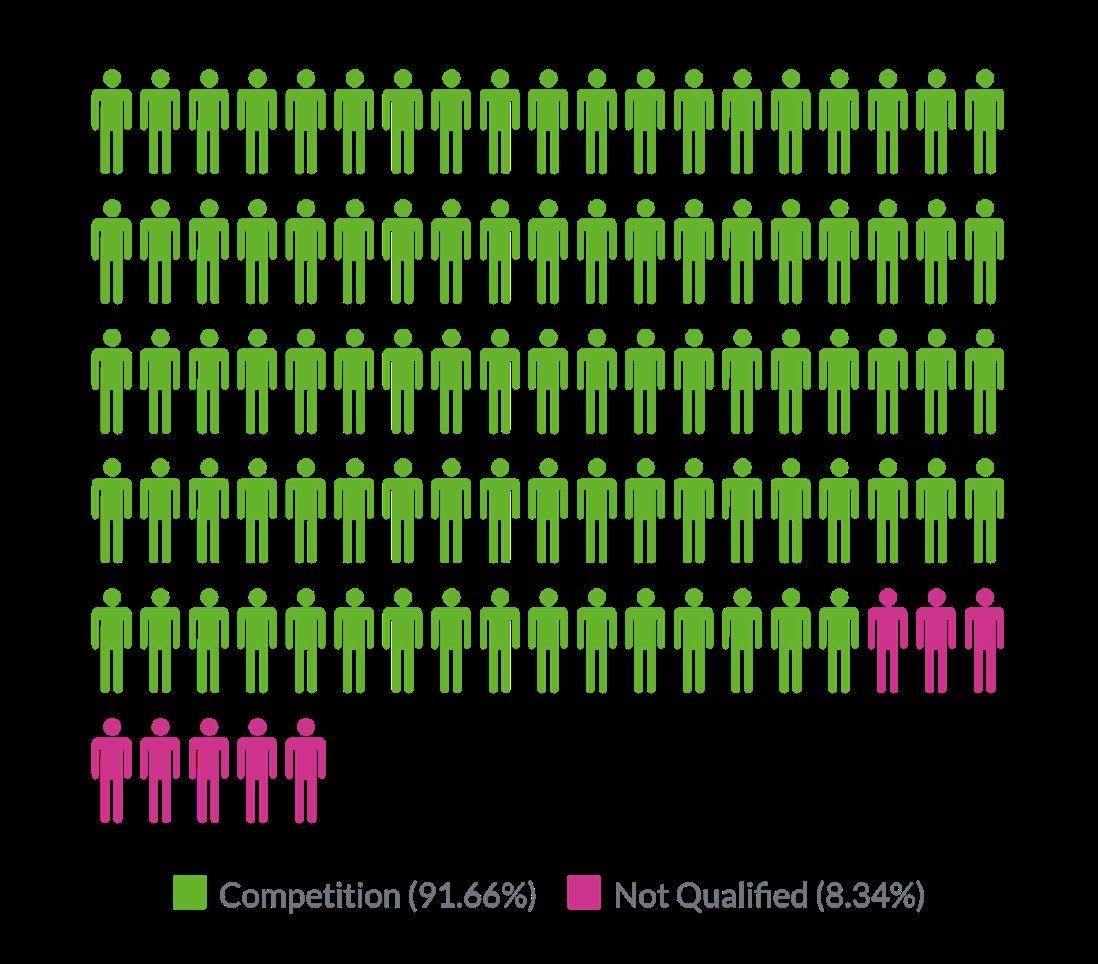
However, there were declines in Healthcare (-12.7%) and Agriculture (-4.2%). There were 27,257 IDA-supported jobs in the Mid-West in 2023, a 2.6% increase YoY. In contrast to a decline registered at national level. The Mid-West continues to remain an attractive prospect for international workers. In 2024, Limerick had the fourth-highest share of work permits nationally, with 1,905 permits issued, a 19.1% increase from 2023. Tipperary saw a 32.4% rise reaching 703 permits, while Clare also experienced a 32.5% increase, reaching 657 permits. The Mid-West region accounted for 8.3% of total work permits issued in Ireland.
CONCERNINGLY
ALMOST HALF OF THE MID-WEST GVA (SIMILAR TO REGIONAL GDP) IS MADE UP BY THE MANUFACTURING SECTOR, MAKING THE MID-WEST MORE PRONE TO SHOCKS.
The Mid-West had the third highest regional Gross Value Added (GVA) in 2023 at €31.4 billion. Concerningly, almost half of the Mid-West GVA (similar to regional GDP) is made up by the manufacturing sector, making the MidWest more prone to shocks. However, the manufacturing sector within the Mid-West is highly diverse. When adjusted for population, Dublin has the highest GVA per capita at €157,000, followed by the South-West at €155,000 and the Mid-West at €61,000. The Border region records the lowest GVA per capita at €29,000.
In 2023, Limerick ranked third nationally for disposable income at €29,491, behind Dublin and Cork. Tipperary ranked fourth (€29,209), while Clare ranked 19th (€25,103). Disposable income grew by 10.8% in Limerick, its highest YoY growth since 2001, while Tipperary saw a 10.2% increase, also the highest since 2001. Clare’s disposable income rose by 8.3%, its highest growth since 2012. Due to improvements in data collection and methodological changes Limerick has moved from second place behind Dublin, to third place behind Cork.
While international investment is strong, and welcome, we need to ensure a parallel focus on indigenous business growth. Combined with this, we need to continually ensure that improvements are made in the quality of life in the Mid-West to ensure we retain and attract highly skilled individuals. Housing is of particular note in this instance, so too is childcare and school places, as well as transport options and commuting time.
30,155 STUDENTS
WERE ENROLLED IN FULL- AND PART-TIME THIRD-LEVEL PROGRAMMES ACROSS THE MID-WEST
EDUCATION & SKILLS
‘APPRENTICESHIP PROGRAMMES IN LIMERICK, TIPPERARY AND CLARE HAVE SEEN STRONG GROWTH.’
In 2023/24, 30,155 students were enrolled in full- and part-time third-level programmes across the Mid-West, a 0.1% decrease from the previous year. Education (19.4%) was the most popular field of study, followed by Business, Administration & Law (17.7%) and Engineering, Manufacturing & Construction (16.0%).
Irish students made up 89.9% (27,120) of enrolments, with non-EU students growing rapidly (+18.3% per year on average since 2021/22), driving overall enrolment growth.
The graduate pipeline remains strong with 10,655 graduates in 2023, an increase of 4.1% YoY, with 19% holding master’s degrees
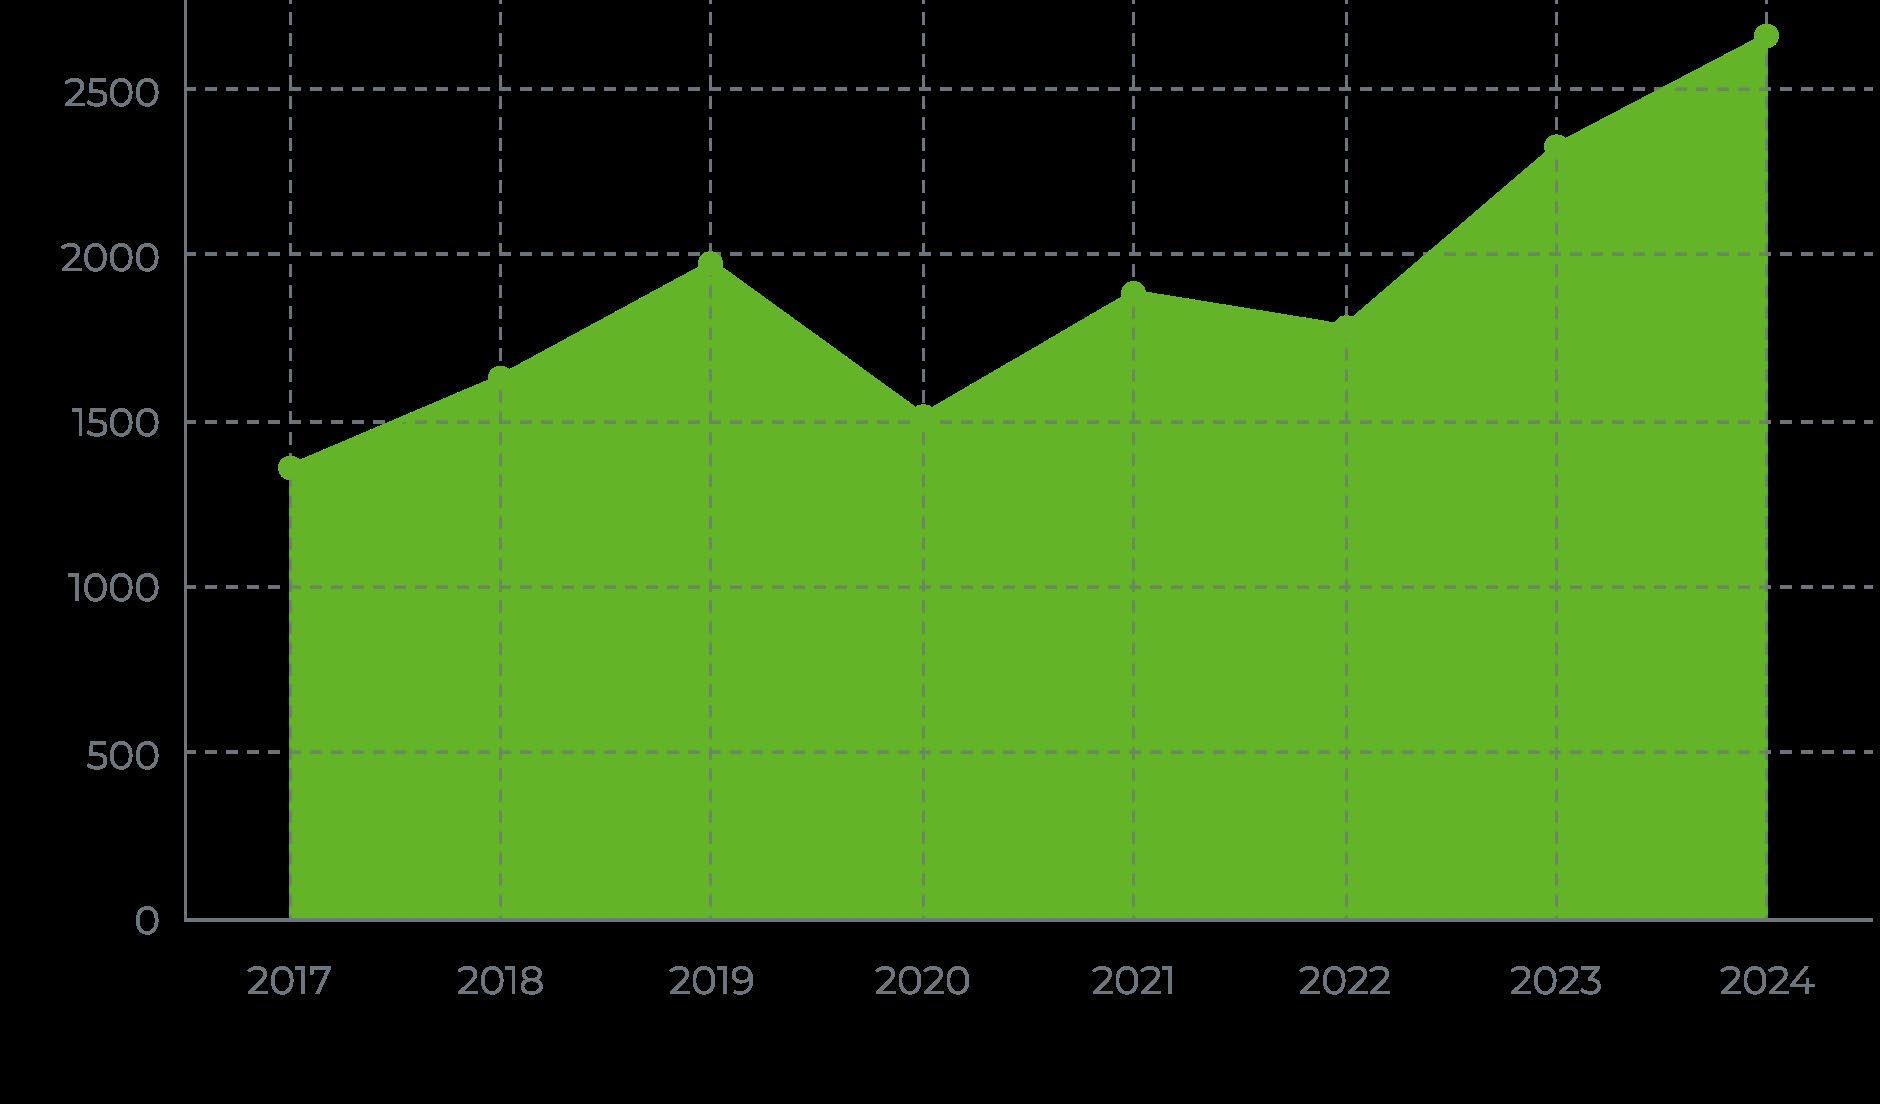
Apprenticeship programmes in Limerick, Tipperary and Clare have seen strong growth, with 2,661 places in 2024, a 14.4% increase over 2023. Since 2017, apprenticeship numbers in the Mid-West have grown 14.5% annually.
The Mid-West’s educational institutions are a key driver for businesses choosing to invest in the region. Like attracting skilled workers, it is imperative that quality of life infrastructure is continually invested in to ensure the region attracts and retains the necessary skills. Of concern, is a drop in enrolments, that has largely been bolstered by international students. This data must be monitored to ensure the region continually remains attractive to students.
THE MID-WEST’S EDUCATIONAL INSTITUTIONS ARE A KEY DRIVER FOR BUSINESSES CHOOSING TO INVEST IN THE REGION
It is imperative that we have a public and private transport system that supports this continued growth
Transport Travel
Shannon Airport passenger numbers grew 7.0% YoY, but Dublin Airport still dominates (84.6% of all passengers) . This is a major concern for regional development and national security by failing to diversify our aviation sector appropriately. Shannon Airport accounted for 4.9% of all Irish airport passengers in the first three quarters of 2024, increasing by 106,000 passengers compared to the same period in 2023. The airport’s top three destinations were England, the United States, and Spain.
Limerick Bus Éireann passenger numbers are almost at full recovery, reaching 92.3% of pre-pandemic levels. Passenger numbers reached 3.6 million in 2023 representing a 20.0% increase in passengers from previous year and providing an indication of a healthy demand for public transport schemes across the city. However, the ability to expand public transport could be cause for concern when looking at licensed bus drivers. The number of licensed bus operators is declining across the Mid-West. In 2023, Limerick had 60 operators, Clare had 51, and Tipperary had 54, all trending downwards since their peak years.
The Bicycle-sharing scheme is also rebounding from a dip due to the pandemic reaching 13,945 trips in 2023 an increase of 48.1% on the previous year. The National Transport Authority’s Walking & Cycling Index also provides positive news for cycling across Limerick. With the annual number of cycling trips in Limerick was 3.4 million in 2023, covering 14.8 million km.
New private vehicle registrations are also mostly up across the region. In 2024, new car registrations increased in Limerick (+2.6%) and Clare (+2.9%), while Tipperary saw a slight decline (-0.9%). Despite an increased appetite for private vehicles the average number of kilometres travelled on an annual basis is continuing to decline. For Limerick, the annual average kilometres travelled has decreased by 13.7%, in Clare it has decreased by 12.1% and in Tipperary it has decreased by 11.2%.
There needs to be a continued drive from stakeholders in the Mid-West to call for the increased utilisation of Shannon Airport. Furthermore, with the levels of employment in Limerick and the Mid-West never seen before, it is imperative that we have a public and private transport system that supports this continued growth, by linking in with existing and new housing developments to enshrine transport-oriented development into the region.
Shannon Foynes Port continues to be a prime logistic hub and strategic asset to the region.
In 2024, Limerick, Clare, and Tipperary saw steady growth in new goods vehicle registrations, reflecting broader national trends. Limerick saw 12.9% growth from the previous year in new goods vehicles licensed. Clare increased by 10.8%. Tipperary increased by 16.5%. Despite increased appetite across the region for new goods vehicles, like private vehicles the annual kilometres travelled are declining with Limerick decreasing by 8.3% in 2023, Clare decreasing by 12.8% and Tipperary by 10.5%.
The Mid-West’s share of national road freight has declined from 13.9% (2010) to 10.1% (2023). Freight volumes rebounded after a low in 2012 but remain 6.2% below 2009 peak levels. Despite not reaching its previous peak, freight volumes have been on an upward trend over the last four years reaching almost 16 million tonnes in 2023. The number of licensed road hauliers may be a cause for concern with severe declines registered since the onset of the financial crisis in 2008/09, however this decline has levelled off in more recent years. Over that time period, the number of licensed road hauliers have decreased by 39.7% in Limerick, 27.9% in Tipperary and 48.4% in Clare.
Shannon Foynes Port continues to be a prime logistic hub and strategic asset to the region. The port remains Ireland’s leading dry bulk port, handling 7.6 million tonnes in 2024, an 11.0% increase on 2023—the first annual growth since 2021. Despite this rebound, its national market share has declined from 63.6% in 2011 to 50.4% in 2023. Bauxite imports, which account for nearly 50% of dry bulk tonnage, fell by 20% in 2023, leading to a 13% decline in alumina exports. Shannon Foynes Port processed 1.2 million tonnes of liquid bulk in 2024, a 16.7% YoY increase, capturing 12.1% of Ireland’s total liquid bulk traffic. It was one of only two ports to see growth. However, Shannon Foynes remains a secondary player compared to Dublin (46.6% market share) and Cork (38.3%). Shannon Foynes Port handled 326,000 tonnes of break bulk in 2024, growing 6.1% YoY, and remains the largest break bulk handler in Ireland. Its national market share has expanded from 14.6% in 2014 to 22.0% in 2023, indicating a consistent upward trend. Construction and industrial demand drive break bulk volumes, though rising construction costs could impact future growth.
Shannon Foynes Port is a critical logistics hub, but infrastructure investment is needed to maintain competitiveness and consistently improve infrastructure. Particularly when it comes to port investment. Given Limerick’s proximity to the Shannon Estuary and Atlantic Ocean, and the untapped energy potential that lies therein this is of particular importance.
CONCLUDING REMARKS
Limerick is poised for economic expansion, but challenges in housing and transport, must be addressed. Many of the challenges highlighted in Limerick Chamber’s past MidWest Economic Insights (MWEI) remain unresolved especially when it comes to housing and infrastructure. Some specific businesses continue to face difficulties in recruiting staff; however, the unemployment rate has increased from our previous edition of the MWEI indicating more people are available for work. However, the outstanding question is whether those people have the appropriate skills or not? It is unsurprising that the number of work permits issued for the Mid-West continually increases.
However, if the Mid-West wishes to continue attracting international workers with skills, we need to ensure the appropriate infrastructure is put in place, such as housing, childcare, health etc.
Despite these challenges, the Mid-West remains well-positioned in terms of employment levels and has experienced significant post-COVID growth. Shannon Airport continues to demonstrate resilience and Shannon Foynes Port remains a key asset for the region, offering vital international trade access and serving as Ireland’s largest port for break and dry bulk cargo. The port’s role in advancing offshore renewable energy further enhances its strategic importance.
The Mid-West continues to supply a steady stream of graduates to meet the needs of current and prospective employers. This talent pipeline is supported not only through third-level education but also through apprenticeships and further education and training programs. Again, retention of these skills is critical to business, and we must ensure appropriate infrastructure is put in place to ensure these graduates stay within Limerick and the Mid-West.
Delays persist in major transport and housing infrastructure projects which is cause for huge concern given the data provided in this report and will be a priority for Limerick Chamber in the coming year.
PROPERTY HOUSING
WHILE DEMAND REMAINS HIGH, NEW HOUSING SUPPLY IS CRITICALLY INSUFFICIENT TO MEET REQUIREMENTS.
RESIDENTIAL PROPERTY PRICE INDEX (RPPI):
The RPPI shows changes in the price of homes. National house prices increased by 10.0% year-on-year (YoY) to October 2024, while national house prices excluding Dublin grew by 9.4%.
The Mid-West grew by 13.5%, above the national average. This was the largest YoY increase for the Mid-West since March 2022.
Meanwhile, the Western Region, underpinned by Galway, saw a YoY increase of 10.1% while the South-West, underpinned by Cork, saw an increase of 9.1%.
From a month-on-month (MoM) perspective, house prices increased at national level for the seventeen consecutive months to October 2024.
The RPPI continues to reach new highs for the Mid-West, sitting at 225.9 in October 2024. This outlines that house prices in the Mid-West have grown by 44.0% since October 2019 – above the national average of 40.1%. The Western Region grew by 52.5%, and the South-West by 45.3% over the same period.
AVERAGE & MEDIAN PRICE (NEW
HOMES):
For October 2024, the average national house price for all buyer types of new homes was €482,000. This represents a 4.9% price increase YoY. Averaging €469,000 for Q3 2024.
For Limerick City, the average price was €330,000 in October 2024 – with an average price for Q3 2024 reaching €408,000. In Limerick County, the average price was €366,000 while Q3 2024 averaged €385,000.
Co. Clare registered an average price of €505,000 for October 2024 and averaged €383,000 for Q3. Co. Tipperary reached €257,000 in October but averaged €325,000 for the entirety of Q3. For Clare, this average price is very much a temporary increase in the data.
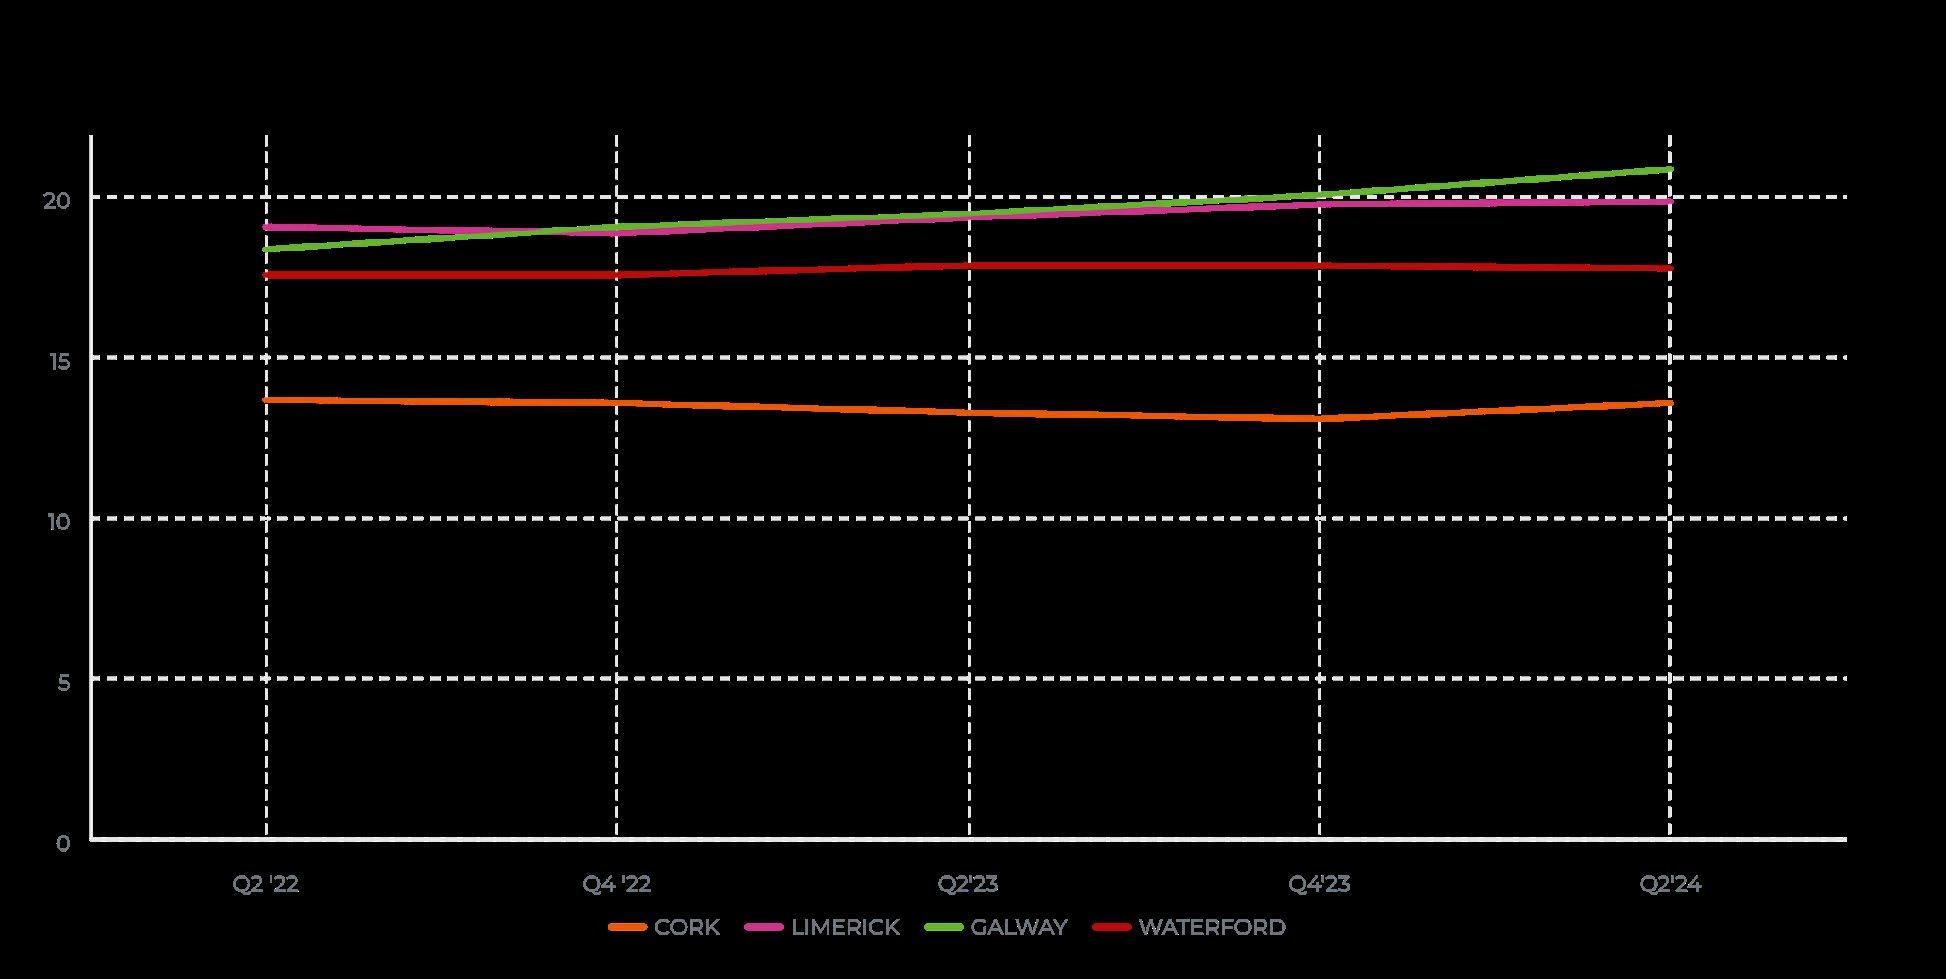
Comparatively, in Q3 2024, Cork City had an average price of €701,000, Galway City had an average price of €481,000 and Waterford City had an average price of €322,000.
The average sale price can often be skewed by house prices being sold at opposite ends of the price scale, and therefore it is also worthwhile to examine the median. This is particularly relevant for areas with a lower sales volume, for example from January 2023 to October 2024 (22 months), in Limerick City there were five months with no sales recorded.
In October 2024, the median national house price for all buyer types of new homes was €447,000, a 3.9% increase YoY.
Limerick City’s median house price stood at €330,00. Limerick County’s median price stood at €374,000.
Co. Clare was €525,000 in the month of October, a clear outlier in the series with the median normally reaching €343,000. Tipperary saw a median home price of €250,000 in October.
Comparatively, Cork City had a median price of €785,000 in October, Galway City had a median of €480,000 and Waterford City had a median of €308,000.
For first time buyers (FTB), specifically, the median national price paid was €425,000 in October 2024. In Galway City it was €420,000. In Limerick City it was €336,000, in Limerick County it was €375,000. Co. Tipperary was €250,000. In Waterford City it was €302,000. Neither Co. Clare or Cork City recorded any FTB sales in October 2024. In September, Co. Clare saw FTBs pay €345,000 and August saw FTBs in Cork City pay €502,000.
STATE SCHEMES
Excluding state schemes such as Help-toBuy (which can be used as a deposit) and the First Home Scheme (Shared Equity). FTBs must have significant salaries to purchase the median home in their respective counties (as single buyers). For example, in Limerick County an annual salary of €84,000 is required to purchase a home as a single person, meanwhile in Tipperary it is €56,000 per annum (in addition to having a 10% deposit).
Regardless of buyer type, or median / averages, the long-term trend for home prices in all the above areas is on a significant upward trend
AVERAGE PRICE
For Limerick County, the average price was €310,000 in October, a 7.8% increase YoY.
Average Price (Existing / Second-hand Homes):
For October 2024, the average national house price for all buyer types of existing (secondhand) homes was €404,161 – 16.2% cheaper than the average new home. This represents an 8.3% price increase YoY.
EXISTING HOME PRICE
For first time buyers (FTB) in Limerick County it was €301,000 (+4.6% YoY) €
For Limerick County, the average price was €310,000 in October, a 7.8% increase YoY. In Limerick City, the average price was €261,000 an increase of 2.6% YoY. Unsurprisingly, the long-term trend for existing homes is upwards and looks to continue for some time into the future.
Co. Clare registered an average price of €303,000 for October 2024 an increase of 16.9% YoY. Co. Tipperary reached €266,000 in October an increase of 24.2% YoY. Like Limerick, the long-term trend in both Clare and Tipperary have been upwards, with no sign of slowing or decreasing.
For first time buyers (FTB) specifically, the average national price paid was €368,000 in October 2024. In Limerick City the average price paid was €266,000 (+6.1% YoY), in Limerick County it was €301,000 (+4.6% YoY) in Clare it was €305,000 (+10.1% YoY) and for Tipperary it was €264,000 (-5.1% YoY). While shorter year-on-year trends can show moderate movements increasing or decreasing, looking at longer term trends the price is continuing to trend upwards.
The average national house price for all buyer types of existing (second-hand) homes was cheaper than the average new home.
COUNTY LIMERICK 4.6% 7.8%
COUNTY LIMERICK FIRST TIME BUYERS (FTB)
Nationally, 30,366 homes were completed in 2024 representing a 6.7% decrease on the previous year (or 2,182 homes). However, housing output did not decrease in each county. For example, of the 31 Local Authorities, 17 registered increases in housing output. 2,053 homes were completed across the entire Mid-West, a 20.4% increase on the previous year.
Co. Tipperary was the only county to register a decline (-4.5%) in housing output, reaching a total of 485 homes for 2024. Meanwhile, Co. Clare substantially increased its output on the previous year (+34.2%) reaching 545 homes. However, Co. Clare is yet to match housing output it reached in 2022 (556 homes). Co. Limerick also increased its housing output, completing 1,023 homes in 2024 (+29.3% on the previous year).
While this is good news for Co. Limerick, there is still a huge gap to be covered to meet actual demand on an annual basis. For example, the Independent Housing Commission estimates that Co. Limerick will require between 2,000 and 4,300 homes per annum to match demand. The analysis undertaken by the Housing Commission also factors in the pre-2024 housing deficit (pent up demand), which is a first for housing targets and policy making in Ireland –previous targets and analysis excluded pent up demand in the system.
DWELLINGS
NEW DWELLING COMPLETIONS
BY TYPE
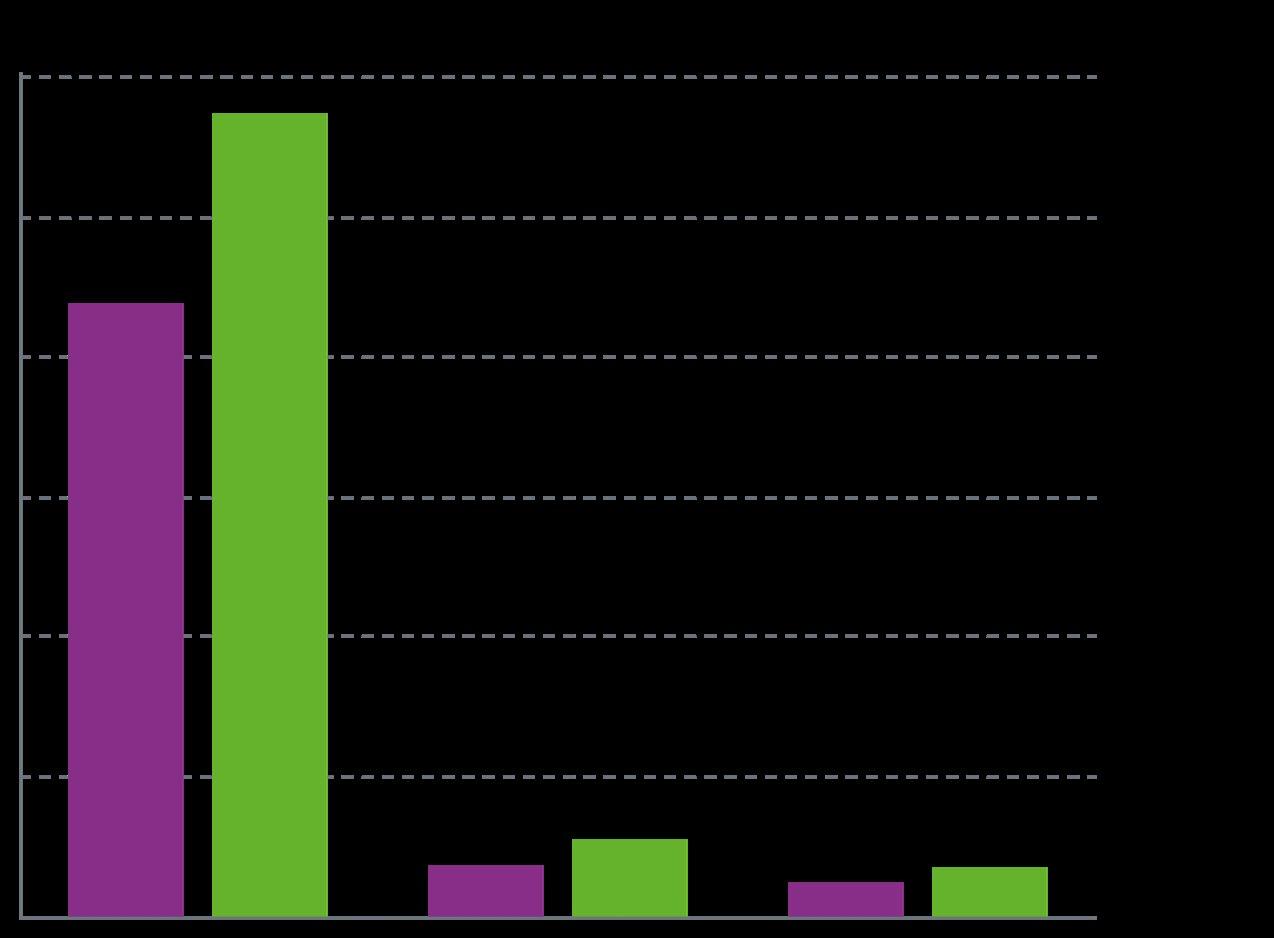
In 2024, 57.0% of homes completed in Co. Limerick were scheme houses (e.g. housing in estates). 21.8% of homes completed were single homes (e.g. one-off housing) and 21.1% of homes completed were in apartments (215 homes).
Both Co. Clare and Co. Tipperary had a much lower share of apartments than Co. Limerick, with 3.3% and 7.4% of homes delivered in 2024 being apartments, respectively.
Both Co. Clare and Co. Tipperary also had a much higher share of one-off homes being built. 43.7% of homes completed in 2024 in Co. Tipperary being one-off homes, while there were 38.2% one-off homes in Co. Clare. Co. Clare had a larger share of homes built in estates (58.4%) than Limerick (57.0%) and Tipperary (48.9%).
Since 2015, Co. Clare’s share of apartments as a percentage of overall housing output has remained relatively stable, fluctuating between 1% and 5% of total homes completed, with an average of 3.1% over the period. Over the same period, the share of oneoff homes compared to total homes has decreased, trending downward from 78.8% in 2015 to 38.2% in 2024. During this time, scheme houses have increased their share, from 19.9% in 2015 to 58.4% in 2024.
Limerick’s share of apartments has increased since 2015, moving from an average of 6.9% per year, to 20.4% in 2023 and 2024. Like Co. Clare, Co. Limerick has decreased the share of one-off homes over time with one-off homes trending downward from 57.1% in 2015 to 21.8% in 2024. During this time the share of scheme homes increased from 25.5% in 2015 to 57.0% in 2024. Since 2017 Co. Limerick has averaged 60.6% of yearly output being scheme homes.
81.3% of homes completed in Co. Tipperary in 2015 were one-off homes, averaging 79.1% until 2019 when the share of one-off homes began to decrease. In 2024, 43.7% of total housing output was one-off homes Co. Tipperary’s share of apartments versus overall delivery has remained somewhat stable over the years, from 7.0% in 2015 peaking at 11.4% in 2019 and 2022 and moving back to 7.4% in 2024 Over time, with the decrease in one-off homes Co. Tipperary has increased the share of scheme homes from 11.7% in 2015 trending upwards to 48.9% in 2024.
Residential Units Commenced:
Planning Permissions Granted:
At the time of the writing this edition of the MidWest Economic Insights, three quarters of data for planning permissions are available for 2024. Q1 to Q3 saw the Mid-West grant permission for 2,222 homes.
Despite the shorter time period Co. Limerick has already increased the number of homes permitted when compared the entirety of 2023, with 1,244 homes granted (+19.4%) in Q1 to Q3. This rebound was somewhat expected considering there was a drastic decrease in permitted units in Co. Limerick between 2022 and 2023 where the number of homes permitted dropped from 1,808 to 1,042 (-42.4%).
Both Co. Tipperary and Co. Clare will need a significant bump in Q4 2024 to reach the same level of planning permissions they did in the previous year. With Co. Tipperary approving 597 homes during Q1 to Q3 and Co. Clare approving 381 homes – compared to 914 and 838 in the previous year respectively.
In terms of the typology of homes granted permission in 2024, 33.6% of homes in Co. Limerick were apartments with 54.5% being homes in housing estates (Multi-development Houses). It is important to note that for apartment construction, they do
not normally hit the open market in Co. Limerick and instead are purchased for the provision of state housing. In some smaller circumstances they are also built exclusively for rental. Comparatively, Co. Clare saw a drastic rise in the share of apartments granted permission in 2024, going from 7.5% in 2023 to 22.8% in 2024, however, this increase combined with the increase of one-off housing has come at the expense of homes in estates which has dropped from 61.5% to 39.9%. Co. Tipperary data for 2024 is much the same as 2023 with homes in estates being the largest share of homes granted permission (67.7%), followed by one-off housing (21.6%) and apartments (10.7%).
Planning permission grants, while showing the potential delivery of new homes, provide no guarantee that these homes will be built and should only act as an indication of potential pipeline of homes.
Ultimately, the core goal is to activate these planning permissions and turn them into commencements and subsequently deliver new homes. Furthermore, planning permission data, at a high level, give no indication which segment of the market the homes will end up going to. As we see later in this chapter the number of homes that hit the market for owner occupiers is far too low.
Nationally, during 2024, there was an increase of almost 79.8% on the previous year with the number of homes commenced reaching almost 58,971 (compared to 32,801 in 2023). Just two Local Authority areas out of 31 saw the number of homes decreased, they were Carlow and Leitrim. The largest YoY increase in the number of units was seen in Cork City which reached 4,384 homes commenced for the year, an increase of 269.6% (+3,198 homes).
2024 saw a significant increase in housing commencements across the Mid-West when compared to 2023. The number of homes that commenced across the Mid-West region increased by 1,403 to 3,262 homes (+75.5%).
Tipperary saw an increase of 119.2% (+597 homes) bringing total homes commenced for 2024 to 1,098. Similarly, Limerick saw the number of homes commenced increase by 68.1% to 1,336 an 841 home increase on the previous year. Clare saw an increase of 47.1%, or 265 homes, bringing its total to 828 homes commenced for 2024.
A caveat applies to these figures. In April 2023, the Government approved additional measures under the Housing for All Action Plan to incentivise increased housing supply and reducing costs. This includes the introduction of a “temporary” and “time-limited” arrangement for the waiving of local authority section 48 development contributions and the refunding of Uisce Éireann water and waste connection charges.
When launched, the waiver scheme applied for 1 year to all permitted residential developments that commenced on site between April 2023 and April 2024 and were completed no later than December 2025. One year later, in April 2024, the Government approved an extension of the waiver covering residential development commenced no later than December 2024 (September for Uisce Éireann refund) and the date for the completion of development works was also extended by one year to December 2026 –meaning developments that availed of the scheme must be complete by 31st December 2026.
Under the waiver scheme, instead of developers having to pay the relevant development contributions to the local authority, the Department of Housing, Local Government and Heritage pay the relevant charges due to the local authority on behalf of the person or business liable for the contribution.
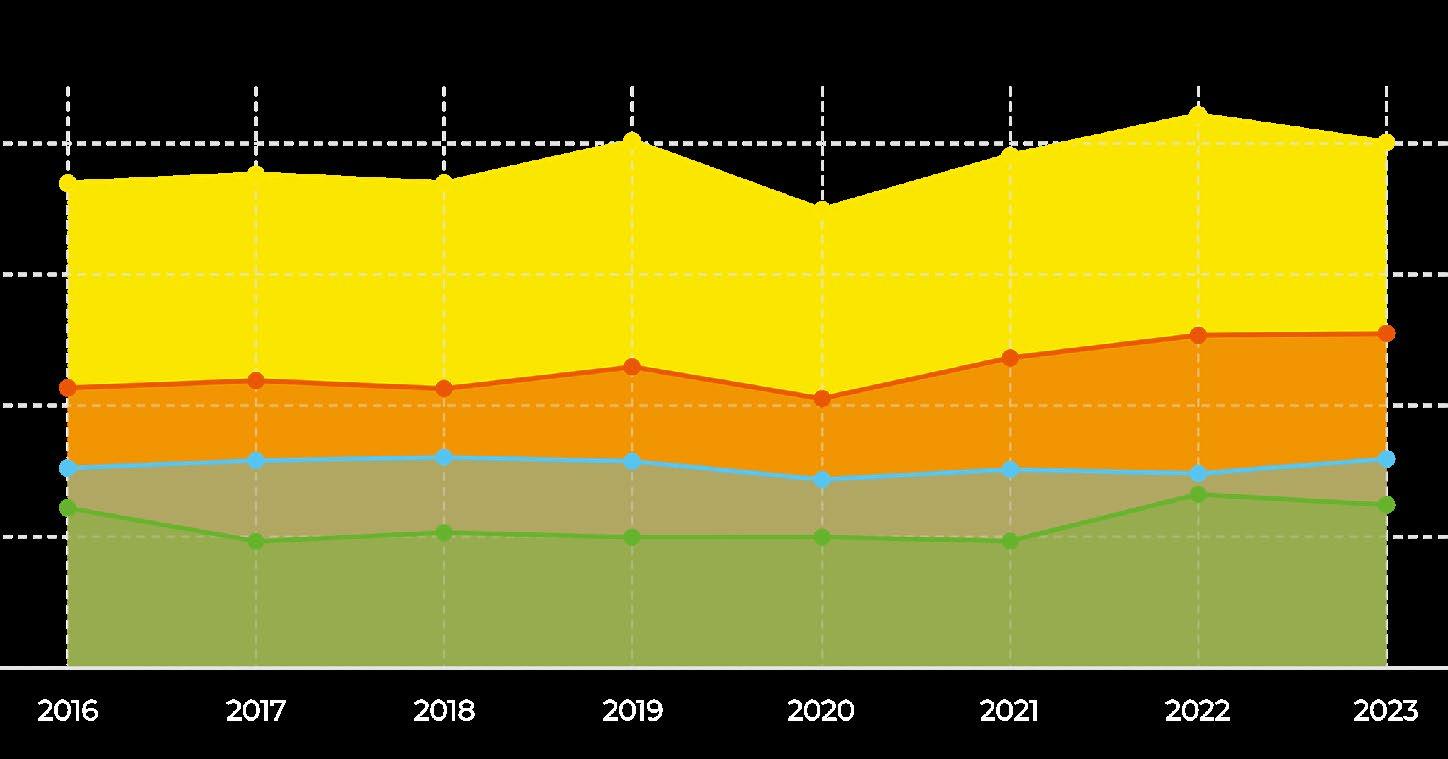
Social Housing Delivery:
Overall, social housing delivery increased in Limerick from 726 in 2022 to 780 in 2023 (+7.4%). However, this increase was not due to building new homes, in fact the number of new builds decreased by 9.7% between 2022 and 2023. The large driver of the increase between the years was a drastic increase (+21.4%) in subsidy schemes (Rental Accommodation Scheme - RAS and Housing Assistance Payment – HAP) and acquisitions increasing from 38 homes to 74 (+94.7%).
Both RAS and HAP rely on private landlords for the provision of social homes. While Q4 2024 data for the department of housing has not been released yet, the first three quarters for 2024 show 51 new build social homes compared to 346 for the full 2023 year. This early data tells us that 12.2% of the social homes provided in 2024 so far came from new builds (compared to 44.4% in 2023), while subsidy programmes such as RAS and HAP provided for 65.2% of social home provision, compared to 42.2% in the previous year. Once leasing is included with subsidy programmes, this share increases to almost 68.7% once leasing is included for 2024.
Social housing delivery decreased in Clare from 462 in 2022 to 360 in 2023 (-22.1%). This decrease was due to a large decrease in the number of new homes built
(-41.0%). Like Limerick, Clare is heavily reliant on private landlords to deliver homes, in 2022 41.3% of social homes provided were through subsidy schemes and leasing, in 2023 this increased to 51.4% and for the first three quarters of 2024 this increased to almost 70.6%.
A similar trend is visible in Tipperary, new build social homes decreased by 17.9% between 2022 and 2023, during this time there was a 33.7% increase in homes provided through subsidy and leasing schemes. This allowed Tipperary to increase its overall social housing provision between 2022 and 2023 by 18.6%. For the first three quarters of 2024, Tipperary had provided 55 new build homes (17.0% of the total), meanwhile the number of homes provided through subsidy and leasing programmes was 228 (70.4% of overall social housing).
MID-WEST SOCIAL HOUSING PROVISION
THE LARGE DRIVER OF THE INCREASE BETWEEN THE YEARS WAS A DRASTIC INCREASE (+21.4%) IN SUBSIDY SCHEMES (RENTAL ACCOMMODATION SCHEME - RAS AND HOUSING ASSISTANCE PAYMENT – HAP) AND ACQUISITIONS INCREASING FROM 38 HOMES TO 74 (+94.7%).
Affordable
The most recent data for affordable home delivery is Q3 2024. The term “affordable” in the context of data from the Department of Housing, Local Government and Heritage is a very wide-ranging umbrella term for several schemes across purchasing and rental, not all of which would be focused on decreasing the price of the home, some are focused on decreasing the upfront cost burden to the purchaser in exchange for signing equity of the home over to the State / Local Authority, such as the First Home scheme and Local Authority Affordable Purchase Scheme (both of which are shared equity). Cost rental housing is housing provided almost at “cost of delivery” offering reduced rental fees when compared to private / market housing.
By Q3 2024 in Limerick, 314 “affordable” homes have been delivered. 73.6% of these (231 homes) have been delivered for purchasers. This is divided between the Local Authority (LA) Affordable Purchase Scheme (14.6%), the First Home Scheme (41.7%), and the Refurbishment Grant (17.2%). Out of these, the Refurbishment Grant is the only one where a non-repayable grant is provided to the purchaser where they renovate a vacant home, it also does not require the Local Authority or State to take an equity stake of a person’s home (there are certain criterion to be met). The remaining 26.4% of “affordable” homes delivered were for rental (83 homes). 19.4% (61 homes) of this were delivered through Approved Housing Bodies (AHB), these would be new homes. While the remaining 22 homes were
The
By Q3 2024 in Limerick, 314 “affordable” homes have been delivered. 73.6% of these (231 homes) have been delivered for purchasers. The remaining 26.4% of “affordable” homes delivered were for rental (83 homes).
Housing Agency purchases properties from private landlords who are selling, the Housing Agency in turn rents these properties to tenants who are living there –in essence, this does not boost new supply but instead increases the amount of affordable rental in the market.
Compared to Limerick, Clare has delivered 85 “affordable” homes over the same period. 95.3% of these homes were for purchasers. 49.4% were through the First Home Scheme, with 42.4% being via the refurbishment grant. Just 4.7% were for renters, all of which were delivered through the tenant in situ scheme, meaning no new supply of new homes.
Tipperary has delivered 79 “affordable” homes over the same period, from 2022 to Q3 2024. 93.7% of these homes were for purchasers, split between 38.0% for the First Home Scheme and 55.7% for the refurbishment grant. 5 homes were delivered through the tenant in situ scheme (6.3%).
CITY COMPARISON - AFFORDABLE HOUSING DELIVERY:
5,862 “affordable” homes have been delivered across the five Irish cities since 2022. The breakdown on where these homes have been located is as follows:
61.1% in Dublin 3,581 homes
25.5% in Cork 1,493 homes
5.5% in Waterford 325 homes
5.4% in Limerick 314 homes 2.5% in Galway 149 homes
68.3% of these homes were purchased by owners (4,005 homes) while 31.7% were targeted towards renters (1,857 homes).
• 100% of Land Development Agency delivered cost rental were in Dublin (982 homes).
• 76.3% of AHB delivered cost rental was in Dublin (534 homes) 15.0% were in Cork and 8.7% in Limerick
• 69.4% of Local Authority delivered cost rental (50 homes) were in Dublin with 30.6% (22 homes) in Waterford Limerick, Galway and Cork had no Local Authority delivered cost rental.
• 262 homes received the vacant refurbishment grant with Dublin being the largest share at 40.5% followed by Cork 27.9% and Limerick 20.6%
• 54.1% of First Home Scheme houses were in Dublin (1,466 homes) 32.7% were in Cork (887 homes), 4.9% were in Galway (133 homes), 4.8% were in Limerick (131 homes), 3.5% were in Waterford (94 homes)
• Cork and Dublin both had 39.1% each in the share of Local Authority Affordable Purchase homes, while Waterford had 17.3%, Limerick 4.5% and Galway had none
Please note that the above data is up to Q3 2024, which was the most recent available information from the Department at the time of writing this edition of the Mid-West Economic Insights and thus would exclude progress made since. For example, the LDA launched cost rental applications for Limerick in Q1 2025. 4,000 3,500 3,000
Non-Household Entity Purchase of Homes:
A large issue facing the new home market is the low supply that ends up going to owner occupiers i.e. newly built homes are bought by non-household entities. Non-household entities can be any type of public or private organisation, such as Local Authorities, Approved Housing Bodies or investment funds. There is little evidence to suggest large scale activity by private investors / funds in the new home market in Limerick, however, the impact of public organisations purchasing homes for social housing has been well documented in the media.
Full data for 2024 is yet to be released, with the latest data running to November 2024. It also must be noted that this data is for transactions i.e.
and
as part of one transaction, whereas a household buyer normally
data likely underestimates the scale of the impact of non-household entities.
thereby
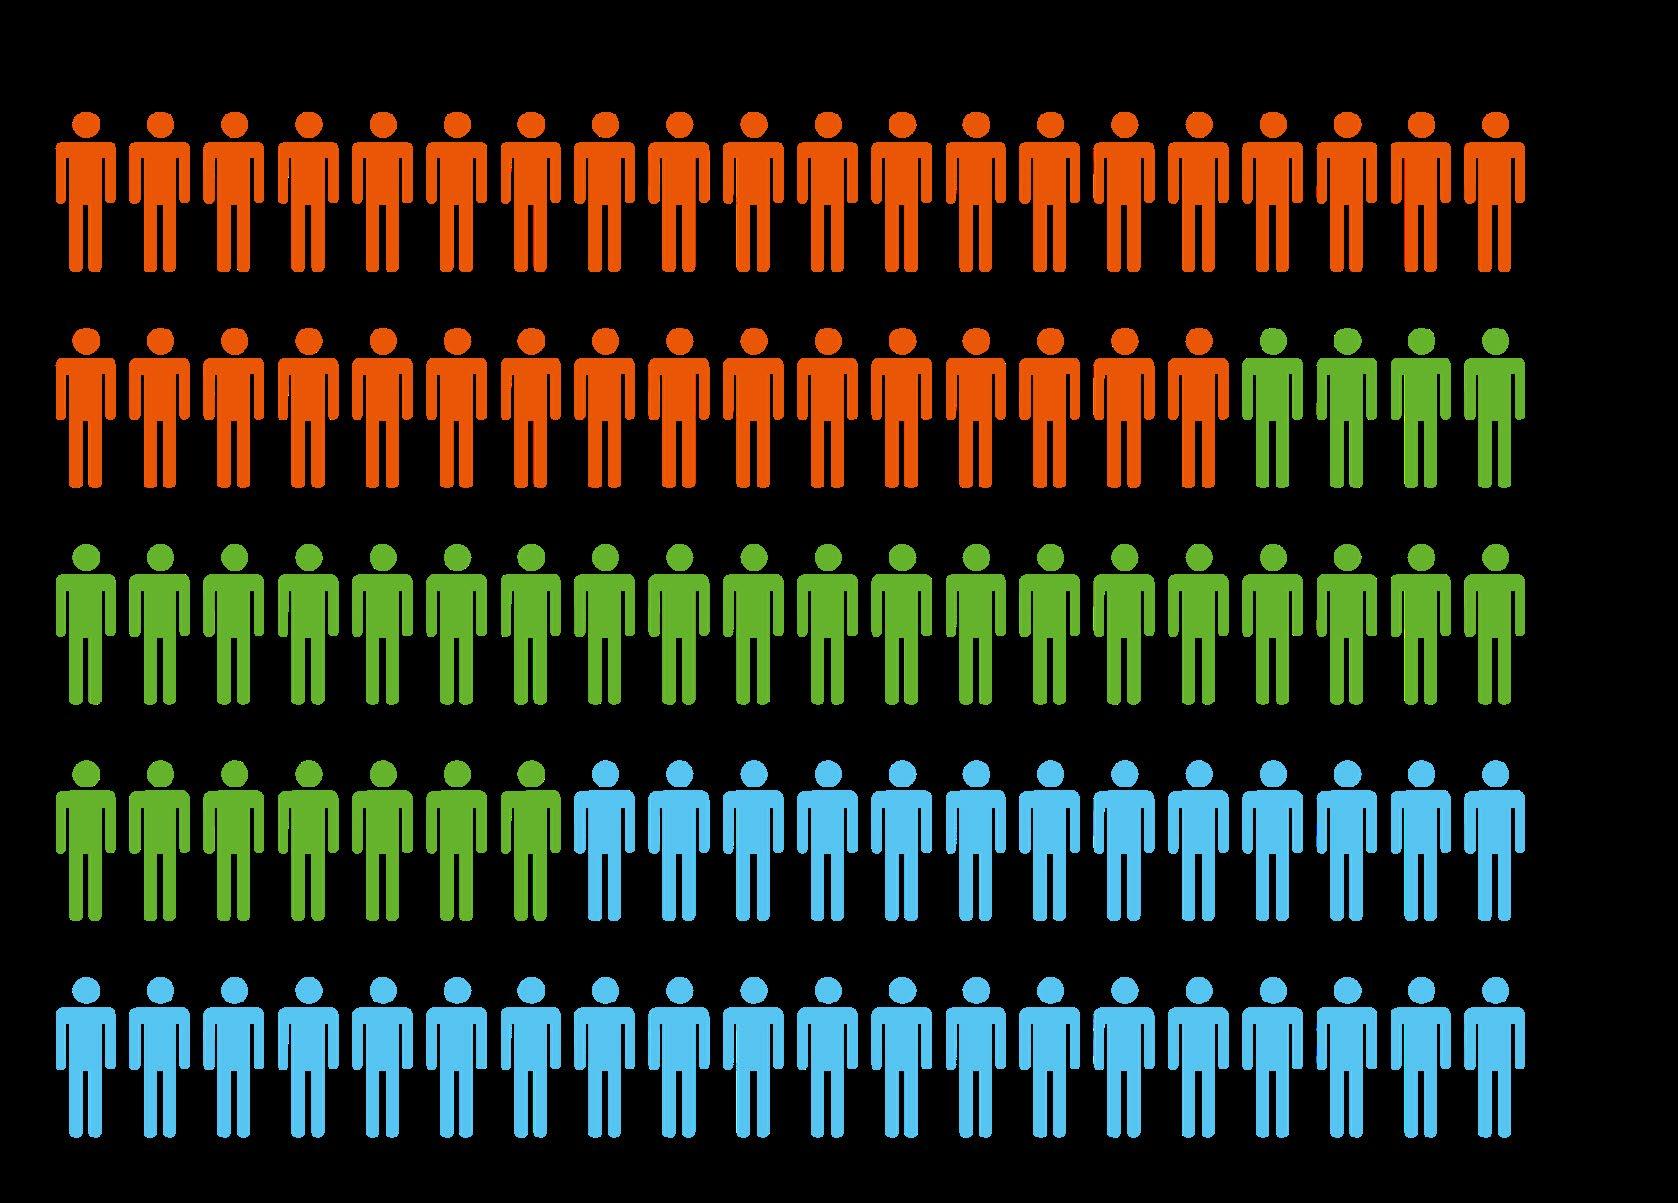
At a national level, 36.5% of new homes transactions in 2024 went to non-household entities. The average for the last three years has been 40.1%. This is a significant increase since 2010, where non-household entities were responsible for just 6.7% of transactions.
In Limerick, there appears to be a larger impact on the market by non-household entities with the average share of housing transactions for household entities over the last three years being 47.4% - this peaked in 2023 at 57.1%. Again, this is a stark difference from the previous decade, where the average share of transactions for the non-household sector was 8.5%.
Clare and Tipperary are in a similar position. In 2024, 63.3% of household purchasing transactions were captured by non-household entities, similarly for Clare, this figure was 46.9%.
Interestingly, there is also activity in the second-hand / existing home market, with non-household entities responsible for 15.4% of purchasing transactions in 2024 for Limerick, ahead of the national average of 11.4%. Clare and Tipperary were under the national average with 6.4% and 11.2% respectively.
In 2022, this figure was almost €70,000 for Limerick. There are similar differences when examining median sales prices. In Limerick, household purchasers spent €16,000 more than non-household entities in 2023, when analysing median price. In 2022, this was €36,000.
At a national level, in 2023, household purchasers spent almost €62,000 more in the average sales price when compared to non-household entities. When examining the median sales price, household purchasers spent €44,000 more than non-household entities when looking at median sales prices.
In essence, household buyers appear to be paying more than non-household entities, indicating there may be some sort of premium for household buyers (normally owner occupiers), or potentially a discount for nonhousehold entities.
Average Rent Prices:
RENT PRICES
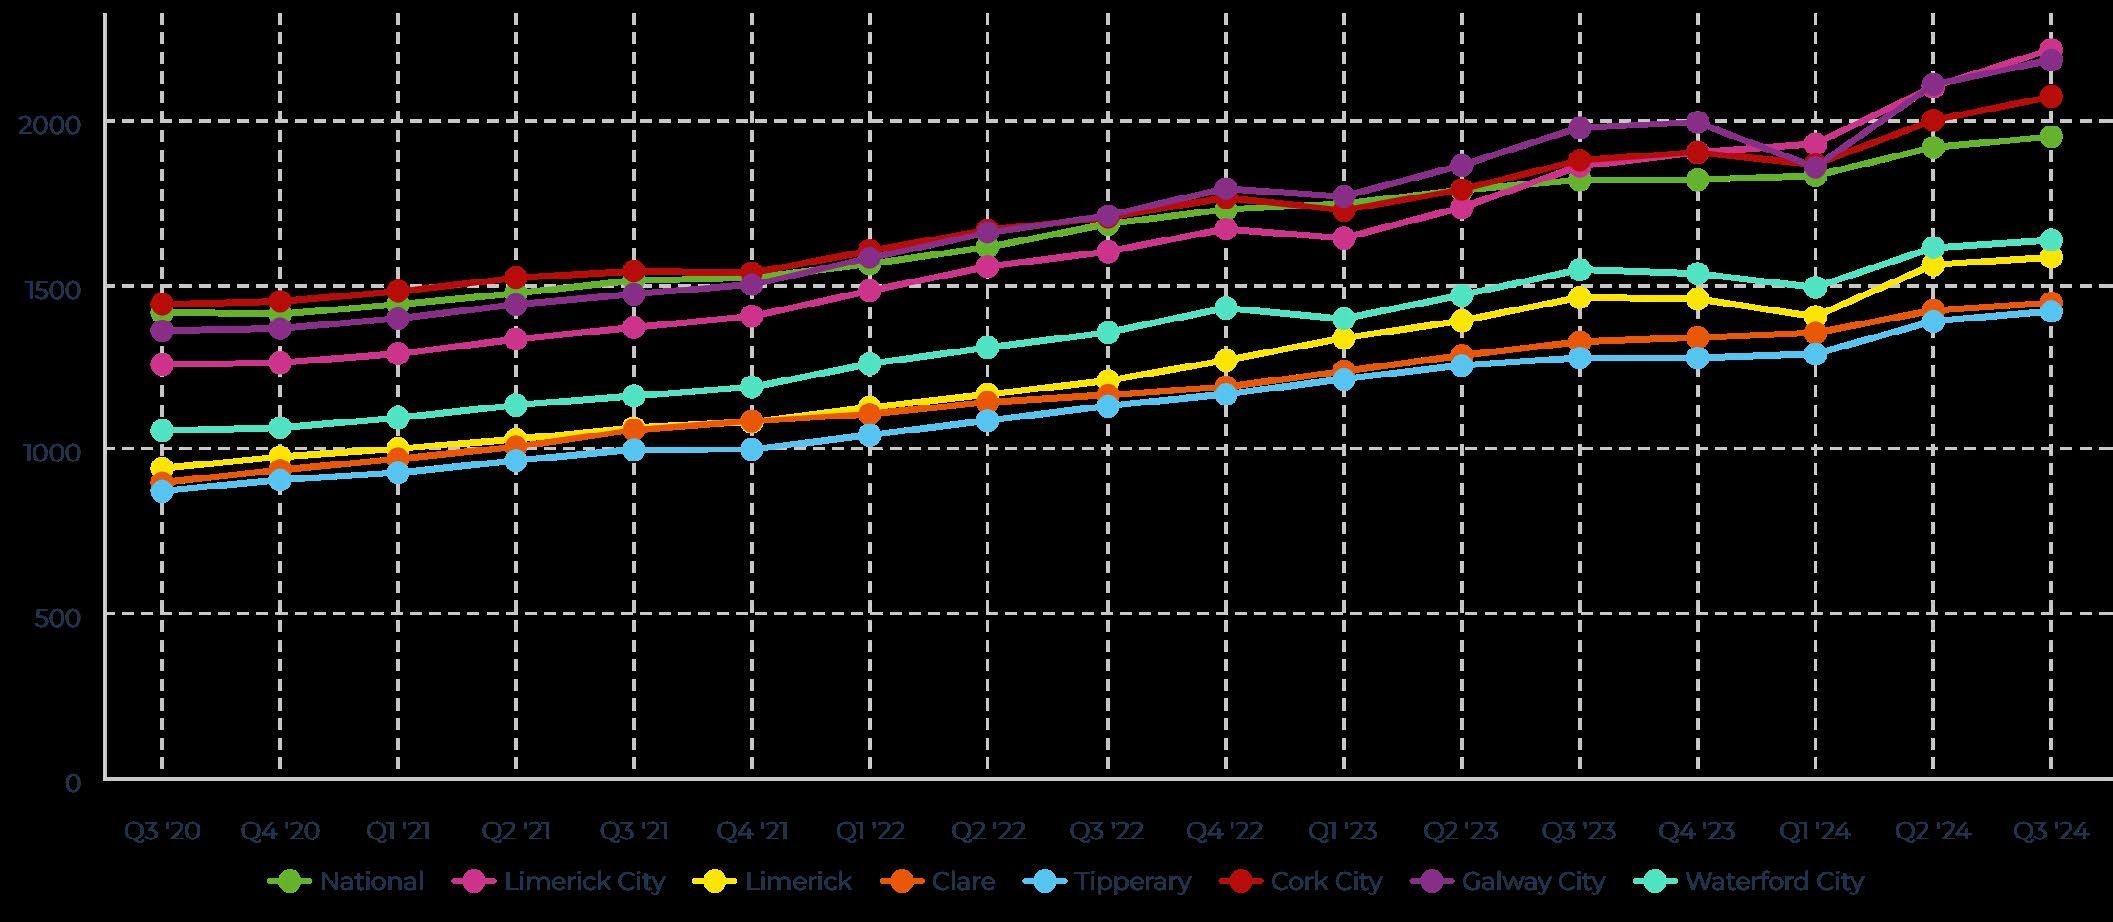
For Limerick City, over the same period, rental prices have increased by 76.3% representing an additional annual spend for new renters of €11,500. For Limerick County, the trend is similar, increasing by 68.3% over the period, reaching €1,587 per month in Q3 2024.
From Q3 2020 to Q3 2024, the price of rent nationally has increased by 37.8% equating to an additional annual spend for new renters of almost €6,500. Most recent available data outlines that the average price of rental nationally is €1,995 per month.
For Limerick City, over the same period, rental prices have increased by 76.3% representing an additional annual spend for new renters of €11,500. As of Q3 2024, the cost of renting in Limerick City has reached €2,221 per month. For Limerick County, the trend is similar, increasing by 68.3% over the period, reaching €1,587 per month in Q3 2024 representing almost €8,000 per year in additional rental spending for new renters. For example, to rent for a full year in Limerick will cost a renter €19,000 in the county and almost €27,000 in the city.
Clare and Tipperary increased by 60.8% and 62.7% respectively, reaching an annual spend of €17,000 for renters in both Clare and Tipperary. This is an additional €7,000 per year for renters when compared to Q3 2020.
It is worth noting there are two sources to use as metrics for average rental cost analysis, at the time of writing this edition of the Mid-West Economic Insights Daft.ie have the most up to date data, whereas the Residential Tenancies Board (RTB) have published data to Q1 2024.
HISTORICALLY, RENTING HAS BEEN MORE EXPENSIVE THAN PAYING A MORTGAGE ON A MONTHLY BASIS, AS TIME HAS PROGRESSED, WE HAVE SEEN THE MONTHLY PRICE GAP BETWEEN OWNING A HOME AND RENTING A HOME NARROW – PARTICULARLY IN THE NEW HOME SECTOR.
MORTGAGE-V-RENTING
MORTGAGE VS RENTING
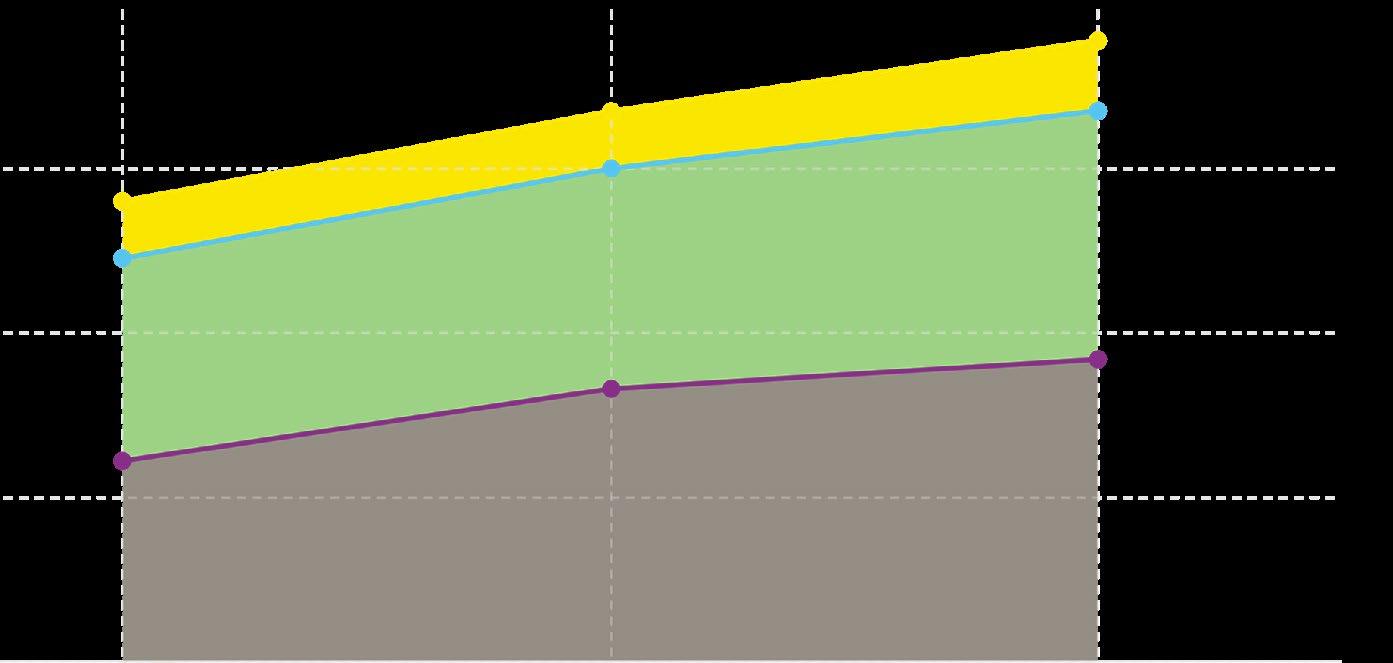
Historically, renting has been more expensive than paying a mortgage on a monthly basis, as time has progressed, we have seen the monthly price gap between owning a home and renting a home narrow – particularly in the new home sector.
For example, using most recently available data, owning a home is 5.7% more expensive than renting a home in Clare if the owner does not avail of the Helpto-Buy Scheme (HTB). However, if the owner availed of HTB (in conjunction with having their own deposit) owning a new home is 2.6% less than the cost of renting. Along with Clare, Cork City is the only other location analysed where owning a home is more expensive than renting both including and excluding HTB. For Cork owning a home is 29.0% to 34.7% more expensive on a monthly basis than renting a home. In Limerick City, owning a home is 26.7% to 32.1% cheaper than renting, similarly in the county owning a home is 3.3% to 10.8% cheaper than renting (depending on if the owner avails of HTB).
Ultimately, utilising HTB heavily influences monthly affordability of owning a home.
For Existing (second-hand) homes, the monthly cost of owning a home in Limerick City is 50.4% cheaper than renting. In Limerick County, purchasing an existing home is 15.0% cheaper than renting. In Clare and Tipperary, purchasing an existing home is 16.7% and 32.6% cheaper than renting a home. Nationally, purchasing a second-hand home is 13.7% cheaper than renting.
The overall trend is that the gap is narrowing between renting and home owning, not driven by the decrease in rental prices but more so the growth in the cost of purchasing a home. Previously renters who converted to homeowners received some respite with decreasing monthly payments, however, the trend indicates that this may cease over the next number of years in some areas.
The overall trend is that the gap is narrowing between renting and home owning, not driven by the decrease in rental prices but more so the growth in the cost of purchasing a home.
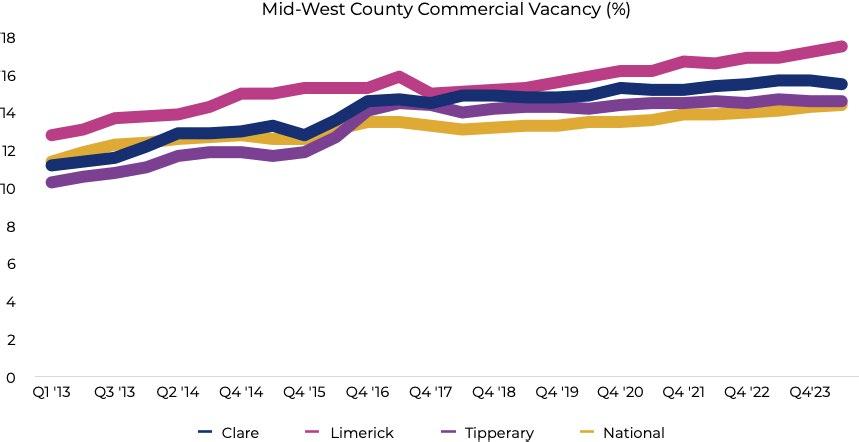
The average commercial vacancy rate nationally was 14.4% in Q4 2024 continuing to trend upwards rising by 0.3 percentage points (pp) over the same quarter in 2023.
Q4 2024 saw slight changes in commercial vacancy for the three counties of the Mid-West, along with key towns / cities in the region. For Co. Limerick, commercial vacancy was 17.5% (+0.6 pp YoY) in Q2 2024, for Co. Clare there was a slight decrease to 15.5% (-0.2pp YoY), while Co. Tipperary saw its rate decrease slightly to 14.6% (-0.1 pp YoY). While the long-term trend for commercial vacancy in the MidWest is increasing, the last number of quarters has seen Co. Clare and Co. Tipperary somewhat level off with Limerick increasing and continuing to have the highest county level commercial vacancy in the MidWest.
For Limerick, Abbeyfeale decreased from 22.1% commercial vacancy to 20.8% (-1.3 pp), for Limerick City there was an increase from 19.4% to 19.9% (+0.5 pp) and for Newcastlewest the vacancy rate increased to 24.9% from 21.6% (+3.3 pp). Commercial vacancy for Limerick City and Abbeyfeale have been trending upwards over the long-term (since 2016), however, Newcastlewest commercial vacancy had largely been relatively flat from 2019 to 2022 but has been on an upward trend since.
Almost one fifth of the commercial premises in Limerick City, the central node of the Mid-West are vacant. One quarter of all commercial buildings in Newcastlewest are vacant, signalling a very worrying trend for the area.
Commercial vacancy for Limerick City and Abbeyfeale have been trending upwards over the long-term
In Clare, Kilrush commercial vacancy remains similar at 24.5%. Worryingly, Shannon’s commercial vacancy almost covers a third of commercial premises with 29.8% vacancy rate in Q2 2024 an increase of 0.4 pp on the same period in the previous year. Both these figures represent significant issues for Clare. Ennis is slightly better, decreasing by 0.2 pp and now sitting at 18.5%.
Both Ennis and to a lesser extent Kilrush commercial vacancy has been relatively flat meaning unchanged in the longer-term. However, the commercial vacancy in Shannon has had a very sharp rise in the middle of 2022 and has not recovered since. It is worth noting that the vacancy rate in Kilrush has been slowly moving downward since Q2 2018 when it was at 26.6%.
Tipperary is arguably the best performing county for commercial vacancy in the Mid-West. Clonmel remains at the same vacancy rate it did the year previous (18.6%), while Thurles now sits at 17.3% (-0.7pp). Nenagh made significant strides in the past decreasing their vacancy rates from almost 16.5% in 2016 to 14.1% in Q2 2024.
However, the last several quarters have seen this progress slow, and even reverse in some cases. In terms of long-term trends, Clonmel is relatively flat, signalling very little variation. Comparatively, Thurles is on an upward trend, despite the short-term decreases in previous quarters. Nenagh, however, is on a slight downward trend.
VACANCY
Unemployment across the Mid-West now sits at 4.5%, down from 5.2% in the previous year.
THE MID-WEST CONTINUES TO EXPERIENCE RECORD EMPLOYMENT LEVELS
BOTH MALE AND FEMALE COHORTS ARE ALSO AT THE HIGHEST NUMBERS RECORDED
EMPLOYMENT & UNEMPLOYMENT
Live Register
The monthly average number of people on the live register at a national level in 2024 was 170,916, a 4.7% decrease on 2023 figures.
In Limerick, the monthly average for 2024 was 6,469, a decrease of 7.3% on 2023. For Clare there were 4,202 people on the live register, a 13.2% decrease on the previous year. For Tipperary there was a 4.6% decrease from the previous year, resulting in 5,609 people on average on the live register monthly.
Overall, on average there were 16,280 people on the live register across the Mid-West in 2024, a decrease of 8.0% from the previous year. The long-term trend is continuing downward for the number of people on the live register across the Mid-West and its constituent counties.
Youth unemployment, those under 25 years of age, is also on a downward trend across the Mid-West. The average number of under 25s on the live register in Limerick on a monthly basis was 761, down 10.0% from the previous year.
Youth unemployment, those under 25 years of age, is also on a downward trend across the Mid-West.
In Clare, the average was 424 people, down 14.5% from the previous year. In Tipperary the decrease was much more muted, decreasing by 0.7% in the year to 646 people. In terms of the share of under 25s as a percentage of the overall number of people on the live register across the Mid-West, it has been relatively constant throughout the last three years ranging from 10% to 12%, depending on the county and the year.
LIVE REGISTER NUMBERS
+20,000 people
The trend of a record number of people at work in the Mid-West continued in Q3 2024 with 274,000 people at work –a 7.9% increase YoY (+20,000 people).
Employment & Unemployment:
Most recent data for the labour market runs to Q3 2024. Q3 saw the unemployment rate reach 4.5%, up from 3.5% in the previous quarter but down from 5.2% in the same quarter in 2023. These short-term increases and decreases in the labour market are not unusual and when averaged for the available year, the average unemployment rate was 3.9% for 2024. Comparing this to the national picture, Q3 2024 saw national unemployment at 4.5, however the average for 2024 was 4.4% (0.5 pp greater than the Mid-West). Overall, the unemployment rate for the Mid-West continues to trend downward over the long-term.
The trend of a record number of people at work in the Mid-West continued in Q3 2024 with 274,000 people at work – a 7.9% increase YoY (+20,000 people). Both male and female cohorts are also at the highest numbers recorded, with 129,000 females (+8.3% YoY) employed and 146,000 males (+7.5% YoY).
Monthly average
6,469 in Limerick 2024
In Limerick, the monthly average for 2024 was 6,469, a decrease of 7.3% on 2023.
Monthly average 4,202 in Clare 2024
For Clare there were 4,202 people on the live register, a 13.2% decrease on the previous year.
Monthly average 5,609 in Tipperary 2024
For Tipperary there was a 4.6% decrease from the previous year,
Mid-West Sectoral Employment
In Q3 2024 (the most recent available data) the three largest sectoral employers in the Mid-West continued to be Industry (45,700 in employment), Human Health and social work activities (34,300) and Wholesale & Retail (31,000). The industry sector represents 16.7% of all employment in the Mid-West, Health represents 12.5% and Whole & Retail represents 11.3%.
The sector with the lowest share of employment across the Mid-West is Financial, Insurance and Real Estate Activities at 2.2% (6,000 employees).
LARGEST 3 SECTORAL EMPLOYERS IN THE MID-WEST
WHOLESALE & RETAIL 2 3
HUMAN HEALTH & SOCIAL ACTIVITIES
In terms of the largest sectoral increases YoY, Transportation and Storage grew by 71.1% in Q3 2024 compared to Q3 2023 (+6,600 employees). Information and Communication increased by 41.8% (+3,800 employees), while public administration increased by 32.7% (+3,300 employees).
Despite Human Health and Social Work Activities continuing to be the second largest sector, it logged the biggest percentage decline of employees based on the same quarter in the previous year with employee numbers decreasing by 12.7% (-5,000 employees). Agriculture, Forestry and Fishing also registered a decline (-4.2%) decreasing by 700 employees.
Looking at the long-term trend (data since 2012) all sectors are trending upwards to various degrees. However, it is worth noting that 2012 was during the time of the fallout of the financial crisis and recession and there would be an expectation that all sectors would improve since then. Looking at the shorter-term trend (data since 2022), tells a different story for some sectors and gives more of an insight into current operations. While most sectors remain on an upward trend. Agricultural employee numbers are on a clear downward trend, whereas construction, wholesale and retail, administration and support services and financial, insurance and real estate activities are all relatively flat, signalling little change over the period surveyed.
Q3 2024 represented the highest quarter on record for several sectors in terms of staff headcount; industry (45,700 staff), Education (27,000), Professional and Scientific (16,400) Transportation and Storage (15,800) and 12,900 for information and communication.
STATE SUPPORTED EMPLOYMENT
IDA supported employment in the region remains strong with 27,257 people employed in IDA companies across the Mid-West in 2023, this represents an increase of 2.6% on the previous year. There is an upward trend on IDA employment across the Mid-West over the last several years. Nationally, IDA supported employment decreased between 2022 and 2023 by 0.3% (c. 1,000 employees). However, significant gains were made between 2021 and 2022 with national IDA employment growing by almost 23,000 staff (+8.2%).
DETE WORK SURVEY FOREIGN OWNED FIRMS EMPLOYMENT
4th LARGEST
In 2023, the Mid-West remained the fourth largest employment region for IDA companies in Ireland accounting for 9.1% of total IDA supported employment.
This share of overall employment has been relatively unchanged over the last number of years. The South West (underpinned by Cork) represents 17.1% of total IDA employment, while the West (underpinned by Galway) is responsible for 10.3% of IDA employment. Dublin has the largest share of IDA supported employment at 45.6%
As part of research within the Department of Enterprise, Trade and Employment they produce an annual employment survey providing an analysis of employment levels in industrial (including primary production) and services companies under the remit of IDA Ireland, Enterprise Ireland and Údarás na Gaeltachta. Using this data for both Irish and Foreign firms, there were 44,406 state supported jobs across the Mid-West in 2023 (41.5% of which were employees within Irish firms). The Mid-West was responsible for 9.0% of overall employment in these sectors which made it the 5th largest region for employment, slightly behind the Mid East at 9.2%.
Looking at the counties of the Mid-West, Limerick is responsible for 51.9% of the overall share of both Irish and foreign firm supported employment across the Mid-West with 23,067 jobs. The second largest share went to Tipperary at 25.2%, with Clare having 22.8% of the total employment across the Mid-West.
Interestingly, at a national level there are 294,072 jobs supported through foreign firms, while there are 197,849 supported through Irish firms (Irish firms account for 40.2% of the employment total). The region with the largest share of Irish firm supported jobs is the border region at 59.2% of total supported jobs, followed by the South East at 56.5%. The lowest share of Irish firm jobs was in Dublin with a share of 31.8%. In the Mid-West, Irish firms accounted for 41.5% of the total jobs.
The total number of work permits granted nationally rose from 30,981 in 2023 to 39,390 in 2024, a 27.1% YoY increase (+8,409 permits). Between 2021 and 2024 (inclusive) almost 126,601 work permits were granted.
MID-WEST WORK PERMITS ISSUED
1.3 -
1.1 -
In 2024, the county that had the largest number of work permits issued for workers was Dublin with 48.6% of the national share, the second highest was Cork with 8.4% of the Share, Kildare was the third highest with 5.9%, followed by Limerick in fourth place with 4.8% of the share of total work permits issued. The entire Mid-West region was responsible for 8.3% of total work permits issued.
From 2023 to 2024 all counties of the Mid-West saw work permit numbers increase. Limerick grew by 305 permits issued bringing the 2024 total to 1,905 work permits (+19.1%), Tipperary grew by 32.4% (+172 permits) bringing its total 2024 permit total to 703, while Clare saw its permits reach 657, a 32.5% increase on the previous year.
From a national perspective, the sector that had the largest number of work permits issued was Health and Social Work (12,501 work permits) which was responsible for 31.7% of the overall share. The second highest sector was Information & Communication (6,788 work permits), capturing 17.2% of the overall share. While in third place was Accommodation & Food service with 3,625 permits (9.2%) share.
ALL COUNTIES OF THE MID-WEST SAW WORK PERMIT NUMBERS INCREASE
TOP 3 COUNTIES IN THE MID-WEST FOR WORK PERMITS ISSUED IN 2024
LIMERICK - 1,905 PERMITS ISSUED
CLARE - 657 PERMITS ISSUED 2 3
TIPPERARY - 703 PERMITS ISSUED
The drivers of disposable income are not solely driven by earned income from labour.
NUMBERS IN Road Traffic Volumes (Goods Vehicles)
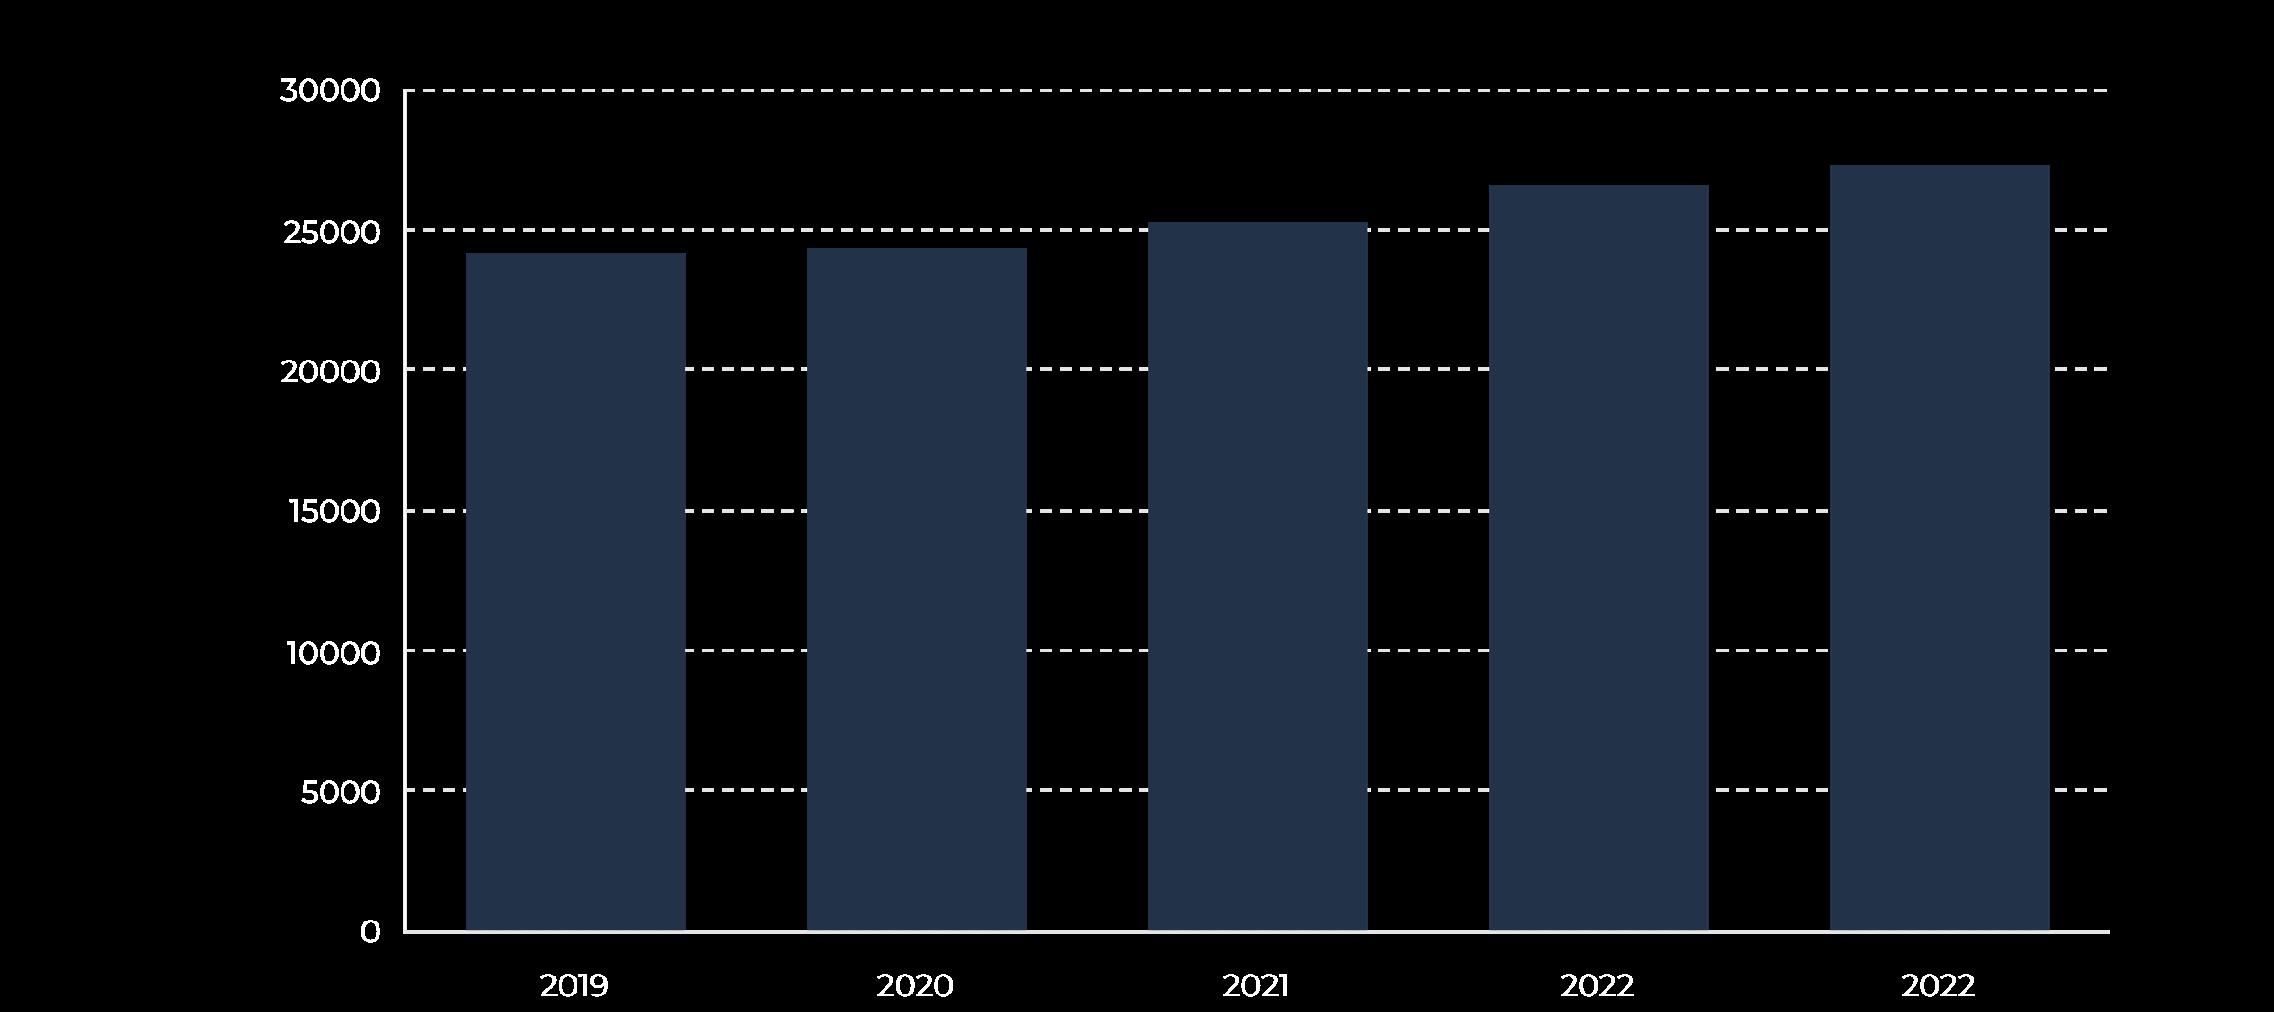
The latest data available for disposable income level is from 2023. Limerick ranks third, behind Dublin (€32,393) and Cork (€29,876) with Limerick reaching €29,491. Tipperary ranked fourth in 2023, reaching a disposable income of €29,209. Clare ranks 19th with a disposable income of €25,103.
The average national increase of disposable income between 2022 and 2023 was 9.2%.
Limerick grew by 10.8% during the same period, while Tipperary grew by 10.2% and Clare grew by 8.3%. This is the highest YoY growth for Clare since 2012, for Limerick it is the highest YoY growth since 2001. Similarly for Tipperary it is the highest YoY growth since 2001.
It is worth noting that there are several drivers of disposable income. They are compensation of employees and social transfers. It is not solely driven by earned income from labour. In the past, Limerick was ranked second behind Dublin. However, due to changes in data sources and methodologies Limerick now ranks third. 2024 is a benchmark year for the CSO and revisions have been made utilising most recent available data thus driving changes in historical data.
Regional Gross Value Added (GVA)
GVA is an indicator of the economic activity of a country or a region. It reflects the total value of all goods and services produced less the value of goods and services used for intermediate consumption in their production – in some ways it is like GDP but focuses on value added, rather than total output.
The total GVA for Ireland in 2023 was €484.1 billion – 2.7% lower than the previous year.
Mid-West had the third highest regional GVA for 2023 at €31.4 billion, moving up from fourth place in 2022 and increasing its GVA by 5.3%.
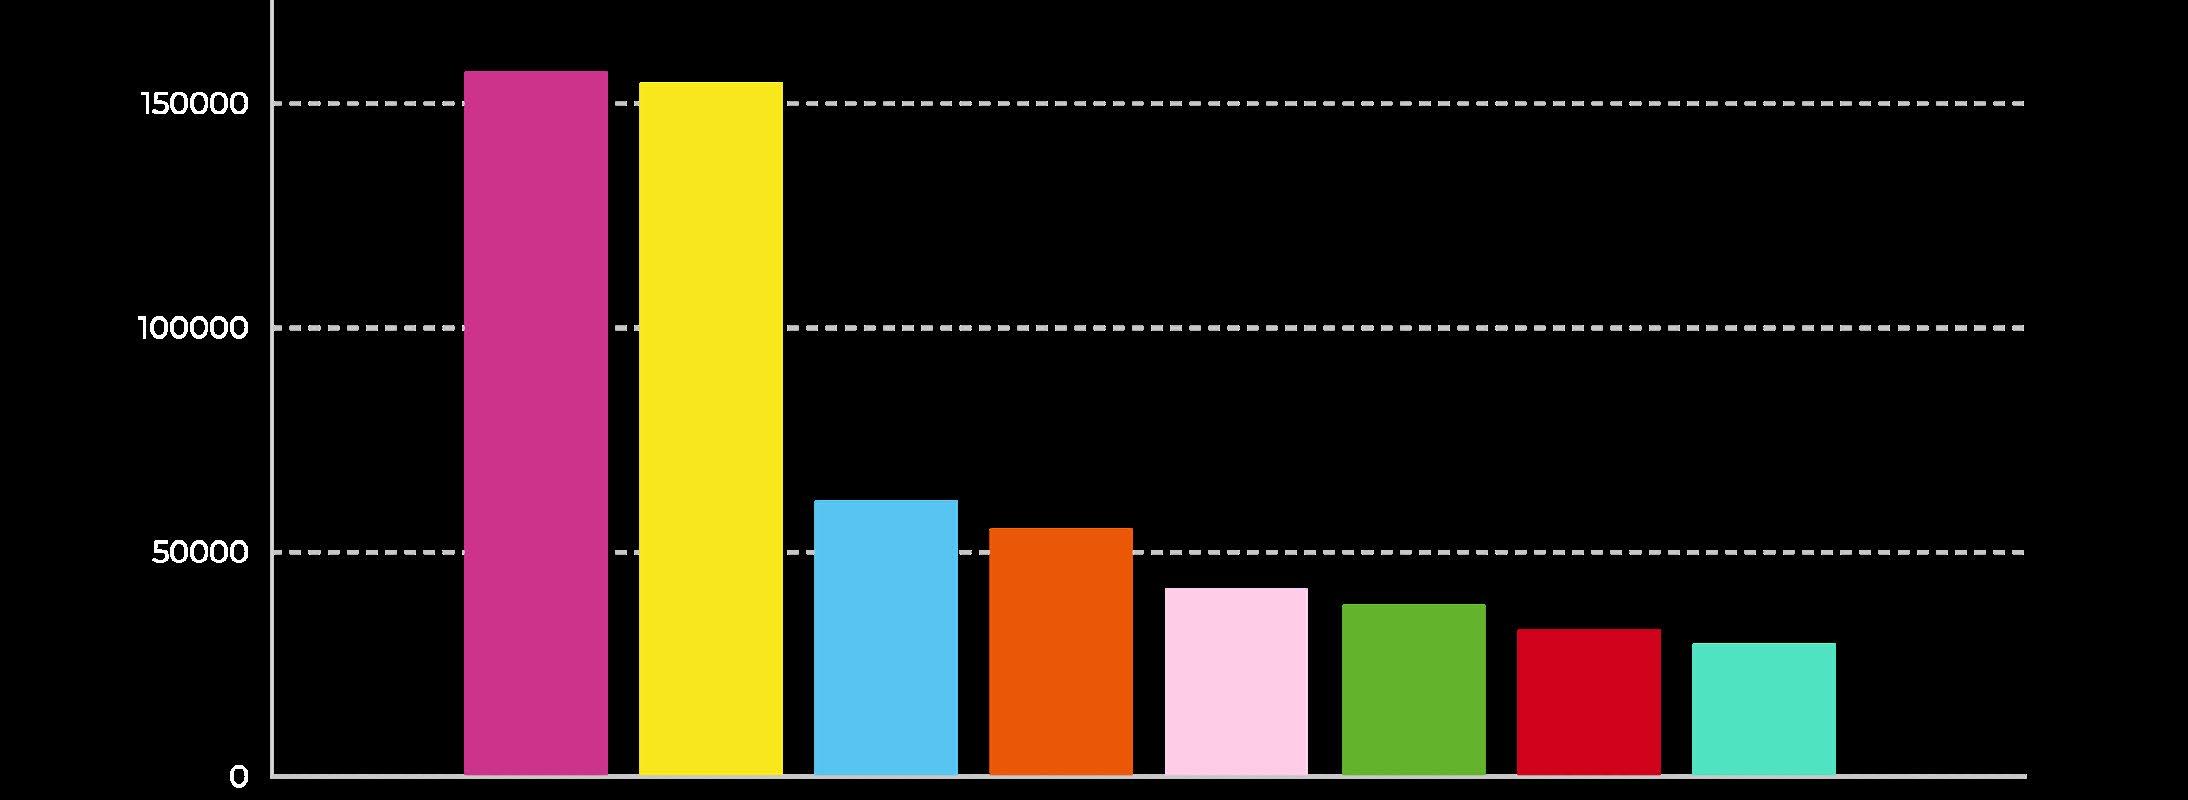
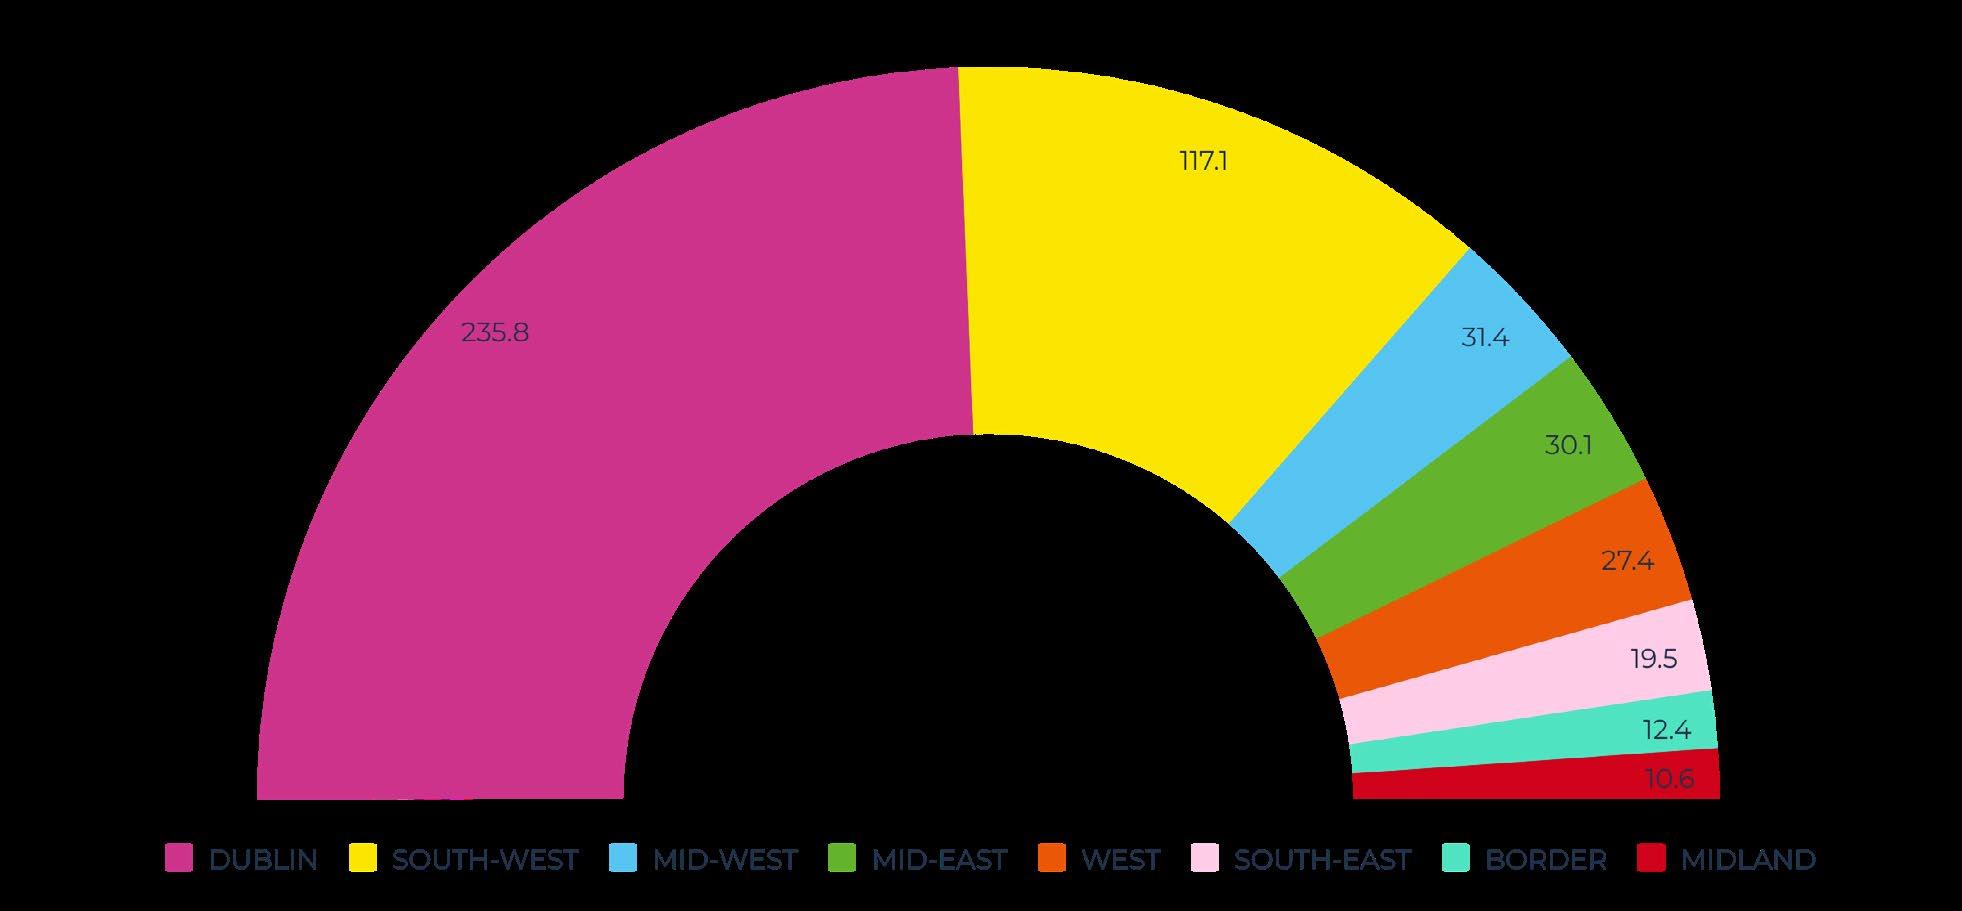
Dublin (€235.8 billion) accounted for 48.7% of overall GVA. The South West (underpinned by Cork) accounts for 24.2% of GVA. Comparatively, the Mid-West is the third largest shareholder at 6.5%, slightly ahead of the Mid-East at 6.2%. The West (underpinned by Galway) accounted for 5.7% of total GVA, reaching €27.4 billion in 2023.
At a regional level, five of the eight regions grew during this period, those were the Midlands (+8.6%) , the Border region (+7.9%) , the Mid-West (+5.3%) , the West (+4.4%) , and Dublin (+4.2%) .
Three remaining regions contracted, with the largest being the Mid-East (-19.9%) followed by the South-West (-14.3%) , and the South-East (-1.0%) . Despite short-term expansions or contractions, all regions are trending upwards over the last several years.
Adjusting for population, Dublin has the largest GVA per person at €157,049, followed by the South-West ( €154,606 ) and then the Mid-West ( €61,238 ). The region with lowest GVA per person is the Border region at €29,074 .
GVA PER PERSON
Despite the Mid-West and MidEast regularly competing for third place in terms of total GVA, the Mid-West consistently sees a higher GVA per person.
SECTORAL CONTRIBUTIONS TO GVA
Taking a deep dive at sectoral contributions to GVA in the Mid-West, the most recent available data is for 2021. The industry sector is by far the largest contributor to GVA in the Mid-West, accounting for 51.1% of the total – 97.6% of the industrial sector is made up of manufacturing.
The next highest is public administration, education, health and social work activities at 13.7%. Followed by wholesale and retail trade at 9.8% of the overall share. The industrial sector has drastically increased its share of GVA over time, starting from just 34.5% of the total in the year 2000. However, the significant growth in overall share began in 2018 when the overall share reached 40.0%. Overtime, agriculture has decreased its share from 6.5% to 2.5%. While wholesale and retail has also seen declines in overall share from 18% to 9.8%.
It must be noted that while some sectors are contributing less of a share to total GVA as time progresses, in terms of euro value of output all sectors are trending upwards since 2000 – to varying degrees. However, the percentage share analysis is useful to examine how concentrated the regional economy is and thus how prone the region is to sectoral shocks. However, even within the likes of manufacturing, there is heavy diversification across sectors i.e. not all manufacturing is for one sector of the economy.
EDU CAT ION SKILLS
THE CONTINUED GROWTH IN SKILLED GRADUATES IS AN IMPORTANT ASSET FOR THE MID-WEST REGION.
ENROLMENTS & GRADUATES
0.1%
FOR THE ACADEMIC YEAR 2023/24, OVERALL ENROLMENTS ACROSS FULL AND PART TIME THIRD LEVEL PROGRAMMES IN THE MID-WEST WERE 30,155 – A SLIGHT DECREASE ON THE PREVIOUS ACADEMIC YEAR BY 0.1%.
Mid-West Enrolments
Field of Study 23/24
The largest field of study for third level students across the Mid-West is Education accounting for 19.4% of the overall share (5,835 enrolments), the second largest field of study is Business, Administration and Law accounting for 17.7% Engineering, Manufacturing and Construction is the third largest accounting for 16.0% of the overall enrolment total.
LOOKING AT THE TREND IN THE DATA SINCE 2019/2020, MOST FIELDS OF STUDY ARE INCREASING THEIR ANNUAL ENROLMENTS.
HOWEVER, BUSINESS, ADMINISTRATION AND LAW, AS WELL AS ARTS AND HUMANITIES ARE ON A DOWNWARD TREND. INFORMATION AND COMMUNICATION TECHNOLOGIES WAS ON A SIMILAR TREND BUT REBOUNDED IN 2023/24. THUS, THE SHARE OF ENROLMENTS
FOR BUSINESS, ADMINISTRATION AND LAW AS A PERCENTAGE OF OVERALL ENROLMENTS HAS DECREASED FROM 20.0% TO 17.7%, WHILE ARTS AND HUMANITIES HAS ALSO SLIGHTLY DECREASED FROM 15.8% TO 14.9%. MEANWHILE, ENGINEERING, MANUFACTURING AND CONSTRUCTION HAS INCREASED FROM 14.1% TO 16.0%.
89.9% IRELAND 8.1% NON-EU
89.9% OF THIRD LEVEL ENROLMENTS ACROSS THE MID-WEST ARE FROM IRELAND (27,120). WHILE 8.1% ARE FROM NON-EU (2,435), NON-EU STUDENTS ARE ALSO SOMETIMES REFERRED TO AS INTERNATIONAL STUDENTS.
THE REMAINING ENROLMENTS ARE FROM THE EU, BRITAIN AND NORTHERN IRELAND. SINCE 2021/22 THE NUMBER OF IRISH DOMICILED ENROLMENTS HAS BEEN SLIGHTLY DECREASING YEAR ON YEAR, AVERAGING A 1.0% DECREASE PER YEAR. MEANWHILE, OVER THE SAME PERIOD THE AVERAGE INCREASE FOR NON-EU ENROLMENTS WAS 18.3% PER YEAR, ALBEIT GROWING FROM A MUCH LOWER BASE. THE EU, BRITAIN AND NORTHERN IRELAND HAVE REMAINED RELATIVELY CONSTANT OVER THE LAST SEVERAL YEARS. ANY GROWTH IN ENROLMENTS SINCE 2021/2022 HAS PRIMARILY BEEN DRIVEN BY GROWTH IN NON-EU ENROLMENTS.
4.1%
MID-WEST APPRENTICESHIPS
APPRENTICESHIP DELIVERY ACROSS THE REGION IS A STRONG UPWARD TREND
The continued growth in skilled graduates is an important asset for the Mid-West region. It gives potential FDI and indigenous business an attractive incentive to locate and invest within the region, knowing that there is a growing pipeline of skilled labour available. In 2023, there were 10,655 graduates from third level across the Mid-West. This is a 4.1% increase on the previous year. 44.6% of graduates are from undergraduate honours degree programmes, while 19.3% are from masters programmes. Since 2019 to 2023, the number of PhD graduates across the Mid-West has averaged 153 per year. increase on previous year
In the Mid-West, the education and training boards are one of the primary delivery mechanisms for apprenticeship programmes delivering a significant number across the region. Since 2017, the average annual increase in the number of apprenticeships delivered has been 14.5% per year. Declines were registered in 2020 (-23.3%) and 2022 (-5.5%), however, all other years have seen increases. In 2023 and 2024, apprenticeship numbers in the Mid-West have increased by 14.4% with 2,661 apprenticeships in 2024 alone. The longer-term trend for apprenticeship delivery across the region is a strong upward trend.
SINCE 2017, THE AVERAGE ANNUAL INCREASE IN THE NUMBER OF APPRENTICESHIPS DELIVERED HAS BEEN 14.5% PER YEAR
&
IT IS CLEAR THAT THERE IS A DOWNWARD TREND IN AVERAGE KILOMETRES TRAVELLED
Airport Passengers
Annual passengers
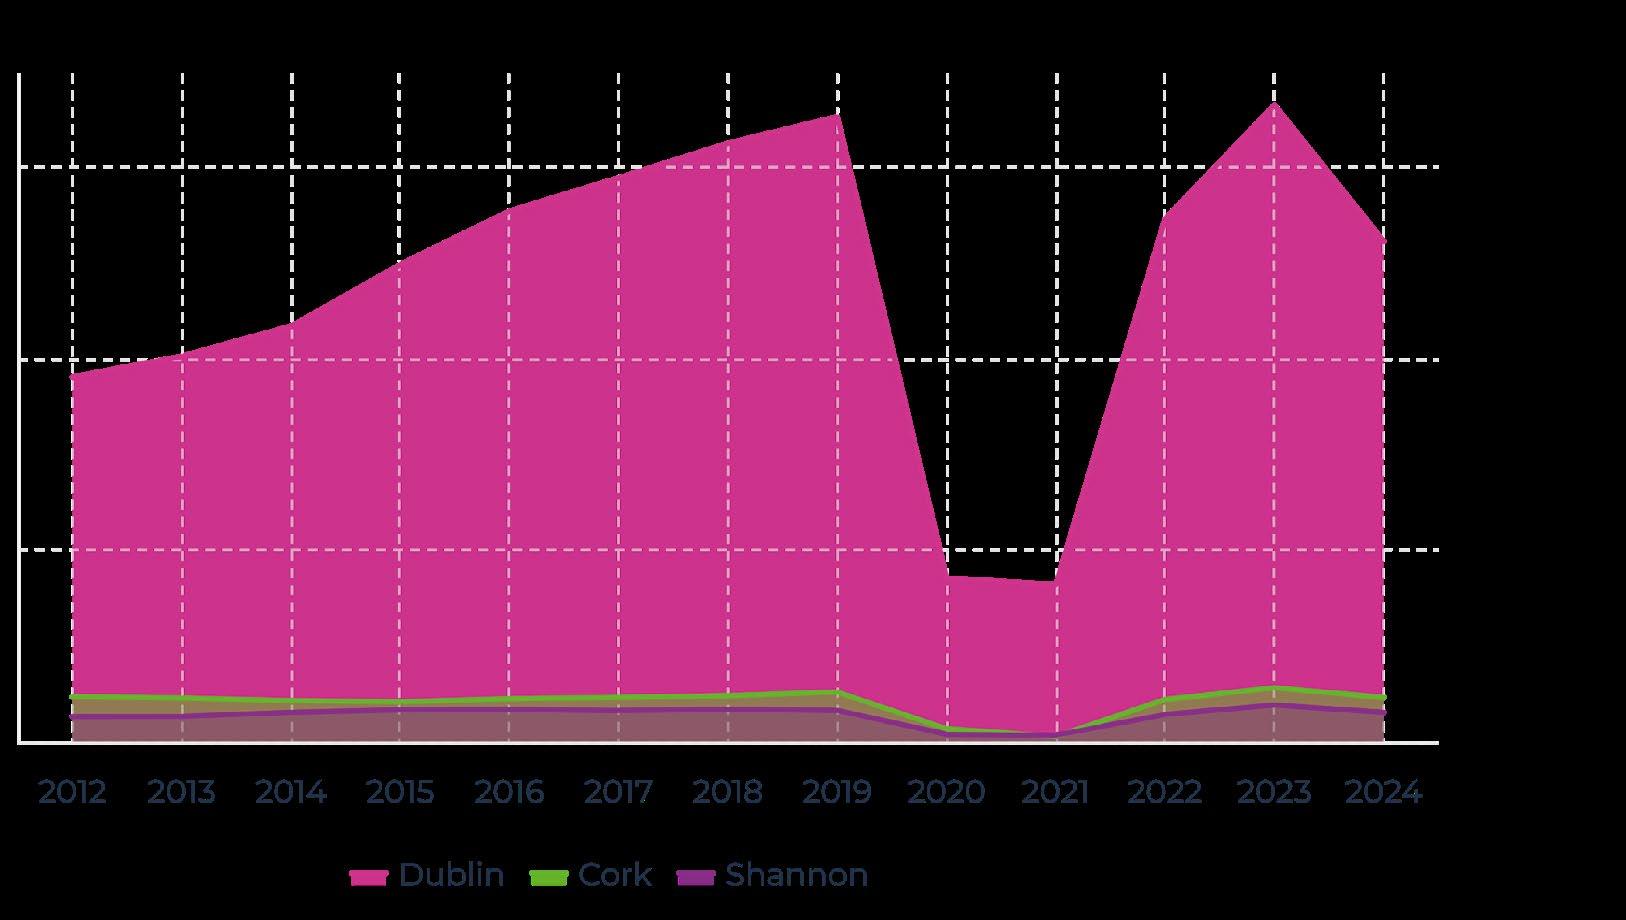
The most recent available data for Irish airports covers Q1 to Q3 2024. The dominance of Dublin continued in 2024, with Dublin Airport accounting for 84.6% of all airport passengers in Ireland. Meanwhile, Cork Airport accounted for 7.4% of passengers and Shannon Airport accounted for 4.9%.
Q1 TO Q3 2024
Dublin Airport accounted for 84.6% Cork Airport accounted for 7.4%
Shannon Airport accounted for 4.9% of passengers.
Despite the pandemic period (2020 and 2021) severely impacting airport travel numbers, 2022 saw Irish airports recover and then go onto exceed pre-pandemic figures in 2023 – the only exception being Knock Airport that had not returned to pre-pandemic passenger numbers in 2023, narrowly missing out by c. 3,000 passengers.
The dominance of Dublin
While we wait for the full 2024 data for all Irish airports to be released, we can compare the first three quarters of 2023 to the first three quarters of 2024 to assess performance. A comparison of these periods shows that total Irish airport passengers increased by 5.0% - an increase of 1.5 million passengers. However, 76.0% of this growth came from Dublin Airport with the airport increasing its passenger numbers by 1.2 million over the same period in the previous year (+4.5% increase for Dublin Airport).
Cork Airport accounted for 15.9% of this increase, boosting their passenger numbers by 244,000 (+10.6%), while Shannon Airport contributed 7.0% to this increase, boosting their own passenger numbers by 106,000 (+7.0%). The only airport to decrease its passenger numbers based on the same period in the previous year was Kerry Airport, which saw its passenger numbers decline by 1.4% (c. 4,000 passengers).
Analysing the top three countries of destination by passenger numbers for each of the state-owned airports for the first three quarters in 2024 provides some interesting results.
The top three destinations, in order of passenger volume, for all Irish Airports were England, Spain and the United States.
For Cork Airport the top three destinations were England, Spain and the Netherlands For Dublin Airport, the
and
For Shannon
the
Significant Passenger increase across the three Irish cities
Bus Éireann Passengers
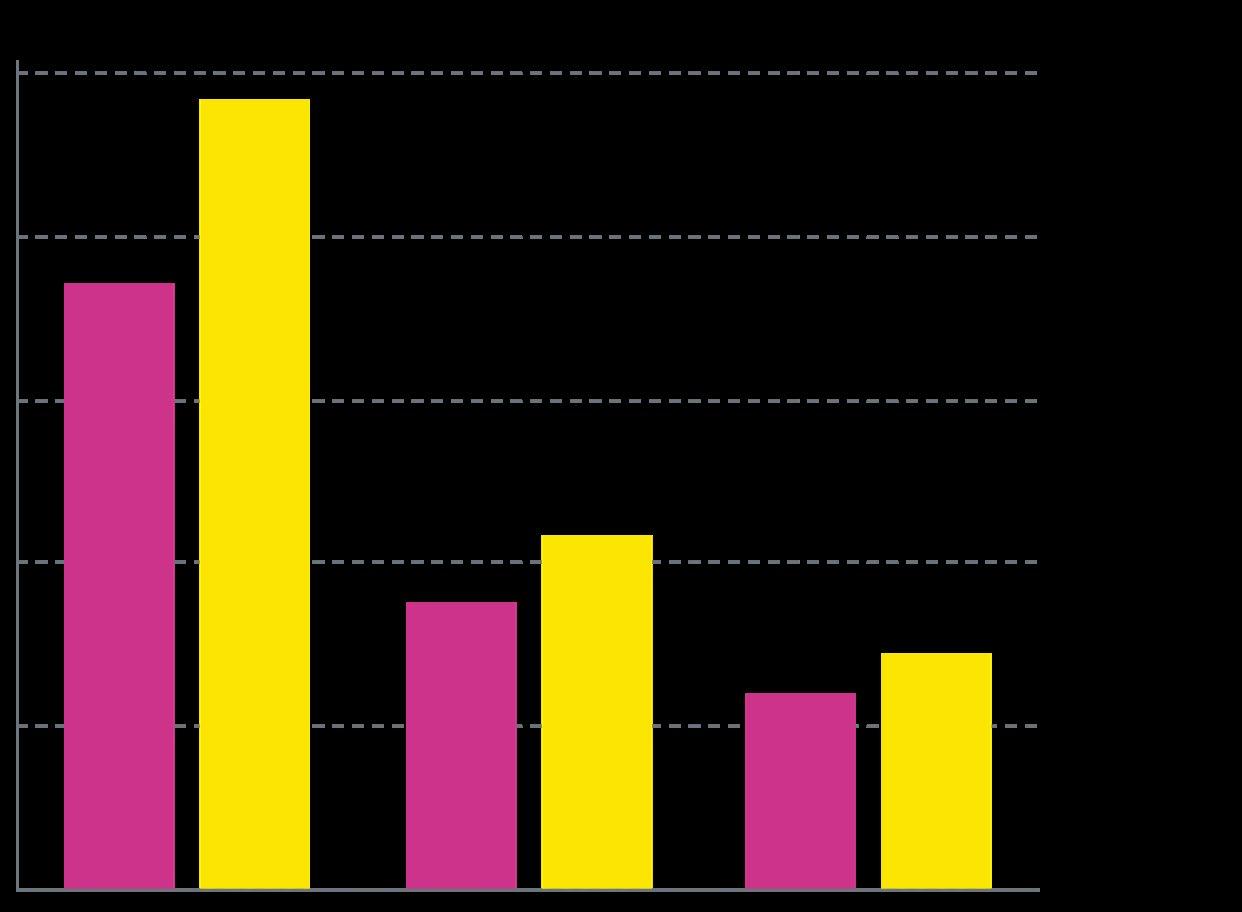
Most recent available data for Bus Éireann Passengers is for 2023. The data shows that for three Irish Cities; Cork, Galway and Limerick that none of these cities have bounced back to their pre-pandemic 2019 figures. However, some are performing better than others.
In 2023, Cork had 76.1% of the passengers that it had in 2019, reaching 12.1 million passengers in 2023 compared to 15.9 million in 2019.
Limerick has recovered much quicker than Cork albeit with much smaller overall passenger numbers. In 2023, Limerick had 92.3% of the passengers that it had in 2019, reaching 3.6 million passengers in 2023 compared to 3.9 million in 2019.
Like Limerick, Galway has also recovered quicker than Cork. In 2023, Galway had 94.7% of the passenger numbers it had in 2019, reaching 5.4 million in 2023 compared to 5.7 million in 2019.
Despite Cork’s slow recovery it is still a public transport leader when compared against Galway and Limerick, transporting more annual passengers than the other two cities combined. What the data does suggest is that pre-pandemic there was a strong increased demand in bus services. In Cork City, the annual average increase in passenger numbers from 2014 to 2019 was 8.0% per year. For Galway, it was 7.2% and for Limerick it was 6.6%.
From 2022 to 2023, despite numbers not reaching pre-pandemic levels, there was a significant passenger increase across the three Irish cities with Cork growing by 30.1%, Galway growing by 22.7% and Limerick growing by 20.0%
It must be noted that these figures are for Bus Éireann Passengers only and should not be used as the sole indicator for public transport. It is likely that private bus operators operate in these cities whose numbers are not captured within the Bus Éireann numbers.
What is encouraging is the growth between 2022 and 2023
The shared bicycle schemes saw a growth phase in the initial years across all three cities, with Cork showing the highest adoption. Cork’s peak usage occurred in 2017 (283,329 trips), followed by a gradual decline starting in 2018. Galway experienced a steady increase from 2016, peaking in 2018 with 39,005 trips. Limerick’s usage peaked earlier in 2015 (38,943 trips) and steadily declined in subsequent years. A decline in usage was observed across all cities even before the pandemic, particularly in Cork and Limerick.
The COVID-19 pandemic caused severe reductions in bicycle usage due to lockdowns and reduced commuting:
• Cork dropped to 81,504 trips in 2020 (66.2% decline compared to 2019).
• Galway usage fell to 6,604 trips (75.7% decline).
• Limerick usage dropped to 10,447 trips (52.8% decline).
Cork demonstrated the strongest recovery post-pandemic, reaching 143,557 trips in 2023 , though still significantly below its 2017 peak. Galway and Limerick struggled to recover Galway reached 8,916 trips in 2023 far below its 2018 peak. Limerick increased to 13,945 trips, but its usage remains modest compared to earlier years.
What is encouraging is the growth between 2022 and 2023, signalling increased demand for these services. Cork grew its number of trips by 30.9% Galway by 42.3% and Limerick by 48.1%
Bicycle Sharing Scheme
It must be noted that the above should not be used in isolation when assessing the demand for active travel programmes. It provides an analysis of demand for shared bicycle schemes taking no account of private bicycle purchases through the likes of the Bike to Work Scheme, for example. It is likely that use of the shared bicycle scheme decreases as more commuters purchase their own bicycles.
BICYCLE SHARING SCHEME JOURNEYS
Annual Cycling Trips
The Walking and Cycling Index is a study conducted by the National Transport Authority (NTA) in collaboration with Sustrans. It evaluates walking, wheeling, and cycling in major cities across Ireland.
Evaluates walking, wheeling, and cycling
The 2023 report covers cities including Cork, Galway, Limerick, and Waterford. It provides insights into travel habits, infrastructure investment, and public perceptions of active travel.
TOTAL TRIPS CYCLING
For 2023, Cork had the highest number of cycling trips (7 million) and the highest total distance travelled (43.4 million km) Galway (3.7 million trips, 17.4 million km travelled) has slightly more trips than Limerick (3.4 million trips, 14.8 million km travelled). Waterford has the lowest values for both total trips (1.3 million) and total distance (8.3 million km).
‘Cork had the highest number of cycling trips.’
Number of bus operators trending downwards
The number of licensed bus operators nationally in 2023 was 1,457 . The number of bus operators nationally has declined each year since 2016 . The peak for licensed bus operators at a national level was in 2009 , where it reached 1,939 operators.
The national trend of decline is also seen at the regional level in the Mid-West, with the number of bus operators trending downwards.
Licensed Bus Operators
The number of licensed bus operators in Limerick in 2023 was 60 , down from a peak of 73 in 2007 . While Limerick saw a YoY increase in the number of bus operators in 2023 (+1.7%) this was preceded by three consecutive years of decline.
The number of licensed bus operators in Clare in 2023 was 51, down from a peak of 71 in 2011. Like Limerick, Clare is trending downwards with the number of licensed bus operators.
The number of licensed bus operators in Tipperary in 2023 was 54, down from a peak of 80 in 2011 . Like its neighbouring counties of Limerick and Clare, the number of licensed bus operators in Tipperary is trending downwards.
Licensed
Operators in Tipperary
Limerick
Clare Tipperary
New Private Vehicles Licensed
Nationally, the number of new cars licensed in 2024 dropped slightly from the previous year, reaching almost 117,000 cars in 2024 – a decrease of 0.6%.
Nationally, the number of new cars licensed in 2024 dropped slightly
The number of new cars registered in Limerick in 2024 was almost 3,800 representing a 2.6% increase on the previous year (+97 cars).
In Clare the number of vehicles registered in 2024 was also an increase on the previous year. Clare increased by 2.9% , reaching almost 2,500 in 2024.
Tipperary was the only county in the Mid-West to see a decline in new vehicle registrations, albeit very slight. Tipperary declined by 0.9% reaching almost 3,000 vehicles in 2024 – a decline of just 26 vehicles from the previous year.
FULL YEAR DATA FOR 2022 IS NOT AVAILABLE, THEREFORE ITS ABSENCE MAKES ANALYSING ANY TREND DIFFICULT.
However, removing 2022 shows that there is an upward trend on new vehicle registrations across the three counties of the Mid-West since 2019.
Galway Limerick Tipperary Waterford Clare
Road Traffic Volumes
(Private Vehicles)
NATIONALLY THE AVERAGE KILOMETRES TRAVELLED
IS ON A DOWNWARD TREND
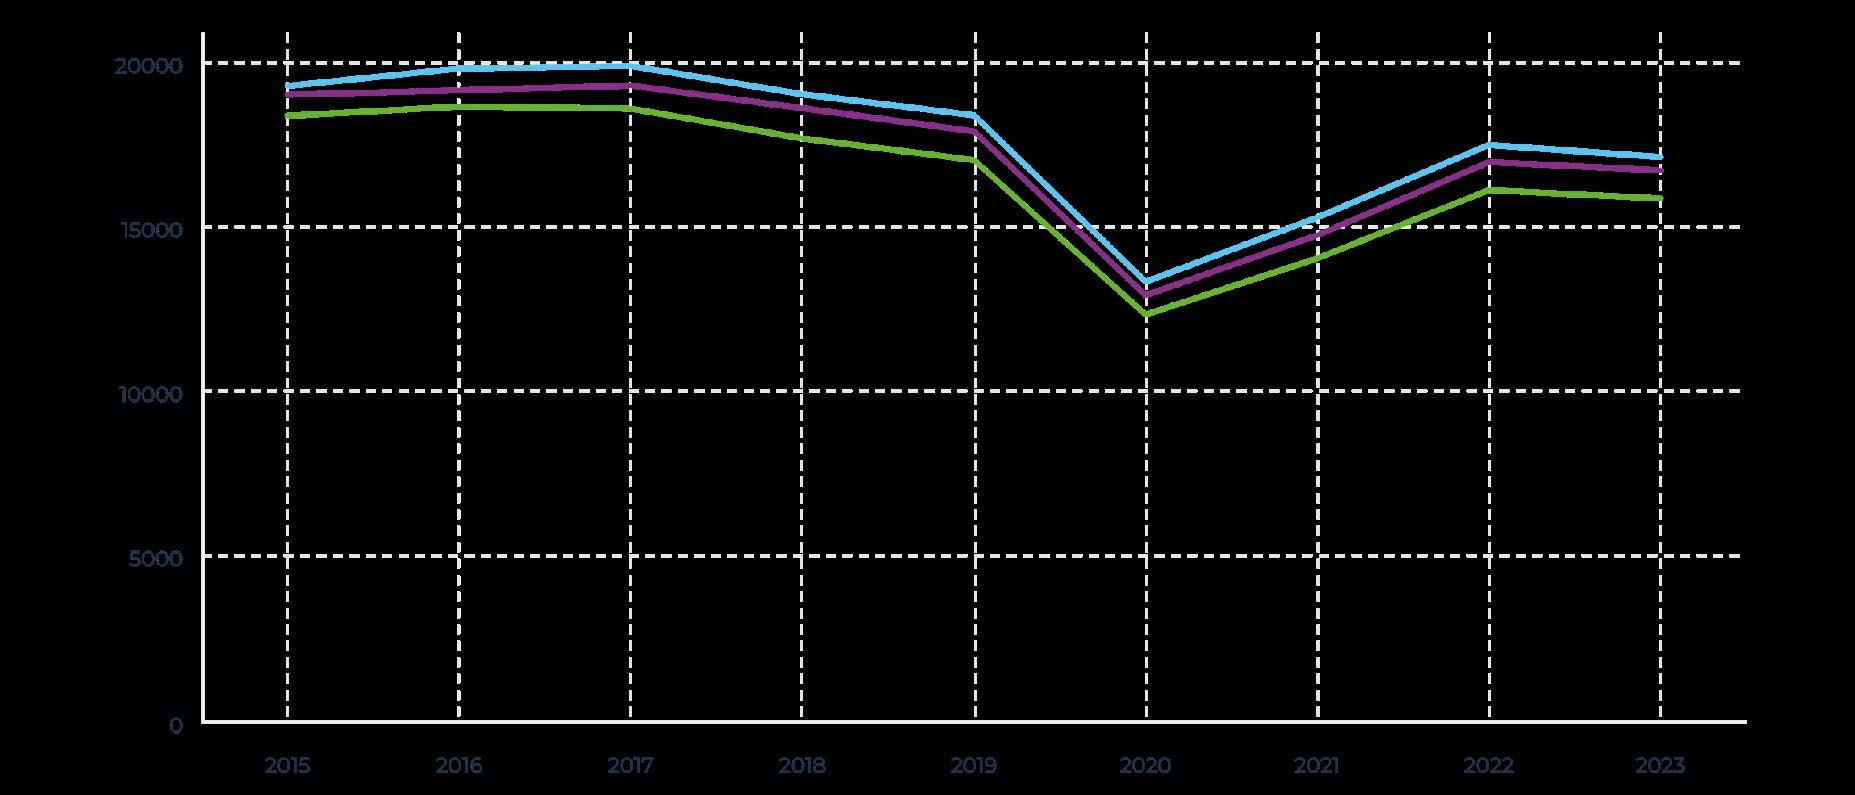
At a national level, the average kilometres travelled by a private vehicle in 2023 reached almost 15,200. This is a decrease of 1.5% on the previous year. Nationally the average kilometres travelled is on a downward trend since 2015, decreasing YoY in five of the eight years analysed.
Those years being 2017, 2018, 2019, 2020 and 2023. Like all other counties in Ireland, 2021 and 2022 represented growth resulting from the decrease in 2020 due to the pandemic. Comparing 2015 to 2023 nationally, there has been a decrease of 13.5% in the average kilometres travelled.
AVERAGE ANNUAL KILOMETRES TRAVELLED
12.1% 11.2% 13.7%
At a Mid-West level, for Limerick the average kilometres travelled in 2023 was 15,900 km, this represented a 1.6% decrease on the previous year.
Like nationally, the average yearly kilometres travelled in Limerick is on a downward trend Comparing 2015 to 2023, the average kilometres travelled are down by 13.7%
Similarly for Clare the average kilometres travelled in 2023 was 16,700 km this represented a 1.5% decrease on the previous year. The average kilometres travelled per year is also on a downward trend in Clare with a 12.1% decrease comparing 2015 to 2023.
For Tipperary the average kilometres travelled in 2023 was 17,200 km this represented a 2.1% decrease on the previous year. The average kilometres travelled per year is also on a downward trend in Tipperary with a 11.2% decrease comparing 2015 to 2023.
Limerick Clare Tipperary
Shannon Foynes Port is a critical logistics hub, but infrastructure investment is needed.
LOGISTICS
LOGISTICS
LOGISTICS
LOGISTICS
LOGISTICS
LOGISTICS
LOGISTICS
LOGISTICS
LOGISTICS
New Goods Vehicles Licensed
Almost 31,000 new goods vehicles were licensed nationally
In 2024, almost 31,000 new goods vehicles were licensed nationally. This represented a 13.8% increase on the previous year. 41.9% of all new goods vehicles licensed nationally were licensed in Dublin.
The second most populous county for new goods vehicles licenses was Cork, which accounted for 11.3% of the national total
The third highest was Kildare, capturing 4.4% of the overall share Since 2022, the number of new goods vehicles licensed for the first time has increased each year.
In 2024, Limerick captured 3.1% of the overall share with 946 new goods vehicles licensed for the first time, this was an increase of 12.9% on the previous year.
Clare accounts for 1.5% of the national total reaching 460 new goods vehicles in 2024 – a 10.8% increase on the previous year.
Tipperary shares 2.7% of the national total, reaching 839 new goods vehicles in 2024 – an increase of 16.5% on the previous year.
3 COUNTIES NEW GOODS VEHICLES
Number of Licensed Road Hauliers
The Mid-West, has seen a drastic decline in the number of licensed road hauliers
The number of licensed road hauliers peaked nationally in 2008 at 5,453 – in 2022 (the most recent available data) road hauliers had declined to 3,837, a decrease of 29.6%. The trend of licensed road hauliers nationally was at a peak in 2008 with drastic decreases in their numbers between 2009 and 2015, this has been relatively stable since, averaging approximately 3,800 per year.
A similar story has unfolded in the Mid-West, which has seen a drastic decline in the number of licensed road hauliers.
In 2022, Limerick had 140 licensed road hauliers, a decrease of 39.7% from its peak in 2008. For Tipperary there were 196 licensed road hauliers, a decrease of 27.9% from its peak in 2008. Clare peaked in 2009 with 157 road hauliers, by 2022 this had decreased to 81 representing a decrease of 48.4%.
In Tipperary, the decline stabilised in 2013 and has been on a slight upward trend since. In Limerick, the decline continued much longer than in Tipperary with the number of licensed road hauliers decreasing in Limerick until 2016, being relatively flat averaging approximately 141 per year since. Like Limerick, Clare has seen a decline until 2016 – averaging 84 licensed road hauliers per year since.
Limerick’s proximity to the Shannon Estuary and Atlantic Ocean, and the untapped energy potential that lies therein this is of particular importance.
Road Freight Transport Activity
Like the national picture, the MidWest saw a decline in annual road freight tonnage
The national road freight figures dropped significantly from 140.2 million tonnes in 2009 to 101.2 million tonnes in 2012. A steady recovery began in 2013, reaching a peak of 157.8 million tonnes in 2023. The first half of 2024 (Q1 & Q2) shows 83.5 million tonnes, indicating a potential decline when compared with the first half of 2023, with 2024 being almost 410,000 tonnes lower over the same period in the previous year.
Like the national picture, the Mid-West saw a decline in annual road freight tonnage from 2009 to 2012. Decreasing from 16.9 million tonnes in 2009 (the peak of the data) to 13.0 million tonnes in 2012. Since then, it has rebounded, reaching 15.9 million tonnes in 2023 but still 6.2% lower than its 2009 peak.
Interestingly, Dublin’s share of overall national road freight increased from 20.0% in 2009 to a high of 27.6% in 2016 and has averaged 26.3% of the national share per year since. During this time, the Mid-West has seen a decrease in its share, from 13.9% in 2010 to 9.4% in 2022.
The most recent available information is for the first half of 2024. However, comparing this to the same period in the previous year might give an indication of where 2024 will finish. As outlined, nationally there has been a decrease of 410,000 tonnes (-0.5%) when comparing the two periods. The only regions to increase during this time was the border region, by 1.6 million tonnes (+30.3%), and Dublin by 467,000 tonnes (+2.2%). All other regions have decreased to varying degrees. The largest decrease was seen in the West, with a drop of 16.8% (1.1 million tonnes) while the Mid-West decreased by 2.1% (200,000 tonnes).
Road Traffic Volumes (Goods
Vehicles)
In 2023, the average yearly kilometres travelled by a goods vehicle was just over 22,200 km – this represented an 8.0% decline on the previous year.
In Limerick, a goods vehicle, on average, travelled almost 22,900 km, a decrease of 8.3% on the previous year. Both Clare and Tipperary followed the same trend as Limerick, declining in 2023 by 12.8% and 10.5% respectively. Goods vehicles travelled 20,500 km in Clare on average during 2023, while in Tipperary they travelled 21,300.
Monaghan was the county where goods vehicles had the highest average km travelled in the year, recording 24,700 km, while the lowest was Donegal where goods vehicles averaged 19,700 km.
Despite a decline in 2020 due to the pandemic, the average goods vehicles kilometres travelled is on an upward trend for the three counties of the Mid-West. Although, in Limerick, it is almost flat with a slightly positive trend – with a clearer upward trend visible in Clare and Tipperary.
Dry bulk traffic represents approximately 30% of all Republic of Ireland port tonnage
The dry bulk market consists of raw materials for industrial or agricultural purposes, such as fertiliser, animal feeds, chemicals and iron ores. For 2024, Shannon Foynes Port handled more dry bulk cargo than any other Irish port. 7.6 million tonnes of dry bulk cargo passed through the port, 755,000 tonnes more than in 2023 – an 11.0% increase on the previous year, and the first YoY increase since 2021.
As per the Irish Maritime Transport Economist publication by the Irish Maritime Development Office (IMDO), dry bulk traffic represents approximately 30% of all Republic of Ireland port tonnage and 75% of all dry bulk traffic is imported. Dublin Port, Shannon Foynes Port, and the Port of Cork consistently represent three quarters of all Republic of Ireland Dry bulk
traffic, with Shannon Foynes averaging 53% of the overall total of dry bulk traffic. In 2023, dry bulk traffic decreased across all Republic of Ireland ports except for Drogheda. Shannon Foynes Port recorded a steep decline in dry bulk traffic in 2023, decreasing by 18.2% on the previous year (-1.5 million tonnes).
From 2011 to 2023 Shannon Foynes Port averaged 57.2% of all dry bulk republic of Ireland traffic. However, this share has been slowly declining over time from 63.6% in 2011 to 50.4% in 2023.
The IMDO outlines that imports of bauxite make up approximately half of all dry bulk tonnage at Shannon Foynes Port. In 2023, imports of bauxite into Shannon Foynes fell by 20% (approximately 850,00 tonnes) this resulted in a decrease of exports of alumina from the port by 13% (-190,000 tonnes).
Break Bulk (loose, non-containerised cargo stowed directly into a ship’s hold)
When construction materials cost rise the tonnage of break bulk handled slows
Break bulk is made up of goods that are stowed on board ships as individually counted units, such as manufacturing and construction equipment. The IMDO defines break bulk as “break bulk cargo refers to loose, non-containerised cargo stowed directly into a ship’s hold. It is not in raw material form, such as coal, oil, or grain. In addition, it is also not capable, or is too large, to be containerised. Break bulk cargo commonly includes commodities such as timber, steel, or machinery”.
In 2024, Shannon Foynes handled almost 326,000 tonnes of break bulk, an increase of 6.1% on the previous year, and the
largest share handled by any Republic of Ireland port. Shannon Foynes Port, over the last decade have been increasing their share of the national break bulk market, increasing from 14.6% in 2014 to 22.0% in 2023 – signifying a clear upward trend. This coincides with an ever-increasing tonnage of break bulk handled by the port.
Most of the demand for break bulk cargo is derived from the likes of construction and industrial activity that demands steel and timber. The IMDO demonstrates that a rise in construction prices negatively impacts the amount of break bulk handled i.e. when construction materials cost rise the tonnage of break bulk handled slows.
Liquid Bulk (finished, oil-based products)
Oil refined at Whitegate is exported directly with volumes produced not driven by
domestic demand conditions
Liquid bulk consists of anything from gasoline to fruit juices and cooking oil. Although in an Irish context, as the IMDO highlight “Liquid bulk traffic is generally comprised of finished, oil-based products that range from petroleum and diesel for cars, jet fuel for aviation, and home heating oil. There are three fundamental areas where most liquid bulk imports are used; home heating, electricity generation, and transport.”
In 2024, Shannon Foynes Port handled 1.2 million tonnes of liquid bulk, a 16.7% increase on the previous year and 12.1% of overall Republic of Ireland port share. Shannon Foynes Port, along with Galway Port were the only two ports to increase liquid bulk handled over the previous year, while all other ports declined.
83
As per the IMDO, during the five years to 2023, imports have averaged 82% of all liquid bulk traffic through Irish ports, while liquid bulk exports account for 18%. Of the liquid bulk traffic exported, over 95% of this traffic leaves from the Port of Cork – originating from the Whitegate Oil refinery where crude oil is processed. Interestingly, the IMDO also highlights that the majority of oil refined at Whitegate is exported directly with volumes produced not driven by domestic demand conditions but rather operational capabilities of the refinery.
Shannon Foynes operates at a lower share of liquid bulk in comparison to other Republic of Ireland ports with Cork (38.3%) and Dublin (46.6%) being the leaders in liquid bulk.
The Mid-West Economic Insights (MWEI) is Limerick Chamber’s flagship economic report, offering in-depth analysis of key trends shaping the Mid-West region’s economy. Published regularly, the MWEI provides data-driven insights, regional comparisons, and policy recommendations to inform businesses, policymakers, and stakeholders.