

2023-2024 Limerick Chamber Rental Barometer


Contents 1.0 - Local Electoral Area (LEA) Analysis 1.1 – Limerick at a Glance 1.2 – Local Electoral Area (LEA) Comparison 1.3 – Local Electoral Area (LEA) at a Glance 1.4 – Year-on-Year Price Growth 1.5 - Price Changes at a Glance 1.6 – City versus County 1.7 – Economic Impact of Rental Accommodation 2.0 - Executive Summary 3.0 - Barometer Overview and Setting the Scene 3.1 - Setting the Scene 3.1 - LEA New Home Delivery 3.2 - No. of Persons Per New Home (National) 3.3 - National Affordable Home Delivery as Percentage of New Homes 3.4 - National Affordable Home Delivery 4.0 - Rental Analysis 4.1 - Sustainability 4.1.1 – Most Common BER 4.1.2 – Price per BER Category 4.1.3 – BER Share for All Homes 4.2 - Availability 4.2.1 – Total Number of Rentals 4.2.2 – Average Monthly Availability of Homes 4.2.3 – Total Number of Apartments & Houses 4.2.4 – City vs County Monthly Availability 4.2.5 – Number of Persons & Households by Rental Property 4.2.6 – Homes Available by Number of Beds 4.2.7 – Lease Lengths 4.2.8 – Supply Trend City LEAs 4.2.9 – Supply Trend County LEAs 4.3 - Prices 4.3.1 – Average Monthly & Yearly Prices 4.3.2 – Average Prices Houses vs Apartments 4.3.3 – Price Per Number of Bedrooms 4.3.4 – Price Trend City LEAs 4.3.5 – Price Trend County LEAs 4.4 - Affordability 4.4.1 – Single Person Analysis of Affordability 4.4.2 – Family Analysis of Affordability 4.4.3 – Paying a Mortgage vs Renting 4.5 – Rent Pressure Zone Analysis 5.0 - Conclusion 4 4 6 8 10 12 14 16 18 20 22 22 24 26 28 24 30 30 30 31 32 32 32 33 34 34 35 36 38 40 42 42 42 43 44 46 48 48 48 50 52 54
Limerick at a Glance (LEAs)
€1,833 Average Price
+31% Increase in prices across the surveyed period
Limerick City North
Limerick City East
Limerick City West
Adare - Rathkeale
Newcastle West
CappamoreKilmallock
41 Average homes available per month
37% Of homes available were apartments
11%
Of homes were 1-beds
84% Of homes were for a lease of 1-year minimum
31% Of homes are BER C, the largest share amongst BER categories
Limerick Chamber Rental Barometer 2023-2024 Limerick Chamber Rental Barometer 2023-2024 4 5
Newcastle West
With an average price of €1,284 for the period, Newcastle West had the least expensive homes to rent
Limerick City West
at 162 homes, Limerick City West had the most rental homes available
Limerick City East
had the highest share of A & B rated homes relative to its total available stock (33% homes). Limerick City West had the highest total numbers at 48 homes
Cappamore - Kilmallock
comparing the average of the first three months of observations versus the last three months, Cappamore – Kilmallock decreased its prices by the greatest amount (-10%)
Limerick City North
had the highest apartment share relative to its overall available stock (65%), while Limerick City West had the most apartments available at 104
Limerick City East
With an average price of €2,101 for the period, Limerick City East had the most expensive homes to rent
Cappamore - Kilmallock
at 61 homes, Cappamore – Kilmallock had the lowest number of rental homes available
Cappamore - Kilmallock
had the highest share of homes D or less at 26% relative to its overall available stock. Meanwhile the highest number of total homes D and less was Limerick City West at 27
Limerick City North
comparing the average of the first three months of observations versus the last three months, Limerick ` City North had the highest growth at 23%
Adare - Rathkeale
had the lowest apartment share relative to its overall available stock (9%), it also had the lowest number ` of apartments available at 6
6 7 Limerick Chamber Rental Barometer 2023-2024 Limerick Chamber Rental Barometer 2023-2024
Supply
Affordability
Sustainability
LEA Comparison
Price Growth Apartments
LEAs at a Glance
Limerick City North
Limerick City East
Limerick City West
Adare - Rathkeale
Newcastle West
CappamoreKilmallock
Limerick City West
12 Homes Average Per Month 64% Apartments, 36% Houses
€1,962 Average Cost (All Homes)
€1,807 Average Cost (Apartment) €2,240 Average Cost (House)
38% of Houses are BER C 25% of Apartments are BER C
Limerick City North
6 Homes Average Per Month
65% Apartments, 35% Houses
€2,028 Average Cost (All Homes)
€2,022 Average Cost (Apartment)
€2,038 Average Cost (House)
55% of Houses are BER C 34% of Apartments are BER A
Adare - Rathkeale
5 Homes Average Per Month
9% Apartments, 91% Houses
€1,753 Average Cost (All Homes)
€1,088 Average Cost (Apartment) €1,822 Average Cost (House)
31% of Houses are BER C 50% of Apartments are BER C
Limerick City East
8 Homes Average Per Month
17% Apartments, 83% Houses
€2,101Average Cost (All Homes)
€1,782 Average Cost (Apartment)
€2,164 Average Cost (House)
50% of Houses are BER C 53% of Apartments are BER C
Newcastle West
5 Homes Average Per Month 21% Apartments, 79% Houses
€1,284 Average Cost (All Homes)
€911 Average Cost (Apartment)
€1,385 Average Cost (House)
56% of Houses are BER C 50% of Apartments are BER C
Cappamore - Kilmallock
5 Homes Average Per Month 15% Apartments, 85% Houses
€1,466 Average Cost (All Homes)
€1,061 Average Cost (Apartment)
€1,536 Average Cost (House)
31% of Houses are BER C
33% of Apartments are BER E
Data is for January 2023 to January 2024
Limerick Chamber Rental Barometer 2023-2024 Limerick Chamber Rental Barometer 2023-2024 8 9
Limerick City North +14%
Limerick City West +21%
Limerick City East +25%
Newcastle West +9% Adare – Rathkeale +20% Cappamore – Kilmallock +29%
Limerick Chamber Rental Barometer 2023-2024 Limerick Chamber Rental Barometer 2023-2024 10 11
Price Growth
Year-on-Year
Price Changes at a Glance
There are several ways to examine price changes over time. We have examined a number of those ways in this report to ensure that the full picture is provided to readers.
The infographic to the right displays price differences in the first month of tracking data versus the last month.
For Limerick City (East, West and North) we began tracking data in February 2022. Since then, prices have drastically increased. The data to the right shows the full, increased, cost of a year tenancy i.e. for renters in Limerick City North, if they rented in January 2024, they would be paying an additional €10,000 per year than if they had rented in February 2022.
For Limerick County (Newcastle West, Adare –Rathkeale, Cappamore – Kilmallock) we began tracking data in August 2022. Meaning, in Newcastle West in January 2024, renters would be paying an additional €2,000 per year compared to what they would have paid in August 2022.
It is worth noting, for most other analyses in this report the time period is the same for city and county i.e. January 2023 to January 2024
Limerick Chamber Rental Barometer 2023-2024 Limerick Chamber Rental Barometer 2023-2024 12 13
Limerick City North €10,125 Limerick City West €8,235 Limerick City East €6,921 Newcastle West €2,280 Adare – Rathkeale €479 Cappamore – Kilmallock €240
15 14 Limerick Chamber Rental Barometer 2023-2024 Limerick Chamber Rental Barometer 2023-2024 €2,060 Avg. Monthly Price 23 Avg. Monthly Supply of Homes 54% Of Available Homes Were Apartments 381 Persons Per Available Rental Home 39 One bed homes available Limerick City & Suburbs Limerick County €1,553 Avg. Monthly Price 18 Avg. Monthly Supply of Homes 17% Of Available Homes Were Apartments 390 Persons Per Available Rental Home 21 One bed homes available
Total economic impact of one year of new advertisement tenancies observed for all of Limerick
Total economic impact of one year of tenancies observed for Limerick City & Environs
Total economic impact of one year of tenancies observed for Limerick County *
Limerick Chamber Rental Barometer 2023-2024 Limerick Chamber Rental Barometer 2023-2024 16 17
Accommodation
Economic Impact of Rental
€12.0 M
€8.4 M
€3.6 M
The above covers new tenancies that were advertised only
3.0 Barometer Overview and Setting the Scene
This study, the Limerick Rental Barometer, focuses on Co. Limerick as a whole, providing an analysis of Limerick‘s residential rental availability on the open market. Limerick Chamber is the largest business representative body in the Mid-West, with over c. 400 member organisations who support over c. 50,000 jobs across the region. Hence, this study focuses on residential rental availability to highlight accommodation and affordability challenges for workers. The focus of this report is not student accommodation, short-term lettings or any other type of housing and purely focuses on residential housing aimed at working households.
Limerick Areas
A number of areas are examined as part of this report, however, most commonly we examine by Local Electoral Area (LEA). Co. Limerick has six LEAs. Three in the city area and three in the county.
In some instances, in this report, we reference Limerick City and Suburbs (Environs), this is a combination of the three city LEAs; City West, North and East. Along with this we reference Limerick County which is a combination of Adare – Rathkeale, Cappamore – Kilmallock and Newcastle West. Co. Limerick represents the whole county of Limerick and is a combination of all six LEAs.
Scope of Report
As part of Limerick Chamber’s Monthly Rental Market Monitor, we analysed information for the three counties of the Mid-West; Co. Limerick, Co. Clare and Co. Tipperary. However, the focus of this rental barometer report is solely on Co. Limerick and thus, provides the opportunity to analyse the performance of Limerick’s rental market. This study aims to highlight trends of Limerick’s open rental market, while providing an in-depth examination of Local Electoral Areas (LEAs) and other detailed areas.
Periods Analysed
Limerick Chamber has been collecting rental data for Limerick City and Environs (suburbs) since February 2022. The Mid-West Rental Monitor (our monthly publication series) was born out of this idea and evolved as the collection of data for Limerick County as a whole, Clare and Tipperary followed suit in August 2022.
However, to keep data consistent across areas, most data in this rental barometer report is from January 2023 to January 2024 (inclusive). There are some instances where the full data available is used, this is highlighted in the relevant section. Using longer-term data shows how prices have changed since we began tracking the data.
Data Collection & Sources
We collected open rental market information across multiple property rental websites, including social media groups and auctioneer websites, advertisements such as Daft.ie and Property.ie. This helped compile information such as:
• Average Price Per Month
• Location
• House Typology (e.g., detached house semi-detached house, apartment etc.)
• Tenure Type (e.g., residential, executive short term, and summer rental)
• Number of bedrooms
• Number of bathrooms
• Lease Length
• Building Energy Rating (BER)
Methodology
As outlined, data was collected across multiple sources. Thus, duplicates needed to be filtered out to reflect the true number of homes available to rent on the open market per month. Furthermore, the advertisement ID was recorded to further ensure that just the unique homes listed were recorded and duplicates in the same month were removed i.e. a home that appeared on more than one website was counted once, as is appropriate.
Rentals were filed under the month that they became available to rent, therefore, if a listing from a previous month was reuploaded in a separate month it would be recorded if appropriate time had lapsed. Only duplicates from the same month were removed. This means that the report shows the number of vacancies or advertisements as opposed to the number of unique homes e.g. a home could have been advertised in February, the tenant could have vacated, and the home was relisted in August, which we have seen to be the case in a very small number of homes.
20
21
Limerick Chamber Rental Barometer 2023-2024
Limerick Chamber Rental Barometer
2023-2024
New Homes Completed

Data Source: CSO
No. of Persons Per New Home

Data Source: CSO
No. of Families Per New Home

Data Source: CSO
The above data is from 2022 and 2023 and examines new home completions by Local Electoral Area (LEA). It also examines the number of people and families per new home which can help display demand and competition in a particular area.
There is a clear discrepancy between city versus county in terms of delivery. In 2022 and 2023 1,075 homes were completed in city LEAs. Meanwhile, just 495 homes were completed in county LEAs. Furthermore, while all city LEAs grew during this period, just one county LEA grew with two decreasing. In fact, at an aggregate level, between 2022 and 2023 the number of homes delivered in the county decreased by 35 homes. Meanwhile, in the city, it increased by 61 homes.
Furthermore, the county does not appear to be keeping with population growth at the same level the city is. The average number of persons per new home in Limerick City LEAs is 220, while in the county it is 449. In a similar fashion, there are more families per new home in county LEAs than in city LEAs. In essence, the lower this figure is the better. In theory, it examines competition of the existing population when trying to compete for a new house and the lower the number, the lower the degree of competition. Of course, this is only if a person wants to remain in the same area, which many do. It also depends on if people need a home or not.
Limerick Chamber Rental Barometer 2023-2024 Limerick Chamber Rental Barometer 2023-2024 22 23 3.1 – Setting the Scene – LEA New Home
Delivery

Examining the number of new homes delivered and comparing that to the population of counties give an indication of how counties are performing in terms of delivery of homes for their existing population. The data is for 2022, when the census was taken. Currently, it is not possible to perform the same analysis for 2023 due to the large annual increases in population currently underway in Ireland and lack of data at the county level in terms of population.
However, to give an indication of changes in population, the CSO provides an annual estimate of population change at the national level. In April 2023, the CSO estimated the population had grown by 98,000 people in the previous year. 78,000 of which was net migration (driven by 142,000 people coming into Ireland and 64,000 leaving).
The natural increase (births minus deaths) was just 20,000. The manner in which this population increase affects the housing market is highly dependent on where people are located.
This analysis focuses on the 26 counties of Ireland and also includes a figure for the state average. Again, the lower the number the better, as it means less competition for those
attempting to buy a home and it also means existing people are better facilitated for new housing.
The State is at 173 people for every new home. Just five counties have better results than this, with the remaining counties being below average. The Greater Dublin Area is made up of Dublin, Meath, Kildare and Wicklow – all of which are in the top four places. This shows a lack of equality in housing provision from a regional perspective in Ireland.
Unfortunately for Limerick, it is ranked 19th out of 26 counties. It is also the worse performing City. Comparing the city counties is a useful tool. Dublin has 141 people for every new home, Cork has 190, Galway has 212, Waterford has 226 and Limerick has 271. This issue of Limerick performing poorly in terms of new delivery, likely feeds into the rental challenges seen throughout this report.
Taking a wider look at the Mid-West, Clare has 230 people for every new home (ranked 13) and Tipperary has 401 people for every new home (ranked 25). Unfortunately for Tipperary it is second from the bottom.
Limerick Chamber Rental Barometer 2023-2024 Limerick Chamber Rental Barometer 2023-2024 24 25 3.2 – Setting the Scene – No. of Persons Per New Home (National)
Source: CSO data using authors’ calculations
3.3 – Setting the Scene – National Affordable Home Delivery as Percentage of New Homes

The analysis in this section is based on data from the CSO and the Department of Housing, Local Government and Heritage. The period analysed is the entirety of 2022 and Quarter 1, 2 and 3 for 2023. The final quarter of data for 2023 has not yet been released by the Department of Housing, Local Government and Heritage.
This analysis is useful as it ranks the best and worst performing counties based on what percentage of overall housing delivery was delivered through affordable housing programmes. These programmes being; Local Authority Affordable Purchase, First Home Scheme and Cost Rental. Again, it looks at the 26 counties of Ireland and provides a figure for the state.
Interestingly, when compared to the previous analysis,
there is a more equitable spread of top performers, rather than solely being focused on the Greater Dublin Area. The State is at 7.4% overall, with six counties performing better and the remainder performing worse.
Limerick is ranked 13th out of 26, with 4% of homes being delivered since the beginning of 2022 being affordable homes. Tipperary, again, is second from the bottom. While Clare, at 2.5%, ranks 17th. Interestingly, Waterford, at 16.2%, is joint top along with Wicklow.
The conclusion from these results, combined with the results from the rest of the Barometer, is that Limerick and indeed the Mid-West need to seriously expedite the delivery of affordable homes.
Limerick Chamber Rental Barometer 2023-2024
Rental Barometer 2023-2024 26 27
Limerick Chamber
Source: CSO and Department of Housing, Local Government and Heritage data using authors’ calculations
Affordable Home Delivery By County

Cost Rental Delivery By County

The analysis here focuses on the magnitude of affordable delivery at a county level from the beginning of 2022 to Q3 2023. Similar to the previous analysis, Q4 2023 data is not available at the time of writing this report.
The analysis also shows the make up of affordable delivery, and in most instances affordable delivery is mostly made up of the first home scheme. The first home scheme is a shared equity scheme targeted at owner occupiers; this means that homebuyers receive funds from the state in return for that state taking a percentage of ownership in the property.
Limerick has delivered 53 “affordable” homes thus far. 43 have been delivered through the first home scheme. The remaining 10 have been delivered through the cost rental in situ scheme, this is where a landlord who decides to sell can sell to the Housing Agency. In turn, the tenant can remain in their home which converts to cost rental.
The cost rental in situ scheme does not focus on new build delivery.
In terms of overall delivery of affordable homes, Limerick ranks 11th behind Cork (3rd), Waterford (6th) and Galway (8th).
However, examining just cost rental and Limerick’s delivery of 10 cost rental homes. Limerick ranks 7th. 19 counties have delivered four or less cost rental homes, with four counties delivering no cost rental homes. Almost all cost rental delivered outside Dublin and Cork has been delivered through cost rental in situ and thus are not new builds.
Outside the Greater Dublin Area and Cork, Ireland is performing incredibly poor with the delivery of cost rental homes. Cost Rental is the prime way of counteracting the issues outlined in the remainder of this Barometer.
Limerick Chamber Rental Barometer 2023-2024 Limerick Chamber Rental Barometer 2023-2024 28 29 3.4 – Setting the Scene – National Affordable Home Delivery
Department of Housing, Local Government and Heritage
Source: Department of Housing, Local Government and Heritage
Data Source:
Data
Most Common BER
Apartments Houses
Most Common BER
Apartments
Limerick City North
Limerick
Limerick City West
Adare
Newcastle West
Houses
Limerick
Limerick
Adare
Cappamore
Cappamore
Newcastle
Prices per BER

BER Share for All Homes Types

The Building Energy Rating (BER) provides a means for potential buyers or renters to make an unbiased comparison of the energy performance of various residences by offering insight into a dwelling's energy efficiency, The rating system is a scale from A to G. Homes with an A rating stand out as highly energy-efficient and comfortable, often resulting in lower energy expenses. Conversely, G-rated homes are less energy-efficient, demanding a significant amount of energy for heating and typically incurring higher energy costs Within our data, there are a number of homes which are “exempt” from a BER. Certain buildings and structures are exempt from the BER rating process and do not require a BER certificate when being sold or rented. Typically, buildings that are exempt from needing BER certificates include, stand alone buildings that have a total floor area of less than 50 sq/m and protected structures However, it is clear from our analysis, that while homes on portals may list as BER exempt, they did not fall into the exempt categories.
The Building Energy Rating (BER) provides a means for potential buyers or renters to make an unbiased comparison of the energy performance of various residences by offering insight into a dwelling’s energy efficiency. The rating system is a scale from A to G. Homes with an A rating stand out as highly energyefficient and comfortable, often resulting in lower energy expenses. Conversely, G-rated homes are less energy-efficient, demanding a significant amount of energy for heating and typically incurring higher energy costs. Within our data, there are a number of homes which are “exempt” from a BER (abbreviated to Expt.). Certain buildings and structures are exempt from the BER rating process and do not require a BER certificate when being sold or rented. Typically, buildings that are exempt from needing BER certificates include stand
alone buildings that have a total floor area of less than 50 sq/m and protected structures.
For Apartments, the most common BER among the six LEAs is a C rating – with four of the 6 LEAs having C as the most common rating. Conversely, Limerick City North has a high proportion of new apartments and thus has a high share of A rated homes. While in Cappamore – Kilmallock the largest share for apartments was an E rating. For houses in all LEAs, C is the most common rating.
For Apartments, the most common BER among the six LEAs is a C rating – with five of the 6 LEAs having C as the most common rating For houses, again, C is the most common rating with three out of the six LEAs having a C rating as the highest share. However, when it comes to houses there is a change, with Limerick City East having a high share of B ratings and Limerick City North having a high share of D ratings Across all home types within LEAs, C ratings have the highest share, except for Cappamore – Kilmallock Area where the highest share is exempt properties
There is a clear price differential / premium for homes of a certain BER e.g. higher rated homes command a higher price. This is true for both houses and apartments down to an E rating. After E, for F and G, price begins to move back up.
Interestingly, for apartments, the price difference between higher and lower BERs flatlined from B to D, while there is a slight decrease it is marginal The larger differences come at the higher and lower ends of the scale, and this is likely due to a lower number of houses available at these ratings. For houses, it is different. Even for B to D, there is a clear negative relationship i.e. higher BERs result in higher prices, again the number of observations at the higher and lower ends of the scale are more limited which cause large variations and may be unreliable
Limerick Chamber Rental Barometer 2023-2024 Limerick Chamber Rental Barometer 2023-2024 31 30 4.1 – Sustainability
C - 50%
- Rathkeale
C - 50%
Kilmallock E - 33%
C - 25%
A - 34%
C - 53%
City East
C - 31%
- Rathkeale
C - 56%
West
Kilmallock E - 31%
City West C - 38%
City North C - 55%
City East C - 50%
Limerick
3.1 Sustainability
Prices per BER €€500 €1,000 €1,500 €2,000 €2,500 A B C D E F G Exempt Apartment House


Total Number of Houses & Apartments

Limerick City West had the most homes available to rent over the surveyed period with c. 162 homes over the entire 13-month period, while the Cappamore –Kilmallock Local Electoral Area (LEA) had the lowest number of homes available at 61 over the 13-month period. The only LEA to achieve an average number of rental homes in double digits (>=10) was Limerick City West, every other LEA had single digit availability.
At a Co. Limerick (whole county) level, 37% of the rentals available over the period surveyed were apartments, while 63% were houses.
The area with the most apartments was Limerick City West with 104 apartments, which was 64% of the total home stock. The area with the smallest number of apartments was Adare – Rathkeale with just 6 apartments to rent over the entire period. This equated to 9% of the total stock available to rent in Adare –Rathkeale.
Chamber Rental Barometer 2023-2024
Chamber Rental Barometer 2023-2024 32 33 4.2 – Availability
Limerick
Limerick
Total Number of Rental Homes (All Types)
Monthly Average No. Rental Homes (All Types)
Monthly No. Rental Homes City & County (All Types)


Homes Available by Number of Beds


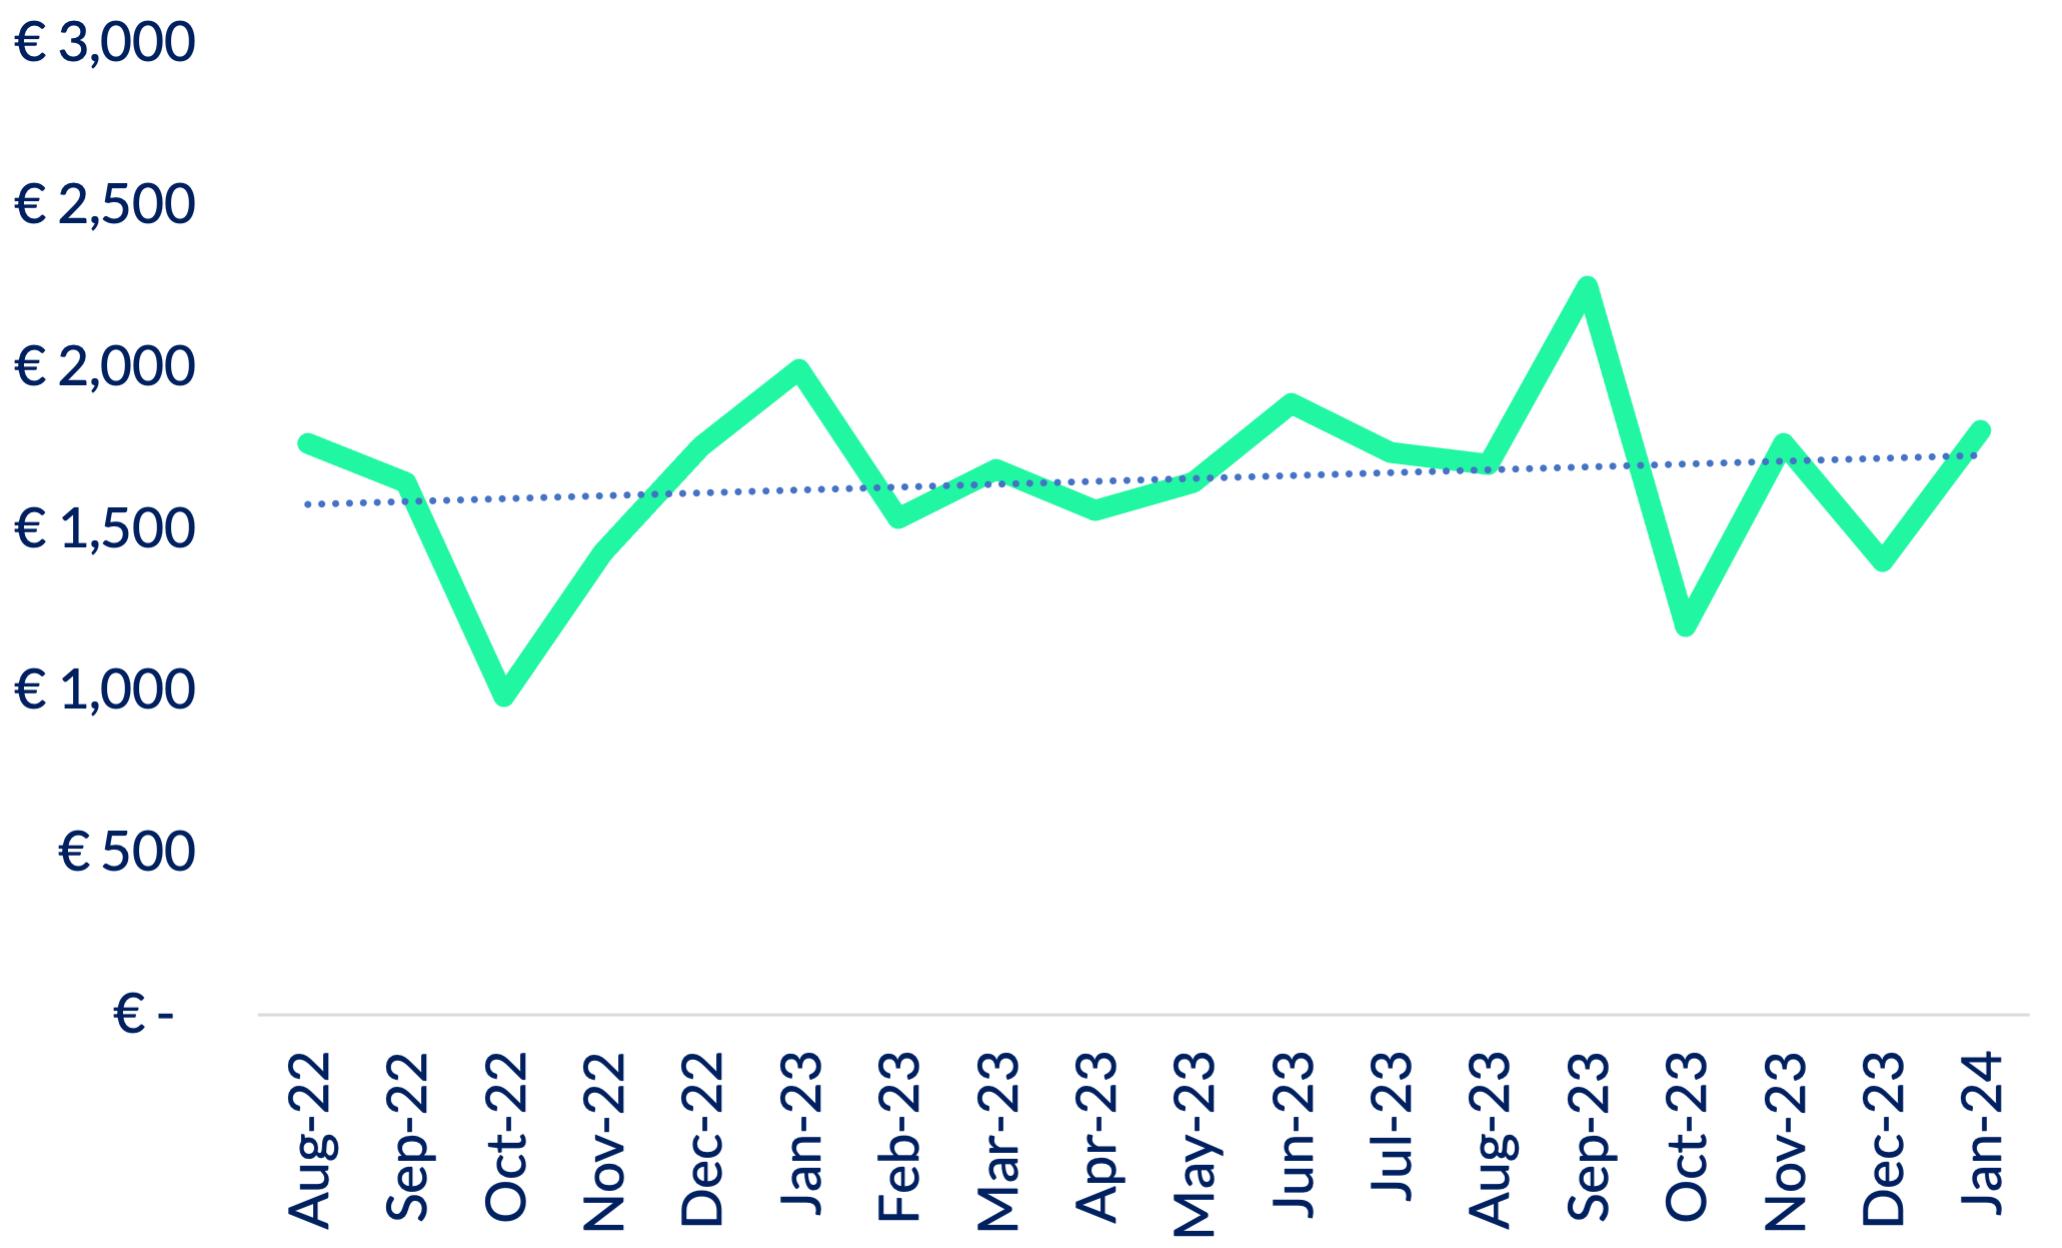
The supply of rental accommodation is highly unreliable in the sense that there can be large fluctuations in availability between months. For example, in February 2023 there were 23 homes in total to rent, the following month there were 46 homes to rent.
Despite the jagged nature of supply and the peaks and troughs. The supply across Co. Limerick is almost flat over the period surveyed – this is largely driven by a very slight upward trend in supply in Limerick City and Environs. The Limerick County area is on a slight downward trend. However, despite any positive trends, the supply across Co. Limerick is chronically low and inappropriate for the population.
Taking each LEA in isolation, examining the number of persons per available homes can be a useful tool in assessing supply. At the Co. Limerick level, there were 385 people for every 1 rental home available or using households (a grouping of people under one roof), there were 141 households for every one rental home i.e. for every 1 home available to rent there were 141 households. In essence the lower this ratio is, the better for renters, as it means less people competing for stock. In the case of Cappamore – Kilmallock, it was the worst performer with 215 households (or 598 people) for every rental available. Meanwhile, Limerick City West
was the “best” performer with 89 households for every rental available.
At a Co. Limerick level, the most popular home by number of bedrooms was 3-bed homes (36% of available stock) followed by 2-bed homes at 29%. 4-bed homes accounted for 17% of overall stock. Worryingly, just 11% of homes were 1-beds at the county level (60 homes in total). However, this dynamic changes slightly when drilling down into LEA level data.
In Limerick City North, the most popular home size was 2-bedroom homes (49% of its total stock, or 40 homes). For Limerick City East, the most popular home size was 3-bedroom homes (48% of its total stock, or 49 homes) – just 2% of the total stock in City East were 1-bedroom homes (2 homes). This was the worst performing LEA for 1-bedroom homes. City West’s largest share of homes were 2-bedroom homes (59 homes in total or 36% of its total stock) – Limerick City West also had the highest share of 1-beds relative to its overall stock (20% or 33 homes). 3-bed homes were the most common home type across all Limerick County LEAs to varying degrees with supply of 1-beds roughly equating to 7% of total stock, however, this only equated to between 4 and 5 1-beds per LEA.
Limerick Chamber Rental Barometer 2023-2024 Limerick Chamber Rental Barometer 2023-2024 34 35 4.2 – Availability
Number of Rentals Available Per Person & Per Household


Lease terms across Co. Limerick are heavily skewed towards a one-year minimum term with almost three quarters of homes across the county (84%) being a oneyear minimum at the Co. Limerick level. The second most popular lease length was “no minimum” at 10%. 3-to-6-month leases accounted for approximately 5%. Of course, this varies across location when examining by LEA. However, what this data does tell us is that just 55 homes out of the total rental availability had a flexible nature by having a “no minimum” lease term.
There is a very heavy skew towards one year rental terms for houses.
For apartments, while leases are still skewed towards one-year terms, there is far more flexibility in lease terms especially in Adare – Rathkeale, Cappamore –Kilmallock and Limerick City East. However, it is worth noting, despite the percentages, in absolute terms, looking at the number of houses, short or flexible term leases, like regular housing options, are in short supply across Limerick. For example, while 24% of apartments in Limerick City East were “no minimum” leases, there were just 17 apartments in total to rent across the 13 months, 4 of which were no minimum.
Chamber Rental Barometer 2023-2024 Limerick Chamber Rental Barometer 2023-2024 36 37 4.2 – Availability
Limerick
Lease Length (All Home Types)
Lease Length (Apartments)
Lease Length (Houses)
Limerick City East Supply Trend

Limerick City North Supply Trend

Limerick City West Supply Trend

The above data is utilising the full available data collected by the Chamber i.e. from February 2022 to January 2024.
When examining the full period of data available, February 2022 to January 2024, the average number of homes available on a monthly basis in Limerick City East was just 8 homes per month, in Limerick City North it was 7 and in Limerick City West it was 13. Comparatively, taking the primary period of this study, January 2023 to January 2024, the month averages for City LEAs has decreased with Limerick City East averaging 7 homes per month, City North was 6 homes per month and Limerick City West was 12 homes per month. This shows that the average number of
homes available on a monthly basis is decreasing, rather than the desired outcome of increasing.
The largest observable trend is the supply of available homes in Limerick City West is declining. While Limerick City East and North are also on a very slight downward trend, however the trend is flatter indicating very little change.
To show the low supply, the largest monthly supply of available homes in Limerick City East was 16 homes in September 2023, for Limerick City North it was 21 homes in December 2023 (driven by the completion of new rental properties), for Limerick City West it was 29 homes in May 2022.
Limerick Chamber Rental Barometer 2023-2024 Limerick Chamber Rental Barometer 2023-2024 38 39 4.2 – Availability
Adare – Rathkeale Supply Trend

Newcastle West Supply Trend

Cappamore – Kilmallock Supply Trend

The above data is utilising the full available data collected by the Chamber i.e. from August 2022 to January 2024.
When examining the full period of data available, August 2022 to January 2024, the average number of homes available on a monthly basis in Cappamore - Kilmallock was just 4 homes per month, in Adare –Rathkeale it was 5 homes per month and in Newcastle West it was 5. Comparatively, taking the primary period of this study, January 2023 to January 2024, the month averages for County LEAs have remained unchanged. This shows that the average number of homes available on a monthly basis is largely unchanging, rather than the desired outcome of increasing. There are some slight promising signs in Cappamore – Kilmallock where it is exhibiting a
slight positive trend over time, however, given the average monthly availability of homes it would take a significant amount of time to change the dial much.
To show the low supply, the largest monthly supply of available homes in Cappamore – Kilmallock was 14 homes in November 2023, for Adare – Rathkeale it was 12 homes in November 2022, and in Newcastle West it was 11 homes in November 2022.
On the opposite side of the scale, there were months in Limerick County LEAs where there was just one home, or no homes to rent. In Cappamore – Kilmallock this happened three times, in Adare – Rathkeale this happened once, and in Newcastle West it happened twice.
Limerick Chamber Rental Barometer 2023-2024 Limerick Chamber Rental Barometer 2023-2024 40 41 4.2 – Availability


Price per Number of Bedrooms (All Home Types)

There are several ways to analyse price data. The purpose of this section is to provide an idea of average prices over the period surveyed, rather than showing price growth. Price growth is covered in following sections.
At a high level, for all properties, Limerick City East is the most expensive LEA in Co. Limerick at €2,101 a month, which approximately equates to almost €25,000 per annum for renters. The second most expensive place to rent is Limerick City North at an average price of €2,028, an annual spend of just over €24,000 for renters. The least expensive average cost was Newcastle West at €1,284 per month, which equates to just over €15,000 annual spend for renters.
When we separate out apartments and houses, the most expensive area changes, with Limerick City West being the most expensive LEA for houses, while Limerick City North is the most expensive LEA for apartments. However, Newcastle West remains the least expensive for houses and apartments.
There is a premium on house living in Limerick when compared to apartment living. This is likely due to the size of houses versus apartments and the older
stock of apartments. For example, renting the average house in Limerick City West is 24% more expensive than the average apartment. The largest price difference from our analysis was in Adare – Rathkeale where houses were 81% more expensive than apartments, but again, there was a low number of apartments available in this LEA.
Likewise, there is a premium for city living versus county living i.e. living in city LEAs is more expensive than county LEAs. The average over the last 13-months is that city living is 33% more expensive than county living. Of course, this depends on the month. For example, in August 2023, there was a 76% difference. There are also differences when looking at houses and apartments. For example, houses in the city are 38% more expensive than in the county, while apartments are 65% more expensive in the city.
Unsurprisingly, the more rooms a home has, the higher the price. Interestingly, this moderates and levels off once we reach a 4-bedroom home and more i.e. prices stop increasing once a house gets to 5 or even 6 rooms when compared to 4. However, there is a sharp increase going from a studio to a 4-bedroom home.
Limerick Chamber Rental Barometer 2023-2024 Limerick Chamber Rental Barometer 2023-2024 42 4.3 – Prices
Monthly & Yearly Price (All Home Types)
Monthly Price (Houses & Apartments)
Average
Average
Limerick City West Price Trend
Limerick City East Price Trend

Limerick City North Price Trend


The above data is utilising the full available data collected by the Chamber i.e. from February 2022 to January 2024.
There is a very clear upward trend in prices across the Limerick City LEAs. Interestingly the highest prices observed for the city area occurred in the final two months of data collection. The highest price over the 24-month period for Limerick City East was €2,550, for Limerick City North it was €2,418 while for Limerick City West it was €2,099.
Given the somewhat consistent nature in price growth, one can examine the increase in prices on a month-onmonth (MoM) and year-on-year (YoY) basis. Limerick City North had the highest average MoM growth rate at 4% per month, while both City East and City West had an average MoM growth rate of 2%. This growth has added to significant price change over time.
Comparing YoY growth reveals some stark findings. YoY growth assesses the difference in the monthly price in one year to the same month in a previous year. Limerick City East had the largest average YoY growth at 25%, Limerick City West had a YoY average growth of 21% and Limerick City North had an average of 14%.
These MoM and YoY increases add up to a significant sum for renters over time. The monthly and yearly price difference for homes at the start and end of data collection for Limerick City North is an additional €844 – which equates to an additional €10,100 per year for new renters. While Limerick City North has seen the largest price differences at the beginning and end of data collection, it is not alone. Limerick City West has seen prices grow during the same period by an additional €686 per month, or €8,200 for new renters. Limerick City East has seen a similar trend with prices increasing by €577 per month, or almost €7,000 per year.
Limerick Chamber Rental Barometer 2023-2024 Limerick Chamber Rental Barometer 2023-2024 44 45 4.3 – Prices
Adare – Rathkeale Price Trend
Newcastle West Trend

Cappamore – Kilmallock Price Trend

The above data is utilising the full available data collected by the Chamber i.e. from Aug 2022 to January 2024 for Limerick County LEAs.
Similar to city-based LEAs there is a clear upward trend in both Adare – Rathkeale and Cappamore – Kilmallock, however the trend is not as steep which means a lower rate of price change. However, Newcastle West is on a downward trend in prices.
In a similar fashion to the city, some areas in Limerick County have seen their highest prices recorded over the last number of months with September 2023 being the highest month on record for both Adare –Rathkeale and Cappamore – Kilmallock, with prices reaching €2,250 and €1,925 respectively.
County LEA prices exhibit more severe increases and decreases on a monthly basis when compared to the city. Meaning more volatility and uncertainty for potential renters. Over the period observed,
the average MoM price increase in Cappamore –Kilmallock was 5%, in Adare – Rathkeale it was 4% and in Newcastle West it was 3%. Thus, while prices in Newcastle West are trending downwards, the average MoM increase is positive due to increases in price being larger than corresponding decreases.
Much like City LEAs, county LEAs have seen a significant increase in YoY price growth. Average YoY price growth in Cappamore – Kilmallock was 29%, in Adare –Rathkeale it was 20% and in Newcastle West it was 9%.
Like the City, this growth in the county has added to significant price changes over time. For example, the monthly price difference for homes at the start and end of data collection for Newcastle West equates to an additional c. €2,300 for renters. However, this point in time analysis is more muted for Cappamore –Kilmallock (+€240) and Adare – Rathkeale (+€479).
Limerick Chamber Rental Barometer 2023-2024 Limerick Chamber Rental Barometer 2023-2024 46 47 4.3 – Prices
Single Person Rental Affordability by Gross Income

Couple (w/ 2 children) Rental Affordability by Gross Income

The Housing Agency in Ireland defines any spending on rent compared to net income that is over 35% as outside the threshold for affordable housing i.e. if a renter spends more than 35% of their net income on rent it is deemed unaffordable. However, depending on family circumstances and financial commitments this can change.
In our assessment of affordability, we examined a single person and a family with two working adults. For single people we examined the average rent of a studio, 1-bedroom home and a 2-bedroom home. While supply of studios and 1-beds is extremely low, it should serve as a metric for assessing affordability at different income levels. For a family of two working adults and two children we assessed affordability of a 3 and 4-bedroom home. For income levels we took €10,000 increments from €30,000 to €100,000 gross income per year for single people and a combined gross income for the family of €40,000 to €120,000 per year, again at €10,000 increments.
In the examples on the left, any cohort over the red line (35% of net income) is unaffordable, any cohort underneath it is affordable.
For single people, earning €30,000 or €40,000 no housing option is affordable. Studio apartments do not become affordable until a single person moves towards €50,000 gross income per year. It is worth noting in the 13-months of data collection, there were just 5 studios available to rent. This represents less than 1% of all available housing. A 1-bed home does not become affordable until a single person is moving towards earning €70,000 gross income per year. Again, it is worth noting here that just 60 homes in the 13-months of surveyed data have been 1-beds (11% of total stock), so this very short supply could lead to more single people trying to rent 2-bedroom houses. Worryingly, especially for single parents, a 2-bedroom home does not become affordable until a person is earning closer to €100,000 gross income per year.
To put the above into perspective, in Census 2022, there were 18,313 people living alone (one person households), plus another 7,273 one parent family households. Of course, not all these people would require market rental as
some would own their homes or be part of social housing.
For a family, a 3-bed home becomes affordable at close to a combined gross annual income of €80,000 (assuming each parent earns €40,000), while a 4-bedroom home becomes affordable at the combined gross annual income of €100,000 (assuming €50,000) each.
A key issue here is around tax. In essence a single person has greater affordability issues for a home than a couple would. This is because a single person will have to pay more of their net income for less (a smaller home). For example, at €80,000 gross income a single person will have a take home pay of c. €4,500 per month, whereas a couple on a combined income of €80,000 will have a take home pay of c. €5,500 per month, this is because the couple is not in the higher tax band, whereas the single person is.
For households, it is worth noting existing Government programmes in place. Social Housing covers single people up to a net income of €35,000 (c. €42,700 gross) and cost rental covers a household net income of up to €59,000 (c. €85,000 gross). To put the above into perspective, the most recent summary of social housing needs from the Housing Agency indicates that there are 1,963 households eligible for social housing on the waiting list in Limerick as of 2022. Note the number of individuals on the list is likely to be much higher as a household can be made up of a number of people. Meanwhile, official data from the Department of Housing, Local Government and Heritage indicates that Limerick has seen 10 cost rental homes delivered to Q3 2023 (most recent available data). These 10 cost rental homes in Limerick were delivered through the Cost Rental in Situ Scheme which is where the Housing Agency purchases homes from private landlords who are selling so the Housing Agency can continue to rent the properties to the tenants who are living there i.e. cost rental homes delivered to the above date are not new builds. Putting cost rental delivery into a national context, 202 cost rental homes have been delivered in Kildare, 171 in South Dublin, 143 in Wicklow and 105 in Cork City. However, some further cost rental delivered in Limerick towards the end of 2023 and start of 2024, is not yet captured in official data released by the Department.
Limerick Chamber Rental Barometer 2023-2024 Limerick Chamber Rental Barometer 2023-2024 48 49 4.4 – Affordability
Cost of Paying a Mortgage vs Renting

We also compared the cost of rental per month to the cost of servicing a mortgage per month for a new and second-hand home across LEAs. For the above, it is assumed that homeowners had a 10% deposit, and took the mortgage out for 30 years, starting with a fixed rate for 3-years at 4.05% per year. It is worth noting that the Help-to-Buy Scheme (max €30,000 rebate) would not have been enough to cover a 10% deposit for a new home in any LEA. The data for purchase price is taken from the property price register (PPR) for 2023 and bulk purchased homes, as well as those homes sold below market price were removed for data integrity purposes.
In almost all LEAs the cost of renting per month was greater than the cost of servicing a mortgage on a new or secondhand property. The only LEA where rent was cheaper than the cost of a home was for new homes in Cappamore – Kilmallock. For Limerick City East, the cost of servicing a mortgage on a new home was 26% cheaper than renting, in Limerick City North it was 4% cheaper, in Limerick City West it was 10% cheaper, in Adare – Rathkeale it was 31% cheaper. There were no new homes sold in Newcastle West in 2023 that were logged on the PPR. For Cappamore – Kilmallock, the cost of paying
a mortgage on a new home was 8% more expensive than renting a home.
Even larger differences emerge when comparing the cost of paying a mortgage on a secondhand to the cost of renting. For Limerick City East, servicing a mortgage on a secondhand home is 68% cheaper than renting, in Limerick City North it is 86% cheaper, in Limerick City West it is 66% cheaper, in Adare –Rathkeale it is 43% cheaper, in Cappamore – Kilmallock it was 59% cheaper and in Newcastle West it was 52% more expensive.
Despite high interest rates, owning a home is cheaper than renting, for most LEAs. There are also wider societal benefits to owning a home, primarily having the mortgage paid off in retirement resulting in less monthly outgoings to pay on a pension. In absence of this, the state would need to provide very high levels of housing for the retired population.
It must be noted, when looking at the supply of new homes transacted on the market, there are very few observations (less than 20) in some LEAs namely; Adare – Rathkeale, Cappamore – Kilmallock, Limerick City North.
Limerick Chamber Rental Barometer 2023-2024 Limerick Chamber Rental Barometer 2023-2024 50 51 4.4 Affordability

In some cases the same home was advertised twice in the same year studied. This could be for many reasons, such as the tenant moving out or it wasn’t rented the first time it was advertised. However, it does allow us to assess price changes when a home is listed more than once. 24 such homes were observed during this study. 14 homes did not change in price between the first time they were advertised and the second time, this represents 56% of homes listed more than once.
Interestingly, 4 homes decreased in price by an average of €300. One could assume that this might be because their rent was priced too high initially and attracted no renters. However, given the elapsed time between most of these rentals (3 homes) it would be safe to say they were rented with their first advertisement. Only one advertisement decreased its prices in the space of a month. The average price decrease was 11%.
Worryingly, 6 homes increased their prices. There is one outlier in this data, one home increased its price by 75% or €900 in Limerick City West. The first advertised price was €1,200 and the second advertised price was €2,100. If this issue was rectified quickly, one might assume it was a typo given the similar numbers in the rental cost. However, 10 months elapsed between the first and second advertisement.
Removing this outlier, 5 other homes increased their prices by an average of €120 (7%) between the first
and second listings. Two of these homes changed prices within a month, assuming demand drove up prices. The remaining 3 had several months elapse assuming they were rented in the interim and the price was for new tenants.
This information is important to assess the impact of Rent Pressure Zones. A Rent Pressure Zone (RPZ) is a designated area where rent increases are capped. Rents in a RPZ cannot be increased by more than 2% per annum pro rata or if it is lower, by the increase in the rate of inflation as recorded by the Harmonised Index of the Consumer Prices (HICP). This restriction applies to new and existing tenancies in RPZs (unless an exemption applies). Limerick City East, West and North became rent pressure zones in 2019. Limerick County became a rent pressure zone 31st August 2023.
Most homes that saw price increases were located in County Limerick and most price increases were introduced before it became a rent pressure zone, however, two homes increased by 8% each after the cap had been introduced. The “outlier” increase also increased its price in the city after a cap had been introduced. However, there are a number of exemptions to the cap on rental prices which could be the reason for the above price changes and no solid conclusion could be made in terms of whether there was a breach of regulations or not.
Limerick Chamber Rental Barometer 2023-2024
Rental Barometer 2023-2024 52 53
Limerick Chamber
4.5 Rent Pressure Zones
5.0 Conclusion
In conclusion, Limerick Chamber’s launch of the Limerick Rental Barometer signifies a crucial step in understanding and addressing the challenges within the rental market, particularly in the Mid-West region. The comprehensive analysis provided by the Barometer sheds light on the critical issues of supply, affordability, and price dynamics across different areas and housing types.
The data highlights the chronic undersupply of rental properties across Co. Limerick exacerbating the already pressing issue of housing availability. Moreover, the escalating rental prices, particularly in urban areas, outpace the affordability threshold for many individuals and families, posing significant financial strain.
In the Chamber’s role as the largest business organisation in the Mid-West, we are all too aware of the impact current housing issues have on business. Affordable housing is crucial to employers for several reasons. Firstly, it directly impacts the recruitment and retention of talent. When housing costs are high, employees may face financial strain, leading to job instability or the inability to relocate for better job opportunities. Affordable housing ensures a stable workforce by enabling employees to live closer to their workplace, reducing commute times and associated stress. Moreover, affordable housing fosters employee satisfaction and well-being, as individuals can allocate more of their income towards other necessities, thereby improving overall productivity and morale within the workforce. Additionally, access to affordable housing expands the pool of potential employees, enabling businesses to attract diverse talent from various socioeconomic backgrounds. Lastly, affordable housing reduces the upward inflationary impact on wage demands from an employer perspective.
While we understand these issues plague almost every county in Ireland, if Limerick, and the Mid-West, wants to protect and grow our current attractiveness then massive strides need to be made in a short period of time.
The rental barometer is the most comprehensive report published to date analysing all facets of the rental
market in Limerick. It provides key decision makers with an in-depth overview of the challenges faced in the market. It also provides Limerick Chamber with an evidence base analysis to bolster our lobbying efforts for worker housing. There are a number of important conclusions for the research in this regard.
Living sustainably is becoming increasingly important as time passes. A key facet of this is the BER system. However, due to many properties being exempt (or advertised as exempt) it leads to an opaqueness and limits renters’ abilities to make an informed decision about how they rent. Of course, due to lack of supply, it is difficult for renters to decide based on BER in the first place. While a lower BER results in a lower monthly rent, this is often cancelled out by the increased costs of running a home.
There is an extremely low supply on a monthly basis. On average, Limerick had 41 homes to rent across the entire county on a monthly basis. However, monthly supply is prone to severe peaks and troughs making the market highly unreliable for renters. For example, in February 2023 there were 23 homes to rent, the following month there were 46. Throughout our entire analysis the lowest supply for Limerick City and Suburbs was 21 homes in April 2022. This creates a very real issue whereby if somebody has to leave an existing property for whatever reason, they could become homeless due to lack of supply. To put this into perspective, the MidWest has added almost 20,000 new jobs since we began this analysis, not all of those new employees would be from the Mid-West and thus would require housing.
Limerick Chamber supports the goals within Project Ireland 2040, particularly focusing on balanced regional development and densification. While some areas in Limerick do well in the provision of apartment living, there are some that do not. City East, Cappamore –Kilmallock and Adare – Rathkeale all had less than 20% stock as apartments. It is the Chamber’s view that dense living should not be confined to the city or city centre areas and should be available in all populous areas and employment nodes. Failing to do so will be failing to implement Project Ireland 2040.
Inflexible lease terms are also an issue. There are many instances where a person is in Limerick on a temporary basis and will not be able to sign a 1-year lease. This can be the case for students, contractors building factories or office space, or even senior directors visiting Irish operations on a temporary basis. Examining all homes across all Local Electoral Areas outlined that 77%+ of all leases are for a minimum of 1-year and shorter or no minimum leases are in short supply and thus hard to come by.
One critical piece of analysis in terms of assessing both supply and demand is examining the number of people or households (grouping of people) per rental. The higher the number the greater competition, in theory. Across Co. Limerick, there were 385 people for every 1 rental home available, while there were 141 households for every 1 rental home available. Of course, not all these people or households are in need of rental, however, it does outline that we are utterly failing to increase rental stock to match the population. In some areas, this is a particularly large issue with the likes of Cappamore – Kilmallock having almost 600 people for every 1 rental home (or 215 households for every 1 rental home).
Unsurprisingly, our analysis found price premiums for city living, larger homes and higher BERs i.e. homes located in the city were more expensive than the county, homes with a greater number of bedrooms up to a certain point were also more expensive, as well as homes with higher BER also being more expensive. Interestingly, apartments are, on average, cheaper than houses. Outlining there is also a price premium for living in houses, likely due to their size. However, unlike European neighbours, Ireland performs poorly in disclosing price per square metre which would help to understand the housing market more.
Affordability across Limerick is a worry for all cohorts but in particular single people and single parents. For example, a 1-bed home does not become “affordable” for a single person until they earn close to €70,000 per year. For a single working parent that requires a 2-bed home, this would not become affordable to them until they earn over €90,000 per year.
It is deeply concerning that the cost of renting, for most areas, is more expensive than paying a mortgage on a new or second-hand home. In some instances, our research found that renting can be 86% more expensive than paying a mortgage.
In essence, across almost all Local Electoral Areas in Limerick, neither price nor supply are trending in the right directions, and indeed, not trending quick enough.
For the city LEAs, supply is trending downward while price is trending upwards. For the county LEAs it is more of a mixed bag, with the relationship between supply and price being less clear. For example, prices are trending upwards in Adare – Rathkeale and Cappamore – Kilmallock, but they are trending downwards in Newcastle West. However, in terms of supply it is decreasing in Adare – Rathkeale, but almost flat in Newcastle West (slightly downward) and Cappamore –Kilmallock (slightly upward).
Limerick Chamber has undertaken significant research in the area of housing and has highlighted various challenges that need to be overcome. We have also provided many policy options to help the sector. However, to limit this example to a few items; much quicker activation of state-owned land is required, more realistic targets for home providers at the county level is needed, state-developments need to be frontloaded with cost rental to have an immediate impact on the rental market and the financialisation (requiring a financial return) of cost rental and affordable housing has made it difficult to produce apartments for ownership and rent, this must change.
To finish, the rental market in Limerick is performing poorly, however, we understand this issue is across Ireland. However, not all counties produce the in-depth analysis that we have for Limerick and thus makes comparisons impossible.
The information contained in this report should serve as a warning sign to increase affordable and private market activity in the sector, or else the problem will become so embedded that we will be unable to change the dial.
Limerick Chamber Rental Barometer 2023-2024 Limerick Chamber Rental Barometer 2023-2024 54 55


Limerick Chamber Rental Barometer 2023-2024 Limerick Chamber Rental Barometer 2023-2024 56 57 Other publications S u b m o n s u o R ev e w o A r s P L m c a Submission on the Review of National Ports Policy Issues Paper Limerick Chamber January 2024 Submission on Draft BusConnects Plan for Limerick Limerick Chamber April 2023 Housing Infrastructure Transport Economic Development Energy Mid-West Economic Insights Spring 2023 Limerick Chamber Limerick City Centre Report Limerick City Centre Report Submission on the draft Offshore Renewable Energy Development Plan II (OREDP II) Limerick Chamber April 2023 Limerick Chamber Submission on the Review of the Security of Energy Supply of Ireland’s Electricity and Natural Gas Systems October 2022 Find more at www.limerickchamber.ie/influence
2023-2024 58
Limerick Chamber Rental Barometer

