The Corcoran Report
| 2024 | EAST END
Westhampton | $15.95M | WEB# 913403


| 2024 | EAST END
Westhampton | $15.95M | WEB# 913403
The South Fork reported 434 single-family home sales in Fourth Quarter 2024, up 12% versus last quarter and 25% year-over-year. This was only the second annual increase in the last three years.
Versus Fourth Quarter 2023, 12 of 14 submarkets saw higher sales while two saw fewer closings. Westhampton Beach had the greatest annual percentage gain, with closings up two-and-a-half times (17 more sales) versus 2023. Water Mill saw the deepest annual drop in sales, down 50% (11 fewer sales).
Dollar volume increased alongside sales, rising 13% year-over-year to $1.350B. Annually, 11 submarkets reported increases in volume while three saw volume decrease. Quogue exhibited the largest annual increase, as closings reported over $5M jumped from one to six, several of which were on Dune Road. Southampton Village had the largest year-over-year decline, with volume down 57% because 2023’s figure includes a $112M sale. Without that closing, volume would have increased slightly year-over-year.
Median price decreased 6% year-over-year, which was just the third annual decline in five years. Average price also fell, down 9% year-over-year but was still above $3M, a threshold first crossed in 2022.
Versus a year ago, median price remained level or increased in ten of 14 submarkets. Shelter Island’s median price more than doubled year-over-year; last year, just one sale was over $1.5M, whereas all but two exceeded that number in Fourth Quarter 2024. Westhampton Beach median price fell more than any other village/hamlet, down 39% annually because of a greater share of sales under $2M.
Sales Price
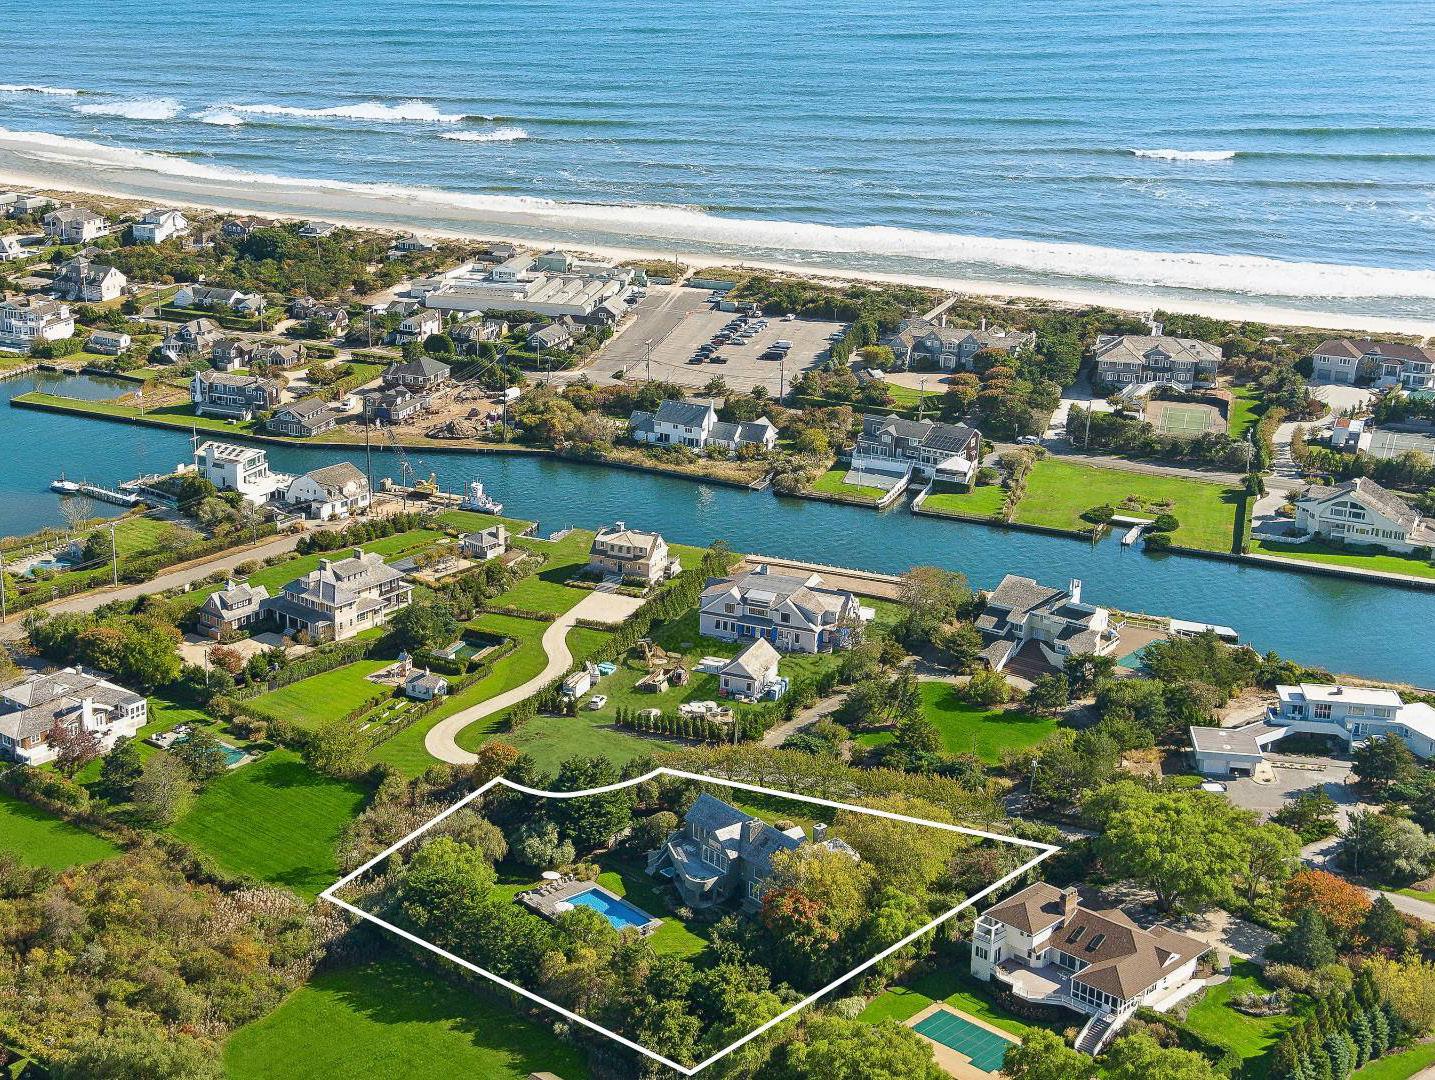
Peconic | $35,500,000 | WEB# 913493


North Fork single-family home sales fell 14% annually to 99 closings in Fourth Quarter 2024. Versus a year ago, Aquebogue/Jamesport was the only submarket to see an increase in reported closings, while Mattituck/Laurel sales fell most significantly, down 36% (10 deals).
Though just one area had an annual increase in reported sales, three of six North Fork submarkets saw sales volume increase versus 2023 due to rising prices. In addition to Aquebogue/Jamesport, both East Marion/Orient and Southold/Peconic had increases in dollar volume despite not reporting more sales than 2023. Cutchogue had the largest annual decline in volume amid fewer sales over $1M than a year ago.
Overall median price fell 10% year-over-year to $960K due to a smaller share of sales over $1M. However, average price increased 16%, bolstered by one $10M sale. Prior to this increase in average price, four consecutive quarters had shown a decline. Average price grew in all submarkets but one, Cutchogue.
The luxury market is the top 10% of all home sales by price during the quarter. As various factors redefine the high-end market in any given period, price figures may exhibit more volatility than the market overall. However, because the luxury market is a fixed percentage of the overall market, its changes in the number of sales will always match the overall market.
In Fourth Quarter 2024, South Fork luxury average price fell 23% to $11.4M due to fewer sales over $20M. In addition, several sales over $50M skewed last year’s average price. However, reported sales from $10M to $20M doubled year-over-year this quarter, causing median price to rise 15% to $10.9M.
Fourth Quarter 2024’s most expensive reported sale was a 15,000 square foot new construction home in Bridgehampton. Bridgehampton/Sagaponack accounted for more of the South Fork’s luxury sales than any other submarket, as it was the only area with reported sales over $20M. The average luxury sale price on the North Fork jumped 54% annually and median price swelled 37% year-over-year. Last year, only four sales were reported over $3M. This year, all but one luxury sale surpassed that number. On the North Fork, the highest-priced sale was a five-bedroom, four-and-a-half bath residence on Peconic Bay that traded off-market for $10M. This was 72% higher than last year’s top sale.


The South Fork reported 33 condo sales in Fourth Quarter 2024, up 18% (fi ve sales) yearover-year. This drove closing volume to jump 32% to more than $46M. Median price fell 4% annually, however, as the share of sales under $1M grew. Nevertheless, average price grew 12% due to more sales over $2M. The most expensive South Fork condo sale was at The Latch in Southampton Village for nearly $4M.
The North Fork reported 13 condo sales in Fourth Quarter 2024, up 225% (nine sales) compared to a year ago. Sales volume also tripled. However, average and median price declined 4% and 20%, respectively, because of a greater share of sales under $750K. This quarter, the most expensive reported sale was a Greenport residence with water access and views of Pipes Cove.


The land market is defined as the total sales of all vacant land on the East End regardless of zoning. The commercial market encompasses sales of existing buildings classified for non-residential use only. Traditionally, both Forks experience relatively few commercial transactions in any given quarter.
The South Fork saw 44 vacant land closings this quarter, up 22% annually. However, half as many deals traded for over $5M, pulling average price down 16% year-over-year to $2.058M. Median price rose slightly, up 2%. The top land sale was a two-acre lot in South Hampton Village near Agawan Lake for $10.9M.
North Fork land sales fell 76% (22 sales) year-over-year. With far fewer sales, dollar volume fell 67%. However, average and median price both jumped by double digits as half of those sales were over $1M versus just 14% a year ago. The top North Fork reported land sale was a 28 acre vineyard in Southold.
The South Fork reported 18 commercial transactions in Fourth Quarter 2024, four fewer than were reported in Fourth Quarter 2023. Montauk had more reported closings than any other submarket with four sales, including the most expensive sale of the quarter: Gosman’s Dock.
The North Fork recorded just two commercial closings, down from six in Fourth Quarter 2023. Consequently, sales volume plummeted 55%. Cutchogue was home to the most expensive sale, Legends Restaurant, including residential cottages for $2.2M.
Inventory is the number of East End properties listed for sale at the end of the quarter. At the end of December, inventory was 1,840 listings, up 9% annually and the fourth consecutive annual increase.
Please note that Corcoran switched to a new listing system during Second Quarter 2019. Therefore, the inventory figures cannot be compared to that published in reports prior to that quarter.
For the purposes of the South Fork market comparison, this report contrasts the villages and hamlets from Remsenburg to Montauk, plus Shelter Island, while the North Fork encompasses the area extending from Aquebogue to Orient.
The Corcoran Report uses market-wide data from the Long Island Real Estate Report and is based upon transactions reported from October through December 2024. It compares data to that reported in the same period of 2023 as well as the prior quarter. There can be a significant period between when a contract is signed, the sale is closed, and then reported publicly. As a result, many transactions in this analysis actually occurred prior to being reported in Fourth Quarter 2024.
The Corcoran Group is a licensed real estate broker located at 24 Main St., Southampton, NY 11968.