TREND REPORT LA FASHION DISTRICT


The LA Fashion District Business Improvement District (BID) is a private, non-profit corporation created and maintained by property owners. We serve the LA Fashion District community -- businesses, employees, residents, visitors, and more. Our mission is to help facilitate and provide a clean, safe, and friendly place to work, shop, live, and do business.
We serve a 107-block area generally between 7th Street to the north and the Santa Monica 10 Freeway to the south, and from Broadway to the west and Paloma Street to the east.
LA Fashion District BID services include:
CLEAN & SAFE -- The LA Fashion District’s sidewalks and public right-ofway are maintained and patrolled by our Clean and Safe Teams. Clad in the LA Fashion District’s historic signature yellow, these teams are on patrol 24 hours a day, 7 days a week.
The Clean Team crew is responsible for keeping up with the demands of the district’s cleanliness, and keeping the public right-of-way free of excess trash, graffiti, and so much more.
As goodwill ambassadors for the LA Fashion District, the highly visible staff of yellow-shirted Safe Team members welcome and enhance experiences for residents, visitors, and employees in the LA Fashion District.
MARKETING & EVENTS -- The Marketing Team is responsible for elevating the LA Fashion District’s brand. Through comprehensive
KARA BARTELT
Hoxton Hotel
MARK CHATOFF
California Flower Mall
MARGOT GARCIA
The Hirsh Collective
TOM KEEFER
The New Mart
ERIC KIM
California Market Center
STEVEN KIM
Daily Investment
LISA KORBATOV
Fisch Properties
JESSICA LEWENSZTAIN
ANJAC Fashion Buildings, LLC
The Orpheum Theatre
marketing, communications, and special events program, the LA Fashion District BID promotes the LA Fashion District as a premier destination for shopping, dining, living, working, and doing business. Yearround marketing and communications activities include, but are not limited to: managing fashiondistrict.org, managing social media profiles, publishing monthly newsletters and quarterly reports, and producing annual reports.
POLICY -- The Policy department focuses on monitoring, researching, and reviewing State and Local municipal legislation, initiatives, and programs that may impact the Fashion District community.
DEAN NUCICH
Urban Offerings
DIANE H. PAPPAS
J&E Solutions, LLC
LAURIE ROSEN
Academy Award Clothes
LAURIE SALE
SCS Building Fund, LLC
KAYHAN SHAKIB
Raha Lakes Enterprises, LLC
BRIAN TABAN
JADE Enterprises
SUZETTE WACHTEL
KMW Enterprise, LLC
The LA Fashion District BID is 1 of 9 BIDs in Downtown LA and 1 of over 40 BIDs in the City of Los Angeles. A binding assessment levied on property owners funds BID activities, and a 15-member Board of Directors elected by district property owners oversees the organization.
To learn more about the LA Fashion District BID, please visit fashiondistrict.org.

Our Clean & Safe Team has had an exceptional third quarter, diligently working to maintain a clean, safe, and welcoming environment for everyone in the LA Fashion District.
The Safe Team continued to go above and beyond their daily responsibilities, swiftly responding to incidents and ensuring the wellbeing of our community. From quickly addressing fires to assisting individuals in potentially hazardous situations, their commitment to safety is evident every day as they patrol the district and respond to various calls for service.
Meanwhile, our Clean Team made a noticeable impact on the streets, performing detailed pressure washing at key locations, including 11th & Main and 12th & Main, where they focused on removing graffiti and other debris. Their efforts ensure that our district remains vibrant and inviting for residents, businesses, and visitors alike.
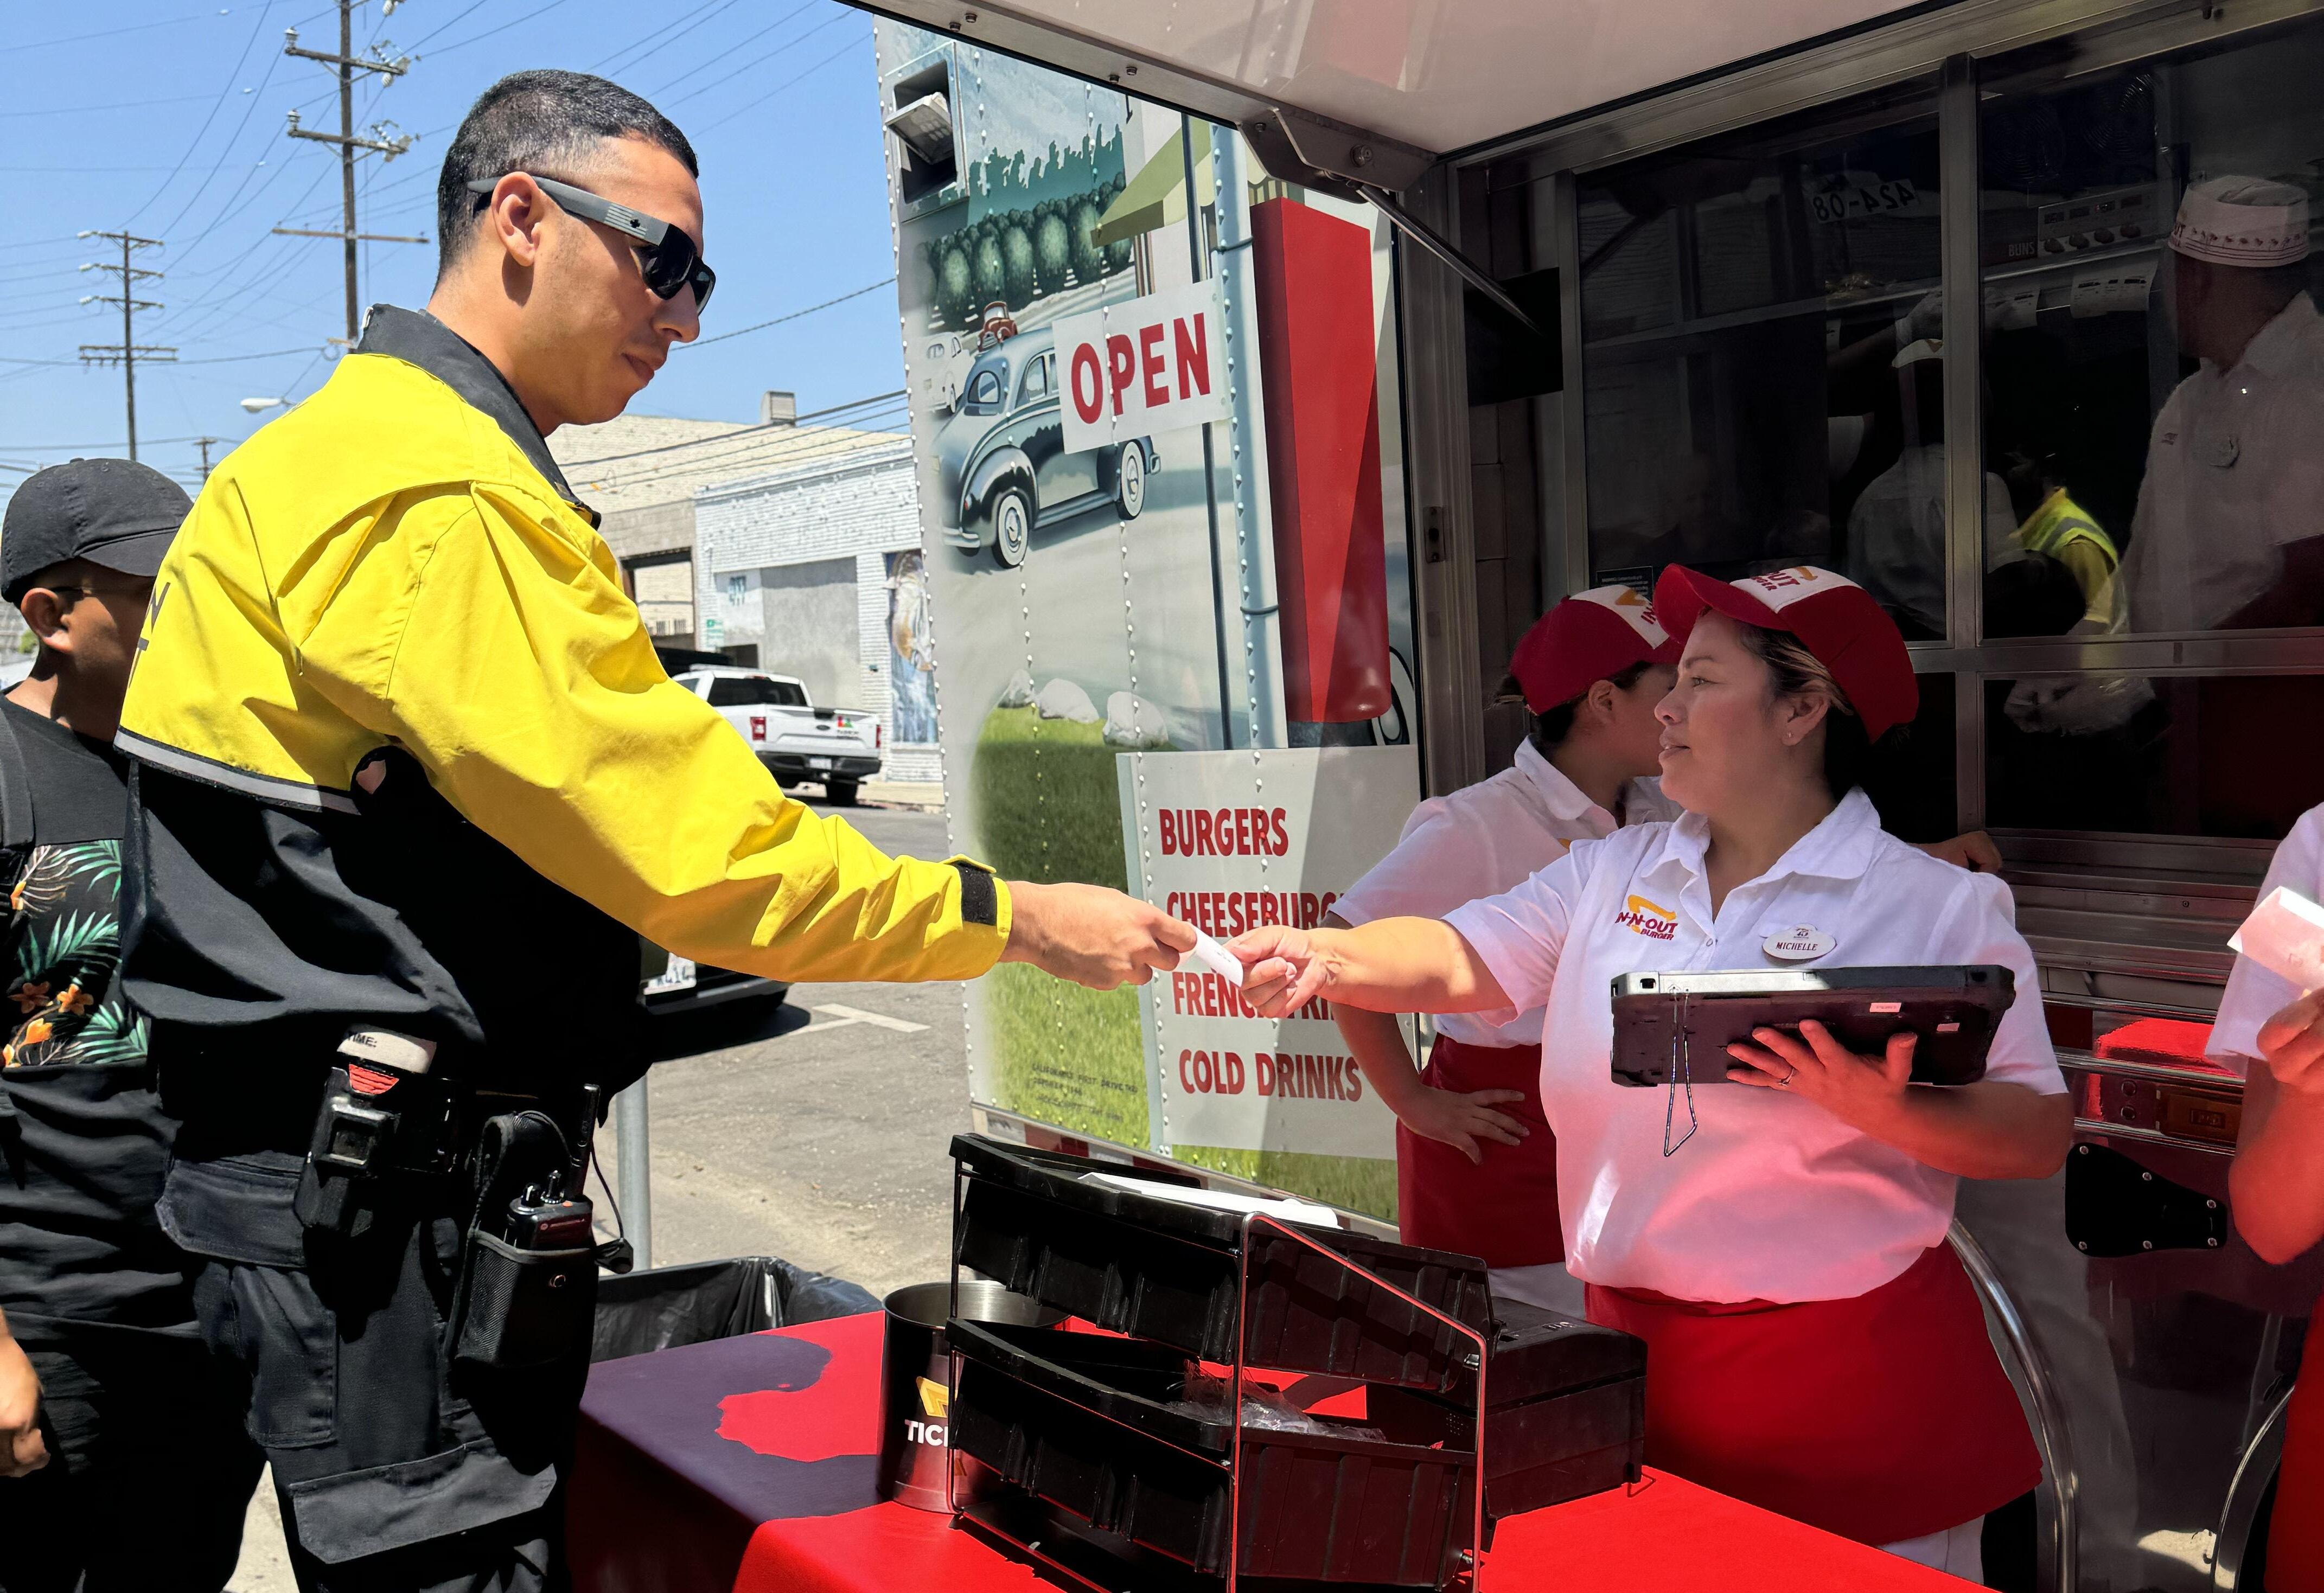
In August, we hosted our annual Clean & Safe Team Appreciation Luncheon to honor the dedication and hard work of our team. With the In-N-Out truck brought to the Field Office, our Clean & Safe Team, along with fellow law enforcement partners, enjoyed a well-deserved meal together as a token of our appreciation for their tireless commitment to keeping the district clean and secure.
Every month, the Clean & Safe Team works tirelessly to uphold the standards that make the Fashion District a unique and enjoyable destination. For a closer look at their outstanding work, please refer to the detailed statistics in the next section of this report.
To stay informed about all the initiatives and achievements of our teams, we invite stakeholders to sign up for our monthly “Updates from the BID” newsletter at fashiondistrict.org/subscribe



13,531

MERCHANT CONTACTS
(check in with merchants to see if they have any questions and/or problems)
119

ROBERRY/ VANDALISM
(responding to calls about robberies or vandalism to property)

2,517 GRAFFITI ABATEMENT
(labor assistance to remove graffiti)
278

FECES CLEANED
(removal and cleanup of feces on sidewalks or curb lines)
499

278 WELFARE CHECKS
(checking on a person who appears to be sick or injured)
1,095


CITIZEN ASSISTS
(provide directions, answer questions, or help look for lost vehicles)
36,947

LOCATION CHECKS
(checking the area, showing their presence, reporting any crime)
449

TRESPASSING
(responding to calls about individuals not authorized to be on a property)
DISORDERLY CONDUCT
(responding to calls about disturbing the peace)
48 FIRES
(responding to calls for encampment, property, or trash fires)
5,531,730

SQ. FT. PRESSURE WASHED
(equivalent to about 7 Crypto.com Arenas)
132

SYRINGES DISPOSED OF
(number of syringes collected and disposed of)
656

TONS OF TRASH COLLECTED
(equivalent to the weight of 5 antarctic blue whales)
106 WEED ABATEMENT

(trims or cuts of overgrown weeds or grass on sidewalks)
1,544

DRINKING IN PUBLIC (contact with people who are publicly intoxicated)
150

TRASH CANS MAINTAINED
(fix or restore damaged trash cans)
41

BULKY ITEMS REMOVED
(illegally dumped items like couches, mattresses, etc.)
Here, we highlight the remarkable efforts of our Clean & Safe Team, showcasing their dedication to maintaining a clean, safe, and vibrant LA Fashion District through impressive statistics and achievements.

70,164
Total Calls for Service
-17,973
Difference from Q2
14,850 Clean Team Calls
54,605 Safe Team Calls

thursday Busiest Day of the Week
7/8/24
Busiest Date of the Quarter
Conducted monthly by our dedicated Safe Team Officers, the count occurs consistently on the same day at the same time, allowing for accurate and reliable data collection. With this, we aim to track trends, identify areas of concern, and implement targeted strategies to support individuals experiencing homelessness within our community.

514
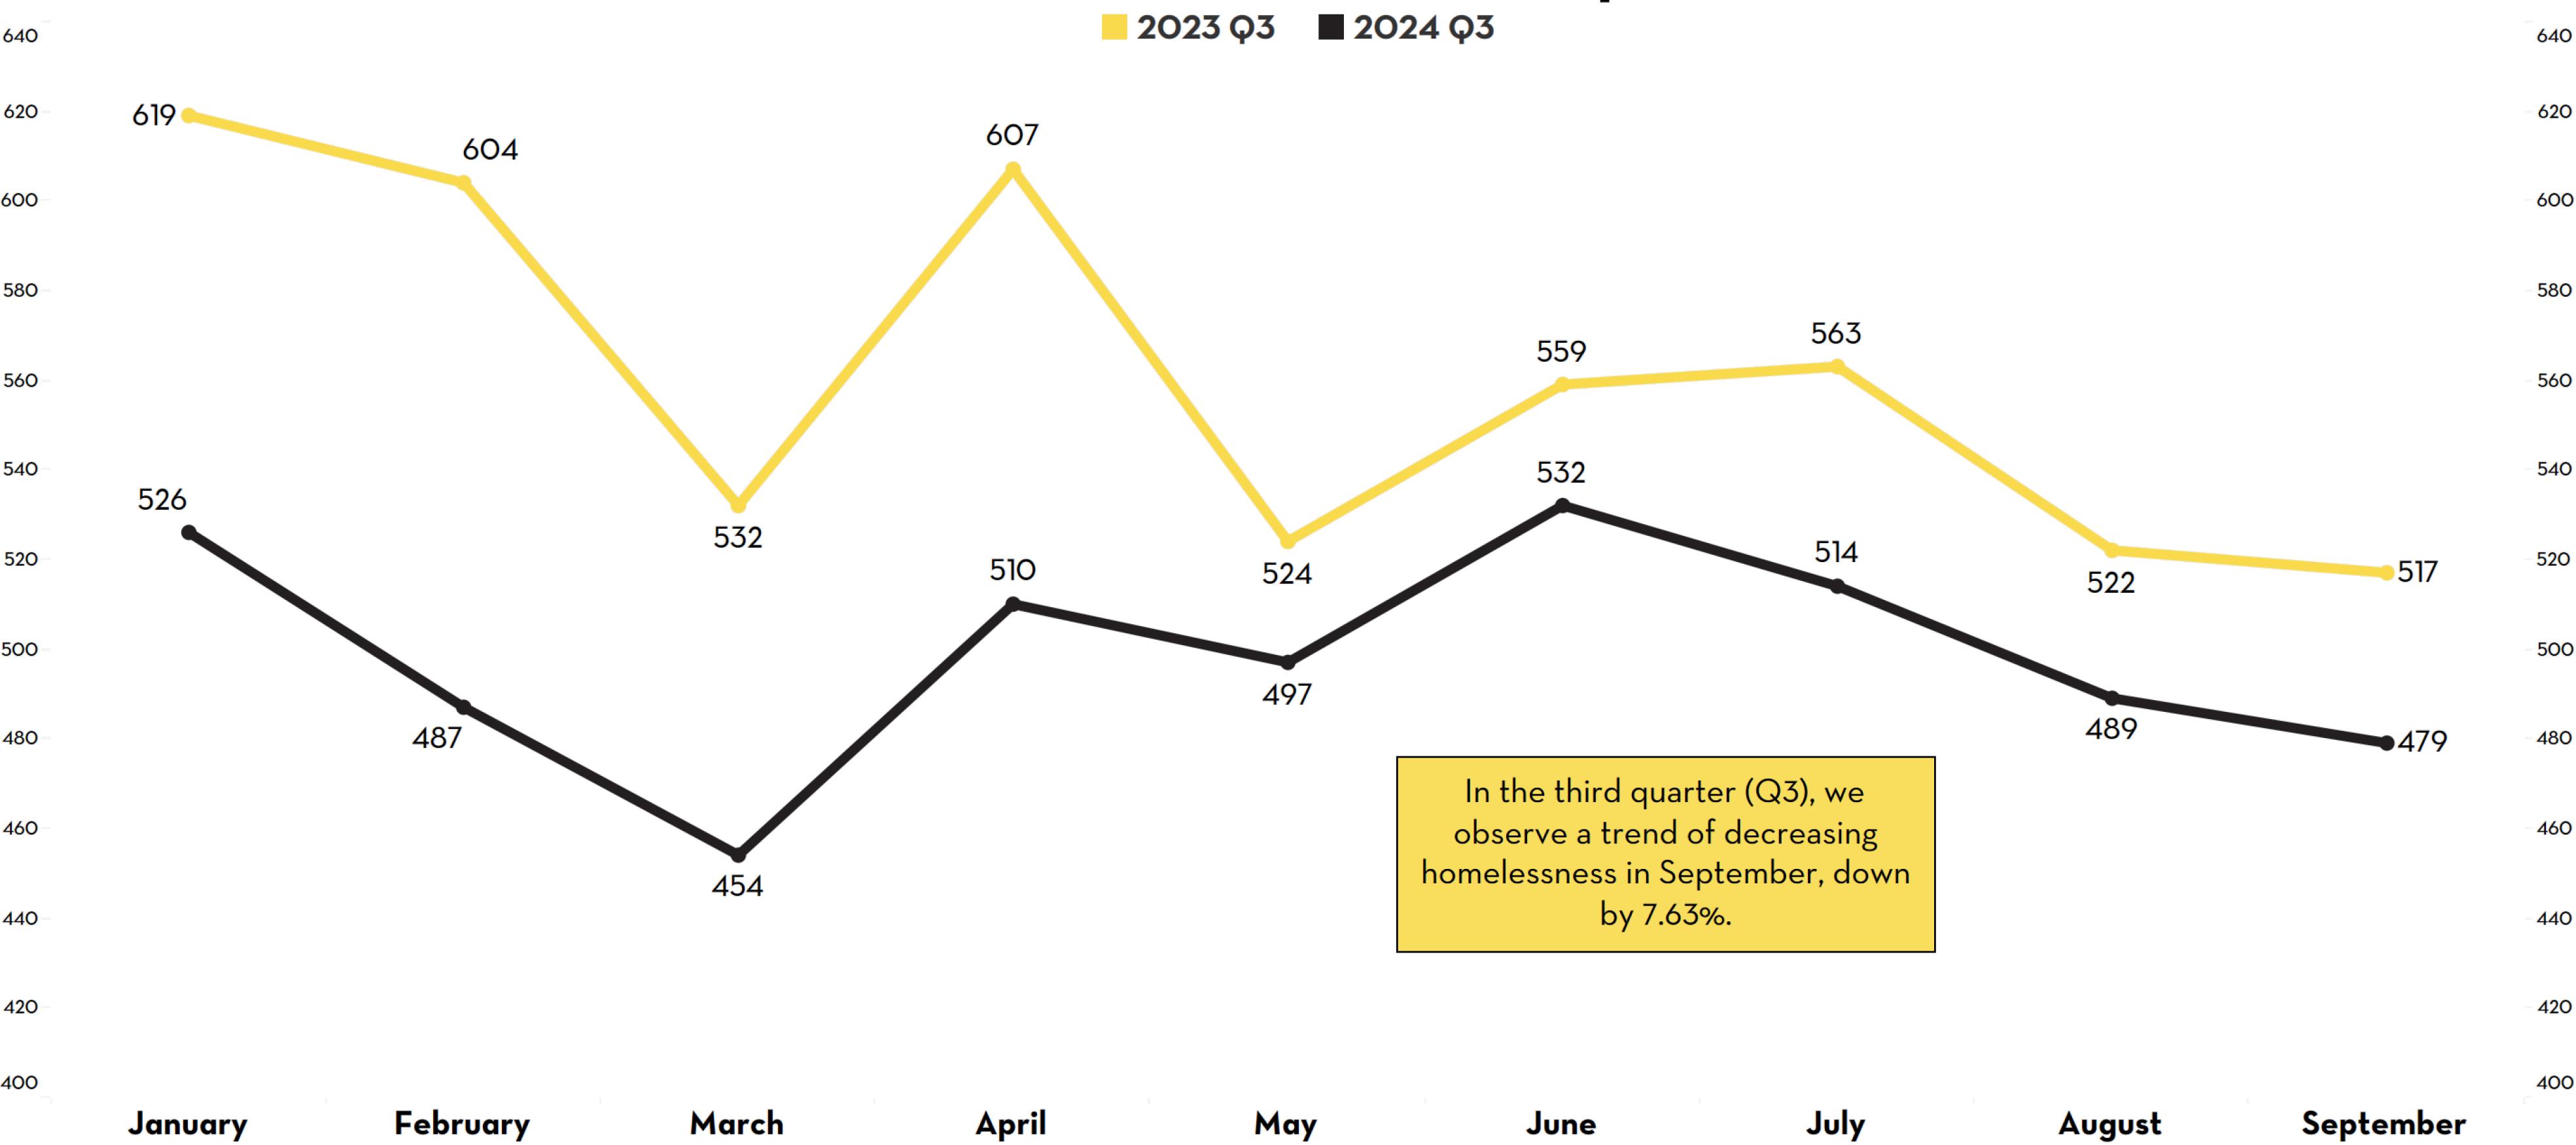
479


This quarter has been a dynamic period for the Marketing & Communications team, as we continue to amplify the visibility and reach of the LA Fashion District.
One of our major accomplishments was the launch of a new Venue Space Directory, providing a valuable resource for event planners, businesses, and community members looking for unique locations within the district. Additionally, our social media presence reached a new milestone, with our Instagram account hitting an impressive 91,000 followers, underscoring the growing interest and engagement in our community.
Our “Discover the LA Fashion District” video series, aimed at showcasing the diversity and vibrancy of the district, was published across social media platforms, receiving positive feedback and further elevating the district’s brand. We also invested significant effort in planning and coordinating our Dia de los Muertos Community Altar & Celebration, which promises to be a meaningful and culturally rich event for our community. In addition, the team successfully managed the coordination of the 2024 Board of Directors Elections process, ensuring a smooth and transparent experience for all stakeholders involved.
Social media engagement and reach saw a noticeable increase across Instagram and Facebook, with particular growth in our TikTok presence as well. Our expanding digital footprint allows us to connect with a broader audience and keep the Fashion District top of mind. Each of these initiatives has been part of our ongoing commitment to celebrate, support, and share the unique offerings of the LA Fashion District.
Our ongoing efforts to boost stakeholder and community engagement remained a top priority, with continued outreach and collaboration initiatives. We are excited to build upon these achievements and further amplify our impact in the coming quarters.


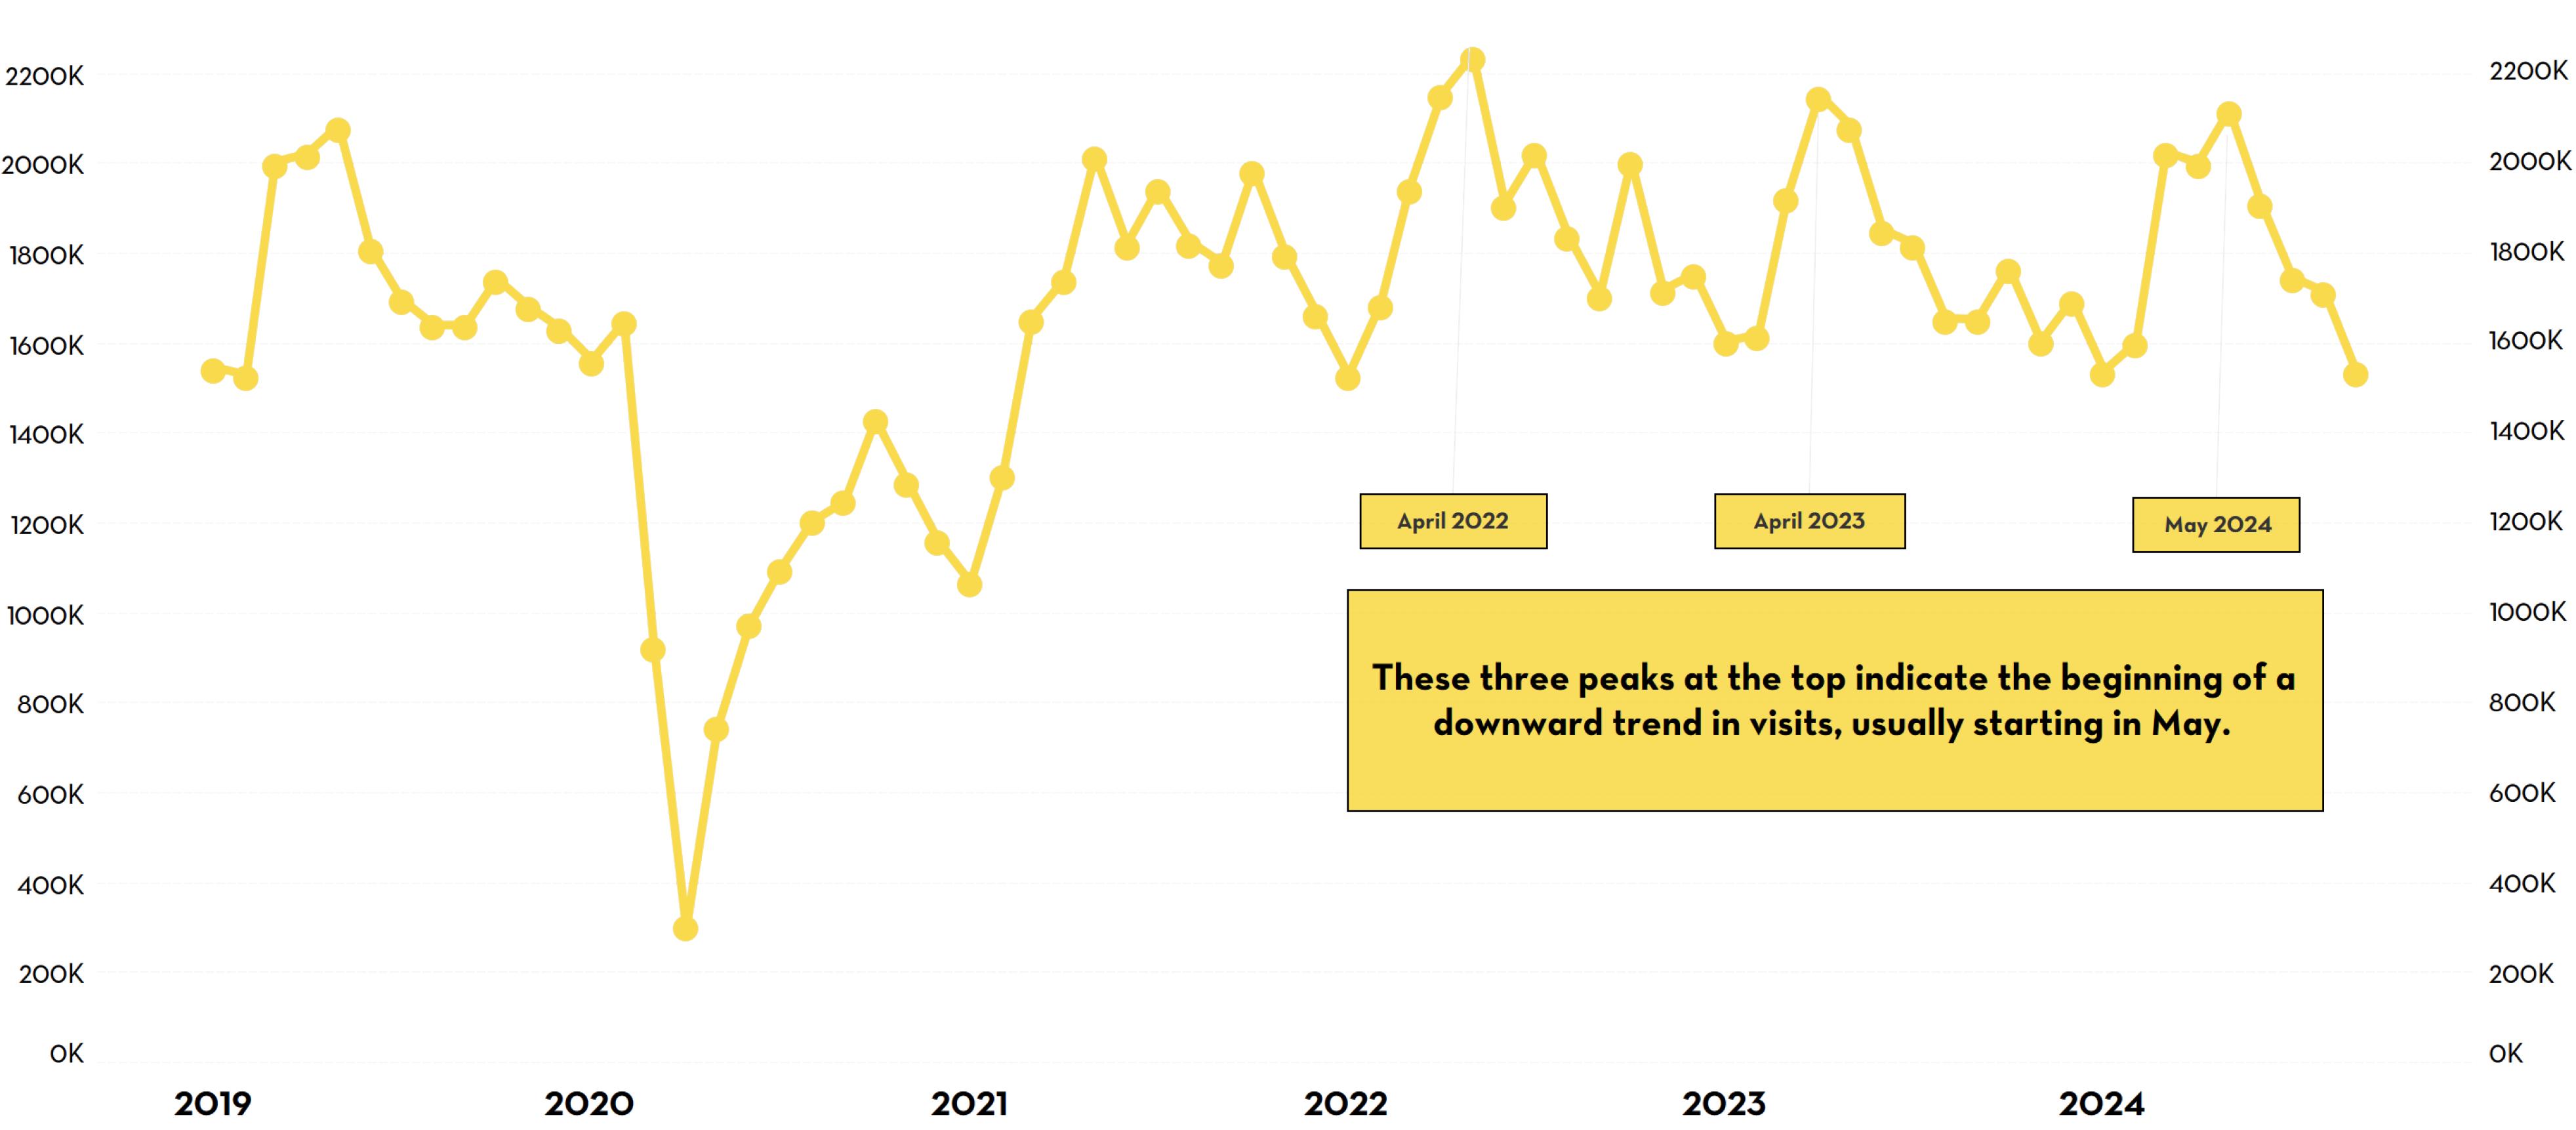
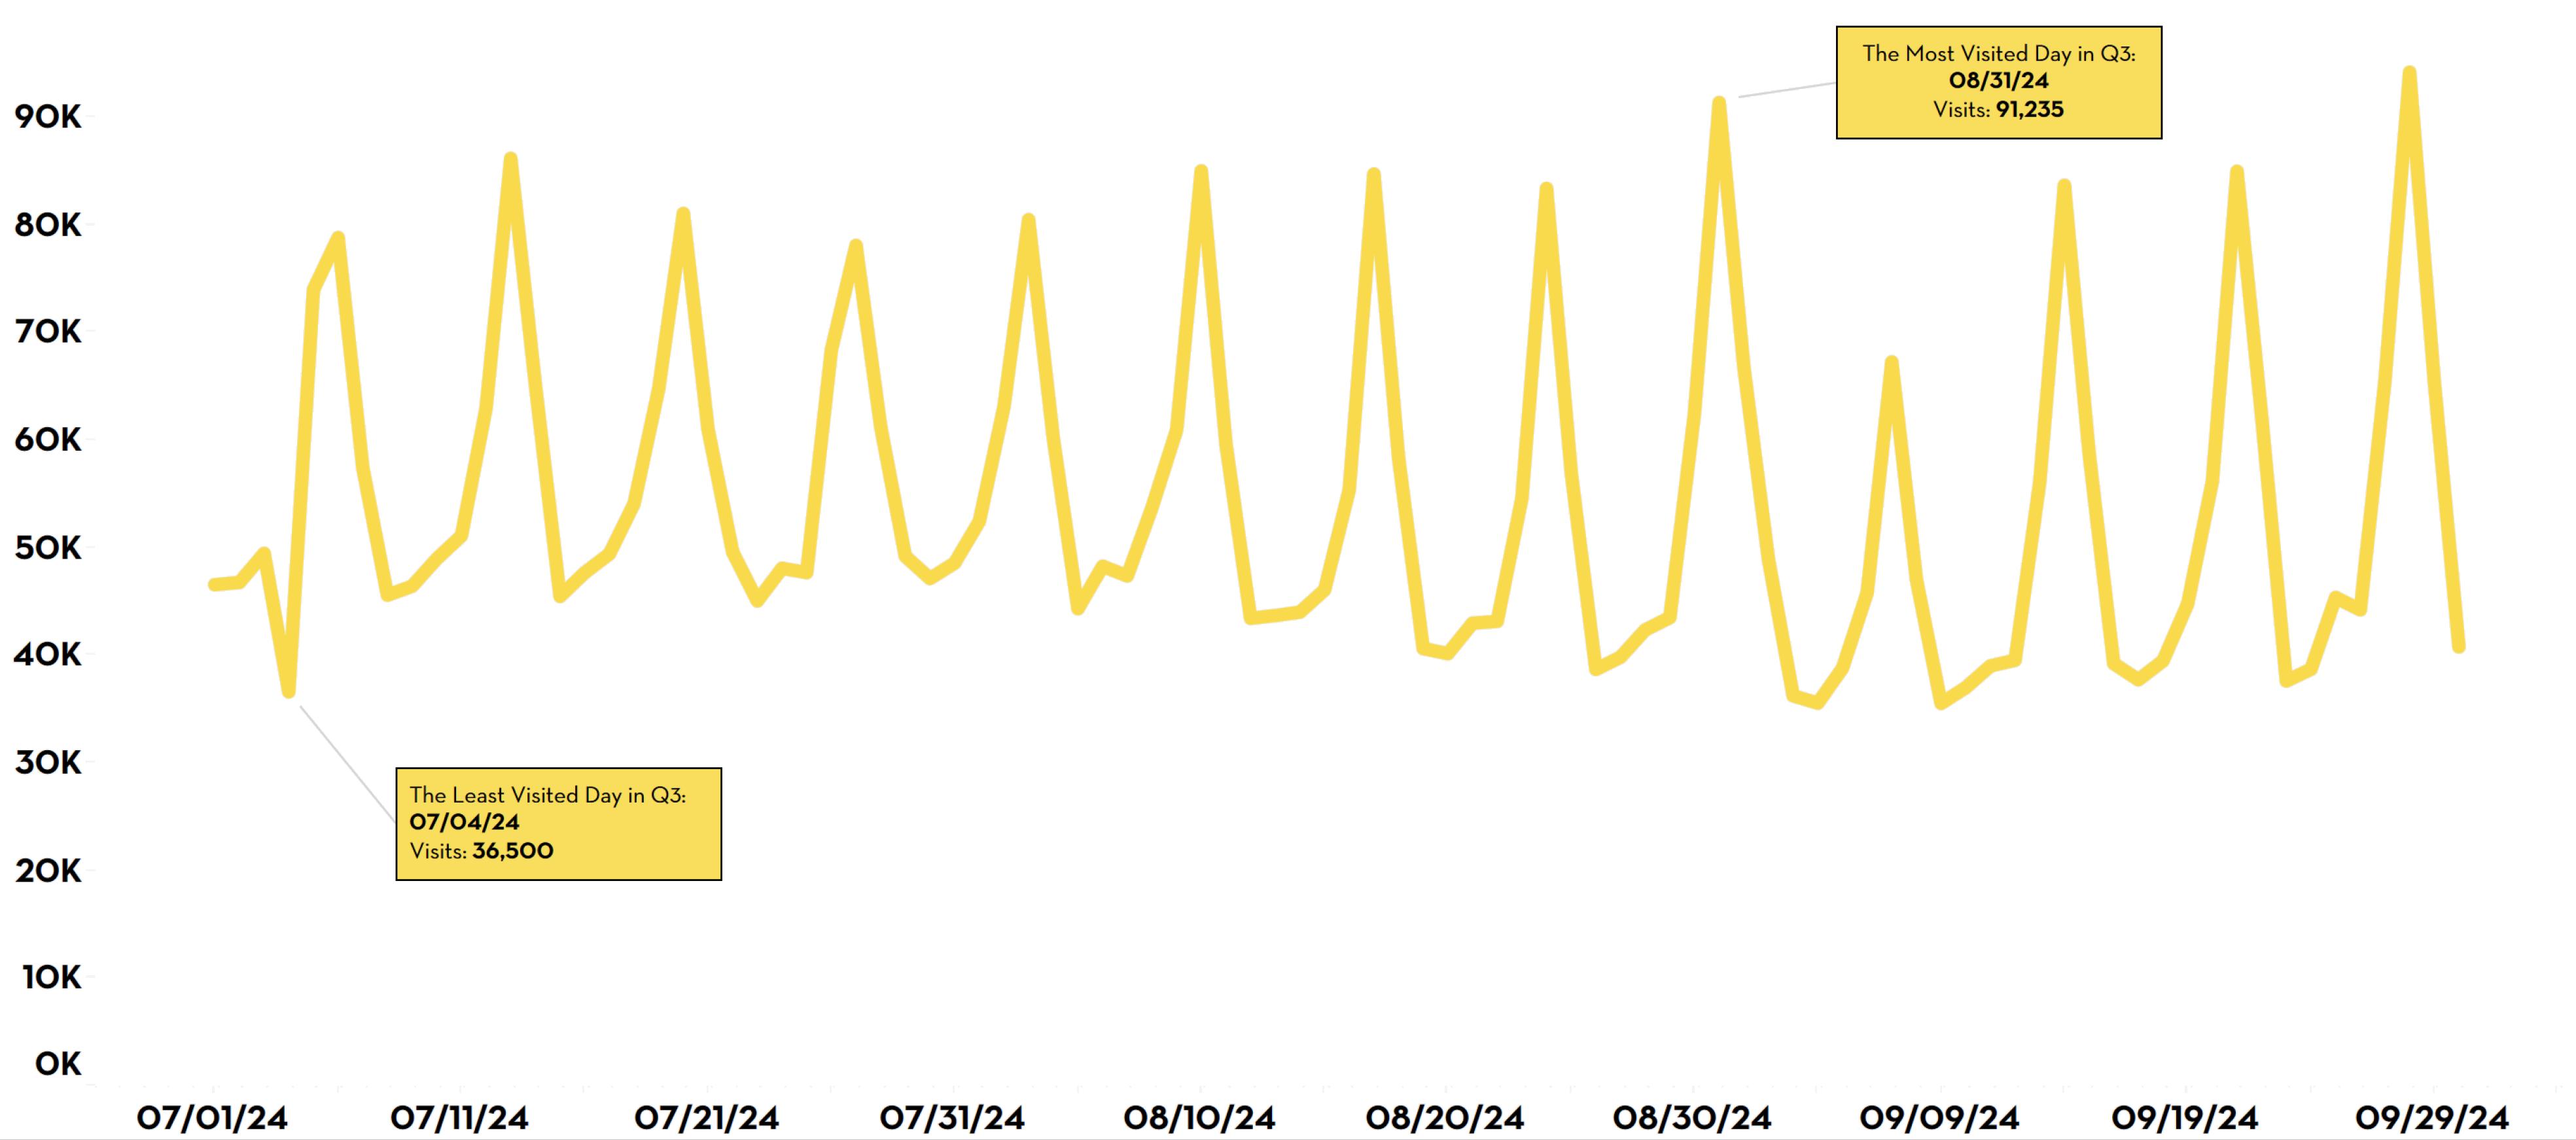
In the third quarter of 2024, we observed a 1.61% decrease in visitor counts compared to Q3 of 2023. This variation in visits can be attributed to a range of external factors, including broader economic conditions, the ongoing shift towards online shopping, seasonal events, and even weather patterns. This fluctuation falls within expected trends and aligns with previous seasonal data we’ve observed.
As we look ahead, historical data indicates that we can expect a seasonal dip in visits in January 2025, followed by steady growth, with peak visitation likely occurring in the spring months of April and May.
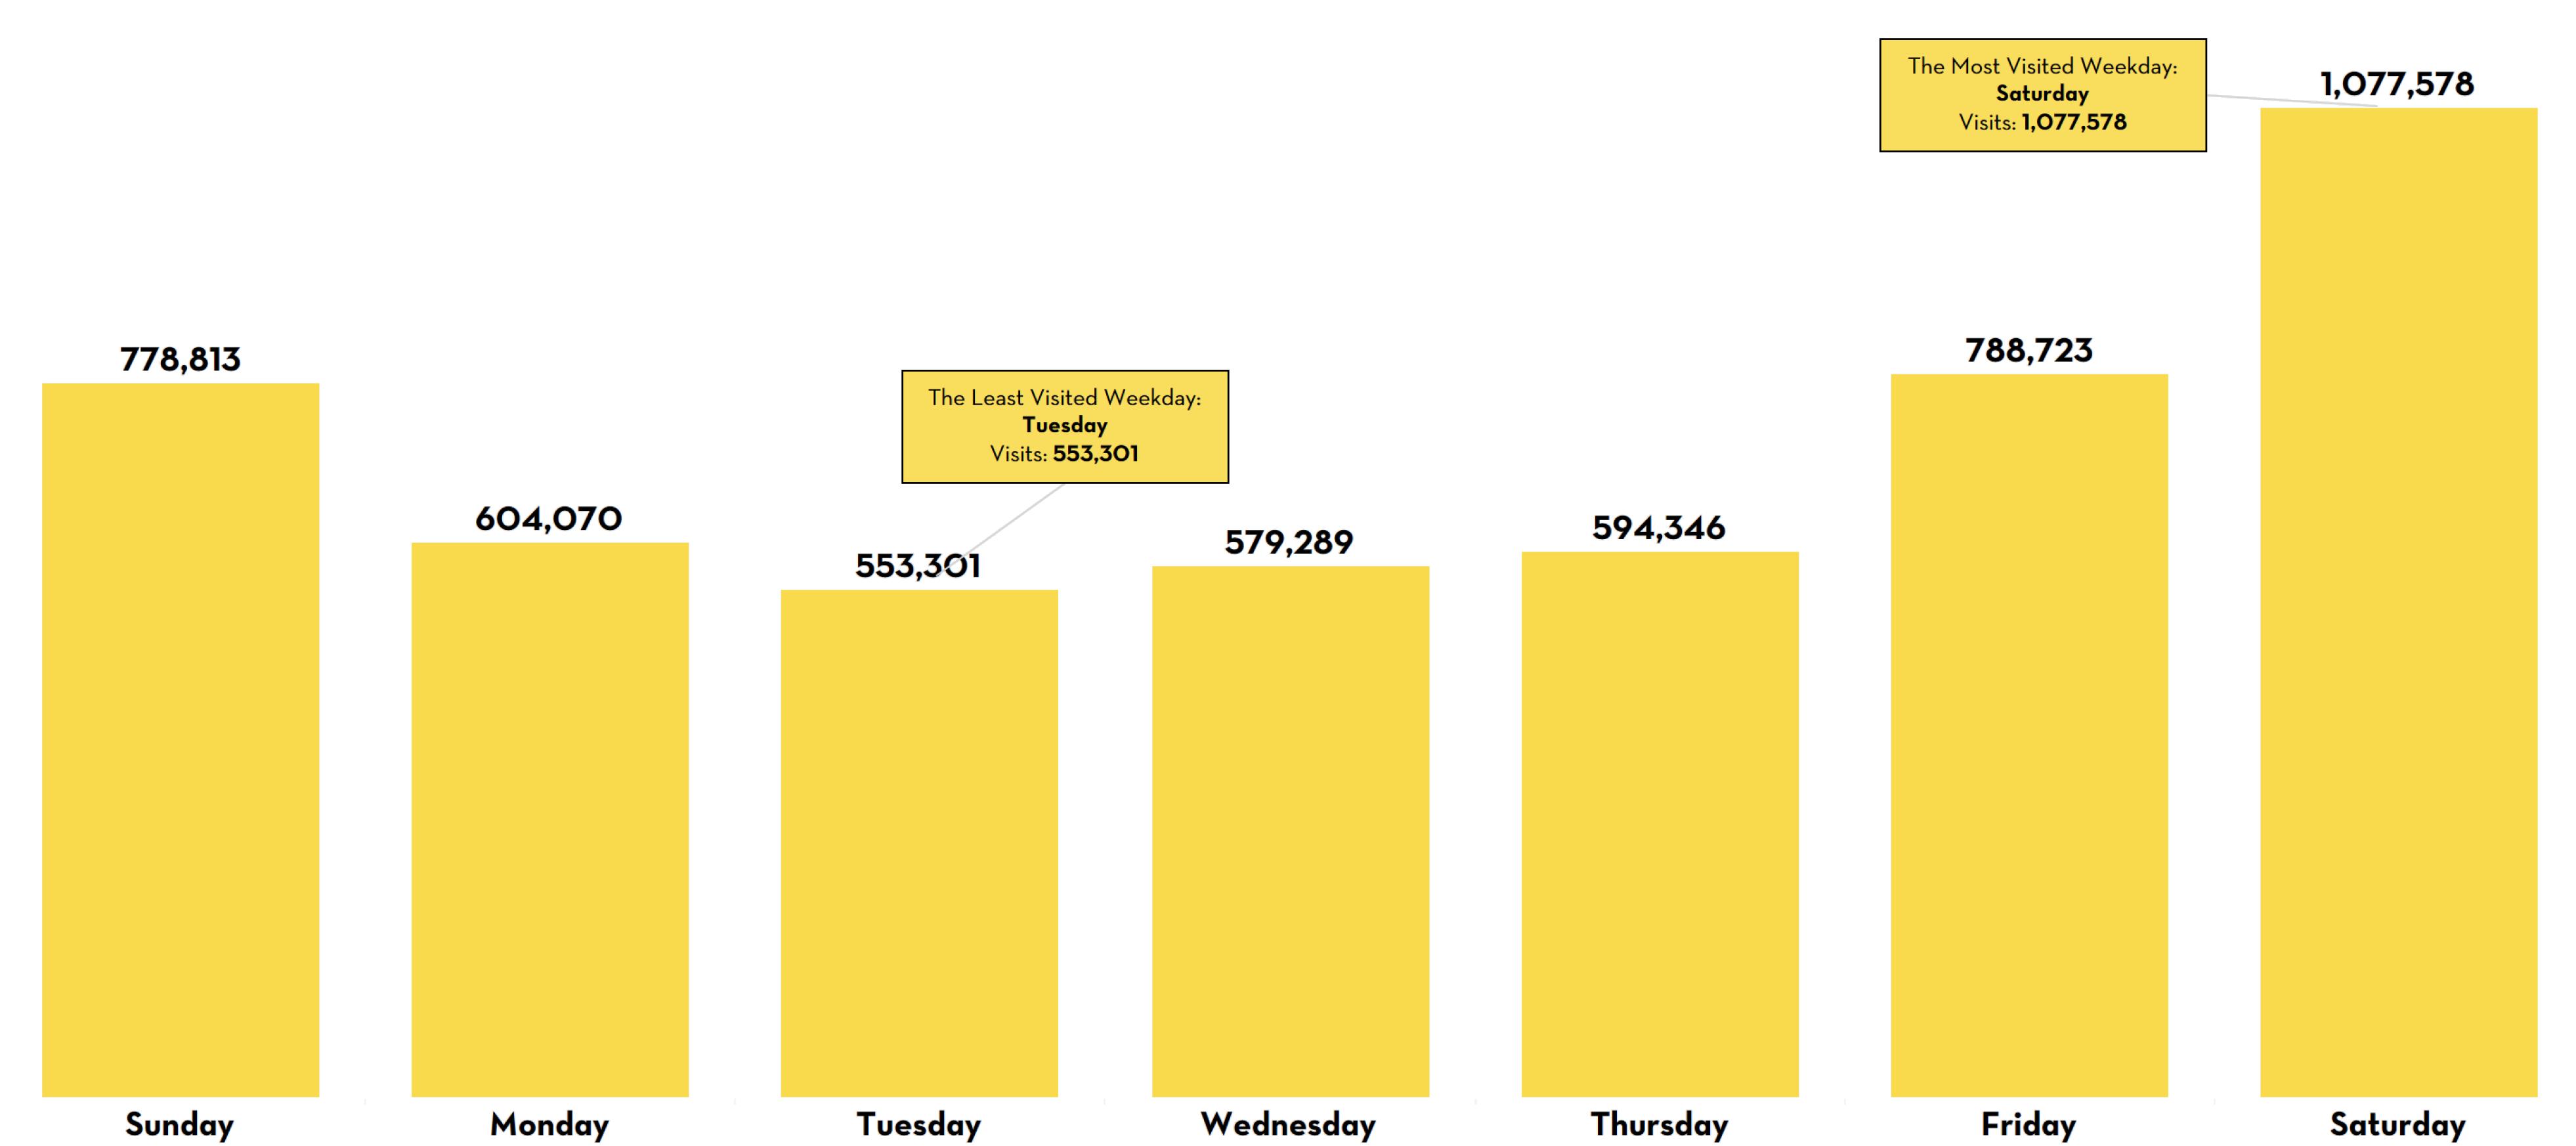
Our data also highlights that Saturdays continue to be the busiest day in the district, with 1,077,577 visits recorded in Q3, almost double the visitation on Tuesdays, which saw 553,299 visits. The peak visitation hour remains at 12 pm, during which we recorded 1,526,612 visits throughout the quarter. The average visit duration is over 10 minutes, with an average stay time of 112 minutes per visitor, and a median stay of 54 minutes, indicating that most visitors come, attend to their needs, and leave within this timeframe.
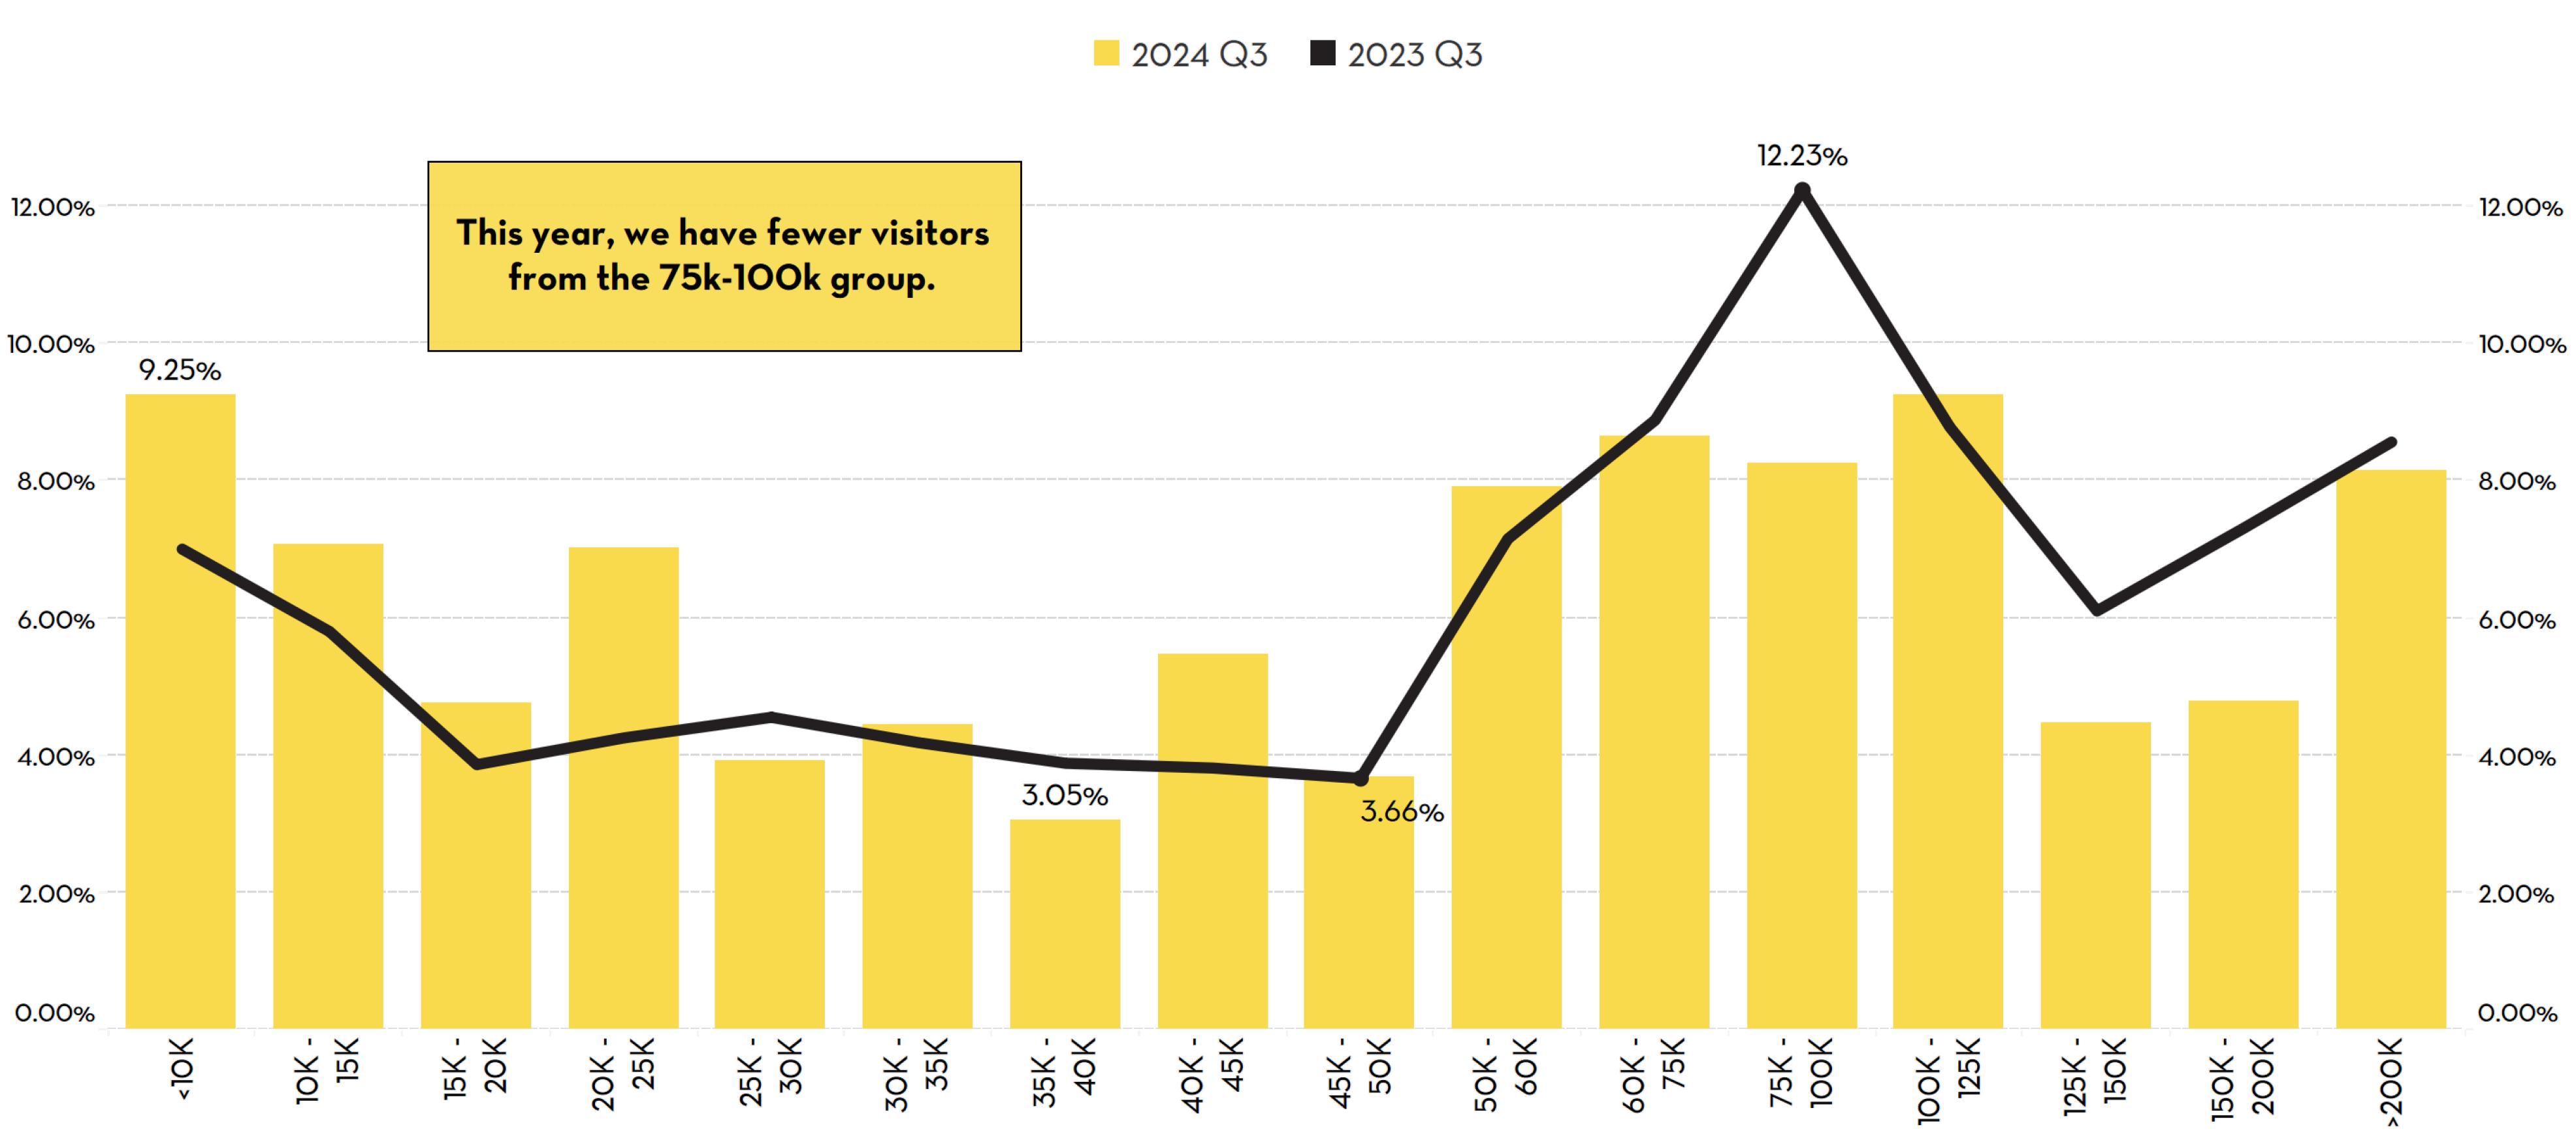
Visitor demographics remain strong, with the most frequent income category for visitors falling within the $75,000–$100,000 annual income range, comprising 12% of total visitors. The average visitor income is $68,812, while the median stands at $47,874, which is above the average income level in Los Angeles (estimated at $35,000–$40,000 by the U.S. Bureau of Statistics).
In terms of ethnicity, the largest group represented among our visitors is Hispanic or Latino, accounting for 62% of our Q3 visitors, totaling 1,627,457 individuals.
Loyalty metrics remain positive, with a visit frequency ratio of 1.97. This suggests strong visitor retention, indicating that a significant number of individuals return to the Fashion District frequently over a three-month period
Monthly comparisons within Q3 show varied patterns: while July saw a slight decrease with 57,907 fewer visits (-3.2%) and September dropped by 101,585 visits (-6.2%), August experienced a notable increase, growing by 77,929 visits (+4.7%) compared to the previous year. Visitor numbers are influenced by numerous factors, including economic shifts, weather conditions, and even crime rates, although it’s worth noting that crime trends in the district have shown a recent decline.
This data provides valuable insights as we continue our efforts to foster a vibrant, welcoming environment within our community.
Insights and visitor demographics provided in this report were aggregated using datasets from the start of July 2024 to the end of September this year and are benchmarked against quarter - 3 of 2023 to provide a look at Year-over-Year changes that have taken place.
4.9M Visits saturday
2.5m Unique Visitors

1.97 Visit Freq.


Most Visited Day 12 pm
Most Visited Hour of Day
112 min Avg. TimeDwell Q3 2024 KEY INSIGHTS
-1.61% in visits compared to Q3 2023
5.1M Visits
Q3

1.93 Visit Freq.

2.7M Unique Visitors

115 min Avg. TimeDwell

$47K Median Income hispanic 75k-100k
Typical Visitor Profile



VISIT DURATION IN MINUTES

Visitor Journey looks into the familiar places visitors originate from and the places they head to after leaving the district. Visitor Routes provide insights into the typical roads visitors take to and from the district. By comparing Visitor Journey to the Visitor Routes, you are able to look into the commercial activity that takes place to and from the point of interest.


ROW DTLA (777 S Alameda St)
McDonald’s (201 W Washington Blvd)
Int. Packing Express (1042 Stanford Ave)
King Taco (1951 S San Pedro St)
Los Angeles Trade-Tech (400 W Washington)
King Taco (1951 S San Pedro St)
ROW DTLA (777 S Alameda St)
McDonald’s (201 W Washington Blvd)
Jack’s Candy (777 S Central Ave)
St. Vincent Court (650 S Hill St)
818 S. Broadway St. #801
Los Angeles, CA 90014
6.01m

DISTRICT OVERVIEW - VISITATION METRICS
Learn all about the visitators coming to our District.
MARKETING HIGHLIGHTS
Our Instagram account hit 91K followers during this quarter.
YOUR OPS TEAM AT WORK
Don’t miss out on our monthly “Updates from the BID,” featuring Clean & Safe highlights and statistics.
