
DataScienceWorkflowManagement
IbonMartínez-Arranz


IbonMartínez-Arranz
Inrecentyears,theamountofdatageneratedbybusinesses,organizations,andindividualshas increasedexponentially.WiththeriseoftheInternet,mobiledevices,andsocialmedia,wearenow generatingmoredatathaneverbefore.Thisdatacanbeincrediblyvaluable,providinginsightsthat caninformdecision-making,improveprocesses,anddriveinnovation.However,thesheervolume andcomplexityofthisdataalsopresentsignificantchallenges.

Inthepastfewyears,therehasbeenasignificantsurgeinthevolumeofdataproducedbycompanies, institutions,andindividuals.TheproliferationoftheInternet,mobiledevices,andsocialmediahas ledtoasituationwherewearecurrentlygeneratingmoredatathanatanyothertimeinhistory.Image generatedwithDALL-E.
Datasciencehasemergedasadisciplinethathelpsusmakesenseofthisdata.Itinvolvesusing statisticalandcomputationaltechniquestoextractinsightsfromdataandcommunicatetheminaway thatisactionableandrelevant.Withtheincreasingavailabilityofpowerfulcomputersandso ware
tools,datasciencehasbecomeanessentialpartofmanyindustries,fromfinanceandhealthcareto marketingandmanufacturing.
However,datascienceisnotjustaboutapplyingalgorithmsandmodelstodata.Italsoinvolvesa complexando eniterativeprocessofdataacquisition,cleaning,exploration,modeling,andimplementation.Thisprocessiscommonlyknownasthedatascienceworkflow.
Managingthedatascienceworkflowcanbeachallengingtask.Itrequirescoordinatingthee ortsof multipleteammembers,integratingvarioustoolsandtechnologies,andensuringthattheworkflow iswell-documented,reproducible,andscalable.Thisiswheredatascienceworkflowmanagement comesin.
Datascienceworkflowmanagementisespeciallyimportantintheeraofbigdata.Aswecontinueto collectandanalyzeever-largeramountsofdata,itbecomesincreasinglyimportanttohaverobust mathematicalandstatisticalknowledgetoanalyzeite ectively.Furthermore,astheimportanceof data-drivendecisionmakingcontinuestogrow,itiscriticalthatdatascientistsandotherprofessionals involvedinthedatascienceworkflowhavethetoolsandtechniquesneededtomanagethisprocess e ectively.
Toachievethesegoals,datascienceworkflowmanagementreliesonacombinationofbestpractices, tools,andtechnologies.SomepopulartoolsfordatascienceworkflowmanagementincludeJupyter Notebooks,GitHub,Docker,andvariousprojectmanagementtools.
Datascienceworkflowmanagementisthepracticeoforganizingandcoordinatingthevarioustasks andactivitiesinvolvedinthedatascienceworkflow.Itencompasseseverythingfromdatacollection andcleaningtoanalysis,modeling,andimplementation.E ectivedatascienceworkflowmanagement requiresadeepunderstandingofthedatascienceprocess,aswellasthetoolsandtechnologiesused tosupportit.
Atitscore,datascienceworkflowmanagementisaboutmakingthedatascienceworkflowmore e icient,e ective,andreproducible.Thiscaninvolvecreatingstandardizedprocessesandprotocols fordatacollection,cleaning,andanalysis;implementingqualitycontrolmeasurestoensuredata accuracyandconsistency;andutilizingtoolsandtechnologiesthatmakeiteasiertocollaborateand communicatewithotherteammembers.
Oneofthekeychallengesofdatascienceworkflowmanagementisensuringthattheworkflowis well-documentedandreproducible.Thisinvolveskeepingdetailedrecordsofallthestepstakeninthe datascienceprocess,fromthedatasourcesusedtothemodelsandalgorithmsapplied.Bydoingso,it becomeseasiertoreproducetheresultsoftheanalysisandverifytheaccuracyofthefindings.
Anotherimportantaspectofdatascienceworkflowmanagementisensuringthattheworkflowis scalable.Astheamountofdatabeinganalyzedgrows,itbecomesincreasinglyimportanttohavea workflowthatcanhandlelargevolumesofdatawithoutsacrificingperformance.Thismayinvolve usingdistributedcomputingframeworkslikeApacheHadooporApacheSpark,orutilizingcloud-based dataprocessingserviceslikeAmazonWebServices(AWS)orGoogleCloudPlatform(GCP).
E ectivedatascienceworkflowmanagementalsorequiresastrongunderstandingofthevarioustools andtechnologiesusedtosupportthedatascienceprocess.Thismayincludeprogramminglanguages likePythonandR,statisticalso warepackageslikeSASandSPSS,anddatavisualizationtoolslike TableauandPowerBI.Inaddition,datascienceworkflowmanagementmayinvolveusingproject managementtoolslikeJIRAorAsanatocoordinatethee ortsofmultipleteammembers.
Overall,datascienceworkflowmanagementisanessentialaspectofmoderndatascience.Byimplementingbestpracticesandutilizingtherighttoolsandtechnologies,datascientistsandother professionalsinvolvedinthedatascienceprocesscanensurethattheirworkflowsaree icient,e ective,andscalable.This,inturn,canleadtomoreaccurateandactionableinsightsthatdriveinnovation andimprovedecision-makingacrossawiderangeofindustriesanddomains.
E ectivedatascienceworkflowmanagementiscriticaltothesuccessofanydatascienceproject.By organizingandcoordinatingthevarioustasksandactivitiesinvolvedinthedatascienceprocess,data scienceworkflowmanagementhelpsensurethatprojectsarecompletedontime,withinbudget,and withhighlevelsofaccuracyandreproducibility.
Oneofthekeybenefitsofdatascienceworkflowmanagementisthatitpromotesamorestructured, methodologicalapproachtodatascience.Bybreakingdownthedatascienceprocessintodiscrete stepsandtasks,datascienceworkflowmanagementmakesiteasiertomanagecomplexprojects andidentifypotentialbottlenecksorareaswhereimprovementscanbemade.This,inturn,canhelp ensurethatdatascienceprojectsarecompletedmoree icientlyandwithgreaterlevelsofaccuracy.
Anotherimportantbenefitofdatascienceworkflowmanagementisthatitcanhelpensurethatthe resultsofdatascienceprojectsaremorereproducible.Bykeepingdetailedrecordsofallthesteps takeninthedatascienceprocess,datascienceworkflowmanagementmakesiteasiertoreplicatethe resultsofanalysesandverifytheiraccuracy.Thisisparticularlyimportantinfieldswhereaccuracyand reproducibilityareessential,suchasscientificresearchandfinancialmodeling.
Inadditiontothesebenefits,e ectivedatascienceworkflowmanagementcanalsoleadtomore e ectivecollaborationandcommunicationamongteammembers.Byutilizingprojectmanagement toolsandotherso waredesignedfordatascienceworkflowmanagement,teammemberscanwork
IbonMartínez-ArranzPage5
togethermoree icientlyande ectively,sharingdata,insights,andfeedbackinreal-time.Thiscan helpensurethatprojectsstayontrackandthateveryoneinvolvedisworkingtowardthesamegoals.
Thereareanumberofso waretoolsavailablefordatascienceworkflowmanagement,including popularplatformslikeJupyterNotebooks,ApacheAirflow,andApacheNiFi.Eachoftheseplatforms o ersauniquesetoffeaturesandcapabilitiesdesignedtosupportdi erentaspectsofthedatascience workflow,fromdatacleaningandpreparationtomodeltraininganddeployment.Byleveragingthese tools,datascientistsandotherprofessionalsinvolvedinthedatascienceprocesscanworkmore e icientlyande ectively,improvingthequalityandaccuracyoftheirwork.
Overall,datascienceworkflowmanagementisanessentialaspectofmoderndatascience.Bypromotingamorestructured,methodologicalapproachtodatascienceandleveragingtherighttools andtechnologies,datascientistsandotherprofessionalsinvolvedinthedatascienceprocesscan ensurethattheirprojectsarecompletedontime,withinbudget,andwithhighlevelsofaccuracyand reproducibility.
• Peng,R.D.(2016).Rprogrammingfordatascience.Availableathttps://bookdown.org/rdpeng/ rprogdatascience/
• Wickham,H.,&Grolemund,G.(2017).Rfordatascience:import,tidy,transform,visualize,and modeldata.Availableathttps://r4ds.had.co.nz/
• Géron,A.(2019).Hands-onmachinelearningwithScikit-Learn,Keras,andTensorFlow:Concepts, tools,andtechniquestobuildintelligentsystems.Availableathttps://www.oreilly.com/library/ view/hands-on-machine-learning/9781492032632/
• Shrestha,S.(2020).DataScienceWorkflowManagement:FromBasicstoDeployment.Available athttps://www.springer.com/gp/book/9783030495362
• Grollman,D.,&Spencer,B.(2018).Datascienceprojectmanagement:fromconceptionto deployment.Apress.
• Kelleher,J.D.,Tierney,B.,&Tierney,B.(2018).DatascienceinR:acasestudiesapproachto computationalreasoningandproblemsolving.CRCPress.
• VanderPlas,J.(2016).Pythondatasciencehandbook:Essentialtoolsforworkingwithdata. O’ReillyMedia,Inc.
• Kluyver,T.,Ragan-Kelley,B.,Pérez,F.,Granger,B.,Bussonnier,M.,Frederic,J.,...&Ivanov, P.(2016).JupyterNotebooks-apublishingformatforreproduciblecomputationalworkflows. PositioningandPowerinAcademicPublishing:Players,AgentsandAgendas,87.
• Pérez,F.,&Granger,B.E.(2007).IPython:asystemforinteractivescientificcomputing.ComputinginScience&Engineering,9(3),21-29.
• Rule,A.,Tabard-Cossa,V.,&Burke,D.T.(2018).Opensciencegoesmicroscopic:anapproachto knowledgesharinginneuroscience.ScientificData,5(1),180268.
• Shen,H.(2014).Interactivenotebooks:Sharingthecode.Nature,515(7525),151-152.
Datascienceisaninterdisciplinaryfieldthatcombinestechniquesfromstatistics,mathematics,and computersciencetoextractknowledgeandinsightsfromdata.Theriseofbigdataandtheincreasing complexityofmodernsystemshavemadedatascienceanessentialtoolfordecision-makingacrossa widerangeofindustries,fromfinanceandhealthcaretotransportationandretail.

Datascienceisamultidisciplinaryareathatblendsmethodsfromstatistics,mathematics,and computersciencetoderivewisdomandgainunderstandingfromdata.Theemergenceofbigdataand thegrowingintricacyofcontemporarysystemshavetransformeddatascienceintoacrucial instrumentforinformeddecision-makinginvarioussectors,includingfinance,healthcare, transportation,andretail.ImagegeneratedwithDALL-E.
Thefieldofdatasciencehasarichhistory,withrootsinstatisticsanddataanalysisdatingbacktothe 19thcentury.However,itwasnotuntilthe21stcenturythatdatasciencetrulycameintoitsown,as advancementsincomputingpowerandthedevelopmentofsophisticatedalgorithmsmadeitpossible
toanalyzelargerandmorecomplexdatasetsthaneverbefore.
Thischapterwillprovideanoverviewofthefundamentalsofdatascience,includingthekeyconcepts, tools,andtechniquesusedbydatascientiststoextractinsightsfromdata.Wewillcovertopicssuchas datavisualization,statisticalinference,machinelearning,anddeeplearning,aswellasbestpractices fordatamanagementandanalysis.
Datascienceisamultidisciplinaryfieldthatusestechniquesfrommathematics,statistics,andcomputersciencetoextractinsightsandknowledgefromdata.Itinvolvesavarietyofskillsandtools, includingdatacollectionandstorage,datacleaningandpreprocessing,exploratorydataanalysis, statisticalinference,machinelearning,anddatavisualization.
Thegoalofdatascienceistoprovideadeeperunderstandingofcomplexphenomena,identifypatterns andrelationships,andmakepredictionsordecisionsbasedondata-driveninsights.Thisisdoneby leveragingdatafromvarioussources,includingsensors,socialmedia,scientificexperiments,and businesstransactions,amongothers.
Datasciencehasbecomeincreasinglyimportantinrecentyearsduetotheexponentialgrowthof dataandtheneedforbusinessesandorganizationstoextractvaluefromit.Theriseofbigdata, cloudcomputing,andartificialintelligencehasopenedupnewopportunitiesandchallengesfordata scientists,whomustnavigatecomplexandrapidlyevolvinglandscapesoftechnologies,tools,and methodologies.
Tobesuccessfulindatascience,oneneedsastrongfoundationinmathematicsandstatistics,aswellas programmingskillsanddomain-specificknowledge.Datascientistsmustalsobeabletocommunicate e ectivelyandworkcollaborativelywithteamsofexpertsfromdi erentbackgrounds.
Overall,datasciencehasthepotentialtorevolutionizethewayweunderstandandinteractwith theworldaroundus,fromimprovinghealthcareandeducationtodrivinginnovationandeconomic growth.
Thedatascienceprocessisasystematicapproachforsolvingcomplexproblemsandextractinginsights fromdata.Itinvolvesaseriesofsteps,fromdefiningtheproblemtocommunicatingtheresults,and requiresacombinationoftechnicalandnon-technicalskills.
Thedatascienceprocesstypicallybeginswithunderstandingtheproblemanddefiningtheresearch questionorhypothesis.Oncethequestionisdefined,thedatascientistmustgatherandcleanthe relevantdata,whichcaninvolveworkingwithlargeandmessydatasets.Thedataisthenexploredand visualized,whichcanhelptoidentifypatterns,outliers,andrelationshipsbetweenvariables.
Oncethedataisunderstood,thedatascientistcanbegintobuildmodelsandperformstatistical analysis.Thiso eninvolvesusingmachinelearningtechniquestotrainpredictivemodelsorperform clusteringanalysis.Themodelsarethenevaluatedandtestedtoensuretheyareaccurateandrobust.
Finally,theresultsarecommunicatedtostakeholders,whichcaninvolvecreatingvisualizations, dashboards,orreportsthatareaccessibleandunderstandabletoanon-technicalaudience.Thisisan importantstep,astheultimategoalofdatascienceistodriveactionanddecision-makingbasedon data-driveninsights.
Thedatascienceprocessiso eniterative,asnewinsightsorquestionsmayariseduringtheanalysisthatrequirerevisitingprevioussteps.Theprocessalsorequiresacombinationoftechnicaland non-technicalskills,includingprogramming,statistics,anddomain-specificknowledge,aswellas communicationandcollaborationskills.
Tosupportthedatascienceprocess,thereareavarietyofso waretoolsandplatformsavailable, includingprogramminglanguagessuchasPythonandR,machinelearninglibrariessuchasscikit-learn andTensorFlow,anddatavisualizationtoolssuchasTableauandD3.js.Therearealsospecificdata scienceplatformsandenvironments,suchasJupyterNotebookandApacheSpark,thatprovidea comprehensivesetoftoolsfordatascientists.
Overall,thedatascienceprocessisapowerfulapproachforsolvingcomplexproblemsanddrivingdecision-makingbasedondata-driveninsights.Itrequiresacombinationoftechnicalandnontechnicalskills,andreliesonavarietyofso waretoolsandplatformstosupporttheprocess.
DataScienceisaninterdisciplinaryfieldthatcombinesstatisticalandcomputationalmethodologies toextractinsightsandknowledgefromdata.Programmingisanessentialpartofthisprocess,asit allowsustomanipulateandanalyzedatausingso waretoolsspecificallydesignedfordatascience tasks.Thereareseveralprogramminglanguagesthatarewidelyusedindatascience,eachwithits strengthsandweaknesses.
Risalanguagethatwasspecificallydesignedforstatisticalcomputingandgraphics.Ithasanextensive libraryofstatisticalandgraphicalfunctionsthatmakeitapopularchoicefordataexplorationand analysis.Python,ontheotherhand,isageneral-purposeprogramminglanguagethathasbecome increasinglypopularindatascienceduetoitsversatilityandpowerfullibrariessuchasNumPy,Pandas,
IbonMartínez-ArranzPage11
andScikit-learn.SQLisalanguageusedtomanageandmanipulaterelationaldatabases,makingitan essentialtoolforworkingwithlargedatasets.
Inadditiontothesepopularlanguages,therearealsodomain-specificlanguagesusedindatascience, suchasSAS,MATLAB,andJulia.Eachlanguagehasitsownuniquefeaturesandapplications,andthe choiceoflanguagewilldependonthespecificrequirementsoftheproject.
Inthischapter,wewillprovideanoverviewofthemostcommonlyusedprogramminglanguagesin datascienceanddiscusstheirstrengthsandweaknesses.Wewillalsoexplorehowtochoosetheright languageforagivenprojectanddiscussbestpracticesforprogrammingindatascience.
Risaprogramminglanguagespecificallydesignedforstatisticalcomputingandgraphics.It isanopen-sourcelanguagethatiswidelyusedindatasciencefortaskssuchasdatacleaning, visualization,andstatisticalmodeling.Rhasavastlibraryofpackagesthatprovidetoolsfor datamanipulation,machinelearning,andvisualization.
OneofthekeystrengthsofRisitsflexibilityandversatility.Itallowsuserstoeasilyimportand manipulatedatafromawiderangeofsourcesandprovidesawiderangeofstatisticaltechniquesfor dataanalysis.Ralsohasanactiveandsupportivecommunitythatprovidesregularupdatesandnew packagesforusers.
SomepopularapplicationsofRincludedataexplorationandvisualization,statisticalmodeling,and machinelearning.Risalsocommonlyusedinacademicresearchandhasbeenusedinmanypublished papersacrossavarietyoffields.
Pythonisapopulargeneral-purposeprogramminglanguagethathasbecomeincreasingly popularindatascienceduetoitsversatilityandpowerfullibrariessuchasNumPy,Pandas,and Scikit-learn.Python’ssimplicityandreadabilitymakeitanexcellentchoicefordataanalysis andmachinelearningtasks.
OneofthekeystrengthsofPythonisitsextensivelibraryofpackages.TheNumPypackage,for example,providespowerfultoolsformathematicaloperations,whilePandasisapackagedesigned fordatamanipulationandanalysis.Scikit-learnisamachinelearningpackagethatprovidestoolsfor classification,regression,clustering,andmore.
Pythonisalsoanexcellentlanguagefordatavisualization,withpackagessuchasMatplotlib,Seaborn, andPlotlyprovidingtoolsforcreatingawiderangeofvisualizations.
Python’spopularityinthedatasciencecommunityhasledtothedevelopmentofmanytoolsand frameworksspecificallydesignedfordataanalysisandmachinelearning.Somepopulartoolsinclude JupyterNotebook,Anaconda,andTensorFlow.
StructuredQueryLanguage(SQL)isaspecializedlanguagedesignedformanagingandmanipulatingrelationaldatabases.SQLiswidelyusedindatascienceformanagingandextracting informationfromdatabases.
SQLallowsuserstoretrieveandmanipulatedatastoredinarelationaldatabase.Userscancreate tables,insertdata,updatedata,anddeletedata.SQLalsoprovidespowerfultoolsforqueryingand aggregatingdata.
OneofthekeystrengthsofSQLisitsabilitytohandlelargeamountsofdatae iciently.SQLisa declarativelanguage,whichmeansthatuserscanspecifywhattheywanttoretrieveormanipulate, andthedatabasemanagementsystem(DBMS)handlestheimplementationdetails.ThismakesSQL anexcellentchoiceforworkingwithlargedatasets.
ThereareseveralpopularimplementationsofSQL,includingMySQL,Oracle,Microso SQLServer, andPostgreSQL.Eachimplementationhasitsownspecificsyntaxandfeatures,butthecoreconcepts ofSQLarethesameacrossallimplementations.
Indatascience,SQLiso enusedincombinationwithothertoolsandlanguages,suchasPythonorR, toextractandmanipulatedatafromdatabases.
Inthissection,wewillexploretheusageofSQLcommandswithtwotables: iris and species. The iris tablecontainsinformationaboutflowermeasurements,whilethe species tableprovides detailsaboutdi erentspeciesofflowers.SQL(StructuredQueryLanguage)isapowerfultoolfor managingandmanipulatingrelationaldatabases.
iristable
1
5 |4.7|3.2|1.3|0.2| Setosa | 6 |4.6|3.1|1.5|0.2| Setosa | 7 |5.0|3.6|1.4|0.2| Setosa | 8 |5.4|3.9|1.7|0.4| Setosa | 9 |4.6|3.4|1.4|0.3| Setosa |
|4.4|2.9|1.4|0.2| Setosa |
|4.9|3.1|1.5|0.1| Setosa | speciestable
1 | id | name | category | color | 2 |------------|----------------|------------|------------|
3 |1| Setosa | Flower | Red |
4 |2| Versicolor | Flower | Blue |
5 |3| Virginica | Flower | Purple |
6 |4| Pseudacorus | Plant | Yellow |
7 |5| Sibirica | Plant | White |
8 |6| Spiranthes | Plant | Pink | 9 |7| Colymbada | Animal | Brown | 10 |8| Amanita | Fungus | Red | 11 |9| Cerinthe | Plant | Orange | 12 |10| Holosericeum | Fungus | Yellow |
Usingthe iris and species tablesasexamples,wecanperformvariousSQLoperationstoextract meaningfulinsightsfromthedata.SomeofthecommonlyusedSQLcommandswiththesetables include:
DataRetrieval:
SQL(StructuredQueryLanguage)isessentialforaccessingandretrievingdatastoredinrelational databases.Theprimarycommandusedfordataretrievalis SELECT,whichallowsuserstospecify exactlywhatdatatheywanttosee.Thiscommandcanbecombinedwithotherclauseslike WHERE for filtering, ORDERBY forsorting,and JOIN formergingdatafrommultipletables.Masteryofthese commandsenablesuserstoe icientlyquerylargedatabases,extractingonlytherelevantinformation neededforanalysisorreporting.
SQLCommand Purpose
Example
SELECT Retrievedatafromatable SELECT*FROMiris
WHERE Filterrowsbasedona condition SELECT*FROMirisWHEREsepal_length>5.0
ORDERBY Sorttheresultset SELECT*FROMirisORDERBYsepal_widthDESC LIMIT Limitthenumberofrows returned SELECT*FROMirisLIMIT10
JOIN Combinerowsfrom multipletables
SELECT*FROMirisJOINspeciesONiris.species= species.name
Table1: CommonSQLcommandsfordataretrieval.
DataManipulation:
Datamanipulationisacriticalaspectofdatabasemanagement,allowinguserstomodifyexisting data,addnewdata,ordeleteunwanteddata.ThekeySQLcommandsfordatamanipulationare INSERTINTO foraddingnewrecords, UPDATE formodifyingexistingrecords,and DELETEFROM forremovingrecords.Thesecommandsarepowerfultoolsformaintainingandupdatingthecontent withinadatabase,ensuringthatthedataremainscurrentandaccurate.
SQLCommand Purpose
Example
INSERTINTO Insertnewrecordsintoa table INSERTINTOiris(sepal_length,sepal_width)VALUES (6.3,2.8)
UPDATE Updateexistingrecords inatable UPDATEirisSETpetal_length=1.5WHEREspecies= ’Setosa’
DELETEFROM Deleterecordsfroma table DELETEFROMirisWHEREspecies=’Versicolor’
Table2: CommonSQLcommandsformodifyingandmanagingdata.
DataAggregation:
SQLprovidesrobustfunctionalityforaggregatingdata,whichisessentialforstatisticalanalysisand generatingmeaningfulinsightsfromlargedatasets.Commandslike GROUPBY enablegroupingof databasedononeormorecolumns,while SUM, AVG, COUNT,andotheraggregationfunctionsallow forthecalculationofsums,averages,andcounts.The HAVING clausecanbeusedinconjunctionwith GROUPBY tofiltergroupsbasedonspecificconditions.Theseaggregationcapabilitiesarecrucialfor summarizingdata,facilitatingcomplexanalyses,andsupportingdecision-makingprocesses.
IbonMartínez-ArranzPage15
SQLCommand Purpose
GROUPBY Grouprowsbya column(s)
HAVING Filtergroupsbasedona condition
SUM Calculatethesumofa column
AVG Calculatetheaverageof acolumn
Example
SELECTspecies,COUNT(*)FROMirisGROUPBY species
SELECTspecies,COUNT(*)FROMirisGROUPBY speciesHAVINGCOUNT(*)>5
SELECTspecies,SUM(petal_length)FROMirisGROUP BYspecies
SELECTspecies,AVG(sepal_width)FROMirisGROUP BYspecies
Table3: CommonSQLcommandsfordataaggregationandanalysis.
Datascienceisarapidlyevolvingfield,andassuch,thereareavastnumberoftoolsandtechnologiesavailabletodatascientiststohelptheme ectivelyanalyzeanddrawinsightsfromdata.These toolsrangefromprogramminglanguagesandlibrariestodatavisualizationplatforms,datastorage technologies,andcloud-basedcomputingresources.
Inrecentyears,twoprogramminglanguageshaveemergedastheleadingtoolsfordatascience: PythonandR.Bothlanguageshaverobustecosystemsoflibrariesandtoolsthatmakeiteasyfordata scientiststoworkwithandmanipulatedata.Pythonisknownforitsversatilityandeaseofuse,whileR hasamorespecializedfocusonstatisticalanalysisandvisualization.
Datavisualizationisanessentialcomponentofdatascience,andthereareseveralpowerfultools availabletohelpdatascientistscreatemeaningfulandinformativevisualizations.Somepopular visualizationtoolsincludeTableau,PowerBI,andmatplotlib,aplottinglibraryforPython.
Anothercriticalaspectofdatascienceisdatastorageandmanagement.Traditionaldatabasesare notalwaysthebestfitforstoringlargeamountsofdatausedindatascience,andassuch,newer technologieslikeHadoopandApacheSparkhaveemergedaspopularoptionsforstoringandprocessingbigdata.Cloud-basedstorageplatformslikeAmazonWebServices(AWS),GoogleCloud Platform(GCP),andMicroso Azurearealsoincreasinglypopularfortheirscalability,flexibility,and cost-e ectiveness.
Inadditiontothesecoretools,thereareawidevarietyofothertechnologiesandplatformsthatdata scientistsuseintheirwork,includingmachinelearninglibrarieslikeTensorFlowandscikit-learn,data processingtoolslikeApacheKafkaandApacheBeam,andnaturallanguageprocessingtoolslikespaCy andNLTK.
Page16IbonMartínez-Arranz
Giventhevastnumberoftoolsandtechnologiesavailable,it’simportantfordatascientiststocarefully evaluatetheiroptionsandchoosethetoolsthatarebestsuitedfortheirparticularusecase.This requiresadeepunderstandingofthestrengthsandweaknessesofeachtool,aswellasawillingness toexperimentandtryoutnewtechnologiesastheyemerge.
Books
• Peng,R.D.(2015).ExploratoryDataAnalysiswithR.Springer.
• Hastie,T.,Tibshirani,R.,&Friedman,J.(2009).Theelementsofstatisticallearning:datamining, inference,andprediction.Springer.
• Provost,F.,&Fawcett,T.(2013).Datascienceanditsrelationshiptobigdataanddata-driven decisionmaking.BigData,1(1),51-59.
• Press,W.H.,Teukolsky,S.A.,Vetterling,W.T.,&Flannery,B.P.(2007).Numericalrecipes:Theart ofscientificcomputing.CambridgeUniversityPress.
• James,G.,Witten,D.,Hastie,T.,&Tibshirani,R.(2013).Anintroductiontostatisticallearning. Springer.
• Wickham,H.,&Grolemund,G.(2017).Rfordatascience:import,tidy,transform,visualize,and modeldata.O’ReillyMedia,Inc.
• VanderPlas,J.(2016).Pythondatasciencehandbook:Essentialtoolsforworkingwithdata. O’ReillyMedia,Inc.
• SQL:https://www.w3schools.com/sql/
• MySQL:https://www.mysql.com/
• PostgreSQL:https://www.postgresql.org/
• SQLite:https://www.sqlite.org/index.html
• DuckDB:https://duckdb.org/
So ware
• Python:https://www.python.org/
• TheRProjectforStatisticalComputing:https://www.r-project.org/
• Tableau:https://www.tableau.com/
• PowerBI:https://powerbi.microsoft.com/
• Hadoop:https://hadoop.apache.org/
• ApacheSpark:https://spark.apache.org/
• AWS:https://aws.amazon.com/
• GCP:https://cloud.google.com/
• Azure:https://azure.microsoft.com/
• TensorFlow:https://www.tensorflow.org/
• scikit-learn:https://scikit-learn.org/
• ApacheKafka:https://kafka.apache.org/
• ApacheBeam:https://beam.apache.org/
• spaCy:https://spacy.io/
• NLTK:https://www.nltk.org/
• NumPy:https://numpy.org/
• Pandas:https://pandas.pydata.org/
• Scikit-learn:https://scikit-learn.org/
• Matplotlib:https://matplotlib.org/
• Seaborn:https://seaborn.pydata.org/
• Plotly:https://plotly.com/
• JupyterNotebook:https://jupyter.org/
• Anaconda:https://www.anaconda.com/
• TensorFlow:https://www.tensorflow.org/
• RStudio:https://www.rstudio.com/
Datascienceisacomplexanditerativeprocessthatinvolvesnumerousstepsandtools,fromdata acquisitiontomodeldeployment.Toe ectivelymanagethisprocess,itisessentialtohaveasolidunderstandingofworkflowmanagementconcepts.Workflowmanagementinvolvesdefining,executing, andmonitoringprocessestoensuretheyareexecutede icientlyande ectively.

Thefieldofdatascienceischaracterizedbyitsintricateanditerativenature,encompassinga multitudeofstagesandtools,fromdatagatheringtomodeldeployment.Toproficientlyoverseethis procedure,acomprehensivegraspofworkflowmanagementprinciplesisindispensable.Workflow managementencompassesthedefinition,execution,andsupervisionofprocessestoguaranteetheir e icientande ectiveimplementation.ImagegeneratedwithDALL-E.
Inthecontextofdatascience,workflowmanagementinvolvesmanagingtheprocessofdatacollection, cleaning,analysis,modeling,anddeployment.Itrequiresasystematicapproachtohandlingdataand leveragingappropriatetoolsandtechnologiestoensurethatdatascienceprojectsaredeliveredon
time,withinbudget,andtothesatisfactionofstakeholders.
Inthischapter,wewillexplorethefundamentalconceptsofworkflowmanagement,includingtheprinciplesofworkflowdesign,processautomation,andqualitycontrol.Wewillalsodiscusshowtoleverage workflowmanagementtoolsandtechnologies,suchastaskschedulers,versioncontrolsystems,and collaborationplatforms,tostreamlinethedatascienceworkflowandimprovee iciency.
Bytheendofthischapter,youwillhaveasolidunderstandingoftheprinciplesandpracticesof workflowmanagement,andhowtheycanbeappliedtothedatascienceworkflow.Youwillalsobe familiarwiththekeytoolsandtechnologiesusedtoimplementworkflowmanagementindatascience projects.
Workflowmanagementistheprocessofdefining,executing,andmonitoringworkflowstoensurethat theyareexecutede icientlyande ectively.Aworkflowisaseriesofinterconnectedstepsthatmust beexecutedinaspecificordertoachieveadesiredoutcome.Inthecontextofdatascience,aworkflow involvesmanagingtheprocessofdataacquisition,cleaning,analysis,modeling,anddeployment.
E ectiveworkflowmanagementinvolvesdesigningworkflowsthataree icient,easytounderstand, andscalable.Thisrequirescarefulconsiderationoftheresourcesneededforeachstepintheworkflow, aswellasthedependenciesbetweensteps.Workflowsmustbeflexibleenoughtoaccommodate changesindatasources,analyticalmethods,andstakeholderrequirements.
Automatingworkflowscangreatlyimprovee iciencyandreducetheriskoferrors.Workflowautomationinvolvesusingso waretoolstoautomatetheexecutionofworkflows.Thiscanincludeautomating repetitivetasks,schedulingworkflowstorunatspecifictimes,andtriggeringworkflowsbasedon certainevents.
Workflowmanagementalsoinvolvesensuringthequalityoftheoutputproducedbyworkflows.This requiresimplementingqualitycontrolmeasuresateachstageoftheworkflowtoensurethatthedata beingproducedisaccurate,consistent,andmeetsstakeholderrequirements.
Inthecontextofdatascience,workflowmanagementisessentialtoensurethatdatascienceprojects aredeliveredontime,withinbudget,andtothesatisfactionofstakeholders.Byimplementinge ective workflowmanagementpractices,datascientistscanimprovethee iciencyande ectivenessoftheir work,andultimatelydeliverbetterinsightsandvaluetotheirorganizations.
E ectiveworkflowmanagementisacrucialaspectofdatascienceprojects.Itinvolvesdesigning, executing,andmonitoringaseriesoftasksthattransformrawdataintovaluableinsights.Workflow managementensuresthatdatascientistsareworkinge icientlyande ectively,allowingthemto focusonthemostimportantaspectsoftheanalysis.
Datascienceprojectscanbecomplex,involvingmultiplestepsandvariousteams.Workflowmanagementhelpskeepeveryoneontrackbyclearlydefiningrolesandresponsibilities,settingtimelinesand deadlines,andprovidingastructurefortheentireprocess.
Inaddition,workflowmanagementhelpstoensurethatdataqualityismaintainedthroughoutthe project.Bysettingupqualitychecksandtestingateverystep,datascientistscanidentifyandcorrect errorsearlyintheprocess,leadingtomoreaccurateandreliableresults.
Properworkflowmanagementalsofacilitatescollaborationbetweenteammembers,allowingthemto shareinsightsandprogress.Thishelpsensurethateveryoneisonthesamepageandworkingtowards acommongoal,whichiscrucialforsuccessfuldataanalysis.
Insummary,workflowmanagementisessentialfordatascienceprojects,asithelpstoensuree iciency, accuracy,andcollaboration.Byimplementingastructuredworkflow,datascientistscanachievetheir goalsandproducevaluableinsightsfortheorganization.
Workflowmanagementmodelsareessentialtoensurethesmoothande icientexecutionofdata scienceprojects.Thesemodelsprovideaframeworkformanagingtheflowofdataandtasksfromthe initialstagesofdatacollectionandprocessingtothefinalstagesofanalysisandinterpretation.They helpensurethateachstageoftheprojectisproperlyplanned,executed,andmonitored,andthatthe projectteamisabletocollaboratee ectivelyande iciently.
OnecommonlyusedmodelindatascienceistheCRISP-DM(Cross-IndustryStandardProcessfor DataMining)model.Thismodelconsistsofsixphases:businessunderstanding,dataunderstanding, datapreparation,modeling,evaluation,anddeployment.TheCRISP-DMmodelprovidesastructured approachtodataminingprojectsandhelpsensurethattheprojectteamhasaclearunderstanding ofthebusinessgoalsandobjectives,aswellasthedataavailableandtheappropriateanalytical techniques.
AnotherpopularworkflowmanagementmodelindatascienceistheTDSP(TeamDataScienceProcess) modeldevelopedbyMicroso .Thismodelconsistsoffivephases:businessunderstanding,data acquisitionandunderstanding,modeling,deployment,andcustomeracceptance.TheTDSPmodel IbonMartínez-ArranzPage21
emphasizestheimportanceofcollaborationandcommunicationamongteammembers,aswellas theneedforcontinuoustestingandevaluationoftheanalyticalmodelsdeveloped.
Inadditiontothesemodels,therearealsovariousagileprojectmanagementmethodologiesthatcan beappliedtodatascienceprojects.Forexample,theScrummethodologyiswidelyusedinso ware developmentandcanalsobeadaptedtodatascienceprojects.Thismethodologyemphasizesthe importanceofregularteammeetingsanditerativedevelopment,allowingforflexibilityandadaptability inthefaceofchangingprojectrequirements.
Regardlessofthespecificworkflowmanagementmodelused,thekeyistoensurethattheproject teamhasaclearunderstandingoftheoverallprojectgoalsandobjectives,aswellastherolesand responsibilitiesofeachteammember.Communicationandcollaborationarealsoessential,asthey helpensurethateachstageoftheprojectisproperlyplannedandexecuted,andthatanyissuesor challengesareaddressedinatimelymanner.
Overall,workflowmanagementmodelsarecriticaltothesuccessofdatascienceprojects.Theyprovide astructuredapproachtoprojectmanagement,ensuringthattheprojectteamisabletoworke iciently ande ectively,andthattheprojectgoalsandobjectivesaremet.Byimplementingtheappropriate workflowmanagementmodelforagivenproject,datascientistscanmaximizethevalueofthedata andinsightstheygenerate,whileminimizingthetimeandresourcesrequiredtodoso.
Workflowmanagementtoolsandtechnologiesplayacriticalroleinmanagingdatascienceprojects e ectively.Thesetoolshelpinautomatingvarioustasksandallowforbettercollaborationamongteam members.Additionally,workflowmanagementtoolsprovideawaytomanagethecomplexityofdata scienceprojects,whicho eninvolvemultiplestakeholdersanddi erentstagesofdataprocessing. OnepopularworkflowmanagementtoolfordatascienceprojectsisApacheAirflow.Thisopen-source platformallowsforthecreationandschedulingofcomplexdataworkflows.WithAirflow,userscan definetheirworkflowasaDirectedAcyclicGraph(DAG)andthenscheduleeachtaskbasedonitsdependencies.Airflowprovidesawebinterfaceformonitoringandvisualizingtheprogressofworkflows, makingiteasierfordatascienceteamstocollaborateandcoordinatetheire orts.
AnothercommonlyusedtoolisApacheNiFi,anopen-sourceplatformthatenablestheautomationof datamovementandprocessingacrossdi erentsystems.NiFiprovidesavisualinterfaceforcreating datapipelines,whichcanincludetaskssuchasdataingestion,transformation,androuting.NiFialso includesavarietyofprocessorsthatcanbeusedtointeractwithvariousdatasources,makingita flexibleandpowerfultoolformanagingdataworkflows.
Databricksisanotherplatformthato ersworkflowmanagementcapabilitiesfordatascienceprojects. Thiscloud-basedplatformprovidesaunifiedanalyticsenginethatallowsfortheprocessingoflargescaledata.WithDatabricks,userscancreateandmanagedataworkflowsusingavisualinterfaceor bywritingcodeinPython,R,orScala.Theplatformalsoincludesfeaturesfordatavisualizationand collaboration,makingiteasierforteamstoworktogetheroncomplexdatascienceprojects.
Inadditiontothesetools,therearealsovarioustechnologiesthatcanbeusedforworkflowmanagementindatascienceprojects.Forexample,containerizationtechnologieslikeDockerandKubernetes allowforthecreationanddeploymentofisolatedenvironmentsforrunningdataworkflows.These technologiesprovideawaytoensurethatworkflowsarerunconsistentlyacrossdi erentsystems, regardlessofdi erencesintheunderlyinginfrastructure.
AnothertechnologythatcanbeusedforworkflowmanagementisversioncontrolsystemslikeGit. Thesetoolsallowforthemanagementofcodechangesandcollaborationamongteammembers.By usingversioncontrol,datascienceteamscanensurethatchangestotheirworkflowcodearetracked andcanberolledbackifneeded.
Overall,workflowmanagementtoolsandtechnologiesplayacriticalroleinmanagingdatascience projectse ectively.Byprovidingawaytoautomatetasks,collaboratewithteammembers,and managethecomplexityofdataworkflows,thesetoolsandtechnologieshelpdatascienceteamsto deliverhigh-qualityresultsmoree iciently.
Indatascienceprojects,e ectivedocumentationplaysacrucialroleinpromotingcollaboration,facilitatingknowledgesharing,andensuringreproducibility.Documentationservesasacomprehensive recordoftheproject’sgoals,methodologies,andoutcomes,enablingteammembers,stakeholders, andfutureresearcherstounderstandandreproducethework.Thissectionfocusesonthesignificance ofreproducibilityindatascienceprojectsandexploresstrategiesforenhancingcollaborationthrough projectdocumentation.
Reproducibilityisafundamentalprincipleindatasciencethatemphasizestheabilitytoobtainconsistentandidenticalresultswhenre-executingaprojectoranalysis.Itensuresthatthefindingsand insightsderivedfromaprojectarevalid,reliable,andtransparent.Theimportanceofreproducibility indatasciencecanbesummarizedasfollows: IbonMartínez-ArranzPage23
• ValidationandVerification:Reproducibilityallowsotherstovalidateandverifythefindings, methods,andmodelsusedinaproject.Itenablesthescientificcommunitytobuildupon previouswork,reducingthechancesoferrorsorbiasesgoingunnoticed.
• TransparencyandTrust:Transparentdocumentationandreproducibilitybuildtrustamong teammembers,stakeholders,andthewiderdatasciencecommunity.Byprovidingdetailed informationaboutdatasources,preprocessingsteps,featureengineering,andmodeltraining, reproducibilityenablesotherstounderstandandtrusttheresults.
• CollaborationandKnowledgeSharing:Reproducibleprojectsfacilitatecollaborationamong teammembersandencourageknowledgesharing.Withwell-documentedworkflows,other researcherscaneasilyreplicateandbuilduponexistingwork,acceleratingtheprogressof scientificdiscoveries.
Toenhancecollaborationandreproducibilityindatascienceprojects,e ectiveprojectdocumentation isessential.Herearesomestrategiestoconsider:
• ComprehensiveDocumentation:Documenttheproject’sobjectives,datasources,datapreprocessingsteps,featureengineeringtechniques,modelselectionandevaluation,andany assumptionsmadeduringtheanalysis.Provideclearexplanationsandincludecodesnippets, visualizations,andinteractivenotebookswheneverpossible.
• VersionControl:UseversioncontrolsystemslikeGittotrackchanges,collaboratewithteam members,andmaintainahistoryofprojectiterations.Thisallowsforeasycomparisonand identificationofmodificationsmadeatdi erentstagesoftheproject.
• ReadmeFiles:CreateREADMEfilesthatprovideanoverviewoftheproject,itsdependencies, andinstructionsonhowtoreproducetheresults.Includeinformationonhowtosetupthe developmentenvironment,installrequiredlibraries,andexecutethecode.
–Project’sTitle:Thetitleoftheproject,summarizingthemaingoalandaim.
– ProjectDescription:Awell-cra eddescriptionshowcasingwhattheapplicationdoes, technologiesused,andfuturefeatures.
– TableofContents:HelpsusersnavigatethroughtheREADMEeasily,especiallyforlonger documents.
– HowtoInstallandRuntheProject:Step-by-stepinstructionstosetupandruntheproject, includingrequireddependencies.
–HowtoUsetheProject:Instructionsandexamplesforusers/contributorstounderstand andutilizetheprojecte ectively,includingauthenticationifapplicable.
– Credits:Acknowledgeteammembers,collaborators,andreferencedmaterialswithlinks totheirprofiles.
– License:Informotherdevelopersaboutthepermissionsandrestrictionsonusingthe project,recommendingtheGPLLicenseasacommonoption.
• DocumentationTools:LeveragedocumentationtoolssuchasMkDocs,JupyterNotebooks, orJupyterBooktocreatestructured,user-friendlydocumentation.Thesetoolsenableeasy navigation,codeexecution,andintegrationofrichmediaelementslikeimages,tables,and interactivevisualizations.
Documentingyournotebookprovidesvaluablecontextandinformationabouttheanalysisorcode containedwithinit,enhancingitsreadabilityandreproducibility.watermark,specifically,allowsyouto addessentialmetadata,suchastheversionofPython,theversionsofkeylibraries,andtheexecution timeofthenotebook.
Byincludingthisinformation,youenableotherstounderstandtheenvironmentinwhichyournotebook wasdeveloped,ensuringtheycanreproducetheresultsaccurately.Italsohelpsidentifypotential issuesrelatedtolibraryversionsorpackagedependencies.Additionally,documentingtheexecution timeprovidesinsightsintothetimerequiredtorunspecificcellsortheentirenotebook,allowingfor betterperformanceoptimization.
Moreover,detaileddocumentationinanotebookimprovescollaborationamongteammembers, makingiteasiertoshareknowledgeandunderstandtherationalebehindtheanalysis.Itservesasa valuableresourceforfuturereference,ensuringthatotherscanfollowyourworkandbuilduponit e ectively.
1 %load_extwatermark
2 %watermark \
3 author "IbonMartínez-Arranz" \
4 updated time date \
5 python machine\
6 packagespandas,numpy,matplotlib,seaborn,scipy,yaml \ 7 githash gitrepo
1 Author: IbonMartínez-Arranz 2 3 Lastupdated:2023-03-0909:58:17
5 Pythonimplementation: CPython
Pythonversion :3.7.9
IPythonversion :7.33.0
12 seaborn :0.12.1
IbonMartínez-ArranzPage25
Byprioritizingreproducibilityandadoptinge ectiveprojectdocumentationpractices,datascience teamscanenhancecollaboration,promotetransparency,andfostertrustintheirwork.Reproducible projectsnotonlybenefitindividualresearchersbutalsocontributetotheadvancementofthefieldby enablingotherstobuilduponexistingknowledgeanddrivefurtherdiscoveries.
Name Description Website
Jupyternbconvert
MkDocs
JupyterBook
Sphinx
GitBook
DocFX
Acommand-linetooltoconvertJupyternotebooksto variousformats,includingHTML,PDF,andMarkdown. nbconvert
Astaticsitegeneratorspecificallydesignedforcreating projectdocumentationfromMarkdownfiles. mkdocs
AtoolforbuildingonlinebookswithJupyter Notebooks,includingfeatureslikepage navigation, cross-referencing,andinteractiveoutputs.
Adocumentationgeneratorthatallowsyoutowrite documentationinreStructuredTextorMarkdownand canoutputvariousformats,includingHTMLandPDF.
Amoderndocumentationplatformthatallowsyouto writedocumentationusingMarkdownandprovides featureslikeversioning,collaboration,andpublishing options.
AdocumentationgenerationtoolspecificallydesignedforAPIdocumentation,supportingmultiple programminglanguagesandoutputformats.
Table1: Overviewoftoolsfordocumentationgenerationandconversion.
jupyterbook
sphinx
gitbook
docfx
PracticalExample:HowtoStructureaDataScienceProjectUsing
Structuringadatascienceprojectinawell-organizedmanneriscrucialforitssuccess.Theprocessof datascienceinvolvesseveralstepsfromcollecting,cleaning,analyzing,andmodelingdatatofinally presentingtheinsightsderivedfromit.Thus,havingaclearande icientfolderstructuretostore allthesefilescangreatlysimplifytheprocessandmakeiteasierforteammemberstocollaborate e ectively.
Inthischapter,wewilldiscusspracticalexamplesofhowtostructureadatascienceprojectusing well-organizedfoldersandfiles.Wewillgothrougheachstepindetailandprovideexamplesofthe typesoffilesthatshouldbeincludedineachfolder.
Onecommonstructurefororganizingadatascienceprojectistohaveamainfolderthatcontains subfoldersforeachmajorstepoftheprocess,suchasdatacollection,datacleaning,dataanalysis,and datamodeling.Withineachofthesesubfolders,therecanbefurthersubfoldersthatcontainspecific filesrelatedtotheparticularstep.Forinstance,thedatacollectionsubfoldercancontainsubfoldersfor rawdata,processeddata,anddatadocumentation.Similarly,thedataanalysissubfoldercancontain subfoldersforexploratorydataanalysis,visualization,andstatisticalanalysis.
Itisalsoessentialtohaveaseparatefolderfordocumentation,whichshouldincludeadetaileddescriptionofeachstepinthedatascienceprocess,thedatasourcesused,andthemethodsapplied.This documentationcanhelpensurereproducibilityandfacilitatecollaborationamongteammembers.
Moreover,itiscrucialtomaintainaconsistentnamingconventionforallfilestoavoidconfusionand makeiteasiertosearchandlocatefiles.Thiscanbeachievedbyusingaclearandconcisenaming conventionthatincludesrelevantinformation,suchasthedate,projectname,andstepinthedata scienceprocess.
Finally,itisessentialtouseversioncontroltoolssuchasGittokeeptrackofchangesmadetothefiles andcollaboratee ectivelywithteammembers.ByusingGit,teammemberscaneasilysharetheir work,trackchangesmadetofiles,andreverttopreviousversionsifnecessary.
Insummary,structuringadatascienceprojectusingwell-organizedfoldersandfilescangreatly improvethee iciencyoftheworkflowandmakeiteasierforteammemberstocollaboratee ectively. Byfollowingaconsistentfolderstructure,usingclearnamingconventions,andimplementingversion controltools,datascienceprojectscanbecompletedmoree icientlyandwithgreateraccuracy.
1 project-name/
2 \-- README.md
3 \-- requirements.txt
4 \-- environment.yaml
5 \--.gitignore IbonMartínez-ArranzPage27
6 \
7 \-- config
8 \
9 \-- data/ 10 \\-- d10_raw 11 \\-- d20_interim
12 \\-- d30_processed
13 \\-- d40_models
14 \\-- d50_model_output
15 \\-- d60_reporting
\
\-- docs
\ 19 \-- images 20 \
\-- notebooks
\
\-- references 24 \
25 \-- results
26 \
27 \-- source
28 \-- __init__.py
29 \
30 \-- s00_utils
31 \\-- YYYYMMDD-ima-remove_values.py
32 \\-- YYYYMMDD-ima-remove_samples.py
33 \\-- YYYYMMDD-ima-rename_samples.py
34 \
35 \-- s10_data
36 \\-- YYYYMMDD-ima-load_data.py
37 \
38 \-- s20_intermediate
39 \\-- YYYYMMDD-ima-create_intermediate_data.py
40 \
41 \-- s30_processing
42 \\-- YYYYMMDD-ima-create_master_table.py
43 \\-- YYYYMMDD-ima-create_descriptive_table.py
44 \
45 \-- s40_modelling
46 \\-- YYYYMMDD-ima-importance_features.py
47 \\-- YYYYMMDD-ima-train_lr_model.py
48 \\-- YYYYMMDD-ima-train_svm_model.py
49 \\-- YYYYMMDD-ima-train_rf_model.py
50 \
51 \-- s50_model_evaluation
52 \\-- YYYYMMDD-ima-calculate_performance_metrics.py
53 \
54 \-- s60_reporting
55 \\-- YYYYMMDD-ima-create_summary.py
56 \\-- YYYYMMDD-ima-create_report.py
57 \
58 \-- s70_visualisation
59 \-- YYYYMMDD-ima-count_plot_for_categorical_features.py
60 \-- YYYYMMDD-ima-distribution_plot_for_continuous_features.py
61 \-- YYYYMMDD-ima-relational_plots.py
62 \-- YYYYMMDD-ima-outliers_analysis_plots.py
63 \-- YYYYMMDD-ima-visualise_model_results.py
Inthisexample,wehaveamainfoldercalled project-name whichcontainsseveralsubfolders:
• data:Thisfolderisusedtostoreallthedatafiles.Itisfurtherdividedintosixsubfolders:
– ‘raw:Thisfolderisusedtostoretherawdatafiles,whicharetheoriginalfilesobtainedfrom varioussourceswithoutanyprocessingorcleaning.
– interim:Inthisfolder,youcansaveintermediatedatathathasundergonesomecleaning andpreprocessingbutisnotyetreadyforfinalanalysis.Thedataheremayincludetemporaryorpartialtransformationsnecessarybeforethefinaldatapreparationforanalysis.
– processed:The processed foldercontainscleanedandfullyprepareddatafilesfor analysis.Thesedatafilesareuseddirectlytocreatemodelsandperformstatisticalanalysis.
– models:Thisfolderisdedicatedtostoringthetrainedmachinelearningorstatistical modelsdevelopedduringtheproject.Thesemodelscanbeusedformakingpredictionsor furtheranalysis.
– model_output:Here,youcanstoretheresultsandoutputsgeneratedbythetrained models.Thismayincludepredictions,performancemetrics,andanyotherrelevantmodel output.
– reporting:The reporting folderisusedtostorevariousreports,charts,visualizations, ordocumentscreatedduringtheprojecttocommunicatefindingsandresults.Thiscan includefinalreports,presentations,orexplanatorydocuments.
• notebooks:ThisfoldercontainsalltheJupyternotebooksusedintheproject.Itisfurther dividedintofoursubfolders:
– exploratory:ThisfoldercontainstheJupyternotebooksusedforexploratorydata analysis.
– preprocessing:ThisfoldercontainstheJupyternotebooksusedfordatapreprocessing andcleaning.
– modeling:ThisfoldercontainstheJupyternotebooksusedformodeltrainingandtesting.
– evaluation:ThisfoldercontainstheJupyternotebooksusedforevaluatingmodel performance.
• source:Thisfoldercontainsallthesourcecodeusedintheproject.Itisfurtherdividedinto foursubfolders:
– data:Thisfoldercontainsthecodeforloadingandprocessingdata.
– models:Thisfoldercontainsthecodeforbuildingandtrainingmodels.
– visualization:Thisfoldercontainsthecodeforcreatingvisualizations.
– utils:Thisfoldercontainsanyutilityfunctionsusedintheproject.
• reports:Thisfoldercontainsallthereportsgeneratedaspartoftheproject.Itisfurther dividedintofoursubfolders:
– figures:Thisfoldercontainsallthefiguresusedinthereports.
– tables:Thisfoldercontainsallthetablesusedinthereports.
– paper:Thisfoldercontainsthefinalreportoftheproject,whichcanbeintheformofa scientificpaperortechnicalreport.
– presentation:Thisfoldercontainsthepresentationslidesusedtopresenttheproject tostakeholders.
• README.md:Thisfilecontainsabriefdescriptionoftheprojectandthefolderstructure.
• environment.yaml:Thisfilethatspecifiestheconda/pipenvironmentusedfortheproject.
• requirements.txt:Filewithotherrequerimentsnecessaryfortheproject.
• LICENSE:Filethatspecifiesthelicenseoftheproject.
• .gitignore:FilethatspecifiesthefilesandfolderstobeignoredbyGit.
Byorganizingtheprojectfilesinthisway,itbecomesmucheasiertonavigateandfindspecificfiles.It alsomakesiteasierforcollaboratorstounderstandthestructureoftheprojectandcontributetoit.
Books
• WorkflowModeling:ToolsforProcessImprovementandApplicationDevelopmentbyAlecSharp andPatrickMcDermott
• WorkflowHandbook2003byLaynaFischer
• BusinessProcessManagement:Concepts,Languages,ArchitecturesbyMathiasWeske
• WorkflowPatterns:TheDefinitiveGuidebyNickRussellandWilvanderAalst
Websites
• HowtoWriteaGoodREADMEFileforYourGitHubProject
E ectiveprojectplanningisessentialforsuccessfuldatascienceprojects.Planninginvolvesdefining clearobjectives,outliningprojecttasks,estimatingresources,andestablishingtimelines.Inthefield ofdatascience,wherecomplexanalysisandmodelingareinvolved,properprojectplanningbecomes evenmorecriticaltoensuresmoothexecutionandachievedesiredoutcomes.

E icientprojectplanningplaysanimportantroleinthesuccessofdatascienceprojects.Thisentails settingwell-definedgoals,delineatingprojectresponsibilities,gaugingresourcerequirements,and establishingtimeframes.Intherealmofdatascience,whereintricateanalysisandmodelingare central,meticulousprojectplanningbecomesevenmorevitaltofacilitateseamlessexecutionand attainthedesiredresults.ImagegeneratedwithDALL-E.
Inthischapter,wewillexploretheintricaciesofprojectplanningspecificallytailoredtodatascience projects.Wewilldelveintothekeyelementsandstrategiesthathelpdatascientistse ectivelyplan theirprojectsfromstarttofinish.Awell-structuredandthought-outprojectplansetsthefoundation
fore icientteamwork,mitigatesrisks,andmaximizesthechancesofdeliveringactionableinsights.
Thefirststepinprojectplanningistodefinetheprojectgoalsandobjectives.Thisinvolvesunderstandingtheproblemathand,definingthescopeoftheproject,andaligningtheobjectiveswiththe needsofstakeholders.Clearandmeasurablegoalshelptofocuse ortsandguidedecision-making throughouttheprojectlifecycle.
Oncethegoalsareestablished,thenextphaseinvolvesbreakingdowntheprojectintosmallertasks andactivities.Thisallowsforbetterorganizationandallocationofresources.Itisessentialtoidentify dependenciesbetweentasksandestablishlogicalsequencestoensureasmoothworkflow.Techniques suchasWorkBreakdownStructure(WBS)andGanttchartscanaidinvisualizingandmanagingproject taskse ectively.
Resourceestimationisanothercrucialaspectofprojectplanning.Itinvolvesdeterminingthenecessary personnel,tools,data,andinfrastructurerequiredtoaccomplishprojecttasks.Properresource allocationensuresthatteammembershavethenecessaryskillsandexpertisetoexecutetheirassigned responsibilities.Itisalsoessentialtoconsiderpotentialconstraintsandrisksanddevelopcontingency planstoaddressunforeseenchallenges.
Timelinesanddeadlinesareintegraltoprojectplanning.Settingrealistictimelinesforeachtaskallows fore icientprojectmanagementandensuresthatdeliverablesarecompletedwithinthedesired timeframe.Regularmonitoringandtrackingofprogressagainstthesetimelineshelptoidentify bottlenecksandtakecorrectiveactionswhennecessary.
Furthermore,e ectivecommunicationandcollaborationplayavitalroleinprojectplanning.Datascienceprojectso eninvolvemultidisciplinaryteams,andclearcommunicationchannelsfostere icient knowledgesharingandcoordination.Regularprojectmeetings,documentation,andcollaborative toolsenablee ectivecollaborationamongteammembers.
Itisalsoimportanttoconsiderethicalconsiderationsanddataprivacyregulationsduringproject planning.Adheringtoethicalguidelinesandlegalrequirementsensuresthatdatascienceprojectsare conductedresponsiblyandwithintegrity.
Insummary,projectplanningformsthebackboneofsuccessfuldatascienceprojects. Bydefiningcleargoals,breakingdowntasks,estimatingresources,establishingtimelines,fosteringcommunication,andconsideringethicalconsiderations,datascientists cannavigatethecomplexitiesofprojectmanagementandincreasethelikelihoodof deliveringimpactfulresults.
Projectplanningisasystematicprocessthatinvolvesoutliningtheobjectives,definingthescope, determiningthetasks,estimatingresources,establishingtimelines,andcreatingaroadmapforthe successfulexecutionofaproject.Itisafundamentalphasethatsetsthefoundationfortheentire projectlifecycleindatascience.
Inthecontextofdatascienceprojects,projectplanningreferstothestrategicandtacticaldecisions madetoachievetheproject’sgoalse ectively.Itprovidesastructuredapproachtoidentifyand organizethenecessarystepsandresourcesrequiredtocompletetheprojectsuccessfully.
Atitscore,projectplanningentailsdefiningtheproblemstatementandunderstandingtheproject’s purposeanddesiredoutcomes.Itinvolvescollaboratingwithstakeholderstogatherrequirements, clarifyexpectations,andaligntheproject’sscopewithbusinessneeds.
Theprocessofprojectplanningalsoinvolvesbreakingdowntheprojectintosmaller,manageable tasks.Thisdecompositionhelpsinidentifyingdependencies,sequencingactivities,andestimating thee ortrequiredforeachtask.Bydividingtheprojectintosmallercomponents,datascientistscan allocateresourcese iciently,trackprogress,andmonitortheproject’soverallhealth.
Onecriticalaspectofprojectplanningisresourceestimation.Thisincludesidentifyingthenecessary personnel,skills,tools,andtechnologiesrequiredtoaccomplishprojecttasks.Datascientistsneed toconsidertheavailabilityandexpertiseofteammembers,aswellasanyexternalresourcesthat mayberequired.Accurateresourceestimationensuresthattheprojecthastherightmixofskillsand capabilitiestodeliverthedesiredresults.
Establishingrealistictimelinesisanotherkeyaspectofprojectplanning.Itinvolvesdeterminingthe startandenddatesforeachtaskanddefiningmilestonesfortrackingprogress.Timelineshelpin coordinatingteame orts,managingexpectations,andensuringthattheprojectremainsontrack. However,itiscrucialtoaccountforpotentialrisksanduncertaintiesthatmayimpacttheproject’s timelineandbuildinbu ersorcontingencyplanstoaddressunforeseenchallenges.
E ectiveprojectplanningalsoinvolvesidentifyingandmanagingprojectrisks.Thisincludesassessing potentialrisks,analyzingtheirimpact,anddevelopingstrategiestomitigateoraddressthem.By proactivelyidentifyingandmanagingrisks,datascientistscanminimizethelikelihoodofdelaysor failuresandensuresmootherprojectexecution.
Communicationandcollaborationareintegralpartsofprojectplanning.Datascienceprojectso en involvecross-functionalteams,includingdatascientists,domainexperts,businessstakeholders,and ITprofessionals.E ectivecommunicationchannelsandcollaborationplatformsfacilitateknowledge sharing,alignmentofexpectations,andcoordinationamongteammembers.Regularprojectmeetings, progressupdates,anddocumentationensurethateveryoneremainsonthesamepageandcan
IbonMartínez-ArranzPage33
contributee ectivelytoprojectsuccess.
Inconclusion,projectplanningisthesystematicprocessofdefiningobjectives,breaking downtasks,estimatingresources,establishingtimelines,andmanagingriskstoensure thesuccessfulexecutionofdatascienceprojects.Itprovidesaclearroadmapforproject teams,facilitatesresourceallocationandcoordination,andincreasesthelikelihoodof deliveringqualityoutcomes.E ectiveprojectplanningisessentialfordatascientiststo maximizetheire iciency,mitigaterisks,andachievetheirprojectgoals.
Theinitialstepinprojectplanningfordatascienceisdefiningtheproblemandestablishingclear objectives.Theproblemdefinitionsetsthestagefortheentireproject,guidingthedirectionofanalysis andshapingtheoutcomesthataredesired.
Definingtheprobleminvolvesgainingacomprehensiveunderstandingofthebusinesscontextand identifyingthespecificchallengesoropportunitiesthattheprojectaimstoaddress.Itrequiresclose collaborationwithstakeholders,domainexperts,andotherrelevantpartiestogatherinsightsand domainknowledge.
Duringtheproblemdefinitionphase,datascientistsworkcloselywithstakeholderstoclarifyexpectations,identifypainpoints,andarticulatetheproject’sgoals.Thiscollaborativeprocessensuresthat theprojectalignswiththeorganization’sstrategicobjectivesandaddressesthemostcriticalissuesat hand.
Todefinetheprobleme ectively,datascientistsemploytechniquessuchasexploratorydataanalysis, datamining,anddata-drivendecision-making.Theyanalyzeexistingdata,identifypatterns,and uncoverhiddeninsightsthatshedlightonthenatureoftheproblemanditsunderlyingcauses.
Oncetheproblemiswell-defined,thenextstepistoestablishclearobjectives.Objectivesserveasthe guidingprinciplesfortheproject,outliningwhattheprojectaimstoachieve.Theseobjectivesshould bespecific,measurable,achievable,relevant,andtime-bound(SMART)toprovideaclearframework forprojectexecutionandevaluation.
Datascientistscollaboratewithstakeholderstosetrealisticandmeaningfulobjectivesthatalignwith theproblemstatement.Objectivescanvarydependingonthenatureoftheproject,suchasimproving accuracy,reducingcosts,enhancingcustomersatisfaction,oroptimizingbusinessprocesses.Each objectiveshouldbetiedtotheoverallprojectgoalsandcontributetoaddressingtheidentifiedproblem e ectively.
Page34IbonMartínez-Arranz
Inadditiontodefiningtheobjectives,datascientistsestablishkeyperformanceindicators(KPIs)that enablethemeasurementofprogressandsuccess.KPIsaremetricsorindicatorsthatquantifythe achievementofprojectobjectives.Theyserveasbenchmarksforevaluatingtheproject’sperformance anddeterminingwhetherthedesiredoutcomeshavebeenmet.
Theproblemdefinitionandobjectivesserveasthecompassfortheentireproject,guidingdecisionmaking,resourceallocation,andanalysismethodologies.Theyprovideaclearfocusanddirection, ensuringthattheprojectremainsalignedwiththeintendedpurposeanddeliversactionableinsights.
Bydedicatingsu icienttimeande orttoproblemdefinitionandobjective-setting,datascientists canlayasolidfoundationfortheproject,minimizingpotentialpitfallsandincreasingthechances ofsuccess.Itallowsforbetterunderstandingoftheproblemlandscape,e ectiveprojectscoping, andfacilitatesthedevelopmentofappropriatestrategiesandmethodologiestotackletheidentified challenges.
Inconclusion,problemdefinitionandobjective-settingarecriticalcomponentsofproject planningindatascience.Throughacollaborativeprocess,datascientistsworkwith stakeholderstounderstandtheproblem,articulateclearobjectives,andestablishrelevantKPIs.Thisprocesssetsthedirectionfortheproject,ensuringthattheanalysise orts alignwiththeproblemathandandcontributetomeaningfuloutcomes.Byestablishinga strongproblemdefinitionandwell-definedobjectives,datascientistscane ectivelynavigatethecomplexitiesoftheprojectandincreasethelikelihoodofdeliveringactionable insightsthataddresstheidentifiedproblem.
Indatascienceprojects,theselectionofappropriatemodelingtechniquesisacrucialstepthatsignificantlyinfluencesthequalityande ectivenessoftheanalysis.Modelingtechniquesencompassa widerangeofalgorithmsandapproachesthatareusedtoanalyzedata,makepredictions,andderive insights.Thechoiceofmodelingtechniquesdependsonvariousfactors,includingthenatureofthe problem,availabledata,desiredoutcomes,andthedomainexpertiseofthedatascientists.
Whenselectingmodelingtechniques,datascientistsassessthespecificrequirementsoftheproject andconsiderthestrengthsandlimitationsofdi erentapproaches.Theyevaluatethesuitabilityof variousalgorithmsbasedonfactorssuchasinterpretability,scalability,complexity,accuracy,andthe abilitytohandletheavailabledata.
Onecommoncategoryofmodelingtechniquesisstatisticalmodeling,whichinvolvestheapplication ofstatisticalmethodstoanalyzedataandidentifyrelationshipsbetweenvariables.Thismayinclude
techniquessuchaslinearregression,logisticregression,timeseriesanalysis,andhypothesistesting.Statisticalmodelingprovidesasolidfoundationforunderstandingtheunderlyingpatternsand relationshipswithinthedata.
Machinelearningtechniquesareanotherkeycategoryofmodelingtechniqueswidelyusedindata scienceprojects.Machinelearningalgorithmsenabletheextractionofcomplexpatternsfromdata andthedevelopmentofpredictivemodels.Thesetechniquesincludedecisiontrees,randomforests, supportvectormachines,neuralnetworks,andensemblemethods.Machinelearningalgorithms canhandlelargedatasetsandareparticularlye ectivewhendealingwithhigh-dimensionaland unstructureddata.
Deeplearning,asubsetofmachinelearning,hasgainedsignificantattentioninrecentyearsduetoits abilitytolearnhierarchicalrepresentationsfromrawdata.Deeplearningtechniques,suchasconvolutionalneuralnetworks(CNNs)andrecurrentneuralnetworks(RNNs),haveachievedremarkable successinimagerecognition,naturallanguageprocessing,andotherdomainswithcomplexdata structures.
Additionally,dependingontheprojectrequirements,datascientistsmayconsiderothermodeling techniquessuchasclustering,dimensionalityreduction,associationrulemining,andreinforcement learning.Eachtechniquehasitsownstrengthsandissuitableforspecifictypesofproblemsand data.
Theselectionofmodelingtechniquesalsoinvolvesconsideringtrade-o sbetweenaccuracyand interpretability.Whilecomplexmodelsmayo erhigherpredictiveaccuracy,theycanbechallenging tointerpretandmaynotprovideactionableinsights.Ontheotherhand,simplermodelsmaybe moreinterpretablebutmaysacrificepredictiveperformance.Datascientistsneedtostrikeabalance betweenaccuracyandinterpretabilitybasedontheproject’sgoalsandconstraints.
Toaidintheselectionofmodelingtechniques,datascientistso enrelyonexploratorydataanalysis (EDA)andpreliminarymodelingtogaininsightsintothedatacharacteristicsandidentifypotential relationships.Theyalsoleveragetheirdomainexpertiseandconsultrelevantliteratureandresearch todeterminethemostsuitabletechniquesforthespecificproblemathand.
Furthermore,theavailabilityoftoolsandlibrariesplaysacrucialroleintheselectionofmodeling techniques.Datascientistsconsiderthecapabilitiesandeaseofuseofvariousso warepackages, programminglanguages,andframeworksthatsupportthechosentechniques.Populartoolsinthe datascienceecosystem,suchasPython’sscikit-learn,TensorFlow,andR’scaretpackage,providea widerangeofmodelingalgorithmsandresourcesfore icientimplementationandevaluation.
Inconclusion,theselectionofmodelingtechniquesisacriticalaspectofprojectplanning indatascience.Datascientistscarefullyevaluatetheproblemrequirements,available data,anddesiredoutcomestochoosethemostappropriatetechniques.Statistical modeling,machinelearning,deeplearning,andothertechniqueso eradiversesetof approachestoextractinsightsandbuildpredictivemodels.Byconsideringfactorssuch asinterpretability,scalability,andthecharacteristicsoftheavailabledata,datascientists canmakeinformeddecisionsandmaximizethechancesofderivingmeaningfuland accurateinsightsfromtheirdata.
Indatascienceprojects,theselectionofappropriatetoolsandtechnologiesisvitalfore icientand e ectiveprojectexecution.Thechoiceoftoolsandtechnologiescangreatlyimpacttheproductivity, scalability,andoverallsuccessofthedatascienceworkflow.Datascientistscarefullyevaluatevarious factors,includingtheprojectrequirements,datacharacteristics,computationalresources,andthe specifictasksinvolved,tomakeinformeddecisions.
Whenselectingtoolsandtechnologiesfordatascienceprojects,oneoftheprimaryconsiderations istheprogramminglanguage.PythonandRaretwopopularlanguagesextensivelyusedindata scienceduetotheirrichecosystemoflibraries,frameworks,andpackagestailoredfordataanalysis, machinelearning,andvisualization.Python,withitsversatilityandextensivesupportfromlibraries suchasNumPy,pandas,scikit-learn,andTensorFlow,providesaflexibleandpowerfulenvironmentfor end-to-enddatascienceworkflows.R,ontheotherhand,excelsinstatisticalanalysisandvisualization, withpackageslikedplyr,ggplot2,andcaretbeingwidelyutilizedbydatascientists.
Thechoiceofintegrateddevelopmentenvironments(IDEs)andnotebooksisanotherimportantconsideration.JupyterNotebook,whichsupportsmultipleprogramminglanguages,hasgainedsignificant popularityinthedatasciencecommunityduetoitsinteractiveandcollaborativenature.Itallows datascientiststocombinecode,visualizations,andexplanatorytextinasingledocument,facilitating reproducibilityandsharingofanalysisworkflows.OtherIDEssuchasPyCharm,RStudio,andSpyder providerobustenvironmentswithadvanceddebugging,codecompletion,andprojectmanagement features.
Datastorageandmanagementsolutionsarealsocriticalindatascienceprojects.Relationaldatabases, suchasPostgreSQLandMySQL,o erstructuredstorageandpowerfulqueryingcapabilities,making themsuitableforhandlingstructureddata.NoSQLdatabaseslikeMongoDBandCassandraexcel inhandlingunstructuredandsemi-structureddata,o eringscalabilityandflexibility.Additionally, cloud-basedstorageanddataprocessingservices,suchasAmazonS3andGoogleBigQuery,provide
IbonMartínez-ArranzPage37
on-demandscalabilityandcost-e ectivenessforlarge-scaledataprojects.
Fordistributedcomputingandbigdataprocessing,technologieslikeApacheHadoopandApacheSpark arecommonlyused.Theseframeworksenabletheprocessingoflargedatasetsacrossdistributed clusters,facilitatingparallelcomputingande icientdataprocessing.ApacheSpark,withitssupport forvariousprogramminglanguagesandhigh-speedin-memoryprocessing,hasbecomeapopular choiceforbigdataanalytics.
Visualizationtoolsplayacrucialroleincommunicatinginsightsandfindingsfromdataanalysis. LibrariessuchasMatplotlib,Seaborn,andPlotlyinPython,aswellasggplot2inR,providerich visualizationcapabilities,allowingdatascientiststocreateinformativeandvisuallyappealingplots, charts,anddashboards.BusinessintelligencetoolslikeTableauandPowerBIo erinteractiveand user-friendlyinterfacesfordataexplorationandvisualization,enablingnon-technicalstakeholdersto gaininsightsfromtheanalysis.
Versioncontrolsystems,suchasGit,areessentialformanagingcodeandcollaboratingwithteam members.Gitenablesdatascientiststotrackchanges,managedi erentversionsofcode,andfacilitate seamlesscollaboration.Itensuresreproducibility,traceability,andaccountabilitythroughoutthedata scienceworkflow.
Inconclusion,theselectionoftoolsandtechnologiesisacrucialaspectofprojectplanningindatascience.Datascientistscarefullyevaluateprogramminglanguages,IDEs, datastoragesolutions,distributedcomputingframeworks,visualizationtools,andversioncontrolsystemstocreateawell-roundedande icientworkflow.Thechosentools andtechnologiesshouldalignwiththeprojectrequirements,datacharacteristics,and computationalresourcesavailable.Byleveragingtherightsetoftools,datascientistscan streamlinetheirworkflows,enhanceproductivity,anddeliverhigh-qualityandimpactful resultsintheirdatascienceprojects.
DataScienceWorkflowManagement
Purpose Library Description
Website
DataAnalysis NumPy Numericalcomputinglibraryfore icientarray operations NumPy pandas Datamanipulationandanalysislibrary pandas SciPy Scientificcomputinglibraryforadvanced mathematicalfunctionsandalgorithms SciPy scikit-learn Machinelearninglibrarywithvariousalgorithms andutilities scikit-learn
statsmodels Statisticalmodelingandtestinglibrary statsmodels
Table1: DataanalysislibrariesinPython.
Purpose Library Description
Visualization Matplotlib MatplotlibisaPythonlibraryforcreatingvarious typesofdatavisualizations,suchaschartsand graphs
Seaborn
Website
Matplotlib
Statisticaldatavisualizationlibrary Seaborn Plotly Interactivevisualizationlibrary Plotly ggplot2 GrammarofGraphics-basedplottingsystem (Pythonvia plotnine) ggplot2
Altair
AltairisaPythonlibraryfordeclarativedatavisualization.ItprovidesasimpleandintuitiveAPIfor creatinginteractiveandinformativechartsfrom data
Table2: DatavisualizationlibrariesinPython.
Altair
Purpose Library Description Website
Deep Learning TensorFlow
Keras
Open-sourcedeeplearningframework TensorFlow
High-levelneuralnetworksAPI(workswith TensorFlow) Keras
PyTorch Deeplearningframeworkwithdynamic computationalgraphs PyTorch
Table3: DeeplearningframeworksinPython.
Purpose Library Description
Database SQLAlchemy
PyMySQL
SQLtoolkitandObject-RelationalMapping(ORM) library
Pure-PythonMySQLclientlibrary
psycopg2 PostgreSQLadapterforPython
SQLite3 Python’sbuilt-inSQLite3module
Website
SQLAlchemy
PyMySQL
psycopg2
SQLite3 DuckDB DuckDBisahigh-performance,in-memory databaseenginedesignedforinteractivedata analytics
Table4: DatabaselibrariesinPython.
DuckDB
Purpose Library Description Website
Workflow Jupyter Notebook
Apache Airflow
Interactiveandcollaborativecodingenvironment Jupyter
Platformtoprogrammaticallyauthor,schedule, andmonitorworkflows
Apache Airflow Luigi Pythonpackageforbuildingcomplexpipelinesof batchjobs Luigi Dask ParallelcomputinglibraryforscalingPython workflows Dask
Table5: WorkflowandtaskautomationlibrariesinPython.
Purpose Library Description Website
Version Control Git Distributedversioncontrolsystem Git
GitHub
GitLab
Web-basedGitrepositoryhostingservice
GitHub
Web-basedGitrepositorymanagementandCI/CD platform GitLab
Table6: Versioncontrolandrepositoryhostingservices.
Intherealmofdatascienceprojectplanning,workflowdesignplaysapivotalroleinensuringa systematicandorganizedapproachtodataanalysis.Workflowdesignreferstotheprocessofdefining thesteps,dependencies,andinteractionsbetweenvariouscomponentsoftheprojecttoachievethe desiredoutcomese icientlyande ectively.
Thedesignofadatascienceworkflowinvolvesseveralkeyconsiderations.Firstandforemost,itis crucialtohaveaclearunderstandingoftheprojectobjectivesandrequirements.Thisinvolvesclosely collaboratingwithstakeholdersanddomainexpertstoidentifythespecificquestionstobeanswered, thedatatobecollectedoranalyzed,andtheexpecteddeliverables.Byclearlydefiningtheproject scopeandobjectives,datascientistscanestablishasolidfoundationforthesubsequentworkflow design.
Oncetheobjectivesaredefined,thenextstepinworkflowdesignistobreakdowntheprojectinto smaller,manageabletasks.Thisinvolvesidentifyingthesequentialandparalleltasksthatneedtobe performed,consideringthedependenciesandprerequisitesbetweenthem.Itiso enhelpfultocreate avisualrepresentation,suchasaflowchartoraGanttchart,toillustratethetaskdependenciesand timelines.Thisallowsdatascientiststovisualizetheoverallprojectstructureandidentifypotential bottlenecksorareasthatrequirespecialattention.
Anothercrucialaspectofworkflowdesignistheallocationofresources.Thisincludesidentifyingthe teammembersandtheirrespectiverolesandresponsibilities,aswellasdeterminingtheavailability ofcomputationalresources,datastorage,andso waretools.Byallocatingresourcese ectively,data scientistscanensuresmoothcollaboration,e icienttaskexecution,andtimelycompletionofthe project.
Inadditiontotaskallocation,workflowdesignalsoinvolvesconsideringtheappropriatesequencing oftasks.Thisincludesdeterminingtheorderinwhichtasksshouldbeperformedbasedontheir dependenciesandprerequisites.Forexample,datacleaningandpreprocessingtasksmayneedto becompletedbeforethemodeltrainingandevaluationstages.Bycarefullysequencingthetasks, datascientistscanavoidunnecessaryreworkandensurealogicalflowofactivitiesthroughoutthe project.
Moreover,workflowdesignalsoencompassesconsiderationsforqualityassuranceandtesting.Data scientistsneedtoplanforregularcheckpointsandreviewstovalidatetheintegrityandaccuracyof theanalysis.Thismayinvolvecross-validationtechniques,independentdatavalidation,orpeercode reviewstoensurethereliabilityandreproducibilityoftheresults.
Toaidinworkflowdesignandmanagement,varioustoolsandtechnologiescanbeleveraged.Workflow managementsystemslikeApacheAirflow,Luigi,orDaskprovideaframeworkfordefining,scheduling, andmonitoringtheexecutionoftasksinadatapipeline.Thesetoolsenabledatascientiststoautomate
andorchestratecomplexworkflows,ensuringthattasksareexecutedinthedesiredorderandwiththe necessarydependencies.
Workflowdesignisacriticalcomponentofprojectplanningindatascience.Itinvolves thethoughtfulorganizationandstructuringoftasks,resourceallocation,sequencing, andqualityassurancetoachievetheprojectobjectivese iciently.Bycarefullydesigning theworkflowandleveragingappropriatetoolsandtechnologies,datascientistscan streamlinetheprojectexecution,enhancecollaboration,anddeliverhigh-qualityresults inatimelymanner.
Inthispracticalexample,wewillexplorehowtoutilizeaprojectmanagementtooltoplanandorganize theworkflowofadatascienceprojecte ectively.Aprojectmanagementtoolprovidesacentralized platformtotracktasks,monitorprogress,collaboratewithteammembers,andensuretimelyproject completion.Let’sdiveintothestep-by-stepprocess:
• DefineProjectGoalsandObjectives:Startbyclearlydefiningthegoalsandobjectivesofyour datascienceproject.Identifythekeydeliverables,timelines,andsuccesscriteria.Thiswill provideacleardirectionfortheentireproject.
• BreakDowntheProjectintoTasks:Dividetheprojectintosmaller,manageabletasks.For example,youcanhavetaskssuchasdatacollection,datapreprocessing,exploratorydata analysis,modeldevelopment,modelevaluation,andresultinterpretation.Makesuretoconsider dependenciesandprerequisitesbetweentasks.
• CreateaProjectSchedule:Determinethesequenceandtimelineforeachtask.Usetheproject managementtooltocreateaschedule,assigningstartandenddatesforeachtask.Consider taskdependenciestoensurealogicalflowofactivities.
• AssignResponsibilities:Assignteammemberstoeachtaskbasedontheirexpertiseandavailability.Clearlycommunicaterolesandresponsibilitiestoensureeveryoneunderstandstheir contributionstotheproject.
• TrackTaskProgress:Regularlyupdatetheprojectmanagementtoolwiththeprogressofeach task.Updatetaskstatus,addcomments,andhighlightanychallengesorroadblocks.This providestransparencyandallowsteammemberstostayinformedabouttheproject’sprogress.
• CollaborateandCommunicate:Leveragethecollaborationfeaturesoftheprojectmanagement tooltofacilitatecommunicationamongteammembers.Usethetool’smessagingorcommenting functionalitiestodiscusstask-relatedissues,shareinsights,andseekfeedback.
• MonitorandManageResources:Utilizetheprojectmanagementtooltomonitorandmanage resources.Thisincludestrackingdatastorage,computationalresources,so warelicenses, andanyotherrelevantprojectassets.Ensurethatresourcesareallocatede ectivelytoavoid bottlenecksordelays.
• ManageProjectRisks:Identifypotentialrisksanduncertaintiesthatmayimpacttheproject. Utilizetheprojectmanagementtool’sriskmanagementfeaturestodocumentandtrackrisks, assignriskowners,anddevelopmitigationstrategies.
• ReviewandEvaluate:Conductregularprojectreviewstoevaluatetheprogressandqualityof work.Usetheprojectmanagementtooltodocumentreviewoutcomes,capturelessonslearned, andmakenecessaryadjustmentstotheworkflowifrequired.
Byfollowingthesestepsandleveragingaprojectmanagementtool,datascienceprojectscanbenefit fromimprovedorganization,enhancedcollaboration,ande icientworkflowmanagement.Thetool servesasacentralhubforproject-relatedinformation,enablingdatascientiststostayfocused,track progress,andultimatelydeliversuccessfuloutcomes.
Remember,therearevariousprojectmanagementtoolsavailable,suchasTrello,Asana, orJira,eacho eringdi erentfeaturesandfunctionalities.Chooseatoolthatalignswith yourprojectrequirementsandteampreferencestomaximizeproductivityandproject success. IbonMartínez-ArranzPage43
DataAcquisitionandPreparation:UnlockingthePowerofDatainDataScienceProjects
Intherealmofdatascienceprojects,dataacquisitionandpreparationarefundamentalstepsthat laythefoundationforsuccessfulanalysisandinsightsgeneration.Thisstageinvolvesobtaining relevantdatafromvarioussources,transformingitintoasuitableformat,andperformingnecessary preprocessingstepstoensureitsqualityandusability.Let’sdelveintotheintricaciesofdataacquisition andpreparationandunderstandtheirsignificanceinthecontextofdatascienceprojects.

Intheareaofdatascienceprojects,dataacquisitionandpreparationserveasfoundationalstepsthat underpinthesuccessfulgenerationofinsightsandanalysis.Duringthisphase,thefocusisonsourcing pertinentdatafromdiverseorigins,convertingitintoanappropriateformat,andexecutingessential preprocessingprocedurestoguaranteeitsqualityandsuitabilityforuse.Imagegeneratedwith DALL-E.
Dataacquisitionencompassestheprocessofgatheringdatafromdiversesources.Thisinvolvesidentifyingandaccessingrelevantdatasets,whichcanrangefromstructureddataindatabases,unstructured datafromtextdocumentsorimages,toreal-timestreamingdata.Thesourcesmayincludeinternal datarepositories,publicdatasets,APIs,webscraping,orevendatageneratedfromInternetofThings (IoT)devices.
Duringthedataacquisitionphase,itiscrucialtoensuredataintegrity,authenticity,andlegality.Data scientistsmustadheretoethicalguidelinesandcomplywithdataprivacyregulationswhenhandling sensitiveinformation.Additionally,itisessentialtovalidatethedatasourcesandassessthequalityof theacquireddata.Thisinvolvescheckingformissingvalues,outliers,andinconsistenciesthatmight a ectthesubsequentanalysis.
Oncethedataisacquired,ito enrequirespreprocessingandpreparationbeforeitcanbee ectively utilizedforanalysis.Datapreparationinvolvestransformingtherawdataintoastructuredformat thatalignswiththeproject’sobjectivesandrequirements.Thisprocessincludescleaningthedata, handlingmissingvalues,addressingoutliers,andencodingcategoricalvariables.
Cleaningthedatainvolvesidentifyingandrectifyinganyerrors,inconsistencies,oranomaliespresent inthedataset.Thismayincluderemovingduplicaterecords,correctingdataentrymistakes,and standardizingformats.Furthermore,handlingmissingvaluesiscrucial,astheycanimpacttheaccuracy andreliabilityoftheanalysis.Techniquessuchasimputationordeletioncanbeemployedtoaddress missingdatabasedonthenatureandcontextoftheproject.
Dealingwithoutliersisanotheressentialaspectofdatapreparation.Outlierscansignificantlyinfluence statisticalmeasuresandmachinelearningmodels.Detectingandtreatingoutliersappropriatelyhelps maintaintheintegrityoftheanalysis.Varioustechniques,suchasstatisticalmethodsordomain knowledge,canbeemployedtoidentifyandmanageoutlierse ectively.
Additionally,datapreparationinvolvestransformingcategoricalvariablesintonumericalrepresentationsthatmachinelearningalgorithmscanprocess.Thismayinvolvetechniqueslikeone-hot encoding,labelencoding,orordinalencoding,dependingonthenatureofthedataandtheanalytical objectives.
Datapreparationalsoincludesfeatureengineering,whichinvolvescreatingnewderivedfeaturesor selectingrelevantfeaturesthatcontributetotheanalysis.Thisstephelpstoenhancethepredictive powerofmodelsandimproveoverallperformance.
Conclusion:EmpoweringDataScienceProjects
Dataacquisitionandpreparationserveascrucialbuildingblocksforsuccessfuldatascienceprojects. Thesestagesensurethatthedataisobtainedfromreliablesources,undergoesnecessarytransforma-
tions,andispreparedforanalysis.Thequality,accuracy,andappropriatenessoftheacquiredand prepareddatasignificantlyimpactthesubsequentsteps,suchasexploratorydataanalysis,modeling, anddecision-making.
Byinvestingtimeande ortinrobustdataacquisitionandpreparation,datascientistscanunlockthe fullpotentialofthedataandderivemeaningfulinsights.Throughcarefuldataselection,validation, cleaning,andtransformation,theycanovercomedata-relatedchallengesandlayasolidfoundation foraccurateandimpactfuldataanalysis.
Intherealmofdatascience,dataacquisitionplaysapivotalroleinenablingorganizationstoharness thepowerofdataformeaningfulinsightsandinformeddecision-making.Dataacquisitionreferstothe processofgathering,collecting,andobtainingdatafromvarioussourcestosupportanalysis,research, orbusinessobjectives.Itinvolvesidentifyingrelevantdatasources,retrievingdata,andensuringits quality,integrity,andcompatibilityforfurtherprocessing.
Dataacquisitionencompassesawiderangeofmethodsandtechniquesusedtocollectdata.Itcan involveaccessingstructureddatafromdatabases,scrapingunstructureddatafromwebsites,capturingdatainreal-timefromsensorsordevices,orobtainingdatathroughsurveys,questionnaires,or experiments.Thechoiceofdataacquisitionmethodsdependsonthespecificrequirementsofthe project,thenatureofthedata,andtheavailableresources.
Thesignificanceofdataacquisitionliesinitsabilitytoprovideorganizationswithawealthofinformationthatcandrivestrategicdecision-making,enhanceoperationale iciency,anduncovervaluable insights.Bygatheringrelevantdata,organizationscangainacomprehensiveunderstandingoftheir customers,markets,products,andprocesses.This,inturn,empowersthemtooptimizeoperations, identifyopportunities,mitigaterisks,andinnovateinarapidlyevolvinglandscape.
Toensurethee ectivenessofdataacquisition,itisessentialtoconsiderseveralkeyaspects.Firstand foremost,datascientistsandresearchersmustdefinetheobjectivesandrequirementsoftheproject todeterminethetypesofdataneededandtheappropriatesourcestoexplore.Theyneedtoidentify reliableandtrustworthydatasourcesthatalignwiththeproject’sobjectivesandcomplywithethical andlegalconsiderations.
Moreover,dataqualityisofutmostimportanceinthedataacquisitionprocess.Itinvolvesevaluating theaccuracy,completeness,consistency,andrelevanceofthecollecteddata.Dataqualityassessment helpsidentifyandaddressissuessuchasmissingvalues,outliers,errors,orbiasesthatmayimpact thereliabilityandvalidityofsubsequentanalyses.
Astechnologycontinuestoevolve,dataacquisitionmethodsareconstantlyevolvingaswell.Advancementsindataacquisitiontechniques,suchaswebscraping,APIs,IoTdevices,andmachinelearning algorithms,haveexpandedthepossibilitiesofaccessingandcapturingdata.Thesetechnologies enableorganizationstoacquirevastamountsofdatainreal-time,providingvaluableinsightsfor dynamicdecision-making.
Dataacquisitionservesasacriticalfoundationforsuccessfuldata-drivenprojects.By e ectivelyidentifying,collecting,andensuringthequalityofdata,organizationscan unlockthepotentialofdatatogainvaluableinsightsanddriveinformeddecision-making. Itisthroughstrategicdataacquisitionpracticesthatorganizationscanderiveactionable intelligence,staycompetitive,andfuelinnovationintoday’sdata-drivenworld.
Indatascience,theselectionofdatasourcesplaysacrucialroleindeterminingthesuccessande icacy ofanydata-drivenproject.Choosingtherightdatasourcesisacriticalstepthatinvolvesidentifying, evaluating,andselectingthemostrelevantandreliablesourcesofdataforanalysis.Theselection processrequirescarefulconsiderationoftheproject’sobjectives,datarequirements,qualitystandards, andavailableresources.
Datasourcescanvarywidely,encompassinginternalorganizationaldatabases,publiclyavailable datasets,third-partydataproviders,webAPIs,socialmediaplatforms,andIoTdevices,amongothers. Eachsourceo ersuniqueopportunitiesandchallenges,andselectingtheappropriatesourcesisvital toensuretheaccuracy,relevance,andvalidityofthecollecteddata.
Thefirststepintheselectionofdatasourcesisdefiningtheproject’sobjectivesandidentifyingthe specificdatarequirements.Thisinvolvesunderstandingthequestionsthatneedtobeanswered,the variablesofinterest,andthecontextinwhichtheanalysiswillbeconducted.Byclearlydefiningthe scopeandgoalsoftheproject,datascientistscanidentifythetypesofdataneededandthepotential sourcesthatcanproviderelevantinformation.
Oncetheobjectivesandrequirementsareestablished,thenextstepistoevaluatetheavailabledata sources.Thisevaluationprocessentailsassessingthequality,reliability,andaccessibilityofthedata sources.Factorssuchasdataaccuracy,completeness,timeliness,andrelevanceneedtobeconsidered. Additionally,itiscrucialtoevaluatethecredibilityandreputationofthedatasourcestoensurethe integrityofthecollecteddata.
Furthermore,datascientistsmustconsiderthefeasibilityandpracticalityofaccessingandacquiring datafromvarioussources.Thisinvolvesevaluatingtechnicalconsiderations,suchasdataformats,
datavolume,datatransfermechanisms,andanylegalorethicalconsiderationsassociatedwiththe datasources.Itisessentialtoensurecompliancewithdataprivacyregulationsandethicalguidelines whendealingwithsensitiveorpersonaldata.
Theselectionofdatasourcesrequiresabalancebetweentherichnessofthedataandtheavailable resources.Sometimes,compromisesmayneedtobemadeduetolimitationsintermsofdataavailability,cost,ortimeconstraints.Datascientistsmustweighthepotentialbenefitsofusingcertaindata sourcesagainsttheassociatedcostsande ortrequiredfordataacquisitionandpreparation.
Theselectionofdatasourcesisacriticalstepinanydatascienceproject.Bycarefully consideringtheproject’sobjectives,datarequirements,qualitystandards,andavailable resources,datascientistscanchoosethemostrelevantandreliablesourcesofdata foranalysis.Thisthoughtfulselectionprocesssetsthestageforaccurate,meaningful, andimpactfuldataexplorationandanalysis,leadingtovaluableinsightsandinformed decision-making.
Inthedynamicfieldofdatascience,dataextractionandtransformationarefundamentalprocesses thatenableorganizationstoextractvaluableinsightsfromrawdataandmakeitsuitableforanalysis. Theseprocessesinvolvegatheringdatafromvarioussources,cleaning,reshaping,andintegrating itintoaunifiedandmeaningfulformatthatcanbee ectivelyutilizedforfurtherexplorationand analysis.
Dataextractionencompassestheretrievalandacquisitionofdatafromdiversesourcessuchas databases,webpages,APIs,spreadsheets,ortextfiles.Thechoiceofextractiontechniquedepends onthenatureofthedatasourceandthedesiredoutputformat.Commontechniquesincludeweb scraping,databasequerying,fileparsing,andAPIintegration.Thesetechniquesallowdatascientists toaccessandcollectstructured,semi-structured,orunstructureddata.
Oncethedataisacquired,ito enrequirestransformationtoensureitsquality,consistency,and compatibilitywiththeanalysisprocess.Datatransformationinvolvesaseriesofoperations,including cleaning,filtering,aggregating,normalizing,andenrichingthedata.Theseoperationshelpeliminate inconsistencies,handlemissingvalues,dealwithoutliers,andconvertdataintoastandardizedformat.Transformationalsoinvolvescreatingnewderivedvariables,combiningdatasets,orintegrating externaldatasourcestoenhancetheoverallqualityandusefulnessofthedata.
Intherealmofdatascience,severalpowerfulprogramminglanguagesandpackageso erextensive capabilitiesfordataextractionandtransformation.InPython,thepandaslibraryiswidelyusedfor
IbonMartínez-ArranzPage49
datamanipulation,providingarichsetoffunctionsandtoolsfordatacleaning,filtering,aggregation, andmerging.Ito ersconvenientdatastructures,suchasDataFrames,whichenablee icienthandling oftabulardata.
R,anotherpopularlanguageinthedatasciencerealm,o ersvariouspackagesfordataextractionand transformation.Thedplyrpackageprovidesaconsistentandintuitivesyntaxfordatamanipulation tasks,includingfiltering,grouping,summarizing,andjoiningdatasets.Thetidyrpackagefocuseson reshapingandtidyingdata,allowingforeasyhandlingofmissingvaluesandreshapingdataintothe desiredformat.
Inadditiontopandasanddplyr,severalotherPythonandRpackagesplaysignificantrolesindata extractionandtransformation.BeautifulSoupandScrapyarewidelyusedPythonlibrariesforweb scraping,enablingdataextractionfromHTMLandXMLdocuments.InR,theXMLandrvestpackagesoffersimilarcapabilities.ForworkingwithAPIs,requestsandhttrpackagesinPythonandR,respectively, providestraightforwardmethodsforretrievingdatafromwebservices.
Thepowerofdataextractionandtransformationliesintheirabilitytoconvertrawdataintoaclean, structured,andunifiedformthatfacilitatese icientanalysisandmeaningfulinsights.Theseprocesses areessentialfordatascientiststoensuretheaccuracy,reliability,andintegrityofthedatatheywork with.Byleveragingthecapabilitiesofprogramminglanguagesandpackagesdesignedfordataextractionandtransformation,datascientistscanunlockthefullpotentialoftheirdataanddriveimpactful discoveriesinthefieldofdatascience.
Purpose Library/Package Description
Data Manipulation pandas
dplyr
WebScraping BeautifulSoup
Scrapy
XML
API Integration requests
httr
Website
Apowerfullibraryfordatamanipulation andanalysisinPython,providingdata structuresandfunctionsfordatacleaning andtransformation. pandas
ApopularpackageinRfordata manipulation,o eringaconsistent syntaxandfunctionsforfiltering,grouping, andsummarizingdata.
APythonlibraryforparsingHTMLand XMLdocuments,commonlyusedforweb scraping andextractingdatafromweb pages.
APythonframeworkforweb scraping, providing ahigh-levelAPIforextracting datafromwebsitese iciently.
AnRpackageforworkingwithXMLdata, o ering functionstoparse, manipulate, andextractinformationfromXML documents.
dplyr
BeautifulSoup
Scrapy
XML
APythonlibraryformakingHTTPrequests, commonlyusedforinteractingwithAPIs andretrievingdatafromwebservices. requests
AnRpackageformakingHTTPrequests, providingfunctionsforinteractingwithweb servicesandAPIs.
Table1: Librariesandpackagesfordatamanipulation,webscraping,andAPIintegration.
Theselibrariesandpackagesarewidelyusedinthedatasciencecommunityando erpowerfulfunctionalitiesforvariousdata-relatedtasks,suchasdatamanipulation,webscraping,andAPIintegration. Feelfreetoexploretheirrespectivewebsitesformoreinformation,documentation,andexamplesof theirusage.
IbonMartínez-ArranzPage51
DataCleaning:EnsuringDataQualityforE ectiveAnalysis
Datacleaning,alsoknownasdatacleansingordatascrubbing,isacrucialstepinthedatascience workflowthatfocusesonidentifyingandrectifyingerrors,inconsistencies,andinaccuracieswithin datasets.Itisanessentialprocessthatprecedesdataanalysis,asthequalityandreliabilityofthedata directlyimpactthevalidityandaccuracyoftheinsightsderivedfromit.
Theimportanceofdatacleaningliesinitsabilitytoenhancedataquality,reliability,andintegrity. Byaddressingissuessuchasmissingvalues,outliers,duplicateentries,andinconsistentformatting, datacleaningensuresthatthedataisaccurate,consistent,andsuitableforanalysis.Cleandataleads tomorereliableandrobustresults,enablingdatascientiststomakeinformeddecisionsanddraw meaningfulinsights.
Severalcommontechniquesareemployedindatacleaning,including:
• HandlingMissingData:Dealingwithmissingvaluesbyimputation,deletion,orinterpolation methodstoavoidbiasedorerroneousanalyses.
• OutlierDetection:Identifyingandaddressingoutliers,whichcansignificantlyimpactstatistical measuresandmodels.
• DataDeduplication:Identifyingandremovingduplicateentriestoavoidduplicationbiasand ensuredataintegrity.
• StandardizationandFormatting:Convertingdataintoaconsistentformat,ensuringuniformity andcompatibilityacrossvariables.
• DataValidationandVerification:Verifyingtheaccuracy,completeness,andconsistencyofthe datathroughvariousvalidationtechniques.
• DataTransformation:Convertingdataintoasuitableformat,suchasscalingnumericalvariables ortransformingcategoricalvariables.
PythonandRo erarichecosystemoflibrariesandpackagesthataidindatacleaningtasks.Some widelyusedlibrariesandpackagesfordatacleaninginPythoninclude:
Purpose Library/Package Description
MissingData Handling pandas
Outlier Detection scikit-learn
Data Deduplication pandas
Website
Aversatilelibraryfordatamanipulationin Python,providingfunctionsforhandling missingdata,imputation,anddata cleaning. pandas
Acomprehensivemachinelearninglibrary inPythonthato ersvariousoutlier detection algorithms,enablingrobust identificationandhandlingofoutliers.
scikit-learn
Alongsideitsdatamanipulation capabilities,pandasalsoprovidesmethods foridentifyingandremovingduplicatedata entries,ensuringdataintegrity. pandas
Data Formatting pandas pandaso ersextensive functionalities fordatatransformation,including datatypeconversion,formatting,and standardization. pandas
Data Validation pandas-schema
APythonlibrarythatenablesthevalidation andverificationofdataagainstpredefined schemaorconstraints,ensuringdata qualityandintegrity. pandasschema
Table2: KeyPythonlibrariesandpackagesfordatahandlingandprocessing.
Figure1: Essentialdatapreparationsteps:Fromhandlingmissingdatatodatatransformation.
InR,variouspackagesarespecificallydesignedfordatacleaningtasks:
Purpose Package Description Website
MissingData Handling tidyr
Outlier Detection dplyr
Data Formatting lubridate
DataValidation validate
ApackageinRthato ersfunctionsforhandlingmissingdata,reshapingdata,andtidyingdataintoaconsistentformat.
tidyr
Asapartofthetidyverse,dplyrprovidesfunctionsfor datamanipulationinR,includingoutlierdetection andhandling. dplyr
ApackageinRthatfacilitateshandlingandformattingdatesandtimes,ensuringconsistencyandcompatibilitywithinthedataset.
lubridate
AnRpackagethatprovidesadeclarativeapproach fordefiningvalidationrulesandvalidatingdata againstthem,ensuringdataqualityandintegrity. validate
Data Transformation tidyr tidyro ersfunctionsforreshapingandtransforming data,facilitatingtaskssuchaspivoting,gathering, andspreadingvariables.
stringr
Apackagethatprovidesvariousstringmanipulation functionsinR,usefulfordatacleaningtasksinvolvingtextdata.
Table3: EssentialRpackagesfordatahandlingandanalysis.
tidyr
stringr
Theselibrariesandpackageso erawiderangeoffunctionalitiesfordatacleaninginbothPython andR.Theyempowerdatascientiststoe icientlyhandlemissingdata,detectoutliers,removeduplicates,standardizeformatting,validatedata,andtransformvariablestoensurehigh-qualityand reliabledatasetsforanalysis.Feelfreetoexploretheirrespectivewebsitesformoreinformation, documentation,andexamplesoftheirusage.
Omicssciences,suchasmetabolomics,playacrucialroleinunderstandingthecomplexmolecularmechanismsunderlyingbiologicalsystems.Metabolomicsaimstoidentifyandquantifysmall moleculemetabolitesinbiologicalsamples,providingvaluableinsightsintovariousphysiologicaland pathologicalprocesses.However,thesuccessofmetabolomicsstudiesheavilyreliesonthequality andreliabilityofthedatagenerated,makingdatacleaninganessentialstepintheanalysispipeline.
Datacleaningisparticularlycriticalinmetabolomicsduetothehighdimensionalityandcomplexity ofthedata.Metabolomicdatasetso encontainalargenumberofvariables(metabolites)measured acrossmultiplesamples,leadingtoinherentchallengessuchasmissingvalues,batche ects,and instrumentvariations.Failingtoaddresstheseissuescanintroducebias,a ectstatisticalanalyses, andhindertheaccurateinterpretationofmetabolomicresults.
Toensurerobustandreliablemetabolomicdataanalysis,severaltechniquesarecommonlyapplied duringthedatacleaningprocess:
• MissingDataImputation:Sincemetabolomicdatasetsmayhavemissingvaluesduetovarious reasons(e.g.,analyticallimitations,lowabundance),imputationmethodsareemployedto estimateandfillinthemissingvalues,enablingtheinclusionofcompletedatainsubsequent analyses.
• BatchE ectCorrection:Batche ects,whicharisefromtechnicalvariationsduringsample processing,canobscuretruebiologicalsignalsinmetabolomicdata.Variousstatisticalmethods, suchasComBat,removeoradjustforbatche ects,allowingforaccuratecomparisonsand identificationofsignificantmetabolites.
• OutlierDetectionandRemoval:Outlierscanarisefromexperimentalerrorsorbiological variations,potentiallyskewingstatisticalanalyses.Robustoutlierdetectionmethods,suchas medianabsolutedeviation(MAD)orrobustregression,areemployedtoidentifyandremove outliers,ensuringtheintegrityofthedata.
• Normalization:Normalizationtechniques,suchasmedianscalingorprobabilisticquotient normalization(PQN),areappliedtoadjustforsystematicvariationsandensurecomparability betweensamples,enablingmeaningfulcomparisonsacrossdi erentexperimentalconditions.
• FeatureSelection:Inmetabolomics,featureselectionmethodshelpidentifythemostrelevant metabolitesassociatedwiththebiologicalquestionunderinvestigation.Byreducingthedimensionalityofthedata,thesetechniquesimprovemodelinterpretabilityandenhancethedetection ofmeaningfulmetabolicpatterns.
Datacleaninginmetabolomicsisarapidlyevolvingfield,andseveraltoolsandalgorithmshavebeen developedtoaddressthesechallenges.Notableso warepackagesincludeXCMS,MetaboAnalyst,and MZmine,whicho ercomprehensivefunctionalitiesfordatapreprocessing,qualitycontrol,anddata cleaninginmetabolomicsstudies.
Dataintegrationplaysacrucialroleindatascienceprojectsbycombiningandmergingdatafrom varioussourcesintoaunifiedandcoherentdataset.Itinvolvestheprocessofharmonizingdata
formats,resolvinginconsistencies,andlinkingrelatedinformationtocreateacomprehensiveviewof theunderlyingdomain.
Intoday’sdata-drivenworld,organizationso endealwithdisparatedatasources,includingdatabases, spreadsheets,APIs,andexternaldatasets.Eachsourcemayhaveitsownstructure,format,and semantics,makingitchallengingtoextractmeaningfulinsightsfromisolateddatasets.Dataintegration bridgesthisgapbybringingtogetherrelevantdataelementsandestablishingrelationshipsbetween them.
Theimportanceofdataintegrationliesinitsabilitytoprovideaholisticviewofthedata,enabling analystsanddatascientiststouncovervaluableconnections,patterns,andtrendsthatmaynotbe apparentinindividualdatasets.Byintegratingdatafrommultiplesources,organizationscangaina morecomprehensiveunderstandingoftheiroperations,customers,andmarketdynamics.
Therearevarioustechniquesandapproachesemployedindataintegration,rangingfrommanual datawranglingtoautomateddataintegrationtools.Commonmethodsincludedatatransformation, entityresolution,schemamapping,anddatafusion.Thesetechniquesaimtoensuredataconsistency, quality,andaccuracythroughouttheintegrationprocess.
Intherealmofdatascience,e ectivedataintegrationisessentialforconductingmeaningfulanalyses, buildingpredictivemodels,andmakinginformeddecisions.Itenablesdatascientiststoleveragea widerrangeofinformationandderiveactionableinsightsthatcandrivebusinessgrowth,enhance customerexperiences,andimproveoperationale iciency.
Moreover,advancementsindataintegrationtechnologieshavepavedthewayforreal-timeandnearreal-timedataintegration,allowingorganizationstocaptureandintegratedatainatimelymanner. ThisisparticularlyvaluableindomainssuchasIoT(InternetofThings)andstreamingdata,where dataiscontinuouslygeneratedandneedstobeintegratedrapidlyforimmediateanalysisanddecisionmaking.
Overall,dataintegrationisacriticalstepinthedatascienceworkflow,enablingorganizationstoharness thefullpotentialoftheirdataassetsandextractvaluableinsights.Itenhancesdataaccessibility, improvesdataquality,andfacilitatesmoreaccurateandcomprehensiveanalyses.Byemploying robustdataintegrationtechniquesandleveragingmodernintegrationtools,organizationscanunlock thepoweroftheirdataanddriveinnovationintheirrespectivedomains.
Inthispracticalexample,wewillexploretheprocessofusingadataextractionandcleaningtoolto prepareadatasetforanalysisinadatascienceproject.Thisworkflowwilldemonstratehowtoextract
datafromvarioussources,performnecessarydatacleaningoperations,andcreateawell-prepared datasetreadyforfurtheranalysis.
Thefirststepintheworkflowistoextractdatafromdi erentsources.Thismayinvolveretrievingdata fromdatabases,APIs,webscraping,oraccessingdatastoredindi erentfileformatssuchasCSV,Excel, orJSON.PopulartoolsfordataextractionincludePythonlibrarieslikepandas,BeautifulSoup,and requests,whichprovidefunctionalitiesforfetchingandparsingdatafromdi erentsources.
CSV(Comma-SeparatedValues):CSVfilesareacommonandsimplewayto storestructureddata.Theyconsistofplaintextwhereeachlinerepresentsa datarecord,andfieldswithineachrecordareseparatedbycommas.CSVfiles arewidelysupportedbyvariousprogramminglanguagesanddataanalysistools. TheyareeasytocreateandmanipulateusingtoolslikeMicroso Excel,Python’s Pandaslibrary,orR.CSVfilesareanexcellentchoicefortabulardata,makingthem suitablefortaskslikestoringdatasets,exportingdata,orsharinginformationina machine-readableformat.
JSON(JavaScriptObjectNotation):JSONfilesarealightweightandflexible datastorageformat.Theyarehuman-readableandeasytounderstand,making themapopularchoiceforbothdataexchangeandconfigurationfiles.JSONstores datainakey-valuepairformat,allowingfornestedstructures.Itisparticularly usefulforsemi-structuredorhierarchicaldata,suchasconfigurationsettings,API responses,orcomplexdataobjectsinwebapplications.JSONfilescanbeeasily parsedandgeneratedusingprogramminglanguageslikePython,JavaScript,and manyothers. IbonMartínez-ArranzPage57
Excelfiles,o enintheXLSXformat,arewidelyusedfordatastorageandanalysis, especiallyinbusinessandfinance.Theyprovideaspreadsheet-basedinterface thatallowsuserstoorganizedataintablesandperformcalculations,charts,and visualizations.Excelo ersarichsetoffeaturesfordatamanipulationandvisualization.Whileprimarilyknownforitsuser-friendlyinterface,Excelfilescanbe programmaticallyaccessedandmanipulatedusinglibrarieslikePython’sopenpyxlorlibrariesinotherlanguages.Theyaresuitableforstoringstructureddata thatrequiresmanualdataentry,complexcalculations,orpolishedpresentation.
Oncethedataisextracted,thenextcrucialstepisdatacleaning.Thisinvolvesaddressingissuessuch asmissingvalues,inconsistentformats,outliers,anddatainconsistencies.Datacleaningensuresthat thedatasetisaccurate,complete,andreadyforanalysis.Toolslikepandas,NumPy,anddplyr(inR) o erpowerfulfunctionalitiesfordatacleaning,includinghandlingmissingvalues,transformingdata types,removingduplicates,andperformingdatavalidation.
A ercleaningthedata,itiso ennecessarytoperformdatatransformationandfeatureengineeringto createnewvariablesormodifyexistingones.Thisstepinvolvesapplyingmathematicaloperations, aggregations,andcreatingderivedfeaturesthatarerelevanttotheanalysis.Pythonlibrariessuchas scikit-learn,TensorFlow,andPyTorch,aswellasRpackageslikecaretandtidymodels,o erawide rangeoffunctionsandmethodsfordatatransformationandfeatureengineering.
Insomecases,datafrommultiplesourcesmayneedtobeintegratedandmergedintoasingledataset. Thiscaninvolvecombiningdatasetsbasedoncommonidentifiersormergingdatasetswithsharedvariables.Toolslikepandas,dplyr,andSQL(StructuredQueryLanguage)enableseamlessdataintegration andmergingbyprovidingjoinandmergeoperations.
Beforeproceedingwiththeanalysis,itisessentialtoensurethequalityandintegrityofthedataset. Thisinvolvesvalidatingthedataagainstdefinedcriteria,checkingforoutliersorerrors,andconducting
dataqualityassessments.ToolslikeGreatExpectations,datavalidationlibrariesinPythonandR,and statisticaltechniquescanbeemployedtoperformdataqualityassuranceandverification.
Tomaintaintheintegrityandreproducibilityofthedatascienceproject,itiscrucialtoimplement dataversioninganddocumentationpractices.Thisinvolvestrackingchangesmadetothedataset, maintainingahistoryofdatatransformationsandcleaningoperations,anddocumentingthedata preprocessingsteps.VersioncontrolsystemslikeGit,alongwithprojectdocumentationtoolslike JupyterNotebook,canbeusedtotrackanddocumentchangesmadetothedataset.
Byfollowingthispracticalworkflowandleveragingtheappropriatetoolsandlibraries,datascientists cane icientlyextract,clean,andpreparedatasetsforanalysis.Itensuresthatthedatausedinthe projectisreliable,accurate,andinasuitableformatforthesubsequentstagesofthedatascience pipeline.
ExampleToolsandLibraries:
• Python:pandas,NumPy,BeautifulSoup,requests,scikit-learn,TensorFlow,PyTorch,Git,...
• R:dplyr,tidyr,caret,tidymodels,SQLite,RSQLite,Git,...
Thisexamplehighlightsaselectionoftoolscommonlyusedindataextractionandcleaningprocesses, butitisessentialtochoosethetoolsthatbestfitthespecificrequirementsandpreferencesofthedata scienceproject.
References
• SmithCA,WantEJ,O’MailleG,etal.“XCMS:ProcessingMassSpectrometryDataforMetabolite ProfilingUsingNonlinearPeakAlignment,Matching,andIdentification.”AnalyticalChemistry, vol.78,no.3,2006,pp.779-787.
• XiaJ,SinelnikovIV,HanB,WishartDS.“MetaboAnalyst3.0—MakingMetabolomicsMoreMeaningful.”NucleicAcidsResearch,vol.43,no.W1,2015,pp.W251-W257.
• PluskalT,CastilloS,Villar-BrionesA,OresicM.“MZmine2:ModularFrameworkforProcessing, Visualizing,andAnalyzingMassSpectrometry-BasedMolecularProfileData.”BMCBioinformatics, vol.11,no.1,2010,p.395.
IbonMartínez-ArranzPage59
ExploratoryDataAnalysis(EDA) isacrucialstepinthedatascienceworkflowthatinvolvesanalyzingandvisualizingdatatogaininsights,identifypatterns,andunderstand theunderlyingstructureofthedataset.Itplaysavitalroleinuncoveringrelationships, detectinganomalies,andinformingsubsequentmodelinganddecision-makingprocesses.

ExploratoryDataAnalysis(EDA)standsasanimportantphasewithinthedatascienceworkflow, encompassingtheexaminationandvisualizationofdatatogleaninsights,detectpatterns,and comprehendtheinherentstructureofthedataset.ImagegeneratedwithDALL-E.
TheimportanceofEDAliesinitsabilitytoprovideacomprehensiveunderstandingofthedatasetbefore
divingintomorecomplexanalysisormodelingtechniques.Byexploringthedata,datascientistscan identifypotentialissuessuchasmissingvalues,outliers,orinconsistenciesthatneedtobeaddressed beforeproceedingfurther.EDAalsohelpsinformulatinghypotheses,generatingideas,andguiding thedirectionoftheanalysis.
Thereareseveraltypesofexploratorydataanalysistechniquesthatcanbeapplieddependingonthe natureofthedatasetandtheresearchquestionsathand.Thesetechniquesinclude:
• DescriptiveStatistics:Descriptivestatisticsprovidesummarymeasuressuchasmean,median, standarddeviation,andpercentilestodescribethecentraltendency,dispersion,andshapeof thedata.Theyo eraquickoverviewofthedataset’scharacteristics.
• DataVisualization:Datavisualizationtechniques,suchasscatterplots,histograms,boxplots, andheatmaps,helpinvisuallyrepresentingthedatatoidentifypatterns,trends,andpotential outliers.Visualizationsmakeiteasiertointerpretcomplexdataanduncoverinsightsthatmay notbeevidentfromrawnumbersalone.
• CorrelationAnalysis:Correlationanalysisexplorestherelationshipsbetweenvariablestounderstandtheirinterdependence.Correlationcoe icients,scatterplots,andcorrelationmatrices areusedtoassessthestrengthanddirectionofassociationsbetweenvariables.
• DataTransformation:Datatransformationtechniques,suchasnormalization,standardization, orlogarithmictransformations,areappliedtomodifythedatadistribution,handleskewness,or improvethemodel’sassumptions.Thesetransformationscanhelprevealhiddenpatternsand makethedatamoresuitableforfurtheranalysis.
Byapplyingtheseexploratorydataanalysistechniques,datascientistscangainvaluableinsights intothedataset,identifypotentialissues,validateassumptions,andmakeinformeddecisionsabout subsequentdatamodelingoranalysisapproaches.
Exploratorydataanalysissetsthefoundationforacomprehensiveunderstandingofthedataset, allowingdatascientiststomakeinformeddecisionsanduncovervaluableinsightsthatdrivefurther analysisanddecision-makingindatascienceprojects.
Descriptivestatisticsisabranchofstatisticsthatinvolvestheanalysisandsummaryofdatatogain insightsintoitsmaincharacteristics.Itprovidesasetofquantitativemeasuresthatdescribethe centraltendency,dispersion,andshapeofadataset.Thesestatisticshelpinunderstandingthedata distribution,identifyingpatterns,andmakingdata-drivendecisions.
Thereareseveralkeydescriptivestatisticscommonlyusedtosummarizedata:
• Mean:Themean,oraverage,iscalculatedbysummingallvaluesinadatasetanddividingby thetotalnumberofobservations.Itrepresentsthecentraltendencyofthedata.
• Median:Themedianisthemiddlevalueinadatasetwhenitisarrangedinascendingordescendingorder.Itislessa ectedbyoutliersandprovidesarobustmeasureofcentraltendency.
• Mode:Themodeisthemostfrequentlyoccurringvalueinadataset.Itrepresentsthevalueor valueswiththehighestfrequency.
• Variance:Variancemeasuresthespreadordispersionofdatapointsaroundthemean.Itquantifiestheaveragesquareddi erencebetweeneachdatapointandthemean.
• StandardDeviation:Standarddeviationisthesquarerootofthevariance.Itprovidesameasure oftheaveragedistancebetweeneachdatapointandthemean,indicatingtheamountofvariation inthedataset.
• Range:Therangeisthedi erencebetweenthemaximumandminimumvaluesinadataset.It providesanindicationofthedata’sspread.
• Percentiles:Percentilesdivideadatasetintohundredths,representingtherelativepositionofa valueincomparisontotheentiredataset.Forexample,the25thpercentile(alsoknownasthe firstquartile)representsthevaluebelowwhich25%ofthedatafalls.
Now,let’sseesomeexamplesofhowtocalculatethesedescriptivestatisticsusingPython:
1 import numpyasnpy
2
3 data =[10,12,14,16,18,20]
4
5 mean = npy.mean(data)
6 median = npy.median(data)
7 mode = npy.mode(data)
8 variance = npy.var(data)
9 std_deviation = npy.std(data)
10 data_range = npy.ptp(data)
11 percentile_25 = npy.percentile(data,25)
12 percentile_75 = npy.percentile(data,75)
13
14 print("Mean:", mean)
15 print("Median:", median)
16 print("Mode:", mode)
17 print("Variance:", variance)
18 print("StandardDeviation:", std_deviation)
19 print("Range:", data_range)
20 print("25thPercentile:", percentile_25)
21 print("75thPercentile:", percentile_75)
Intheaboveexample,weusetheNumPylibraryinPythontocalculatethedescriptivestatistics.
The mean, median, mode, variance, std_deviation, data_range, percentile_25,and
percentile_75 variablesrepresenttherespectivedescriptivestatisticsforthegivendataset.
Descriptivestatisticsprovideaconcisesummaryofdata,allowingdatascientiststounderstandits centraltendencies,variability,anddistributioncharacteristics.Thesestatisticsserveasafoundation forfurtherdataanalysisanddecision-makinginvariousfields,includingdatascience,finance,social sciences,andmore.
Withpandaslibrary,it’seveneasier.
1 import pandasaspd
2
3 #Createadictionarywithsampledata
4 data ={
5 'Name':['John' , 'Maria' , 'Carlos' , 'Anna' , 'Luis'],
6 'Age':[28,24,32,22,30],
7 'Height(cm)':[175,162,180,158,172],
8 'Weight(kg)':[75,60,85,55,70]
9 }
10
11 #CreateaDataFramefromthedictionary
12 df = pd.DataFrame(data)
13
14 #DisplaytheDataFrame
15 print("DataFrame:")
16 print(df) 17
18 #Getbasicdescriptivestatistics
19 descriptive_stats = df.describe()
20
21 #Displaythedescriptivestatistics
22 print("\nDescriptiveStatistics:")
23 print(descriptive_stats)
ThecodecreatesaDataFramewithsampledataaboutnames,ages,heights,andweightsandthen uses describe() toobtainbasicdescriptivestatisticssuchascount,mean,standarddeviation, minimum,maximum,andquartilesforthenumericcolumnsintheDataFrame.
Datavisualizationisacriticalcomponentofexploratorydataanalysis(EDA)thatallowsustovisually representdatainameaningfulandintuitiveway.Itinvolvescreatinggraphicalrepresentationsofdata touncoverpatterns,relationships,andinsightsthatmaynotbeapparentfromrawdataalone.Byleveragingvariousvisualtechniques,datavisualizationenablesustocommunicatecomplexinformation e ectivelyandmakedata-drivendecisions.
E ectivedatavisualizationreliesonselectingappropriatecharttypesbasedonthetypeofvariables beinganalyzed.Wecanbroadlycategorizevariablesintothreetypes:
Thesevariablesrepresentnumericaldataandcanbefurtherclassifiedintocontinuousordiscrete variables.Commoncharttypesforvisualizingquantitativevariablesinclude:
Variable Type Chart Type Description
Continuous LinePlot
Continuous Histogram
Showsthetrendandpatternsover time plt.plot(x,y)
Displaysthedistributionofvalues plt.hist(data)
Discrete BarChart Comparesvaluesacrossdi erent categories plt.bar(x,y)
Discrete Scatter Plot Examinestherelationshipbetween variables plt.scatter(x,y)
Table1: TypesofchartsandtheirdescriptionsinPython.
Thesevariablesrepresentqualitativedatathatfallintodistinctcategories.Commoncharttypesfor visualizingcategoricalvariablesinclude:
Variable
Categorical BarChart
Displaysthefrequencyorcountof categories plt.bar(x,y)
Categorical PieChart Representstheproportionofeach category plt.pie(data,labels=labels)
Categorical Heatmap Showstherelationshipbetweentwo categoricalvariables sns.heatmap(data)
Table2: TypesofchartsforcategoricaldatavisualizationinPython.
Thesevariableshaveanaturalorderorhierarchy.Charttypessuitableforvisualizingordinalvariables include:
Variable Type
Ordinal BarChart Comparesvaluesacrossdi erent categories plt.bar(x,y)
Ordinal BoxPlot Displaysthedistributionandoutliers sns.boxplot(x,y)
Table3: TypesofchartsforordinaldatavisualizationinPython.
DatavisualizationlibrarieslikeMatplotlib,Seaborn,andPlotlyinPythonprovideawiderangeof functionsandtoolstocreatethesevisualizations.Byutilizingtheselibrariesandtheircorresponding commands,wecangeneratevisuallyappealingandinformativeplotsforEDA.
Library Description
Matplotlib Matplotlibisaversatileplottinglibraryforcreatingstatic,animated, andinteractivevisualizationsinPython.Ito ersawiderangeofchart typesandcustomizationoptions.
Seaborn SeabornisastatisticaldatavisualizationlibrarybuiltontopofMatplotlib.Itprovidesahigh-levelinterfaceforcreatingattractiveand informativestatisticalgraphics.
Altair AltairisadeclarativestatisticalvisualizationlibraryinPython.It allowsuserstocreateinteractivevisualizationswithconciseand expressivesyntax,basedontheVega-Litegrammar.
Plotly Plotlyisanopen-source,web-basedlibraryforcreatinginteractive visualizations.Ito ersawiderangeofcharttypes,including2Dand 3Dplots,andsupportsinteractivityandsharingcapabilities.
Website
Altair
Plotly ggplot ggplotisaplottingsystemforPythonbasedontheGrammarof Graphics.Itprovidesapowerfulandflexiblewaytocreateaestheticallypleasingandpublication-qualityvisualizations. ggplot
Bokeh BokehisaPythonlibraryforcreatinginteractivevisualizationsfor theweb.ItfocusesonprovidingelegantandconciseAPIsforcreating dynamicplotswithinteractivityandstreamingcapabilities.
Plotnine PlotnineisaPythonimplementationoftheGrammarofGraphics. Itallowsuserstocreatevisuallyappealingandhighlycustomizable plotsusingasimpleandintuitivesyntax.
Table4: Pythondatavisualizationlibraries.
Pleasenotethatthedescriptionsprovidedabovearesimplifiedsummaries,andformoredetailed information,itisrecommendedtovisittherespectivewebsitesofeachlibrary.Pleasenotethatthe Pythoncodeprovidedaboveisasimplifiedrepresentationandmayrequireadditionalcustomization basedonthespecificdataandplotrequirements.
Correlationanalysisisastatisticaltechniqueusedtomeasurethestrengthanddirectionoftherelationshipbetweentwoormorevariables.Ithelpsinunderstandingtheassociationbetweenvariables andprovidesinsightsintohowchangesinonevariablearerelatedtochangesinanother.
Thereareseveraltypesofcorrelationanalysiscommonlyused:
• PearsonCorrelation:Pearsoncorrelationcoe icientmeasuresthelinearrelationshipbetween twocontinuousvariables.Itcalculatesthedegreetowhichthevariablesarelinearlyrelated, rangingfrom-1to1.Avalueof1indicatesaperfectpositivecorrelation,-1indicatesaperfect negativecorrelation,and0indicatesnolinearcorrelation.
• SpearmanCorrelation:Spearmancorrelationcoe icientassessesthemonotonicrelationship betweenvariables.Itranksthevaluesofthevariablesandcalculatesthecorrelationbasedon therankorder.Spearmancorrelationisusedwhenthevariablesarenotnecessarilylinearly relatedbutshowaconsistenttrend.
Calculationofcorrelationcoe icientscanbeperformedusingPython:
1 import pandasaspd
2
3 #Generatesampledata
4 data = pd.DataFrame({
5 'X':[1,2,3,4,5],
6 'Y':[2,4,6,8,10],
7 'Z':[3,6,9,12,15]
8 })
9
10 #CalculatePearsoncorrelationcoefficient
11 pearson_corr = data['X'].corr(data['Y'])
12
13 #CalculateSpearmancorrelationcoefficient
14 spearman_corr = data['X'].corr(data['Y'], method='spearman')
15
16 print("PearsonCorrelationCoefficient:", pearson_corr)
17 print("SpearmanCorrelationCoefficient:", spearman_corr)
Intheaboveexample,weusethePandaslibraryinPythontocalculatethecorrelationcoe icients. The corr functionisappliedtothecolumns 'X' and 'Y' ofthe data DataFrametocomputethe PearsonandSpearmancorrelationcoe icients.
Pearsoncorrelationissuitableforvariableswithalinearrelationship,whileSpearmancorrelation ismoreappropriatewhentherelationshipismonotonicbutnotnecessarilylinear.Bothcorrelation coe icientsrangebetween-1and1,withhigherabsolutevaluesindicatingstrongercorrelations.
Correlationanalysisiswidelyusedindatasciencetoidentifyrelationshipsbetweenvariables,uncover patterns,andmakeinformeddecisions.Ithasapplicationsinfieldssuchasfinance,socialsciences, healthcare,andmanyothers.
IbonMartínez-ArranzPage69
Datatransformationisacrucialstepintheexploratorydataanalysisprocess.Itinvolvesmodifying theoriginaldatasettoimproveitsquality,addressdataissues,andprepareitforfurtheranalysis.By applyingvarioustransformations,wecanuncoverhiddenpatterns,reducenoise,andmakethedata moresuitableformodelingandvisualization.
Datatransformationplaysavitalroleinpreparingthedataforanalysis.Ithelpsinachievingthe followingobjectives:
• DataCleaning: Transformationtechniqueshelpinhandlingmissingvalues,outliers,andinconsistentdataentries.Byaddressingtheseissues,weensuretheaccuracyandreliabilityofour analysis.
• Normalization: Di erentvariablesinadatasetmayhavedi erentscales,units,orranges. Normalizationtechniquessuchasmin-maxscalingorz-scorenormalizationbringallvariables toacommonscale,enablingfaircomparisonsandavoidingbiasinsubsequentanalyses.
• FeatureEngineering: Transformationallowsustocreatenewfeaturesorderivemeaningful informationfromexistingvariables.Thisprocessinvolvesextractingrelevantinformation,creatinginteractionterms,orencodingcategoricalvariablesforbetterrepresentationandpredictive power.
• Non-linearityHandling: Insomecases,relationshipsbetweenvariablesmaynotbelinear. Transformingvariablesusingfunctionslikelogarithm,exponential,orpowertransformations canhelpcapturenon-linearpatternsandimprovemodelperformance.
• OutlierTreatment: Outlierscansignificantlyimpacttheanalysisandmodelperformance.Transformationssuchaswinsorizationorlogarithmictransformationcanhelpreducetheinfluenceof outlierswithoutlosingvaluableinformation.
Purpose LibraryName Description Website
DataCleaning
Pandas (Python)
Apowerfuldatamanipulationlibraryfor cleaningandpreprocessingdata. Pandas
dplyr(R) Providesasetoffunctionsfordatawrangling anddatamanipulationtasks.
Normalization
scikit-learn (Python) O ersvariousnormalizationtechniquessuchas Min-MaxscalingandZ-scorenormalization.
caret(R) Providespre-processingfunctions,including normalization,forbuildingmachinelearning models.
FeatureEngineering
Featuretools (Python)
Alibraryforautomatedfeatureengineeringthat cangeneratenewfeaturesfromexistingones.
dplyr
scikit-learn
caret
Featuretools
recipes(R) O ersaframeworkforfeatureengineering, allowing userstocreatecustomfeature transformationpipelines. recipes
Non-LinearityHandling
TensorFlow (Python)
Adeeplearninglibrarythatsupportsbuilding andtrainingnon-linearmodelsusingneural networks.
keras(R) Provideshigh-levelinterfacesforbuilding andtrainingneuralnetworkswithnon-linear activationfunctions.
OutlierTreatment
PyOD(Python) Acomprehensivelibraryforoutlierdetection andremovalusingvariousalgorithmsand models.
outliers(R) Implementsvariousmethodsfordetectingand handlingoutliersindatasets.
Table5: Datapreprocessingandmachinelearninglibraries.
TensorFlow
keras
PyOD
outliers
Thereareseveralcommontypesofdatatransformationtechniquesusedinexploratorydataanalysis:
• ScalingandStandardization: Thesetechniquesadjustthescaleanddistributionofvariables, makingthemcomparableandsuitableforanalysis.Examplesincludemin-maxscaling,z-score normalization,androbustscaling.
• LogarithmicTransformation: Thistransformationisusefulforhandlingvariableswithskewed distributionsorexponentialgrowth.Ithelpsinstabilizingvarianceandbringingextremevalues closertothemean.
• PowerTransformation: Powertransformations,suchassquareroot,cuberoot,orBox-Cox transformation,canbeappliedtohandlevariableswithnon-linearrelationshipsorheteroscedasticity.
• BinningandDiscretization: Binninginvolvesdividingacontinuousvariableintocategoriesor intervals,simplifyingtheanalysisandreducingtheimpactofoutliers.Discretizationtransforms continuousvariablesintodiscreteonesbyassigningthemtospecificrangesorbins.
• EncodingCategoricalVariables: Categoricalvariableso enneedtobeconvertedintonumerical representationsforanalysis.Techniqueslikeone-hotencoding,labelencoding,orordinal encodingareusedtotransformcategoricalvariablesintonumericequivalents.
• FeatureScaling: Featurescalingtechniques,suchasmeannormalizationorunitvectorscaling, ensurethatdi erentfeatureshavesimilarscales,avoidingdominancebyvariableswithlarger magnitudes.
Byemployingthesetransformationtechniques,datascientistscanenhancethequalityofthedataset, uncoverhiddenpatterns,andenablemoreaccurateandmeaningfulanalyses.
Keepinmindthattheselectionandapplicationofspecificdatatransformationtechniquesdependon thecharacteristicsofthedatasetandtheobjectivesoftheanalysis.Itisessentialtounderstandthe dataandchoosetheappropriatetransformationstoderivevaluableinsights.
Transformation Mathematical Equation
Advantages
Disadvantages
Logarithmic y =log(x) -Reducestheimpactof extremevalues -Doesnotworkwithzeroor negativevalues
SquareRoot y = √x -Reducestheimpactof extremevalues -Doesnotworkwithnegativevalues
Exponential y =expx -Increasesseparation betweensmallvalues -Amplifiesthedi erences betweenlargevalues
Box-Cox y = xλ 1 λ -Adaptstodi erenttypes ofdata -Requiresestimationofthe λ parameter
Power y = xp -Allowscustomizationof thetransformation -Sensitivitytothechoiceof powervalue
Square y = x2 -Preservestheorderof values -Amplifiesthedi erences betweenlargevalues
Inverse y = 1 x -Reducestheimpactof largevalues -Doesnotworkwithzeroor negativevalues
Min-Max Scaling y = x minx maxx minx -Scalesthedatatoa specificrange -Sensitivetooutliers
Z-ScoreScaling y = x x σx -Centersthedataaround zeroandscaleswith standarddeviation -Sensitivetooutliers
Rank Transformation Assignsrankvalues tothedatapoints -Preservestheorderof valuesandhandlesties gracefully -Lossofinformationabout theoriginalvalues
Table6: Datatransformationmethodsinstatistics.
PracticalExample:HowtoUseaDataVisualizationLibrarytoExploreand AnalyzeaDataset
Inthispracticalexample,wewilldemonstratehowtousetheMatplotliblibraryinPythontoexploreand analyzeadataset.Matplotlibisawidely-useddatavisualizationlibrarythatprovidesacomprehensive setoftoolsforcreatingvarioustypesofplotsandcharts.
Forthisexample,let’sconsideradatasetcontaininginformationaboutthesalesperformanceof di erentproductsacrossvariousregions.Thedatasetincludesthefollowingcolumns:
• Product:Thenameoftheproduct.
• Region:Thegeographicalregionwheretheproductissold.
• Sales:Thesalesvalueforeachproductinaspecificregion.
1 Product,Region,Sales
2 ProductA,Region 1,1000
3 ProductB,Region 2,1500
4 ProductC,Region 1,800
5 ProductA,Region 3,1200
6 ProductB,Region 1,900
7 ProductC,Region 2,1800
8 ProductA,Region 2,1100
9 ProductB,Region 3,1600
10 ProductC,Region 3,750
Tobegin,weneedtoimportthenecessarylibraries.WewillimportMatplotlibfordatavisualization andPandasfordatamanipulationandanalysis.
1 import matplotlib.pyplotasplt
2 import pandasaspd
Next,weloadthedatasetintoaPandasDataFrameforfurtheranalysis.Assumingthedatasetisstored inaCSVfilenamed“sales_data.csv,”wecanusethefollowingcode:
1 df = pd.read_csv("sales_data.csv")
Oncethedatasetisloaded,wecanstartexploringandanalyzingthedatausingdatavisualization techniques.
VisualizingSalesDistribution
Tounderstandthedistributionofsalesacrossdi erentregions,wecancreateabarplotshowingthe totalsalesforeachregion:
1 sales_by_region = df.groupby("Region")["Sales"].sum()
2 plt.bar(sales_by_region.index, sales_by_region.values)
3 plt.xlabel("Region")
4 plt.ylabel("TotalSales")
5 plt.title("SalesDistributionbyRegion")
6 plt.show()
Thisbarplotprovidesavisualrepresentationofthesalesdistribution,allowingustoidentifyregions withthehighestandlowestsales.
Wecanalsovisualizetheperformanceofdi erentproductsbycreatingahorizontalbarplotshowing thesalesforeachproduct:
1 sales_by_product = df.groupby("Product")["Sales"].sum()
2 plt.bar(sales_by_product.index, sales_by_product.values)
3 plt.xlabel("Product")
4 plt.ylabel("TotalSales")
5 plt.title("SalesDistributionbyProduct")
6 plt.show()
Thisbarplotprovidesavisualrepresentationofthesalesdistribution,allowingustoidentifyproducts withthehighestandlowestsales.
IbonMartínez-ArranzPage75
• Aggarwal,C.C.(2015).DataMining:TheTextbook.Springer.
• Tukey,J.W.(1977).ExploratoryDataAnalysis.Addison-Wesley.
• Wickham,H.,&Grolemund,G.(2017).RforDataScience.O’ReillyMedia.
• McKinney,W.(2018).PythonforDataAnalysis.O’ReillyMedia.
• Wickham,H.(2010).ALayeredGrammarofGraphics.JournalofComputationalandGraphical Statistics.
• VanderPlas,J.(2016).PythonDataScienceHandbook.O’ReillyMedia.
• Bruce,P.andBruce,A.(2017).PracticalStatisticsforDataScientists.O’ReillyMedia.
Inthefieldofdatascience,modelingplaysacrucialroleinderivinginsights,makingpredictions,and solvingcomplexproblems.Modelsserveasrepresentationsofreal-worldphenomena,allowingusto understandandinterpretdatamoree ectively.However,thesuccessofanymodeldependsonthe qualityandreliabilityoftheunderlyingdata.

InDataSciencearea,modelingholdsanimportantpositioninextractinginsights,makingpredictions, andaddressingintricatechallenges.ImagegeneratedwithDALL-E.
Theprocessofmodelinginvolvescreatingmathematicalorstatisticalrepresentationsthatcapturethe patterns,relationships,andtrendspresentinthedata.Bybuildingmodels,datascientistscangaina deeperunderstandingoftheunderlyingmechanismsdrivingthedataandmakeinformeddecisions basedonthemodel’soutputs.
Butbeforedelvingintomodeling,itisparamounttoaddresstheissueofdatavalidation.Datavalidation encompassestheprocessofensuringtheaccuracy,completeness,andreliabilityofthedatausedfor
modeling.Withoutproperdatavalidation,theresultsobtainedfromthemodelsmaybemisleadingor inaccurate,leadingtoflawedconclusionsanderroneousdecision-making.
Datavalidationinvolvesseveralcriticalsteps,includingdatacleaning,preprocessing,andquality assessment.Thesestepsaimtoidentifyandrectifyanyinconsistencies,errors,ormissingvalues presentinthedata.Byvalidatingthedata,wecanensurethatthemodelsarebuiltonasolidfoundation, enhancingtheire ectivenessandreliability.
Theimportanceofdatavalidationcannotbeoverstated.Itmitigatestherisksassociatedwitherroneous data,reducesbias,andimprovestheoverallqualityofthemodelingprocess.Validateddataensures thatthemodelsproducetrustworthyandactionableinsights,enablingdatascientistsandstakeholders tomakeinformeddecisionswithconfidence.
Moreover,datavalidationisanongoingprocessthatshouldbeperformediterativelythroughoutthe modelinglifecycle.Asnewdatabecomesavailableorthemodelingobjectivesevolve,itisessentialto reevaluateandvalidatethedatatomaintaintheintegrityandrelevanceofthemodels.
Inthischapter,wewillexplorevariousaspectsofmodelinganddatavalidation.Wewilldelveinto di erentmodelingtechniques,suchasregression,classification,andclustering,anddiscusstheir applicationsinsolvingreal-worldproblems.Additionally,wewillexaminethebestpracticesand methodologiesfordatavalidation,includingtechniquesforassessingdataquality,handlingmissing values,andevaluatingmodelperformance.
Bygainingacomprehensiveunderstandingofmodelinganddatavalidation,datascientistscanbuild robustmodelsthate ectivelycapturethecomplexitiesoftheunderlyingdata.Throughmeticulousvalidation,theycanensurethatthemodelsdeliveraccurateinsightsandreliablepredictions,empowering organizationstomakedata-drivendecisionsthatdrivesuccess.
Next,wewilldelveintothefundamentalsofmodeling,exploringvarioustechniquesandmethodologies employedindatascience.Letusembarkonthisjourneyofmodelinganddatavalidation,uncovering thepowerandpotentialoftheseindispensablepractices.
Datamodeling isacrucialstepinthedatascienceprocessthatinvolvescreatinga structuredrepresentationoftheunderlyingdataanditsrelationships.Itistheprocess ofdesigninganddefiningaconceptual,logical,orphysicalmodelthatcapturesthe essentialelementsofthedataandhowtheyrelatetoeachother.
Datamodelinghelpsdatascientistsandanalystsunderstandthedatabetterandprovidesablueprint fororganizingandmanipulatingite ectively.Bycreatingaformalmodel,wecanidentifytheentities, attributes,andrelationshipswithinthedata,enablingustoanalyze,query,andderiveinsightsfromit moree iciently.
Therearedi erenttypesofdatamodels,includingconceptual,logical,andphysicalmodels.Aconceptualmodelprovidesahigh-levelviewofthedata,focusingontheessentialconceptsandtheir relationships.Itactsasabridgebetweenthebusinessrequirementsandthetechnicalimplementation.
Thelogicalmodeldefinesthestructureofthedatausingspecificdatamodelingtechniquessuchas entity-relationshipdiagramsorUMLclassdiagrams.Itdescribestheentities,theirattributes,andthe relationshipsbetweentheminamoredetailedmanner.
Thephysicalmodelrepresentshowthedataisstoredinaspecificdatabaseorsystem.Itincludesdetails aboutdatatypes,indexes,constraints,andotherimplementation-specificaspects.Thephysicalmodel servesasaguidefordatabaseadministratorsanddevelopersduringtheimplementationphase.
Datamodelingisessentialforseveralreasons.Firstly,ithelpsensuredataaccuracyandconsistencyby providingastandardizedstructureforthedata.Itenablesdatascientiststounderstandthecontext andmeaningofthedata,reducingambiguityandimprovingdataquality.
Secondly,datamodelingfacilitatese ectivecommunicationbetweendi erentstakeholdersinvolved inthedatascienceproject.Itprovidesacommonlanguageandvisualrepresentationthatcanbeeasily understoodbybothtechnicalandnon-technicalteammembers.
Furthermore,datamodelingsupportsthedevelopmentofrobustandscalabledatasystems.Itallows fore icientdatastorage,retrieval,andmanipulation,optimizingperformanceandenablingfaster dataanalysis.
Inthecontextofdatascience,datamodelingtechniquesareusedtobuildpredictiveanddescriptive models.Thesemodelscanrangefromsimplelinearregressionmodelstocomplexmachinelearningalgorithms.Datamodelingplaysacrucialroleinfeatureselection,modeltraining,andmodel evaluation,ensuringthattheresultingmodelsareaccurateandreliable.
Tofacilitatedatamodeling,variousso waretoolsandlanguagesareavailable,suchasSQL,Python (withlibrarieslikepandasandscikit-learn),andR.Thesetoolsprovidefunctionalitiesfordatamanipulation,transformation,andmodeling,makingthedatamodelingprocessmoree icientand streamlined.
Intheupcomingsectionsofthischapter,wewillexploredi erentdatamodelingtechniquesand methodologies,rangingfromtraditionalstatisticalmodelstoadvancedmachinelearningalgorithms. Wewilldiscusstheirapplications,advantages,andconsiderations,equippingyouwiththeknowledge tochoosethemostappropriatemodelingapproachforyourdatascienceprojects. IbonMartínez-ArranzPage79
Indatascience,selectingtherightmodelingalgorithmisacrucialstepinbuildingpredictiveordescriptivemodels.Thechoiceofalgorithmdependsonthenatureoftheproblemathand,whetherit involvesregressionorclassificationtasks.Let’sexploretheprocessofselectingmodelingalgorithms andlistsomeoftheimportantalgorithmsforeachtypeoftask.
Whendealingwithregressionproblems,thegoalistopredictacontinuousnumericalvalue.The selectionofaregressionalgorithmdependsonfactorssuchasthelinearityoftherelationshipbetween variables,thepresenceofoutliers,andthecomplexityoftheunderlyingdata.Herearesomecommonly usedregressionalgorithms:
• LinearRegression:Linearregressionassumesalinearrelationshipbetweentheindependent variablesandthedependentvariable.Itiswidelyusedformodelingcontinuousvariablesand providesinterpretablecoe icientsthatindicatethestrengthanddirectionoftherelationships.
• DecisionTrees:Decisiontreesareversatilealgorithmsthatcanhandlebothregressionand classificationtasks.Theycreateatree-likestructuretomakedecisionsbasedonfeaturesplits. Decisiontreesareintuitiveandcancapturenonlinearrelationships,buttheymayoverfitthe trainingdata.
• RandomForest:RandomForestisanensemblemethodthatcombinesmultipledecisiontreesto makepredictions.Itreducesoverfittingbyaveragingthepredictionsofindividualtrees.Random Forestisknownforitsrobustnessandabilitytohandlehigh-dimensionaldata.
• GradientBoosting:GradientBoostingisanotherensembletechniquethatcombinesweak learnerstocreateastrongpredictivemodel.Itsequentiallyfitsnewmodelstocorrecttheerrors madebypreviousmodels.GradientBoostingalgorithmslikeXGBoostandLightGBMarepopular fortheirhighpredictiveaccuracy.
Forclassificationproblems,theobjectiveistopredictacategoricalordiscreteclasslabel.Thechoice ofclassificationalgorithmdependsonfactorssuchasthenatureofthedata,thenumberofclasses, andthedesiredinterpretability.Herearesomecommonlyusedclassificationalgorithms:
• LogisticRegression:Logisticregressionisapopularalgorithmforbinaryclassification.Itmodels theprobabilityofbelongingtoacertainclassusingalogisticfunction.Logisticregressioncanbe extendedtohandlemulti-classclassificationproblems.
• SupportVectorMachines(SVM):SVMisapowerfulalgorithmforbothbinaryandmulti-class classification.Itfindsahyperplanethatmaximizesthemarginbetweendi erentclasses.SVMs canhandlecomplexdecisionboundariesandaree ectivewithhigh-dimensionaldata.
• RandomForestandGradientBoosting:Theseensemblemethodscanalsobeusedforclassificationtasks.Theycanhandlebothbinaryandmulti-classproblemsandprovidegoodperformance intermsofaccuracy.
• NaiveBayes:NaiveBayesisaprobabilisticalgorithmbasedonBayes’theorem.Itassumes independencebetweenfeaturesandcalculatestheprobabilityofbelongingtoaclass.Naive Bayesiscomputationallye icientandworkswellwithhigh-dimensionaldata.
RLibraries:
• caret: Caret (ClassificationAndREgressionTraining)isacomprehensivemachinelearning libraryinRthatprovidesaunifiedinterfacefortrainingandevaluatingvariousmodels.Itoffersawiderangeofalgorithmsforclassification,regression,clustering,andfeatureselection, makingitapowerfultoolfordatamodeling. Caret simplifiesthemodeltrainingprocessby automatingtaskssuchasdatapreprocessing,featureselection,hyperparametertuning,and modelevaluation.Italsosupportsparallelcomputing,allowingforfastermodeltrainingon multi-coresystems. Caret iswidelyusedintheRcommunityandisknownforitsflexibility, easeofuse,andextensivedocumentation.Tolearnmoreabout Caret,youcanvisittheo icial website:Caret
• glmnet: GLMnet isapopularRpackageforfittinggeneralizedlinearmodelswithregularization.Itprovidese icientimplementationsofelasticnet,lasso,andridgeregression,which arepowerfultechniquesforvariableselectionandregularizationinhigh-dimensionaldatasets. GLMnet o ersaflexibleanduser-friendlyinterfaceforfittingthesemodels,allowingusersto easilycontroltheamountofregularizationandperformcross-validationformodelselection. Italsoprovidesusefulfunctionsforvisualizingtheregularizationpathsandextractingmodel coe icients. GLMnet iswidelyusedinvariousdomains,includinggenomics,economics,and socialsciences.Formoreinformationabout GLMnet,youcanrefertotheo icialdocumentation: GLMnet
• randomForest: randomForest isapowerfulRpackageforbuildingrandomforestmodels, whichareanensemblelearningmethodthatcombinesmultipledecisiontreestomakepredictions.Thepackageprovidesane icientimplementationoftherandomforestalgorithm, allowinguserstoeasilytrainandevaluatemodelsforbothclassificationandregressiontasks.
randomForest o ersvariousoptionsforcontrollingthenumberoftrees,thesizeoftherandomfeaturesubsets,andotherparameters,providingflexibilityandcontroloverthemodel’s behavior.Italsoincludesfunctionsforvisualizingtheimportanceoffeaturesandmakingpredictionsonnewdata. randomForest iswidelyusedinmanyfields,includingbioinformatics, finance,andecology.Formoreinformationabout randomForest,youcanrefertotheo icial documentation:randomForest
• xgboost: XGBoost isane icientandscalableRpackageforgradientboosting,apopular machinelearningalgorithmthatcombinesmultipleweakpredictivemodelstocreateastrong ensemblemodel. XGBoost standsforeXtremeGradientBoostingandisknownforitsspeed andaccuracyinhandlinglarge-scaledatasets.Ito ersarangeofadvancedfeatures,including regularizationtechniques,cross-validation,andearlystopping,whichhelppreventoverfitting andimprovemodelperformance. XGBoost supportsbothclassificationandregressiontasks andprovidesvarioustuningparameterstooptimizemodelperformance.Ithasgainedsignificant popularityandiswidelyusedinvariousdomains,includingdatasciencecompetitionsand industryapplications.Tolearnmoreabout XGBoost anditscapabilities,youcanvisitthe o icialdocumentation:XGBoost
PythonLibraries:
• scikit-learn: Scikit-learn isaversatilemachinelearninglibraryforPythonthato ersa widerangeoftoolsandalgorithmsfordatamodelingandanalysis.Itprovidesanintuitiveand e icientAPIfortaskssuchasclassification,regression,clustering,dimensionalityreduction,and more.Withscikit-learn,datascientistscaneasilypreprocessdata,selectandtunemodels,and evaluatetheirperformance.Thelibraryalsoincludeshelpfulutilitiesformodelselection,feature engineering,andcross-validation. Scikit-learn isknownforitsextensivedocumentation, strongcommunitysupport,andintegrationwithotherpopulardatasciencelibraries.Toexplore moreabout scikit-learn,visittheiro icialwebsite:scikit-learn
• statsmodels: Statsmodels isapowerfulPythonlibrarythatfocusesonstatisticalmodeling andanalysis.Withacomprehensivesetoffunctions,itenablesresearchersanddatascientists toperformawiderangeofstatisticaltasks,includingregressionanalysis,timeseriesanalysis, hypothesistesting,andmore.Thelibraryprovidesauser-friendlyinterfaceforestimatingand interpretingstatisticalmodels,makingitanessentialtoolfordataexploration,inference,and modeldiagnostics.Statsmodelsiswidelyusedinacademiaandindustryforitsrobustfunctionalityanditsabilitytohandlecomplexstatisticalanalyseswithease.Exploremoreabout Statsmodels attheiro icialwebsite:Statsmodels
• pycaret: PyCaret isahigh-level,low-codePythonlibrarydesignedforautomatingend-toendmachinelearningworkflows.Itsimplifiestheprocessofbuildinganddeployingmachine
learningmodelsbyprovidingawiderangeoffunctionalities,includingdatapreprocessing, featureselection,modeltraining,hyperparametertuning,andmodelevaluation.WithPyCaret, datascientistscanquicklyprototypeanditerateondi erentmodels,comparetheirperformance, andgeneratevaluableinsights.Thelibraryintegrateswithpopularmachinelearningframeworks andprovidesauser-friendlyinterfaceforbothbeginnersandexperiencedpractitioners.PyCaret’s easeofuse,extensivelibraryofprebuiltalgorithms,andpowerfulexperimentationcapabilities makeitanexcellentchoiceforacceleratingthedevelopmentofmachinelearningmodels.Explore moreabout PyCaret attheiro icialwebsite:PyCaret
• MLflow: MLflow isacomprehensiveopen-sourceplatformformanagingtheend-to-endmachinelearninglifecycle.ItprovidesasetofintuitiveAPIsandtoolstotrackexperiments,package codeanddependencies,deploymodels,andmonitortheirperformance.WithMLflow,data scientistscaneasilyorganizeandreproducetheirexperiments,enablingbettercollaboration andreproducibility.Theplatformsupportsmultipleprogramminglanguagesandseamlessly integrateswithpopularmachinelearningframeworks.MLflow’sextensivecapabilities,including experimenttracking,modelversioning,anddeploymentoptions,makeitaninvaluabletoolfor managingmachinelearningprojects.Tolearnmoreabout MLflow,visittheiro icialwebsite: MLflow
Intheprocessofmodeltrainingandvalidation,variousmethodologiesareemployedtoensuretherobustnessandgeneralizabilityofthemodels.Thesemethodologiesinvolvecreatingcohortsfortraining andvalidation,andtheselectionofappropriatemetricstoevaluatethemodel’sperformance.
Onecommonlyusedtechniqueisk-foldcross-validation,wherethedatasetisdividedintokequal-sized folds.Themodelisthentrainedandvalidatedktimes,eachtimeusingadi erentfoldasthevalidation setandtheremainingfoldsasthetrainingset.Thisallowsforacomprehensiveassessmentofthe model’sperformanceacrossdi erentsubsetsofthedata.
Anotherapproachistosplitthecohortintoadesignatedpercentage,suchasan80%trainingsetanda 20%validationset.Thistechniqueprovidesasimpleandstraightforwardwaytoevaluatethemodel’s performanceonaseparateholdoutset.
Whendealingwithregressionmodels,popularevaluationmetricsincludemeansquarederror(MSE), meanabsoluteerror(MAE),andR-squared.Thesemetricsquantifytheaccuracyandgoodness-of-fitof themodel’spredictionstotheactualvalues.
Forclassificationmodels,metricssuchasaccuracy,precision,recall,andF1scorearecommonlyused. Accuracymeasurestheoverallcorrectnessofthemodel’spredictions,whileprecisionandrecallfocus
onthemodel’sabilitytocorrectlyidentifypositiveinstances.TheF1scoreprovidesabalancedmeasure thatconsidersbothprecisionandrecall.
Itisimportanttochoosetheappropriateevaluationmetricbasedonthespecificproblemandgoalsof themodel.Additionally,itisadvisabletoconsiderdomain-specificevaluationmetricswhenavailable toassessthemodel’sperformanceinamorerelevantcontext.
Byemployingthesemethodologiesandmetrics,datascientistscane ectivelytrainandvalidatetheir models,ensuringthattheyarereliable,accurate,andcapableofgeneralizingtounseendata.
Selectionofthebestmodelisacriticalstepinthedatamodelingprocess.Itinvolvesevaluatingthe performanceofdi erentmodelstrainedonthedatasetandselectingtheonethatdemonstratesthe bestoverallperformance.
Todeterminethebestmodel,varioustechniquesandconsiderationscanbeemployed.Onecommon approachistocomparetheperformanceofdi erentmodelsusingtheevaluationmetricsdiscussedearlier,suchasaccuracy,precision,recall,ormeansquarederror.Themodelwiththehighestperformance onthesemetricsiso enchosenasthebestmodel.
Anotherapproachistoconsiderthecomplexityofthemodels.Simplermodelsaregenerallypreferredovercomplexones,astheytendtobemoreinterpretableandlesspronetooverfitting.This considerationisespeciallyimportantwhendealingwithlimiteddataorwheninterpretabilityisakey requirement.
Furthermore,itiscrucialtovalidatethemodel’sperformanceonindependentdatasetsorusingcrossvalidationtechniquestoensurethatthechosenmodelisnotoverfittingthetrainingdataandcan generalizewelltounseendata.
Insomecases,ensemblemethodscanbeemployedtocombinethepredictionsofmultiplemodels, leveragingthestrengthsofeachindividualmodel.Techniquessuchasbagging,boosting,orstacking canbeusedtoimprovetheoverallperformanceandrobustnessofthemodel.
Ultimately,theselectionofthebestmodelshouldbebasedonacombinationoffactors,including evaluationmetrics,modelcomplexity,interpretability,andgeneralizationperformance.Itisimportant tocarefullyevaluateandcomparethemodelstomakeaninformeddecisionthatalignswiththe specificgoalsandrequirementsofthedatascienceproject.
Modelevaluationisacrucialstepinthemodelinganddatavalidationprocess.Itinvolvesassessing theperformanceofatrainedmodeltodetermineitsaccuracyandgeneralizability.Thegoalisto understandhowwellthemodelperformsonunseendataandtomakeinformeddecisionsaboutits e ectiveness.
Therearevariousmetricsusedforevaluatingmodels,dependingonwhetherthetaskisregression orclassification.Inregressiontasks,commonevaluationmetricsincludemeansquarederror(MSE), rootmeansquarederror(RMSE),meanabsoluteerror(MAE),andR-squared.Thesemetricsprovide insightsintothemodel’sabilitytopredictcontinuousnumericalvaluesaccurately.
Forclassificationtasks,evaluationmetricsfocusonthemodel’sabilitytoclassifyinstancescorrectly. Thesemetricsincludeaccuracy,precision,recall,F1score,andareaunderthereceiveroperating characteristiccurve(ROCAUC).Accuracymeasurestheoverallcorrectnessofpredictions,whileprecisionandrecallevaluatethemodel’sperformanceonpositiveandnegativeinstances.TheF1score combinesprecisionandrecallintoasinglemetric,balancingtheirtrade-o .ROCAUCquantifiesthe model’sabilitytodistinguishbetweenclasses.
Additionally,cross-validationtechniquesarecommonlyemployedtoevaluatemodelperformance. K-foldcross-validationdividesthedataintoKequally-sizedfolds,whereeachfoldservesasboth trainingandvalidationdataindi erentiterations.Thisapproachprovidesarobustestimateofthe model’sperformancebyaveragingtheresultsacrossmultipleiterations.
Propermodelevaluationhelpstoidentifypotentialissuessuchasoverfittingorunderfitting,allowing formodelrefinementandselectionofthebestperformingmodel.Byunderstandingthestrengthsand limitationsofthemodel,datascientistscanmakeinformeddecisionsandenhancetheoverallquality oftheirmodelinge orts.
Metric Description
MeanSquaredError (MSE)
RootMeanSquaredError (RMSE)
MeanAbsoluteError (MAE)
R-squared
Accuracy
Precision
Recall(Sensitivity)
F1Score
ROCAUC
Measurestheaveragesquareddi erencebetweenpredictedandactual valuesinregressiontasks.
Representsthesquarerootofthe MSE,providingameasureoftheaveragemagnitudeoftheerror.
Computestheaverageabsolutedi erencebetweenpredictedandactual valuesinregressiontasks.
Measurestheproportionofthevarianceinthedependentvariablethat canbeexplainedbythemodel.
Calculatestheratioofcorrectlyclassifiedinstancestothetotalnumberof instancesinclassificationtasks.
Representstheproportionoftruepositivepredictionsamongallpositive predictionsinclassificationtasks.
Measurestheproportionoftruepositivepredictionsamongallactualpositiveinstancesinclassificationtasks.
Combinesprecisionandrecallintoa singlemetric,providingabalanced measureofmodelperformance.
Quantifiesthemodel’sabilitytodistinguishbetweenclassesbyplotting thetruepositiverateagainstthefalse positiverate.
LibraryorFunction
scikit-learn: mean_squared_error
scikit-learn: mean_squared_error followedby np.sqrt
scikit-learn: mean_absolute_error
statsmodels: R-squared
scikit-learn: accuracy_score
scikit-learn: precision_score
scikit-learn: recall_score
scikit-learn: f1_score
scikit-learn: roc_auc_score
Table1: Commonmachinelearningevaluationmetricsandtheircorrespondinglibraries.
Cross-validationisafundamentaltechniqueinmachinelearningforrobustlyestimatingmodelperformance.Below,Idescribesomeofthemostcommoncross-validationtechniques:
• K-FoldCross-Validation:Inthistechnique,thedatasetisdividedintoapproximatelyequal-sized kpartitions(folds).Themodelistrainedandevaluatedktimes,eachtimeusingk-1foldsas trainingdataand1foldastestdata.Theevaluationmetric(e.g.,accuracy,meansquarederror, etc.)iscalculatedforeachiteration,andtheresultsareaveragedtoobtainanestimateofthe model’sperformance.
• Leave-One-Out(LOO)Cross-Validation:Inthisapproach,thenumberoffoldsisequalto thenumberofsamplesinthedataset.Ineachiteration,themodelistrainedwithallsamples exceptone,andtheexcludedsampleisusedfortesting.Thismethodcanbecomputationally expensiveandmaynotbepracticalforlargedatasets,butitprovidesapreciseestimateofmodel performance.
• StratifiedCross-Validation:Similartok-foldcross-validation,butitensuresthattheclass distributionineachfoldissimilartothedistributionintheoriginaldataset.Particularlyuseful forimbalanceddatasetswhereoneclasshasmanymoresamplesthanothers.
• RandomizedCross-Validation(Shu le-Split):Insteadoffixedk-foldsplits,randomdivisions aremadeineachiteration.Usefulwhenyouwanttoperformaspecificnumberofiterationswith randomsplitsratherthanapredefinedk.
• GroupK-FoldCross-Validation:Usedwhenthedatasetcontainsgroupsorclustersofrelated samples,suchassubjectsinaclinicalstudyorusersonaplatform.Ensuresthatsamplesfromthe samegroupareinthesamefold,preventingthemodelfromlearninginformationthatdoesn’t generalizetonewgroups. Thesearesomeofthemostcommonlyusedcross-validationtechniques.Thechoiceoftheappropriatetechniquedependsonthenatureofthedataandtheproblemyouareaddressing,aswellas computationalconstraints.Cross-validationisessentialforfairmodelevaluationandreducingtherisk ofoverfittingorunderfitting. IbonMartínez-ArranzPage87
Figure1: Wevisuallycomparethecross-validationbehaviorofmanyscikit-learncross-validation functions.Next,we’llwalkthroughseveralcommoncross-validationmethodsandvisualizethe behaviorofeachmethod.Thefigurewascreatedbyadaptingthecodefrom https://scikit-learn.org/stable/auto_examples/model_selection/plot_cv_indices.html.
DataScienceWorkflowManagement
Cross-Validation Technique Description
K-FoldCross-Validation
Leave-One-Out(LOO)
Cross-Validation
Stratified
Cross-Validation
Randomized
Cross-Validation (Shu le-Split)
GroupK-Fold
Cross-Validation
PythonFunction
Dividesthedatasetintokpartitionsand trains/teststhemodelktimes.It’swidely usedandversatile. .KFold()
Usesthenumberofpartitionsequaltothe numberofsamplesinthedataset,leaving onesampleasthetestsetineachiteration. Precisebutcomputationallyexpensive. .LeaveOneOut()
Similartok-foldbutensuresthattheclass distributionissimilarineachfold.Usefulfor imbalanceddatasets.
.StratifiedKFold()
Performsrandomsplitsineachiteration. Usefulforaspecificnumberofiterations withrandomsplits. .ShuffleSplit()
Designedfordatasetswithgroupsorclustersofrelatedsamples.Ensuresthatsamplesfromthesamegroupareinthesame fold.
Customimplementation (usegroupindicesand customizesplits).
Table2: Cross-Validationtechniquesinmachinelearning.Functionsfrommodule sklearn.model_selection.
Interpretingmachinelearningmodelshasbecomeachallengeduetothecomplexityandblack-boxnatureofsomeadvancedmodels.However,therearelibrarieslike SHAP (SHapleyAdditiveexPlanations) thatcanhelpshedlightonmodelpredictionsandfeatureimportance.SHAPprovidestoolstoexplain individualpredictionsandunderstandthecontributionofeachfeatureinthemodel’soutput.ByleveragingSHAP,datascientistscangaininsightsintocomplexmodelsandmakeinformeddecisionsbased ontheinterpretationoftheunderlyingalgorithms.Ito ersavaluableapproachtointerpretability, makingiteasiertounderstandandtrustthepredictionsmadebymachinelearningmodels.Toexplore moreabout SHAP anditsinterpretationcapabilities,refertotheo icialdocumentation:SHAP
IbonMartínez-ArranzPage89
Library Description
SHAP UtilizesShapleyvaluestoexplainindividualpredictionsand assessfeatureimportance,providinginsightsintocomplex models.
LIME Generateslocalapproximationstoexplainpredictionsofcomplexmodels,aidinginunderstandingmodelbehaviorforspecificinstances.
ELI5 Providesdetailedexplanationsofmachinelearningmodels, includingfeatureimportanceandpredictionbreakdowns.
Yellowbrick Focusesonmodelvisualization,enablingexplorationoffeaturerelationships,evaluationoffeatureimportance,andperformancediagnostics.
Skater Enablesinterpretationofcomplexmodelsthroughfunction approximationandsensitivityanalysis,supportingglobaland localexplanations.
Table3: Pythonlibrariesformodelinterpretabilityandexplanation.
Website
Theselibrarieso ervarioustechniquesandtoolstointerpretmachinelearningmodels,helpingto understandtheunderlyingfactorsdrivingpredictionsandprovidingvaluableinsightsfordecisionmaking.
PracticalExample:HowtoUseaMachineLearningLibrarytoTrainand EvaluateaPredictionModel
Here’sanexampleofhowtouseamachinelearninglibrary,specifically scikit-learn,totrainand evaluateapredictionmodelusingthepopularIrisdataset.
1 import numpyasnpy
2 from sklearn.datasets import load_iris
3 from sklearn.model_selection import cross_val_score
4 from sklearn.linear_model import LogisticRegression
5 from sklearn.metrics import accuracy_score
6
7 #LoadtheIrisdataset
8 iris = load_iris()
9 X, y = iris.data, iris.target 10
11
#Initializethelogisticregressionmodel
12 model = LogisticRegression() 13
14 #Performk-foldcross-validation
15 cv_scores = cross_val_score(model, X, y, cv =5) 16
17 #Calculatethemeanaccuracyacrossallfolds
18 mean_accuracy = npy.mean(cv_scores)
19
20 #Trainthemodelontheentiredataset
21 model.fit(X, y)
22
23 #Makepredictionsonthesamedataset
24 predictions = model.predict(X)
26 #Calculateaccuracyonthepredictions
27 accuracy = accuracy_score(y, predictions)
29 #Printtheresults
30 print("Cross-ValidationAccuracy:", mean_accuracy)
31 print("OverallAccuracy:", accuracy)
Inthisexample,wefirstloadtheIrisdatasetusing load_iris() functionfrom scikit-learn. Then,weinitializealogisticregressionmodelusing LogisticRegression() class.
Next,weperformk-foldcross-validationusing cross_val_score() functionwith cv=5 parameter,whichsplitsthedatasetinto5foldsandevaluatesthemodel’sperformanceoneachfold.The cv_scores variablestorestheaccuracyscoresforeachfold.
A erthat,wetrainthemodelontheentiredatasetusing fit() method.Wethenmakepredictionsonthesamedatasetandcalculatetheaccuracyofthepredictionsusing accuracy_score() function.
IbonMartínez-ArranzPage91
Finally,weprintthecross-validationaccuracy,whichisthemeanoftheaccuracyscoresobtainedfrom cross-validation,andtheoverallaccuracyofthemodelontheentiredataset.
Books
• Harrison,M.(2020).MachineLearningPocketReference.O’ReillyMedia.
• Müller,A.C.,&Guido,S.(2016).IntroductiontoMachineLearningwithPython.O’ReillyMedia.
• Géron,A.(2019).Hands-OnMachineLearningwithScikit-Learn,Keras,andTensorFlow.O’Reilly Media.
• Raschka,S.,&Mirjalili,V.(2017).PythonMachineLearning.PacktPublishing.
• Kane,F.(2019).Hands-OnDataScienceandPythonMachineLearning.PacktPublishing.
• McKinney,W.(2017).PythonforDataAnalysis.O’ReillyMedia.
• Hastie,T.,Tibshirani,R.,&Friedman,J.(2009).TheElementsofStatisticalLearning:DataMining, Inference,andPrediction.Springer.
• Provost,F.,&Fawcett,T.(2013).DataScienceforBusiness.O’ReillyMedia.
• Codd,E.F.(1970).ARelationalModelofDataforLargeSharedDataBanks.Communicationsof theACM,13(6),377-387.
• Date,C.J.(2003).AnIntroductiontoDatabaseSystems.Addison-Wesley.
• Silberschatz,A.,Korth,H.F.,&Sudarshan,S.(2010).DatabaseSystemConcepts.McGraw-Hill Education.
• LundbergSM,NairB,VavilalaMS,HoribeM,EissesMJ,AdamsT,ListonDE,LowDK,NewmanSF, KimJ,LeeSI.(2018).Explainablemachine-learningpredictionsforthepreventionofhypoxaemia duringsurgery.NatBiomedEng.2018Oct;2(10):749-760.doi:10.1038/s41551-018-0304-0.
Inthefieldofdatascienceandmachinelearning,modelimplementationandmaintenanceplaya crucialroleinbringingthepredictivepowerofmodelsintoreal-worldapplications.Onceamodelhas beendevelopedandvalidated,itneedstobedeployedandintegratedintoexistingsystemstomake meaningfulpredictionsanddriveinformeddecisions.Additionally,modelsrequireregularmonitoring andupdatestoensuretheirperformanceremainsoptimalovertime.
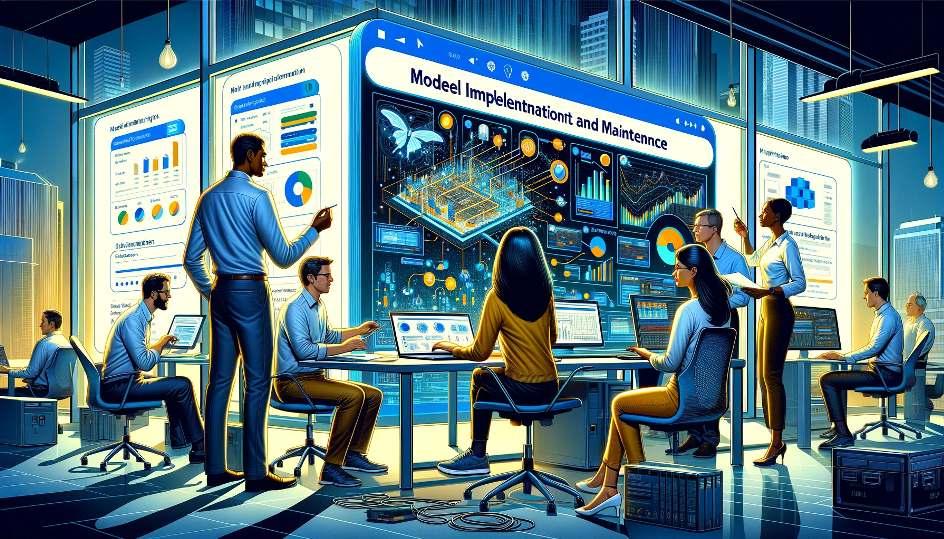
Indatascienceandmachinelearningfield,theimplementationandongoingmaintenanceofmodels assumeavitalroleintranslatingthepredictivecapabilitiesofmodelsintopracticalreal-world applications.ImagegeneratedwithDALL-E.
Thischapterexploresthevariousaspectsofmodelimplementationandmaintenance,focusingon thepracticalconsiderationsandbestpracticesinvolved.Itcoverstopicssuchasdeployingmodelsin productionenvironments,integratingmodelswithdatapipelines,monitoringmodelperformance, andhandlingmodelupdatesandretraining.
Thesuccessfulimplementationofmodelsinvolvesacombinationoftechnicalexpertise,collaboration withstakeholders,andadherencetoindustrystandards.Itrequiresadeepunderstandingofthe underlyinginfrastructure,datarequirements,andintegrationchallenges.Furthermore,maintaining modelsinvolvescontinuousmonitoring,addressingpotentialissues,andadaptingtochangingdata dynamics.
Throughoutthischapter,wewilldelveintotheessentialstepsandtechniquesrequiredtoe ectively implementandmaintainmachinelearningmodels.Wewilldiscussreal-worldexamples,industry casestudies,andthetoolsandtechnologiescommonlyemployedinthisprocess.Bytheendofthis chapter,readerswillhaveacomprehensiveunderstandingoftheconsiderationsandstrategiesneeded todeploy,monitor,andmaintainmodelsforlong-termsuccess.
Let’sembarkonthisjourneyofmodelimplementationandmaintenance,whereweuncoverthekey practicesandinsightstoensuretheseamlessintegrationandsustainedperformanceofmachine learningmodelsinpracticalapplications.
Modelimplementationreferstotheprocessoftransformingatrainedmachinelearningmodelintoa functionalsystemthatcangeneratepredictionsormakedecisionsinreal-time.Itinvolvestranslatingthemathematicalrepresentationofamodelintoadeployableformthatcanbeintegratedinto productionenvironments,applications,orsystems.
Duringmodelimplementation,severalkeystepsneedtobeconsidered.First,themodelneedsto beconvertedintoaformatcompatiblewiththetargetdeploymentenvironment.Thiso enrequires packagingthemodel,alongwithanynecessarydependencies,intoaportableformatthatcanbeeasily deployedandexecuted.
Next,theintegrationofthemodelintotheexistinginfrastructureorapplicationisperformed.This includesensuringthatthenecessarydatapipelines,APIs,orinterfacesareinplacetofeedtherequired inputdatatothemodelandreceivethepredictionsordecisionsgeneratedbythemodel.
Anotherimportantaspectofmodelimplementationisaddressinganyscalabilityorperformance considerations.Dependingontheexpectedworkloadandresourceavailability,strategiessuchas modelparallelism,distributedcomputing,orhardwareaccelerationmayneedtobeemployedto handlelarge-scaledataprocessingandpredictionrequirements.
Furthermore,modelimplementationinvolvesrigoroustestingandvalidationtoensurethatthedeployedmodelfunctionsasintendedandproducesaccurateresults.Thisincludesperformingsanity checks,verifyingtheconsistencyofinput-outputrelationships,andconductingend-to-endtesting withrepresentativedatasamples. Page94IbonMartínez-Arranz
Lastly,appropriatemonitoringandloggingmechanismsshouldbeestablishedtotracktheperformance andbehaviorofthedeployedmodelinproduction.Thisallowsfortimelydetectionofanomalies, performancedegradation,ordatadri ,whichmaynecessitatemodelretrainingorupdates.
Overall,modelimplementationisacriticalphaseinthemachinelearninglifecycle,bridgingthegap betweenmodeldevelopmentandreal-worldapplications.Itrequiresexpertiseinso wareengineering, deploymentinfrastructure,anddomain-specificconsiderationstoensurethesuccessfulintegration andfunctionalityofmachinelearningmodels.
Inthesubsequentsectionsofthischapter,wewillexploretheintricaciesofmodelimplementation ingreaterdetail.Wewilldiscussvariousdeploymentstrategies,frameworks,andtoolsavailablefor deployingmodels,andprovidepracticalinsightsandrecommendationsforasmoothande icient modelimplementationprocess.
Whenitcomestoimplementingmachinelearningmodels,thechoiceofanappropriateimplementation platformiscrucial.Di erentplatformso ervaryingcapabilities,scalability,deploymentoptions,and integrationpossibilities.Inthissection,wewillexploresomeofthemainplatformscommonlyused formodelimplementation.
• CloudPlatforms:Cloudplatforms,suchasAmazonWebServices(AWS),GoogleCloudPlatform (GCP),andMicroso Azure,providearangeofservicesfordeployingandrunningmachine learningmodels.Theseplatformso ermanagedservicesforhostingmodels,auto-scaling capabilities,andseamlessintegrationwithothercloud-basedservices.Theyareparticularly beneficialforlarge-scaledeploymentsandapplicationsthatrequirehighavailabilityandondemandscalability.
• On-PremisesInfrastructure:Organizationsmaychoosetodeploymodelsontheirownonpremisesinfrastructure,whicho ersmorecontrolandsecurity.Thisapproachinvolvessetting updedicatedservers,clusters,ordatacenterstohostandservethemodels.On-premises deploymentsareo enpreferredincaseswheredataprivacy,compliance,ornetworkconstraints playasignificantrole.
• EdgeDevicesandIoT:WiththeincreasingprevalenceofedgecomputingandInternetofThings (IoT)devices,modelimplementationattheedgehasgainedsignificantimportance.Edgedevices, suchasembeddedsystems,gateways,andIoTdevices,allowforlocalizedandreal-timemodel executionwithoutrelyingoncloudconnectivity.Thisisparticularlyusefulinscenarioswhere lowlatency,o linefunctionality,ordataprivacyarecriticalfactors.
• MobileandWebApplications:Modelimplementationformobileandwebapplicationsinvolves integratingthemodelfunctionalitydirectlyintotheapplicationcodebase.Thisallowsforseamlessuserexperienceandreal-timepredictionsonmobiledevicesorthroughwebinterfaces. FrameworkslikeTensorFlowLiteandCoreMLenablee icientdeploymentofmodelsonmobileplatforms,whilewebframeworkslikeFlaskandDjangofacilitatemodelintegrationinweb applications.
• Containerization:Containerizationplatforms,suchasDockerandKubernetes,providea portableandscalablewaytopackageanddeploymodels.Containersencapsulatethemodel,its dependencies,andtherequiredruntimeenvironment,ensuringconsistencyandreproducibility acrossdi erentdeploymentenvironments.ContainerorchestrationplatformslikeKubernetes o errobustscalability,faulttolerance,andmanageabilityforlarge-scalemodeldeployments.
• ServerlessComputing:Serverlesscomputingplatforms,suchasAWSLambda,AzureFunctions, andGoogleCloudFunctions,abstractawaytheunderlyinginfrastructureandallowforeventdrivenexecutionoffunctionsorapplications.Thismodelimplementationapproachenables automaticscaling,pay-per-usepricing,andsimplifieddeployment,makingitidealforlightweight andevent-triggeredmodelimplementations.
Itisimportanttoassessthespecificrequirements,constraints,andobjectivesofyourprojectwhen selectinganimplementationplatform.Factorssuchascost,scalability,performance,security,and integrationcapabilitiesshouldbecarefullyconsidered.Additionally,theexpertiseandfamiliarityof thedevelopmentteamwiththechosenplatformareimportantfactorsthatcanimpactthee iciency andsuccessofmodelimplementation.
Whenimplementingamodel,itiscrucialtoconsidertheintegrationofthemodelwithexistingsystems withinanorganization.Integrationreferstotheseamlessincorporationofthemodelintotheexisting infrastructure,applications,andworkflowstoensuresmoothfunctioningandmaximizethemodel’s value.
Theintegrationprocessinvolvesidentifyingtherelevantsystemsanddetermininghowthemodelcan interactwiththem.Thismayincludeintegratingwithdatabases,APIs,messagingsystems,orother componentsoftheexistingarchitecture.Thegoalistoestablishe ectivecommunicationanddata exchangebetweenthemodelandthesystemsitinteractswith.
Keyconsiderationsinintegratingmodelswithexistingsystemsincludecompatibility,security,scalability,andperformance.Themodelshouldalignwiththetechnologicalstackandstandardsusedin theorganization,ensuringinteroperabilityandminimizingdisruptions.Securitymeasuresshouldbe
implementedtoprotectsensitivedataandmaintaindataintegritythroughouttheintegrationprocess. Scalabilityandperformanceoptimizationsshouldbeconsideredtohandleincreasingdatavolumes anddeliverreal-timeornear-real-timepredictions.
Severalapproachesandtechnologiescanfacilitatetheintegrationprocess.Applicationprogramming interfaces(APIs)providestandardizedinterfacesfordataexchangebetweensystems,allowingseamless integrationbetweenthemodelandotherapplications.Messagequeues,event-drivenarchitectures, andservice-orientedarchitectures(SOA)enableasynchronouscommunicationanddecouplingof components,enhancingflexibilityandscalability.
Integrationwithexistingsystemsmayrequirecustomdevelopmentortheuseofintegrationplatforms, suchasenterpriseservicebuses(ESBs)orintegrationmiddleware.Thesetoolsprovidepre-builtconnectorsandadaptersthatsimplifyintegrationtasksandenabledataflowbetweendi erentsystems.
Bysuccessfullyintegratingmodelswithexistingsystems,organizationscanleveragethepoweroftheir modelsinreal-worldapplications,automatedecision-makingprocesses,andderivevaluableinsights fromdata.
Testingandvalidationarecriticalstagesinthemodelimplementationandmaintenanceprocess.These stagesinvolveassessingtheperformance,accuracy,andreliabilityoftheimplementedmodeltoensure itse ectivenessinreal-worldscenarios.
Duringtesting,themodelisevaluatedusingavarietyoftestdatasets,whichmayincludebothhistorical dataandsyntheticdatadesignedtorepresentdi erentscenarios.Thegoalistomeasurehowwellthe modelperformsinpredictingoutcomesormakingdecisionsonunseendata.Testinghelpsidentify potentialissues,suchasoverfitting,underfitting,orgeneralizationproblems,andallowsforfine-tuning ofthemodelparameters.
Validation,ontheotherhand,focusesonevaluatingthemodel’sperformanceusinganindependent datasetthatwasnotusedduringthemodeltrainingphase.Thisstephelpsassessthemodel’sgeneralizabilityanditsabilitytomakeaccuratepredictionsonnew,unseendata.Validationhelpsmitigatethe riskofmodelbiasandprovidesamorerealisticestimationofthemodel’sperformanceinreal-world scenarios.
Varioustechniquesandmetricscanbeemployedfortestingandvalidation.Cross-validation,suchas k-foldcross-validation,iscommonlyusedtoassessthemodel’sperformancebysplittingthedataset intomultiplesubsetsfortrainingandtesting.Thistechniqueprovidesamorerobustestimationofthe model’sperformancebyreducingthedependencyonasingletrainingandtestingsplit.
Additionally,metricsspecifictotheproblemtype,suchasaccuracy,precision,recall,F1score,ormean squarederror,arecalculatedtoquantifythemodel’sperformance.Thesemetricsprovideinsights intothemodel’saccuracy,sensitivity,specificity,andoverallpredictivepower.Thechoiceofmetrics dependsonthenatureoftheproblem,whetheritisaclassification,regression,orothertypesof modelingtasks.
Regulartestingandvalidationareessentialformaintainingthemodel’sperformanceovertime.Asnew databecomesavailableorbusinessrequirementschange,themodelshouldbeperiodicallyretested andvalidatedtoensureitscontinuedaccuracyandreliability.Thisiterativeprocesshelpsidentify potentialdri ordeteriorationinperformanceandallowsfornecessaryadjustmentsorretrainingof themodel.
Byconductingthoroughtestingandvalidation,organizationscanhaveconfidenceinthereliability andaccuracyoftheirimplementedmodels,enablingthemtomakeinformeddecisionsandderive meaningfulinsightsfromthemodel’spredictions.
Modelmaintenanceandupdatingarecrucialaspectsofensuringthecontinuede ectivenessand reliabilityofimplementedmodels.Asnewdatabecomesavailableandbusinessneedsevolve,models needtoberegularlymonitored,maintained,andupdatedtomaintaintheiraccuracyandrelevance.
Theprocessofmodelmaintenanceinvolvestrackingthemodel’sperformanceandidentifyingany deviationsordegradationinitspredictivecapabilities.Thiscanbedonethroughregularmonitoring ofkeyperformancemetrics,suchasaccuracy,precision,recall,orotherrelevantevaluationmetrics. Monitoringcanbeperformedusingautomatedtoolsormanualreviewstodetectanysignificant changesoranomaliesinthemodel’sbehavior.
Whenissuesorperformancedeteriorationareidentified,modelupdatesandrefinementsmaybe required.Theseupdatescanincluderetrainingthemodelwithnewdata,modifyingthemodel’s featuresorparameters,oradoptingadvancedtechniquestoenhanceitsperformance.Thegoalisto addressanyshortcomingsandimprovethemodel’spredictivepowerandgeneralizability.
Updatingthemodelmayalsoinvolveincorporatingnewvariables,featureengineeringtechniques, orexploringalternativemodelingalgorithmstoachievebetterresults.Thisprocessrequirescarefulevaluationandtestingtoensurethattheupdatedmodelmaintainsitsaccuracy,reliability,and fairness.
Additionally,modeldocumentationplaysacriticalroleinmodelmaintenance.Documentationshould includeinformationaboutthemodel’spurpose,underlyingassumptions,datasources,training
methodology,andvalidationresults.Thisdocumentationhelpsmaintaintransparencyandfacilitatesknowledgetransferamongteammembersorstakeholderswhoareinvolvedinthemodel’s maintenanceandupdates.
Furthermore,modelgovernancepracticesshouldbeestablishedtoensureproperversioncontrol, changemanagement,andcompliancewithregulatoryrequirements.Thesepracticeshelpmaintain theintegrityofthemodelandprovideanaudittrailofanymodificationsorupdatesmadethroughout itslifecycle.
Regularevaluationofthemodel’sperformanceagainstpredefinedbusinessgoalsandobjectivesis essential.Thisevaluationhelpsdeterminewhetherthemodelisstillprovidingvalueandmeeting thedesiredoutcomes.Italsoenablestheidentificationofpotentialbiasesorfairnessissuesthat mayhaveemergedovertime,allowingfornecessaryadjustmentstoensureethicalandunbiased decision-making.
Insummary,modelmaintenanceandupdatinginvolvecontinuousmonitoring,evaluation,andrefinementofimplementedmodels.Byregularlyassessingperformance,makingnecessaryupdates,and adheringtobestpracticesinmodelgovernance,organizationscanensurethattheirmodelsremain accurate,reliable,andalignedwithevolvingbusinessneedsanddatalandscape.
Thefinalchapterofthisbookfocusesonthecriticalaspectofmonitoringandcontinuousimprovement inthecontextofdatascienceprojects.Whiledevelopingandimplementingamodelisanessential partofthedatasciencelifecycle,itisequallyimportanttomonitorthemodel’sperformanceovertime andmakenecessaryimprovementstoensureitse ectivenessandrelevance.

Theconcludingchapterofthisbookcentersaroundtheessentialtopicofmonitoringandcontinuous improvementwithinthecontextofdatascienceprojects.ImagegeneratedwithDALL-E.
Monitoringreferstotheongoingobservationandassessmentofthemodel’sperformanceandbehavior. Itinvolvestrackingkeyperformancemetrics,identifyinganydeviationsoranomalies,andtaking proactivemeasurestoaddressthem.Continuousimprovement,ontheotherhand,emphasizes theiterativeprocessofrefiningthemodel,incorporatingfeedbackandnewdata,andenhancingits predictivecapabilities.
E ectivemonitoringandcontinuousimprovementhelpinseveralways.First,itensuresthatthemodel
remainsaccurateandreliableasreal-worldconditionschange.Bycloselymonitoringitsperformance, wecanidentifyanydri ordegradationinaccuracyandtakecorrectiveactionspromptly.Second,it allowsustoidentifyandunderstandtheunderlyingfactorscontributingtothemodel’sperformance, enablingustomakeinformeddecisionsaboutenhancementsormodifications.Finally,itfacilitates theidentificationofnewopportunitiesorchallengesthatmayrequireadjustmentstothemodel.
Inthischapter,wewillexplorevarioustechniquesandstrategiesformonitoringandcontinuously improvingdatasciencemodels.Wewilldiscusstheimportanceofdefiningappropriateperformance metrics,settingupmonitoringsystems,establishingalertmechanisms,andimplementingfeedback loops.Additionally,wewilldelveintotheconceptofmodelretraining,whichinvolvesperiodically updatingthemodelusingnewdatatomaintainitsrelevanceande ectiveness.
Byembracingmonitoringandcontinuousimprovement,datascienceteamscanensurethattheir modelsremainaccurate,reliable,andalignedwithevolvingbusinessneeds.Itenablesorganizations toderivemaximumvaluefromtheirdataassetsandmakedata-drivendecisionswithconfidence.Let’s delveintothedetailsanddiscoverthebestpracticesformonitoringandcontinuouslyimprovingdata sciencemodels.
Monitoringandcontinuousimprovementindatasciencerefertotheongoingprocessofassessingand enhancingtheperformance,accuracy,andrelevanceofmodelsdeployedinreal-worldscenarios.It involvesthesystematictrackingofkeymetrics,identifyingareasofimprovement,andimplementing correctivemeasurestoensureoptimalmodelperformance.
Monitoringencompassestheregularevaluationofthemodel’soutputsandpredictionsagainstground truthdata.Itaimstoidentifyanydeviations,errors,oranomaliesthatmayariseduetochanging conditions,datadri ,ormodeldecay.Bymonitoringthemodel’sperformance,datascientistscan detectpotentialissuesearlyonandtakeproactivestepstorectifythem.
Continuousimprovementemphasizestheiterativenatureofrefiningandenhancingthemodel’s capabilities.Itinvolvesincorporatingfeedbackfromstakeholders,evaluatingthemodel’sperformance againstestablishedbenchmarks,andleveragingnewdatatoupdateandretrainthemodel.Thegoal istoensurethatthemodelremainsaccurate,relevant,andalignedwiththeevolvingneedsofthe businessorapplication.
Theprocessofmonitoringandcontinuousimprovementinvolvesvariousactivities.Theseinclude:
• PerformanceMonitoring:Trackingkeyperformancemetrics,suchasaccuracy,precision,recall, ormeansquarederror,toassessthemodel’soveralle ectiveness.
• Dri Detection:Identifyingandmonitoringdatadri ,conceptdri ,ordistributionalchangesin theinputdatathatmayimpactthemodel’sperformance.
• ErrorAnalysis:Investigatingerrorsordiscrepanciesinmodelpredictionstounderstandtheir rootcausesandidentifyareasforimprovement.
• FeedbackIncorporation:Gatheringfeedbackfromend-users,domainexperts,orstakeholders togaininsightsintothemodel’slimitationsorareasrequiringimprovement.
• ModelRetraining:Periodicallyupdatingthemodelbyretrainingitonnewdatatocapture evolvingpatterns,accountforchangesintheunderlyingenvironment,andenhanceitspredictive capabilities.
• A/BTesting:Conductingcontrolledexperimentstocomparetheperformanceofdi erentmodels orvariationstoidentifythemoste ectiveapproach.
Byimplementingrobustmonitoringandcontinuousimprovementpractices,datascienceteamscan ensurethattheirmodelsremainaccurate,reliable,andprovidevaluetotheorganization.Itfosters acultureoflearningandadaptation,allowingfortheidentificationofnewopportunitiesandthe optimizationofexistingmodels.
Figure1: IllustrationofDri DetectioninModeling.Themodel’sperformancegraduallydeteriorates overtime,necessitatingretrainingupondri detectiontomaintainaccuracy.
Performancemonitoringisacriticalaspectofthemonitoringandcontinuousimprovementprocessin datascience.Itinvolvestrackingandevaluatingkeyperformancemetricstoassessthee ectiveness andreliabilityofdeployedmodels.Bymonitoringthesemetrics,datascientistscangaininsightsinto
IbonMartínez-ArranzPage103
themodel’sperformance,detectanomaliesordeviations,andmakeinformeddecisionsregarding modelmaintenanceandenhancement.
Somecommonlyusedperformancemetricsindatascienceinclude:
• Accuracy:Measurestheproportionofcorrectpredictionsmadebythemodeloverthetotal numberofpredictions.Itprovidesanoverallindicationofthemodel’scorrectness.
• Precision:Representstheabilityofthemodeltocorrectlyidentifypositiveinstancesamong thepredictedpositiveinstances.Itisparticularlyusefulinscenarioswherefalsepositiveshave significantconsequences.
• Recall:Measurestheabilityofthemodeltoidentifyallpositiveinstancesamongtheactual positiveinstances.Itisimportantinsituationswherefalsenegativesarecritical.
• F1Score:Combinesprecisionandrecallintoasinglemetric,providingabalancedmeasureof themodel’sperformance.
• MeanSquaredError(MSE):Commonlyusedinregressiontasks,MSEmeasurestheaverage squareddi erencebetweenpredictedandactualvalues.Itquantifiesthemodel’spredictive accuracy.
• AreaUndertheCurve(AUC):Usedinbinaryclassificationtasks,AUCrepresentstheoverall performanceofthemodelindistinguishingbetweenpositiveandnegativeinstances.
Toe ectivelymonitorperformance,datascientistscanleveragevarioustechniquesandtools.These include:
• TrackingDashboards:Settingupdashboardsthatvisualizeanddisplayperformancemetricsin real-time.Thesedashboardsprovideacomprehensiveoverviewofthemodel’sperformance, enablingquickidentificationofanyissuesordeviations.
• AlertSystems:Implementingautomatedalertsystemsthatnotifydatascientistswhenspecific performancethresholdsarebreached.Thishelpsinidentifyingandaddressingperformance issuespromptly.
• TimeSeriesAnalysis:Analyzingtheperformancemetricsovertimetodetecttrends,patterns, oranomaliesthatmayimpactthemodel’se ectiveness.Thisallowsforproactiveadjustments andimprovements.
• ModelComparison:Conductingcomparativeanalysesofdi erentmodelsorvariationsto determinethemoste ectiveapproach.Thisinvolvesevaluatingmultiplemodelssimultaneously andtrackingtheirperformancemetrics.
Byactivelymonitoringperformancemetrics,datascientistscanidentifyareasthatrequireattention andmakedata-drivendecisionsregardingmodelmaintenance,retraining,orenhancement.This
iterativeprocessensuresthatthedeployedmodelsremainreliable,accurate,andalignedwiththe evolvingneedsofthebusinessorapplication.
Hereisatableshowcasingdi erentPythonlibrariesforgeneratingdashboards:
Library Description Website
Dash Aframeworkforbuildinganalyticalwebapps dash.plotly.com
Streamlit Asimpleande icienttoolfordataapps www.streamlit.io
Bokeh Interactivevisualizationlibrary docs.bokeh.org
Panel Ahigh-levelappanddashboardingsolution panel.holoviz.org
Plotly Datavisualizationlibrarywithinteractiveplots plotly.com
Flask Microwebframeworkforbuildingdashboards flask.palletsprojects.com
Voila ConvertJupyternotebooksintointeractivedashboards voila.readthedocs.io
Table1: Pythonwebapplicationandvisualizationlibraries.
Theselibrariesprovidedi erentfunctionalitiesandfeaturesforbuildinginteractiveandvisuallyappealingdashboards.DashandStreamlitarepopularchoicesforcreatingwebapplicationswithinteractive visualizations.BokehandPlotlyo erpowerfultoolsforcreatinginteractiveplotsandcharts.Panel providesahigh-levelappanddashboardingsolutionwithsupportfordi erentvisualizationlibraries. Flaskisamicrowebframeworkthatcanbeusedtocreatecustomizeddashboards.Voilaisusefulfor convertingJupyternotebooksintostandalonedashboards.
Dri detectionisacrucialaspectofmonitoringandcontinuousimprovementindatascience.Itinvolves identifyingandquantifyingchangesorshi sinthedatadistributionovertime,whichcansignificantly impacttheperformanceandreliabilityofdeployedmodels.Dri canoccurduetovariousreasons suchaschangesinuserbehavior,shi sindatasources,orevolvingenvironmentalconditions.
Detectingdri isimportantbecauseitallowsdatascientiststotakeproactivemeasurestomaintainmodelperformanceandaccuracy.Thereareseveraltechniquesandmethodsavailablefordri detection:
• StatisticalMethods:Statisticalmethods,suchashypothesistestingandstatisticaldistance measures,canbeusedtocomparethedistributionsofnewdatawiththeoriginaltrainingdata. Significantdeviationsinstatisticalpropertiescanindicatethepresenceofdri .
• ChangePointDetection:Changepointdetectionalgorithmsidentifypointsinthedatawherea significantchangeorshi occurs.Thesealgorithmsdetectabruptchangesinstatisticalproperties
orpatternsandcanbeappliedtovariousdatatypes,includingnumerical,categorical,andtime seriesdata.
• EnsembleMethods:Ensemblemethodsinvolvetrainingmultiplemodelsondi erentsubsets ofthedataandmonitoringtheirindividualperformance.Ifthereisasignificantdi erenceinthe performanceofthemodels,itmayindicatethepresenceofdri .
• OnlineLearningTechniques:Onlinelearningalgorithmscontinuouslyupdatethemodelasnew dataarrives.Bycomparingtheperformanceofthemodelonrecentdatawiththeperformance onhistoricaldata,dri canbedetected.
• ConceptDri Detection:Conceptdri referstochangesintheunderlyingconceptsorrelationshipsbetweeninputfeaturesandoutputlabels.Techniquessuchasconceptdri detectorsand dri -adaptivemodelscanbeusedtodetectandhandleconceptdri .
Itisessentialtoimplementdri detectionmechanismsaspartofthemodelmonitoringprocess. Whendri isdetected,datascientistscantakeappropriateactions,suchasretrainingthemodel withnewdata,adaptingthemodeltothechangingdatadistribution,ortriggeringalertsformanual intervention.
Dri detectionhelpsensurethatmodelscontinuetoperformoptimallyandremainalignedwiththe dynamicnatureofthedatatheyoperateon.Bycontinuouslymonitoringfordri ,datascientistscan maintainthereliabilityande ectivenessofthemodels,ultimatelyimprovingtheiroverallperformance andvalueinreal-worldapplications.
Erroranalysisisacriticalcomponentofmonitoringandcontinuousimprovementindatascience.It involvesinvestigatingerrorsordiscrepanciesinmodelpredictionstounderstandtheirrootcausesand identifyareasforimprovement.Byanalyzingandunderstandingthetypesandpatternsoferrors,data scientistscanmakeinformeddecisionstoenhancethemodel’sperformanceandaddresspotential limitations.
Theprocessoferroranalysistypicallyinvolvesthefollowingsteps:
• ErrorCategorization:Errorsarecategorizedbasedontheirnatureandimpact.Common categoriesincludefalsepositives,falsenegatives,misclassifications,outliers,andprediction deviations.Categorizationhelpsinidentifyingthespecifictypesoferrorsthatneedtobeaddressed.
• ErrorAttribution:Attributioninvolvesdeterminingthecontributingfactorsorfeaturesthat ledtotheoccurrenceoferrors.Thismayinvolveanalyzingtheinputdata,featureimportance,
modelbiases,orotherrelevantfactors.Understandingthesourcesoferrorshelpsinidentifying areasforimprovement.
• RootCauseAnalysis:Rootcauseanalysisaimstoidentifytheunderlyingreasonsorfactors responsiblefortheerrors.Itmayinvolveinvestigatingdataqualityissues,modellimitations, missingfeatures,orinconsistenciesinthetrainingprocess.Identifyingtherootcauseshelpsin devisingappropriatecorrectivemeasures.
• FeedbackLoopandIterativeImprovement:Erroranalysisprovidesvaluablefeedbackfor iterativeimprovement.Datascientistscanusetheinsightsgainedfromerroranalysistorefinethe model,retrainitwithadditionaldata,adjusthyperparameters,orconsideralternativemodeling approaches.Thefeedbackloopensurescontinuouslearningandimprovementofthemodel’s performance.
Erroranalysiscanbefacilitatedthroughvarioustechniquesandtools,includingvisualizations,confusionmatrices,precision-recallcurves,ROCcurves,andperformancemetricsspecifictotheproblem domain.Itisimportanttoconsiderbothquantitativeandqualitativeaspectsoferrorstogainacomprehensiveunderstandingoftheirimplications.
Byconductingerroranalysis,datascientistscanidentifyspecificweaknessesinthemodel,uncover biasesordataqualityissues,andmakeinformeddecisionstoimproveitsperformance.Erroranalysis playsavitalroleintheongoingmonitoringandrefinementofmodels,ensuringthattheyremain accurate,reliable,ande ectiveinreal-worldapplications.
Feedbackincorporationisanessentialaspectofmonitoringandcontinuousimprovementindata science.Itinvolvesgatheringfeedbackfromend-users,domainexperts,orstakeholderstogain insightsintothemodel’slimitationsorareasrequiringimprovement.Byactivelyseekingfeedback, datascientistscanenhancethemodel’sperformance,addressuserneeds,andalignitwiththeevolving requirementsoftheapplication.
Theprocessoffeedbackincorporationtypicallyinvolvesthefollowingsteps:
• SolicitingFeedback:Datascientistsactivelyseekfeedbackfromvarioussources,including end-users,domainexperts,orstakeholders.Thiscanbedonethroughsurveys,interviews,user testingsessions,orfeedbackmechanismsintegratedintotheapplication.Feedbackcanprovide valuableinsightsintothemodel’sperformance,usability,relevance,andalignmentwiththe desiredoutcomes.
• AnalyzingFeedback:Oncefeedbackiscollected,itneedstobeanalyzedandcategorized. Datascientistsassessthefeedbacktoidentifycommonpatterns,recurringissues,orareasof
improvement.Thisanalysishelpsinprioritizingthefeedbackanddeterminingthemostcritical aspectstoaddress.
• IncorporatingFeedback:Basedontheanalysis,datascientistsincorporatethefeedbackinto themodeldevelopmentprocess.Thismayinvolvemakingupdatestothemodel’sarchitecture, featureselection,trainingdata,orfine-tuningthemodel’sparameters.Incorporatingfeedback ensuresthatthemodelbecomesmoreaccurate,reliable,andalignedwiththeexpectationsof theend-users.
• IterativeImprovement:Feedbackincorporationisaniterativeprocess.Datascientistscontinuouslygatherfeedback,analyzeit,andmakeimprovementstothemodelaccordingly.This iterativeapproachallowsforthemodeltoevolveovertime,adaptingtochangingrequirements anduserneeds.
Feedbackincorporationcanbefacilitatedthroughcollaborationande ectivecommunicationchannels betweendatascientistsandstakeholders.Itpromotesauser-centricapproachtomodeldevelopment, ensuringthatthemodelremainsrelevantande ectiveinsolvingreal-worldproblems.
Byactivelyincorporatingfeedback,datascientistscanaddresslimitations,fine-tunethemodel’s performance,andenhanceitsusabilityande ectiveness.Feedbackfromend-usersandstakeholders providesvaluableinsightsthatguidethecontinuousimprovementprocess,leadingtobettermodels andimproveddecision-makingindatascienceapplications.
Modelretrainingisacrucialcomponentofmonitoringandcontinuousimprovementindatascience.It involvesperiodicallyupdatingthemodelbyretrainingitonnewdatatocaptureevolvingpatterns, accountforchangesintheunderlyingenvironment,andenhanceitspredictivecapabilities.Asnew databecomesavailable,retrainingensuresthatthemodelremainsup-to-dateandmaintainsits accuracyandrelevanceovertime.
Theprocessofmodelretrainingtypicallyfollowsthesesteps:
• DataCollection:Newdataiscollectedfromvarioussourcestoaugmenttheexistingdataset. Thiscanincludeadditionalobservations,updatedfeatures,ordatafromnewsources.Thenew datashouldberepresentativeofthecurrentenvironmentandreflectanychangesortrendsthat haveoccurredsincethemodelwaslasttrained.
• DataPreprocessing:Similartotheinitialmodeltraining,thenewdataneedstoundergopreprocessingstepssuchascleaning,normalization,featureengineering,andtransformation.This ensuresthatthedataisinasuitableformatfortrainingthemodel.
• ModelTraining:Theupdateddataset,combiningtheexistingdataandnewdata,isusedto retrainthemodel.Thetrainingprocessinvolvesselectingappropriatealgorithms,configuring hyperparameters,andfittingthemodeltothedata.Thegoalistocaptureanyemergingpatterns orchangesintheunderlyingrelationshipsbetweenvariables.
• ModelEvaluation:Oncethemodelisretrained,itisevaluatedusingappropriateevaluation metricstoassessitsperformance.Thishelpsdetermineiftheupdatedmodelisanimprovement overthepreviousversionandifitmeetsthedesiredperformancecriteria.
• Deployment:A ersuccessfulevaluation,theretrainedmodelisdeployedintheproductionenvironment,replacingthepreviousversion.Theupdatedmodelisthenreadytomakepredictions andprovideinsightsbasedonthemostrecentdata.
• MonitoringandFeedback:Oncetheretrainedmodelisdeployed,itundergoesongoingmonitoringandgathersfeedbackfromusersandstakeholders.Thisfeedbackcanhelpidentifyany issuesordiscrepanciesandguidefurtherimprovementsoradjustmentstothemodel.
Modelretrainingensuresthatthemodelremainse ectiveandadaptableindynamicenvironments. Byincorporatingnewdataandcapturingevolvingpatterns,themodelcanmaintainitspredictive capabilitiesanddeliveraccurateandrelevantresults.Regularretraininghelpsmitigatetheriskof modeldecay,wherethemodel’sperformancedeterioratesovertimeduetochangingdatadistributions orevolvinguserneeds.
Insummary,modelretrainingisavitalpracticeindatasciencethatensuresthemodel’saccuracyand relevanceovertime.Byperiodicallyupdatingthemodelwithnewdata,datascientistscancapture evolvingpatterns,adapttochangingenvironments,andenhancethemodel’spredictivecapabilities.
A/Btestingisavaluabletechniqueindatasciencethatinvolvesconductingcontrolledexperimentsto comparetheperformanceofdi erentmodelsorvariationstoidentifythemoste ectiveapproach.It isparticularlyusefulwhentherearemultiplecandidatemodelsorapproachesavailableandthegoal istodeterminewhichoneperformsbetterintermsofspecificmetricsorkeyperformanceindicators (KPIs).
TheprocessofA/Btestingtypicallyfollowsthesesteps:
• FormulateHypotheses:ThefirststepinA/Btestingistoformulatehypothesesregardingthe modelsorvariationstobetested.ThisinvolvesdefiningthespecificmetricsorKPIsthatwillbe usedtoevaluatetheirperformance.Forexample,ifthegoalistooptimizeclick-throughrates onawebsite,thehypothesiscouldbethatVariationAwilloutperformVariationBintermsof conversionrates.
IbonMartínez-ArranzPage109
• DesignExperiment:Awell-designedexperimentiscrucialforreliableandinterpretableresults. Thisinvolvessplittingthetargetaudienceordatasetintotwoormoregroups,witheachgroup exposedtoadi erentmodelorvariation.Randomassignmentiso enusedtoensureunbiased comparisons.Itisessentialtocontrolforconfoundingfactorsandensurethattheexperimentis conductedundersimilarconditions.
• ImplementModels/Variations:Themodelsorvariationsbeingcomparedareimplementedin theexperimentalsetup.Thiscouldinvolvedeployingdi erentmachinelearningmodels,varying algorithmparameters,orpresentingdi erentversionsofauserinterfaceorsystembehavior. Theimplementationshouldbeconsistentwiththehypothesisbeingtested.
• CollectandAnalyzeData:Duringtheexperiment,dataiscollectedontheperformanceofeach model/variationintermsofthedefinedmetricsorKPIs.Thisdataisthenanalyzedtocompare theoutcomesandassessthestatisticalsignificanceofanyobserveddi erences.Statistical techniquessuchashypothesistesting,confidenceintervals,orBayesiananalysismaybeapplied todrawconclusions.
• DrawConclusions:Basedonthedataanalysis,conclusionsaredrawnregardingtheperformance ofthedi erentmodels/variants.Thisincludesdeterminingwhetheranyobserveddi erences arestatisticallysignificantandwhetherthehypothesescanbeacceptedorrejected.Theresults oftheA/Btestingprovideinsightsintowhichmodelorapproachismoree ectiveinachieving thedesiredobjectives.
• ImplementWinningModel/Variation:IfaclearwinneremergesfromtheA/Btesting,the winningmodelorvariationisselectedforimplementation.Thisdecisionisbasedontheidentified performanceadvantagesandalignswiththedesiredgoals.Theselectedmodel/variationcan thenbedeployedintheproductionenvironmentorusedtoguidefurtherimprovements.
A/Btestingprovidesarobustmethodologyforcomparingandselectingmodelsorvariationsbasedon real-worldperformancedata.Byconductingcontrolledexperiments,datascientistscanobjectively evaluatedi erentapproachesandmakedata-drivendecisions.Thisiterativeprocessallowsforcontinuousimprovement,asunderperformingmodelscanbediscardedorrefined,andsuccessfulmodels canbefurtheroptimizedorenhanced.
Insummary,A/Btestingisapowerfultechniqueindatasciencethatenablesthecomparisonofdi erent modelsorvariationstoidentifythemoste ectiveapproach.Bydesigningandconductingcontrolled experiments,datascientistscangatherempiricalevidenceandmakeinformeddecisionsbasedon observedperformance.A/Btestingplaysavitalroleinthecontinuousimprovementofmodelsandthe optimizationofkeyperformancemetrics.
DataScienceWorkflowManagement
Library Description
Statsmodels Astatisticallibraryprovidingrobustfunctionalityforexperimentaldesignandanalysis,includingA/Btesting.
SciPy Alibraryo eringstatisticalandnumericaltoolsforPython.It includesfunctionsforhypothesistesting,suchast-testsand chi-squaretests,commonlyusedinA/Btesting.
pyAB AlibraryspecificallydesignedforconductingA/Btestsin Python.Itprovidesauser-friendlyinterfacefordesigningand runningA/Bexperiments,calculatingperformancemetrics, andperformingstatisticalanalysis.
Evan EvanisaPythonlibraryforA/Btesting.Ito ersfunctionsfor randomtreatmentassignment,performancestatisticcalculation,andreportgeneration.
Table2: PythonlibrariesforA/Btestingandexperimentaldesign.
Website
Statsmodels
Evan
Modelperformancemonitoringisacriticalaspectofthemodellifecycle.Itinvolvescontinuously assessingtheperformanceofdeployedmodelsinreal-worldscenariostoensuretheyareperforming optimallyanddeliveringaccuratepredictions.Bymonitoringmodelperformance,organizationscan identifyanydegradationordri inmodelperformance,detectanomalies,andtakeproactivemeasures tomaintainorimprovemodele ectiveness.
KeyStepsinModelPerformanceMonitoring:
• DataCollection:Collectrelevantdatafromtheproductionenvironment,includinginputfeatures,targetvariables,andpredictionoutcomes.
• PerformanceMetrics:Defineappropriateperformancemetricsbasedontheproblemdomain andmodelobjectives.Commonmetricsincludeaccuracy,precision,recall,F1score,mean squarederror,andareaunderthecurve(AUC).
• MonitoringFramework:Implementamonitoringframeworkthatautomaticallycapturesmodel predictionsandcomparesthemwithgroundtruthvalues.Thisframeworkshouldgenerate performancemetrics,trackmodelperformanceovertime,andraisealertsifsignificantdeviations aredetected.
• VisualizationandReporting:Usedatavisualizationtechniquestocreatedashboardsand reportsthatprovideanintuitiveviewofmodelperformance.Thesevisualizationscanhelp
IbonMartínez-ArranzPage111
stakeholdersidentifytrends,patterns,andanomaliesinthemodel’spredictions.
• AlertingandThresholds:Setupalertingmechanismstonotifystakeholderswhenthemodel’s performancefallsbelowpredefinedthresholdsorexhibitsunexpectedbehavior.Thesealerts promptinvestigationsandactionstorectifyissuespromptly.
• RootCauseAnalysis:Performthoroughinvestigationstoidentifytherootcausesofperformance degradationoranomalies.Thisanalysismayinvolveexaminingdataqualityissues,changesin inputdistributions,conceptdri ,ormodeldecay.
• ModelRetrainingandUpdating:Whensignificantperformanceissuesareidentified,consider retrainingthemodelusingupdateddataorapplyingothertechniquestoimproveitsperformance. Regularlyassesstheneedformodelretrainingandupdatestoensureoptimalperformanceover time.
Byimplementingarobustmodelperformancemonitoringprocess,organizationscanidentifyand addressissuespromptly,ensurereliablepredictions,andmaintaintheoveralle ectivenessandvalue oftheirmodelsinreal-worldapplications.
ProblemIdentification
Problemidentificationisacrucialstepintheprocessofmonitoringandcontinuousimprovementof models.Itinvolvesidentifyinganddefiningthespecificissuesorchallengesfacedbydeployedmodels inreal-worldscenarios.Byaccuratelyidentifyingtheproblems,organizationscantaketargetedactions toaddressthemandimprovemodelperformance.
KeyStepsinProblemIdentification:
• DataAnalysis:Conductacomprehensiveanalysisoftheavailabledatatounderstanditsquality, completeness,andrelevancetothemodel’sobjectives.Identifyanydataanomalies,inconsistencies,ormissingvaluesthatmaya ectmodelperformance.
• PerformanceDiscrepancies:Comparethepredictedoutcomesofthemodelwiththeground truthorexpectedoutcomes.Identifyinstanceswherethemodel’spredictionsdeviatesignificantlyfromthedesiredresults.Thisanalysiscanhelppinpointareasofpoormodelperformance.
• UserFeedback:Gatherfeedbackfromend-users,stakeholders,ordomainexpertswhointeract withthemodelorrelyonitspredictions.Theirinsightsandobservationscanprovidevaluableinformationaboutanylimitations,biases,orareasrequiringimprovementinthemodel’s performance.
Page112IbonMartínez-Arranz
• BusinessImpactAssessment:Assesstheimpactofmodelperformanceissuesontheorganization’sgoals,processes,anddecision-making.Identifyscenarioswheremodelerrorsor inaccuracieshavesignificantconsequencesorresultinsuboptimaloutcomes.
• RootCauseAnalysis:Performarootcauseanalysistounderstandtheunderlyingfactorscontributingtotheidentifiedproblems.Thisanalysismayinvolveexaminingdataissues,model limitations,algorithmicbiases,orchangesintheunderlyingenvironment.
• ProblemPrioritization:Prioritizetheidentifiedproblemsbasedontheirseverity,impacton businessobjectives,andpotentialforimprovement.Thisprioritizationhelpsallocateresources e ectivelyandfocusonresolvingcriticalissuesfirst.
Bydiligentlyidentifyingandunderstandingtheproblemsa ectingmodelperformance,organizationscandeveloptargetedstrategiestoaddressthem.Thisprocesssetsthestageforimplementing appropriatesolutionsandcontinuouslyimprovingthemodelstoachievebetteroutcomes.
Continuousmodelimprovementisacrucialaspectofthemodellifecycle,aimingtoenhancethe performanceande ectivenessofdeployedmodelsovertime.Itinvolvesaproactiveapproachto iterativelyrefineandoptimizemodelsbasedonnewdata,feedback,andevolvingbusinessneeds. Continuousimprovementensuresthatmodelsstayrelevant,accurate,andalignedwithchanging requirementsandenvironments.
KeyStepsinContinuousModelImprovement:
• FeedbackCollection:Activelyseekfeedbackfromend-users,stakeholders,domainexperts, andotherrelevantpartiestogatherinsightsonthemodel’sperformance,limitations,andareas forimprovement.Thisfeedbackcanbeobtainedthroughsurveys,interviews,userfeedback mechanisms,orcollaborationwithsubjectmatterexperts.
• DataUpdates:Incorporatenewdataintothemodel’strainingandvalidationprocesses.Asmore databecomesavailable,retrainingthemodelwithupdatedinformationhelpscaptureevolving patterns,trends,andrelationshipsinthedata.Regularlyrefreshingthetrainingdataensures thatthemodelremainsaccurateandrepresentativeoftheunderlyingphenomenaitaimsto predict.
• FeatureEngineering:Continuouslyexploreandengineernewfeaturesfromtheavailabledata toimprovethemodel’spredictivepower.Featureengineeringinvolvestransforming,combining, orcreatingnewvariablesthatcapturerelevantinformationandrelationshipsinthedata.By identifyingandincorporatingmeaningfulfeatures,themodelcangaindeeperinsightsandmake moreaccuratepredictions. IbonMartínez-ArranzPage113
• ModelOptimization:Evaluateandexperimentwithdi erentmodelarchitectures,hyperparameters,oralgorithmstooptimizethemodel’sperformance.Techniquessuchasgridsearch,random search,orBayesianoptimizationcanbeemployedtosystematicallyexploretheparameterspace andidentifythebestconfigurationforthemodel.
• PerformanceMonitoring:Continuouslymonitorthemodel’sperformanceinreal-worldapplicationstoidentifyanydegradationordeteriorationovertime.Bymonitoringkeymetrics, detectinganomalies,andcomparingperformanceagainstestablishedthresholds,organizations canproactivelyaddressanyissuesandensurethemodel’sreliabilityande ectiveness.
• RetrainingandVersioning:Periodicallyretrainthemodelonupdateddatatocapturechanges andmaintainitsrelevance.Considerimplementingversioncontroltotrackmodelversions, makingiteasiertocompareperformance,rollbacktopreviousversionsifnecessary,andfacilitate collaborationamongteammembers.
• DocumentationandKnowledgeSharing:Documenttheimprovements,changes,andlessons learnedduringthecontinuousimprovementprocess.Maintainarepositoryofmodel-related information,includingdatapreprocessingsteps,featureengineeringtechniques,modelconfigurations,andperformanceevaluations.Thisdocumentationfacilitatesknowledgesharing, collaboration,andfuturemodelmaintenance.
Byembracingcontinuousmodelimprovement,organizationscanunlockthefullpotentialoftheir models,adapttochangingdynamics,andensureoptimalperformanceovertime.Itfostersaculture oflearning,innovation,anddata-drivendecision-making,enablingorganizationstostaycompetitive andmakeinformedbusinesschoices.
References
Books
• Provost,F.,&Fawcett,T.(2013).DataScienceforBusiness.O’ReillyMedia.
• Hastie,T.,Tibshirani,R.,&Friedman,J.(2009).TheElementsofStatisticalLearning:DataMining, Inference,andPrediction.Springer.
• James,G.,Witten,D.,Hastie,T.,&Tibshirani,R.(2013).AnIntroductiontoStatisticalLearning: withApplicationsinR.Springer.
ScientificArticles
• Kohavi,R.,&Longbotham,R.(2017).OnlineControlledExperimentsandA/BTesting:Identifying, Understanding,andEvaluatingVariations.InProceedingsofthe23rdACMSIGKDDInternational ConferenceonKnowledgeDiscoveryandDataMining(pp.1305-1306).ACM.
• Caruana,R.,&Niculescu-Mizil,A.(2006).Anempiricalcomparisonofsupervisedlearningalgorithms.InProceedingsofthe23rdInternationalConferenceonMachineLearning(pp.161-168).