Lianne McLean - March 2025 Market Report Peninsula Estates
Peninsula Estates
San Francisco County
Jump to San Francisco County Report
San Mateo County
Jump to San Mateo County Report
Belmont
Jump to Belmont Report
Jump to Burlingame Report Burlingame
Jump to Daly City Report Daly City
Foster City
Jump to Foster City Report
Half Moon Bay
Jump to Half Moon Bay Report
Hillsborough
Jump to Hillsborough Report
Jump to Millbrae Report
Jump to Pacifica Report
San Bruno
Jump to San Bruno Report
San Carlos
Jump to San Carlos Report
San Mateo
Jump to San Mateo Report
South San Francisco
Jump to South San Francisco Report
What’syourhome reallyworthin today’smarket?
That's the question you should be asking yourself.
Our market is incredibly diverse and rapidly changing. Values vary not just by neighborhood but by street. Your home isn't necessarily worth what your neighbors' home is. It's the current market that sets the value of your home.
So, do you know what your home is worth today's market?
Icanhelp...
Contact me for a confidential, no obligation assessment of your home's value.
MoreBuyersAreMakingMoves IsItTimeToSell?
More people are taking steps to buy a home. And, if you’ve been waiting for the right time to move, this may be the sign you’ve been looking for.
For the past few years, a lot of would-be homebuyers hit pause on their plans. With rising mortgage rates and affordability challenges, buying just didn’t seem doable. But now, more of them are getting back out there. That’s because they’re getting used to the fact that this may be the new normal for the market – especially as forecasts show mortgage rates may be starting to stabilize.
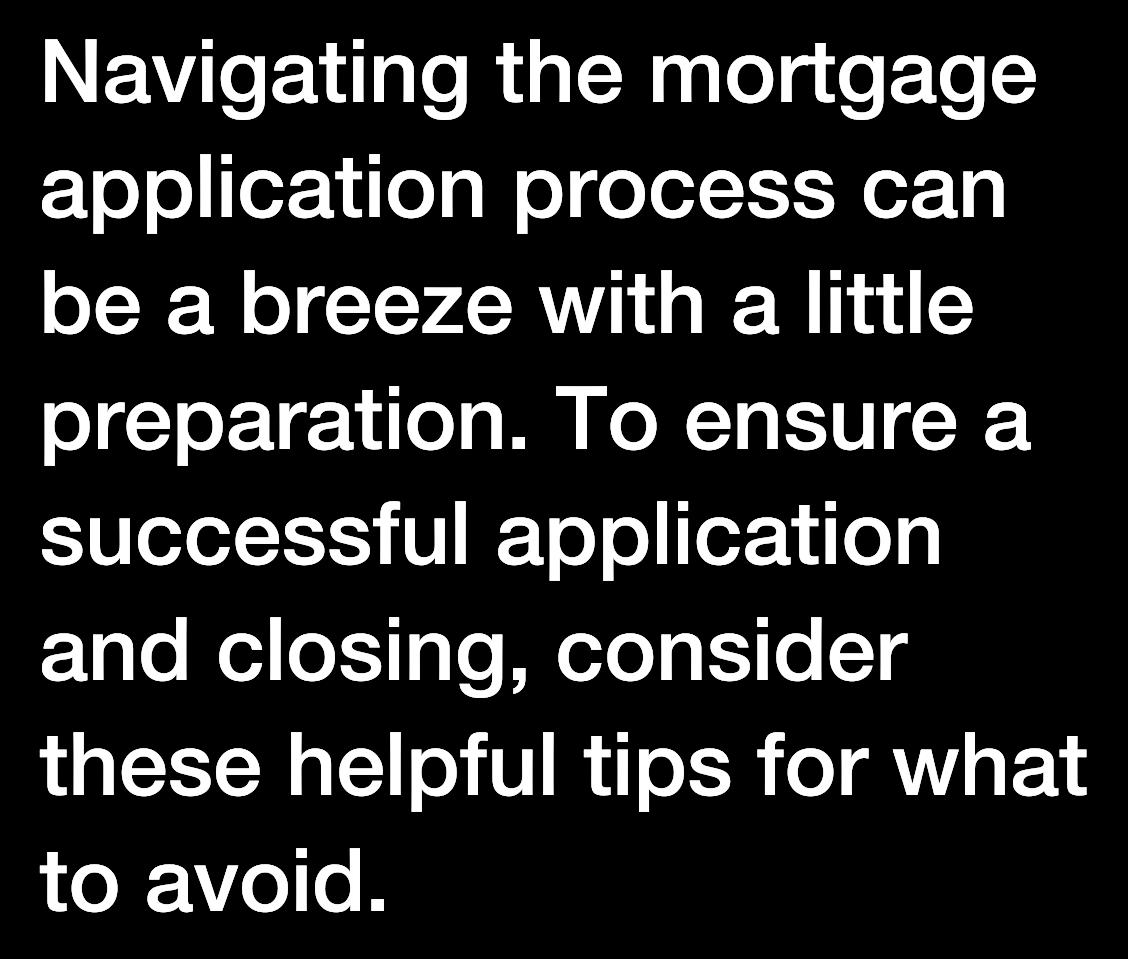
Smart Strategies for a Mortgage Application
Avoid paying off debts or collections without professional advice.
Don't have your credit report pulled too many times - this can hurt your credit score. 3 4 5 6 1 2
Always consult your mortgage professional before making large financial moves. Use verified funds for deposits to prevent closing delays.
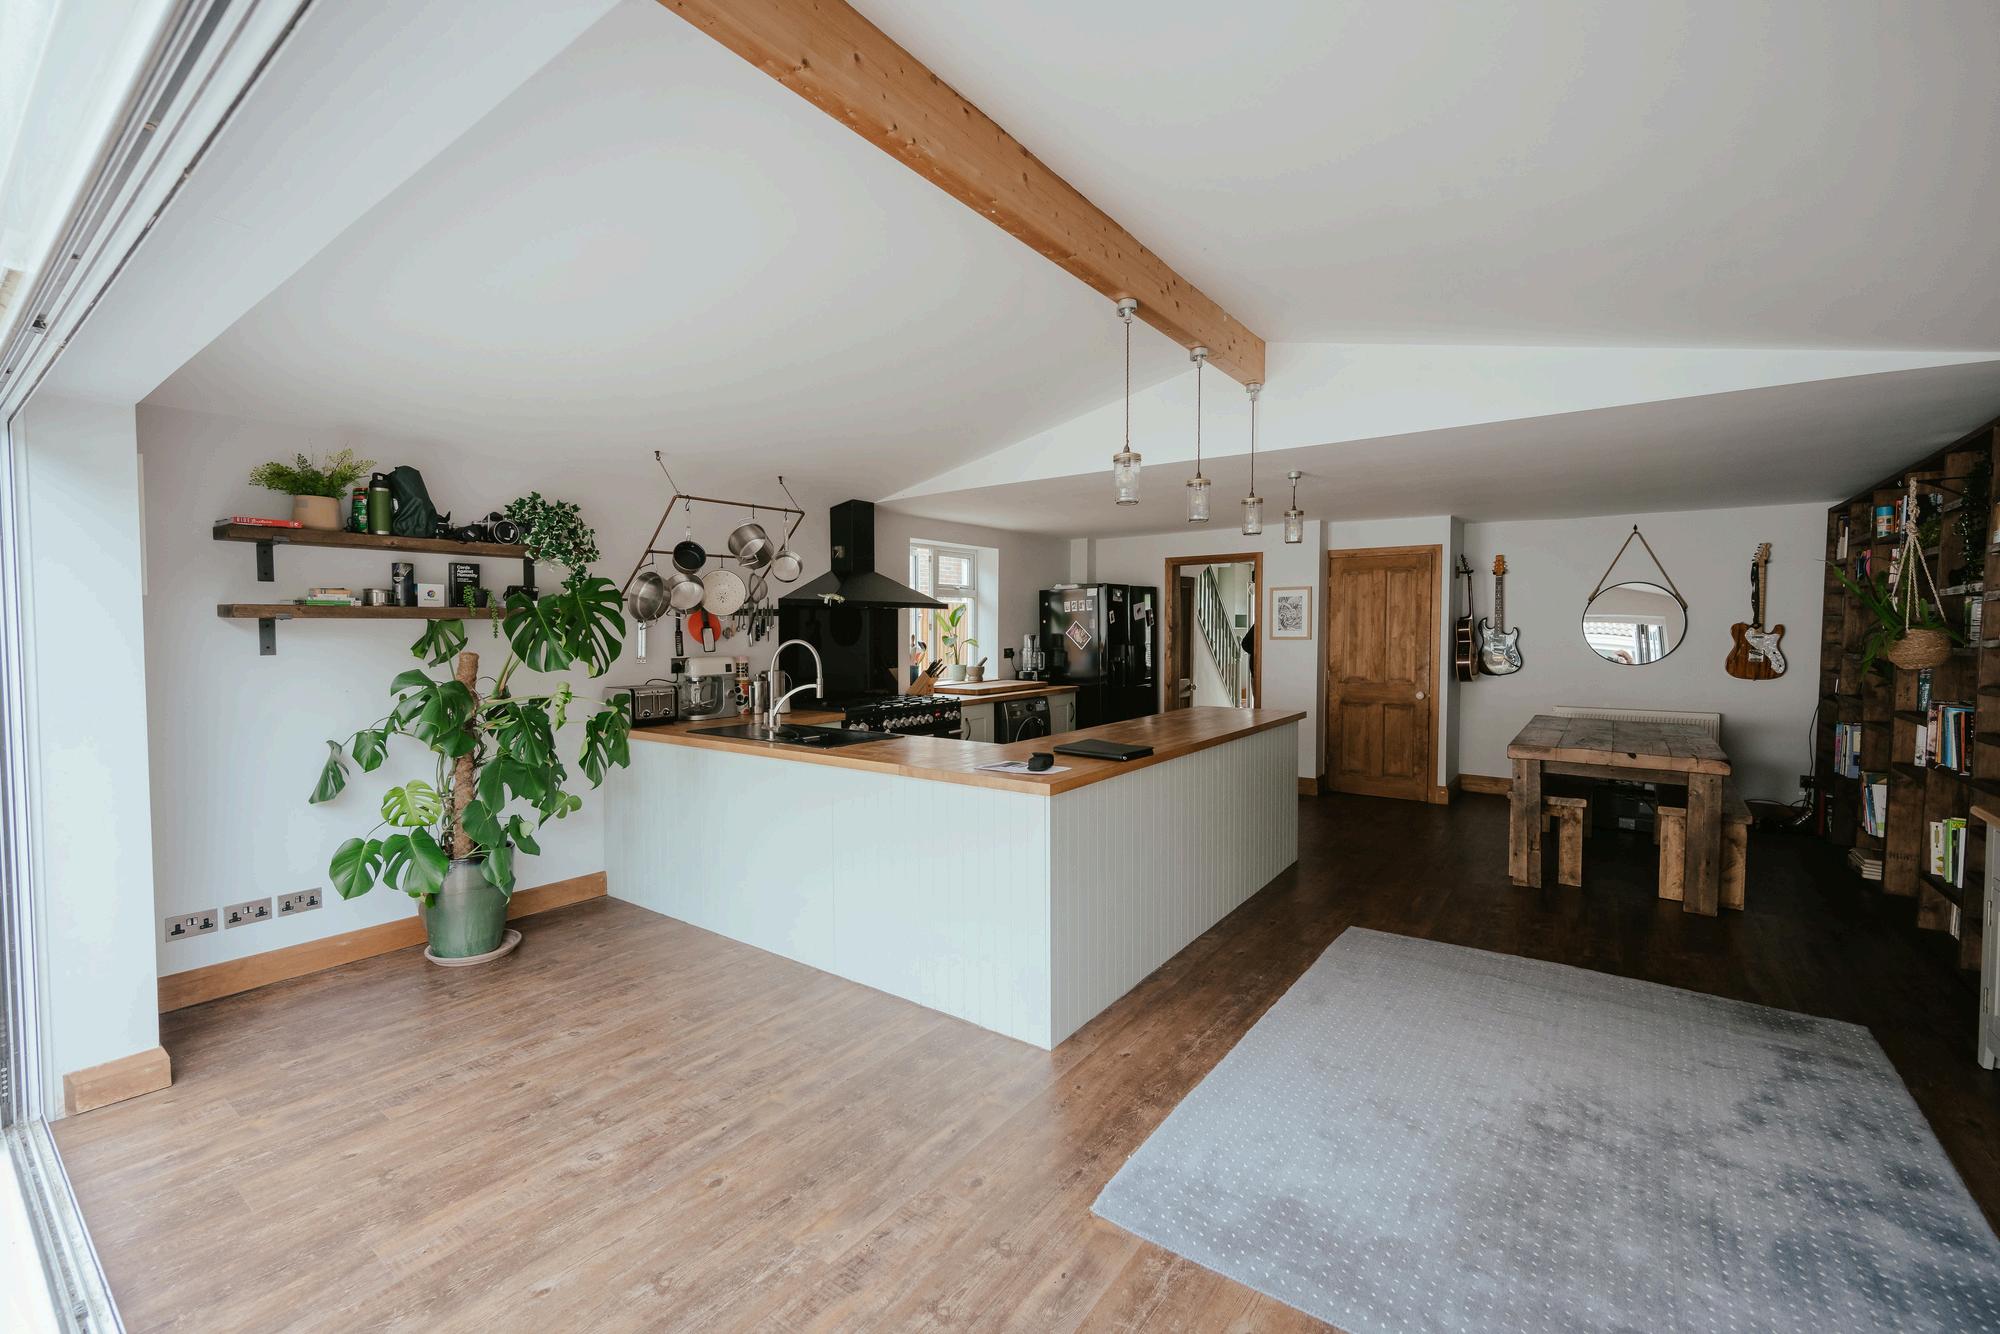
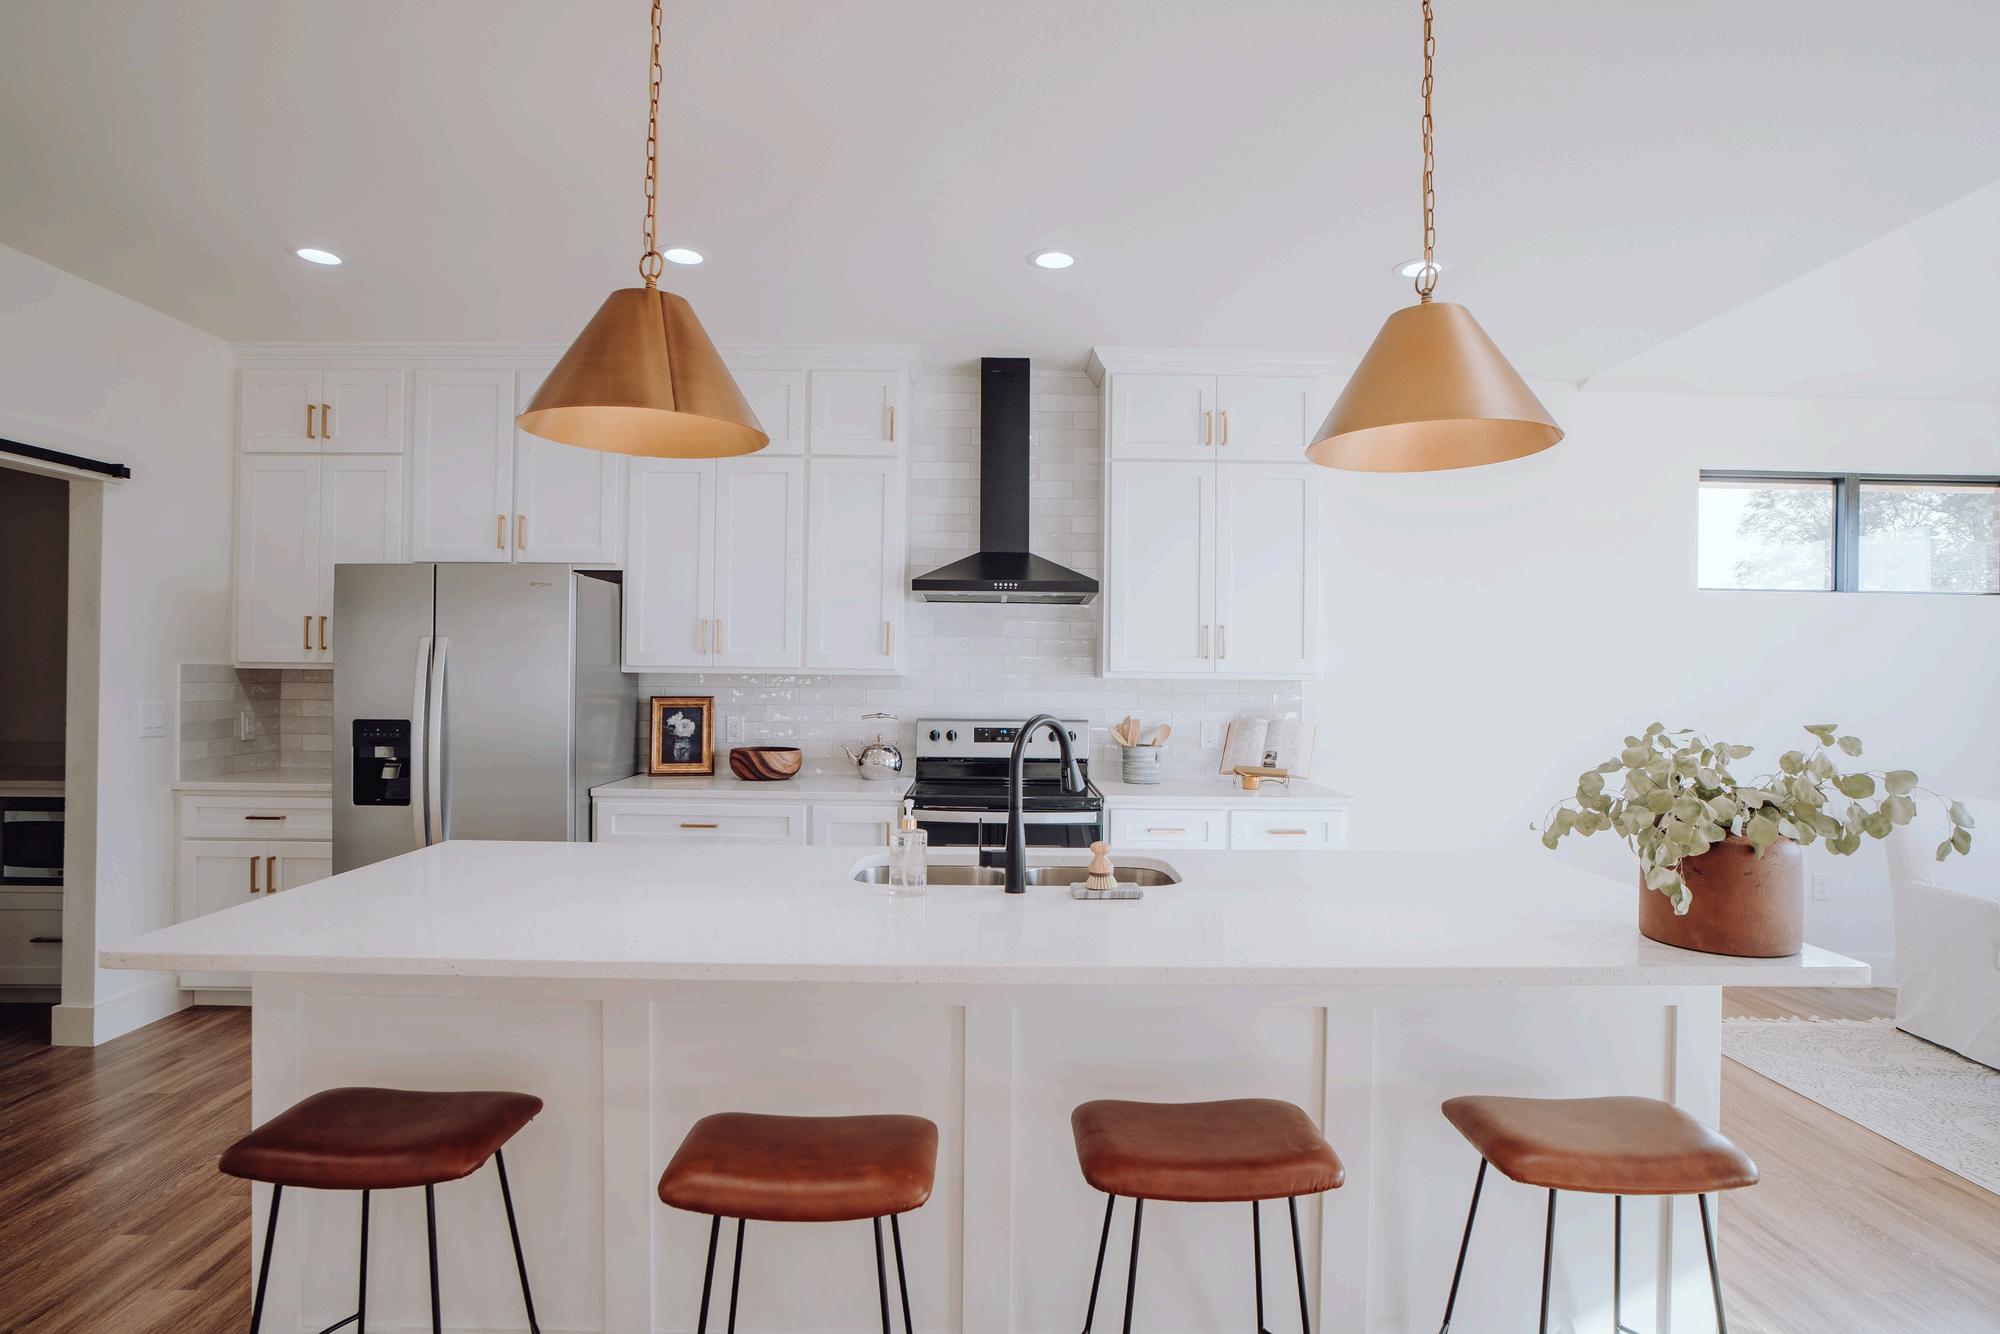
HomeRenovationsThatCanMakea BIG IMPACT AccordingtoExperts
Enhancing Property Value and Family Living Space with an Acton ADU
The Anenberg-Essert family in Campbell collaborated with Acton ADU to create a versatile, comfortable, and valuable addition to their property. This ADU project is a shining example of how a well-designed accessory dwelling unit can increase property value and serve a family’s unique needs.
GoalsandVision
The family envisioned an ADU that would function as an independent living space for family members, enhance their property’s worth, and provide seamless integration with the main home They wanted a space that balanced privacy with connectivity, feeling like a natural extension of their residence
Design and Construction Details
Constructed at 747 square feet, this ADU was designed with modern, high-quality finishes to serve both aesthetic and practical needs. Key features include:
Vaulted Ceilings
Creates a spacious, open atmosphere
Senior-Friendly Living
Safe, independent space for elderly family members
Fully Equipped Kitchen
Modern amenities for everyday convenience
Open Living Area
Multipurpose area for relaxation and entertainment
Results and Impact
The completion of the Anenberg-Essert ADU led to several valuable outcomes:
Increased Property Value
The ADU addition significantly boosted property value
Flexible Living Space
A versatile space for family, guests, or as a rental
Modern Comforts
High-end finishes and amenities enhance both function and style.
Enhanced Family Living
The ADU enriches the AnenbergEssert family’s home with both privacy and connection
VENDOR DIRECTORY
When it comes to home ownership, knowing who you can trust is crucial. That's why we've curated a select list of trusted vendors who are ready to help with your home goals.
San Francisco County
What's in the San Francisco County data?
There were 232 single-family homes for sale, providing 1.6 months of inventory. There were 214 new listings, and 141 homes sold at a median price of $1.6m. The median overbid percentage was at 113.4%, with an average of 24 days on the market.
There were 601 condo and townhome units for sale, providing 4 months of inventory. There were 327 new listings and 152 units sold at a median sale price of $1m. The median overbid percentage was at 101.9%, with an average of 49 days on the market.
SFH
Single-Family Homes
214 New Listings
141 Sold Listings
1.6 Months of Inventory
$1.6M Median Sale Price
113.4%
Median Sale vs List
24 Avg Days on Market
The data, sourced from MLS Listings Inc, includes all single-family homes, condos and townhomes in the California Area from February 2024 to February 2025. This may include preliminary data, and may vary from the time the data was gathered. All data is deemed reliable but not guaranteed. DRE# 01906450. Copyright KW Advisors Peninsula Estates | Burlingame | San Mateo 2025. Each office is independently owned and operated.
Listings 4 Months of Inventory
Median Sale vs List 49 Avg Days on Market 152 Sold Listings
SanFranciscoCounty
FEBRUARY 2024 - FEBRUARY 2025
LISTINGS FOR SALE SOLD LISTINGS
Single-Family Homes
Last 12 months, year-over-year.
Condos & Townhomes
Last 12 months, year-over-year
Median SalesPrice
Single-Family Homes
The median sale price has increased from $1 5m last February 2024, to $1 6m as of February 2025
Condos & Townhomes
The median sale price has decreased from $1 2m last February 2024, to $1m as of February 2025
AVGDays OntheMarket
Single-Family Homes
The average time spent on the market went down from 33 days last February 2024, to 24 days as of February 2025
Condos & Townhomes
The average time spent on the market went up from 44 days in February 2024, to 49 days as of February 2025.
Overbids
Single-Family Homes
The overbid percentage has increased from 108% last February 2024, to 113 4% a year later
Condos & Townhomes
The overbid percentage has increased from 100.5% last February 2024, to 101.9% a year later.
SanMateo County
What's in the San Mateo Cou data?
There were 430 single-family homes for sale providing 2.2 months of inventory. There we new listings, and 199 homes sold at a media price of $2m. The median overbid percentag at 106 7%, with an average of 21 days on the market.
There were 272 condo and townhome units sale, providing 4.5 months of inventory. Ther were 192 new listings and 60 units sold at a median sale price of $989k. The median ove percentage was at 103.1%, with an average o days on the market
He-Family Homes
8 ngs
199 Sold Listings
2 f Inventory
$2M Median Sale Price
6.7% ale vs List
21 Avg Days on Market
urced from MLS Listings Inc, includes all single-family homes, condos and the California Area from February 2024 to February 2025. This may include data, and may vary from the time the data was gathered. All data is deemed guaranteed. DRE# 01906450. Copyright KW Advisors Peninsula Estates | Burlingame | San Mateo 2025. Each office is independently owned and operated.
192 New Listings
60 Sold Listings
4.5
Months of Inventory
$989K Median Sale Price 103.1%
Median Sale vs List 36 Avg Days on Market
FEBRUARY 2024 - FEBRUARY 2025
NGS FOR SALE SOLD LISTINGS
amily Homes months, year-over-year. & Townhomes months, year-over-year
Median SalesPrice
Single-Family Homes
The median sale price has increased from $1 8m last February 2024, to $2m as of February 2025
Condos & Townhomes
The median sale price has increased from $910k last February 2024, to $989k as of February 2025
AVGDays OntheMarket
Single-Family Homes
The average time spent on the market went down from 27 days last February 2024, to 21 days as of February 2025
Condos & Townhomes
The average time spent on the market went down from 38 days in February 2024, to 36 days as of February 2025.
Overbids
Single-Family Homes
The overbid percentage has increased from 104 8% last February 2024, to 106 7% a year later
Condos & Townhomes
The overbid percentage has increased from 100.6% last February 2024, to 103.1% a year later.
Belm
What's in the
There were 9 singleproviding 0.7 month new listings, and 13 of $2.7m. The media 110.6%, with an aver
There were 7 condo providing 3.5 month new listings and 2 u price of $911k. The was at 100%, with an market.
18 New Listings
13 Sold Listings
0.7 Months of Inventory
$2.7M Median Sale Price
110.6% Median Sale vs List
6 Avg Days on Market
all single-family homes, condos and 2024 to February 2025. This may include data was gathered. All data is deemed Copyright KW Advisors Peninsula Estates | Burlingame | San Mateo 2025. Each office is independently owned and operated.
5
New Listings
2 Sold Listings
3.5 Months of Inventory $911K Median Sale Price 100%
Median Sale vs List 4 Avg Days on Market
Median SalesPrice
Single-Family Homes
The median sale price has increased from $2 6m last February 2024, to $2 7m as of February 2025
Condos & Townhomes
The median sale price has decreased from $2 4m last February 2024, to $911k as of February 2025
AVGDays OntheMarket
Single-Family Homes
The average time spent on the market went down from 7 days last February 2024, to 6 days as of February 2025
Condos & Townhomes
The average time spent on the market went up from 0 days in February 2024, to 4 days as of February 2025.
Overbids
Single-Family Homes
The overbid percentage has increased from 108 5% last February 2024, to 110 6% a year later
Condos & Townhomes
The overbid percentage has remained the same from 100% last February 2024, to 100% a year later.
Burli
What's in the
There were 11 single providing 1.6 months new listings, and 7 ho of $3.4m. The media 103.8%, with an avera
There were 7 condo a providing 0 months o new listings and 0 un price of $0. The med at 97%, with an avera
12 New Listings
7 Sold Listings
1.6 Months of Inventory
$3.4M Median Sale Price
103.8% Median Sale vs List
37 Avg Days on Market
single-family homes, condos and February 2025. This may include was gathered. All data is deemed KW Advisors Peninsula Estates | Burlingame | San Mateo 2025. Each office is independently owned and operated.
New Listings 0
Months of Inventory
& Townhomes
Sold Listings
Median Sale Price 97%
Median Sale vs List
Avg Days on Market
Burlingame
FEBRUARY 2024 - FEBRUARY 2025
LISTINGS FOR SALE SOLD LISTINGS
Single-Family Homes
Last 12 months, year-over-year.
Condos & Townhomes
Last 12 months, year-over-year
Median SalesPrice
Single-Family Homes
The median sale price has increased from $3 1m last February 2024, to $3 4m as of February 2025
Condos & Townhomes
The median sale price has decreased from $1m last February 2024, to $0 as of February 2025
AVGDays OntheMarket
Single-Family Homes
The average time spent on the market went up from 12 days last February 2024, to 37 days as of February 2025
Condos & Townhomes
The average time spent on the market went down from 32 days in February 2024, to 0 days as of February 2025.
Overbids
Single-Family Homes
The overbid percentage has decreased from 106% last February 2024, to 103 8% a year later
Condos & Townhomes
The overbid percentage has increased from 96.3% last February 2024, to 97% a year later.
gle-Family Homes
46 New Listings
16 Sold Listings
2.5 Months of Inventory
$1.2M Median Sale Price
109.6%
Median Sale vs List
14 Avg Days on Market
ta, sourced from MLS Listings Inc, includes all single-family homes, condos and townhomes in the California Area from February 2024 to February 2025. This may include preliminary data, and may vary from the time the data was gathered. All data is deemed but not guaranteed. DRE# 01906450. Copyright KW Advisors Peninsula Estates | Burlingame | San Mateo 2025. Each office is independently owned and operated.
16
New Listings
4
Sold Listings
$773K Median Sale Price 104.6% Median Sale vs List 13 Avg Days on Market
4.5 Months of Inventory
Median SalesPrice
Single-Family Homes
The median sale price has decreased from $1 27m last February 2024, to $1 22m as of February 2025
Condos & Townhomes
The median sale price has increased from $675k last February 2024, to $773k as of February 2025
AVGDays OntheMarket
Single-Family Homes
The average time spent on the market went down from 29 days last February 2024, to 14 days as of February 2025
Condos & Townhomes
The average time spent on the market went down from 47 days in February 2024, to 13 days as of February 2025.
Overbids
Single-Family Homes
The overbid percentage has decreased from 109 9% last February 2024, to 109 6% a year later
Condos & Townhomes
The overbid percentage has increased from 100% last February 2024, to 104.6% a year later.
FosterCity
What's in the Foster City data?
There were 2 single-family homes for sale, providing 0.4 months of inventory. There were 5 new listings, and 5 homes sold at a median price of $2.2m. The median overbid percentage was at 103.2%, with an average of 13 days on the market.
There were 28 condo and townhome units for sale, providing 3.1 months of inventory. There were 25 new listings and 9 units sold at a median sale price of $1.2m. The median overbid percentage was at 111.5%, with an average of 8 days on the market.
Single-Family Homes
5 New Listings
5 Sold Listings
0.4 Months of Inventory
$2.2M Median Sale Price
103.2%
Median Sale vs List
13 Avg Days on Market
The data, sourced from MLS Listings Inc, includes all single-family homes, condos and townhomes in the California Area from February 2024 to February 2025. This may include preliminary data, and may vary from the time the data was gathered. All data is deemed reliable but not guaranteed. DRE# 01906450. Copyright KW Advisors Peninsula Estates | Burlingame | San Mateo 2025. Each office is independently owned and operated.
Condo & Townhomes
25
New Listings
9 Sold Listings
3.1
Months of Inventory
$1.2M
Median Sale Price
111.5%
Median Sale vs List
8 Avg Days on Market
FEBRUARY 2024 - FEBRUARY 2025
LISTINGS FOR SALE SOLD LISTINGS
Single-Family Homes
Last 12 months, year-over-year.
Condos & Townhomes
Last 12 months, year-over-year
Median SalesPrice
Single-Family Homes
The median sale price has increased from $1 9m last February 2024, to $2 2m as of February 2025
Condos & Townhomes
The median sale price has decreased from $1 3m last February 2024, to $1 2m as of February 2025
AVGDays OntheMarket
Single-Family Homes
The average time spent on the market went up from 5 days last February 2024, to 13 days as of February 2025
Condos & Townhomes
The average time spent on the market went down from 31 days in February 2024, to 8 days as of February 2025.
Overbids
Single-Family Homes
The overbid percentage has decreased from 108 5% last February 2024, to 103 2% a year later
Condos & Townhomes
The overbid percentage has increased from 99.2% last February 2024, to 111.5% a year later.
HalfMoon Bay
What's in the Half Moon Bay data?
There were 18 single-family homes for sale, providing 4.5 months of inventory. There were 11 new listings, and 4 homes sold at a median price of $2.9m. The median overbid percentage was at 96 4%, with an average of 120 days on the market
There were 7 condo and townhome units for sale, providing 0 months of inventory. There were 7 new listings and 0 units sold at a median sale price of $0. The median overbid percentage was at 0%, with an average of 0 days on the market.
Single-Family Homes
11 New Listings
4 Sold Listings
4.5 Months of Inventory
$2.9M Median Sale Price
96.4%
Median Sale vs List
120 Avg Days on Market
The data, sourced from MLS Listings Inc, includes all single-family homes, condos and townhomes in the California Area from February 2024 to February 2025. This may include preliminary data, and may vary from the time the data was gathered. All data is deemed reliable but not guaranteed. DRE# 01906450. Copyright KW Advisors Peninsula Estates | Burlingame | San Mateo 2025. Each office is independently owned and operated.
Condo & Townhomes
New Listings 0
Months of Inventory
Sold Listings
Median Sale Price 0%
Median Sale vs List 0 Avg Days on Market
HalfMoonBay
FEBRUARY 2024 - FEBRUARY 2025
LISTINGS FOR SALE SOLD LISTINGS
Single-Family Homes
Last 12 months, year-over-year.
Condos & Townhomes
Last 12 months, year-over-year
Median SalesPrice
Single-Family Homes
The median sale price has increased from $2 5m last February 2024, to $2 9m as of February 2025
Condos & Townhomes
The median sale price has decreased from $630k last February 2024, to $0 as of February 2025
AVGDays OntheMarket
Single-Family Homes
The average time spent on the market went up from 76 days last February 2024, to 120 days as of February 2025
Condos & Townhomes
The average time spent on the market went down from 43 days in February 2024, to 0 days as of February 2025.
Overbids
Single-Family Homes
The overbid percentage has decreased from 99 1% last February 2024, to 96 4% a year later
Condos & Townhomes
The overbid percentage has decreased from 100% last February 2024, to 0% a year later.
Hillsborough
What's in the Hillsborough data?
There were 26 single-family homes for sale, providing 3.7 months of inventory. There were 17 new listings, and 7 homes sold at a median price of $5.5m. The median overbid percentage was at 103.4%, with an average of 28 days on the market.
There was no data for condo and townhouse units for this month.
Single-Family Homes
17 New Listings
7 Sold Listings
3.7 Months of Inventory
$5.5M Median Sale Price
103.4%
Median Sale vs List
28 Avg Days on Market
The data, sourced from MLS Listings Inc, includes all single-family homes, condos and townhomes in the California Area from February 2024 to February 2025. This may include preliminary data, and may vary from the time the data was gathered. All data is deemed reliable but not guaranteed. DRE# 01906450. Copyright KW Advisors Peninsula Estates | Burlingame | San Mateo 2025. Each office is independently owned and operated.
CONDO
Condo & Townhomes
No data for this month.
Hillsborough
FEBRUARY 2024 - FEBRUARY 2025
LISTINGS FOR SALE SOLD LISTINGS
Single-Family Homes
Last 12 months, year-over-year.
No data for this month.
Condos & Townhomes
Last 12 months, year-over-year
Median SalesPrice
Single-Family Homes
The median sale price has increased from $3 9m last February 2024, to $5 5m as of February 2025
Condos & Townhomes
No data for this month
AVGDays OntheMarket
Single-Family Homes
The average time spent on the market went down from 54 days last February 2024, to 28 days as of February 2025
Condos & Townhomes
No data for this month
Overbids
Single-Family Homes
The overbid percentage has increased from 96 8% last February 2024, to 103 4% a year later
Condos & Townhomes
No data for this month
Millb
What's in the
There were 9 single-fa providing 2.3 months new listings, and 4 ho of $2.3m. The median 107.9%, with an avera
There were 6 condo a providing 2 months of new listings and 3 uni price of $868k. The m was at 96.1%, with an market.
13 New Listings
4 Sold Listings
2.3 Months of Inventory
$2.3M Median Sale Price
107.9% Median Sale vs List
s single-family homes, condos and to February 2025. This may include was gathered. All data is deemed Copyright KW Advisors Peninsula Estates | Burlingame | San Mateo 2025. Each office is independently owned and operated.
14 Avg Days on Market
4 New Listings
3 Sold Listings
2 Months of Inventory $868K
Median Sale Price 96.1%
Median Sale vs List 19 Avg Days on Market
Millbrae
FEBRUARY 2024 - FEBRUARY 2025
LISTINGS FOR SALE SOLD LISTINGS
Single-Family Homes
Last 12 months, year-over-year.
Condos & Townhomes
Last 12 months, year-over-year
Median SalesPrice
Single-Family Homes
The median sale price has increased from $2m last February 2024, to $2 3m as of February 2025
Condos & Townhomes
The median sale price has increased from $785k last February 2024, to $868k as of February 2025
AVGDays OntheMarket
Single-Family Homes
The average time spent on the market went down from 25 days last February 2024, to 14 days as of February 2025
Condos & Townhomes
The average time spent on the market went down from 88 days in February 2024, to 19 days as of February 2025.
Overbids
Single-Family Homes
The overbid percentage has decreased from 110 4% last February 2024, to 107 9% a year later
Condos & Townhomes
The overbid percentage has decreased from 98.4% last February 2024, to 96.1% a year later.
Pacifi
What's in the
There were 34 singleproviding 2.8 months new listings, and 12 h of $1.3m. The median 111.7%, with an avera
There were 10 condo sale, providing 10 mo 8 new listings and 1 u price of $930k. The m was at 100%, with an market.
28 New Listings
12 Sold Listings
2.8 Months of Inventory
$1.3M Median Sale Price
111.7% Median Sale vs List
s single-family homes, condos and to February 2025. This may include was gathered. All data is deemed Copyright KW Advisors Peninsula Estates | Burlingame | San Mateo 2025. Each office is independently owned and operated.
14 Avg Days on Market
Listing
FEBRUARY 2024 - FEBRUARY 2025
LISTINGS FOR SALE SOLD LISTINGS
Single-Family Homes
Last 12 months, year-over-year.
Condos & Townhomes
Last 12 months, year-over-year
Median SalesPrice
Single-Family Homes
The median sale price has increased from $1 2m last February 2024, to $1 3m as of February 2025
Condos & Townhomes
The median sale price has decreased from $949k last February 2024, to $930k as of February 2025
AVGDays OntheMarket
Single-Family Homes
The average time spent on the market went down from 41 days last February 2024, to 14 days as of February 2025
Condos & Townhomes
The average time spent on the market went down from 46 days in February 2024, to 26 days as of February 2025.
Overbids
Single-Family Homes
The overbid percentage has increased from 100 8% last February 2024, to 111 7% a year later
Condos & Townhomes
The overbid percentage has decreased from 100.8% last February 2024, to 100% a year later.
SanB
What's in the
There were 16 singleproviding 1.2 months new listings, and 13 h of $1.4m. The median 106.4%, with an avera
There were 20 condo sale, providing 6.7 mo were 15 new listings a sale price of $530k. T percentage was at 10 days on the market.
19 New Listings
13 Sold Listings
1.2 Months of Inventory
$1.4M Median Sale Price
106.4% Median Sale vs List
s single-family homes, condos and to February 2025. This may include was gathered. All data is deemed Copyright KW Advisors Peninsula Estates | Burlingame | San Mateo 2025. Each office is independently owned and operated.
29 Avg Days on Market
Condo & Tow
New Listings
3
Sold Listings
6.7
Months of Inventory $530K
102.8%
Median Sale Price
Median Sale vs List 12 Avg Days on Market
Median SalesPrice
Single-Family Homes
The median sale price has increased from $1 2m last February 2024, to $1 4m as of February 2025
Condos & Townhomes
The median sale price has decreased from $551k last February 2024, to $530k as of February 2025
AVGDays OntheMarket
Single-Family Homes
The average time spent on the market went up from 23 days last February 2024, to 29 days as of February 2025
Condos & Townhomes
The average time spent on the market went down from 17 days in February 2024, to 12 days as of February 2025.
Overbids
Single-Family Homes
The overbid percentage has decreased from 108 5% last February 2024, to 106 4% a year later
Condos & Townhomes
The overbid percentage has increased from 99.1% last February 2024, to 102.8% a year later.
Sa
What's
There we providing new listin of $3m. T 107.7%, w
There we sale, prov 12 new li price of $ was at 10 market.
21 New Listings
13 Sold Listings
1.4 Months of Inventory
107.7%
Median Sale vs List
$3M Median Sale Price
8 Avg Days on Market
condos and may include data is deemed Peninsula Estates | Burlingame | San Mateo 2025. Each office is independently owned and operated.
New Listings
2
Sold Listings
6
Months of Inventory
100.6%
Median Sale vs List
$1.2M
Median Sale Price
43
Avg Days on Market
SanCarlos
FEBRUARY 2024 - FEBRUARY 2025
LISTINGS FOR SALE SOLD LISTINGS
Single-Family Homes
Last 12 months, year-over-year.
Condos & Townhomes
Last 12 months, year-over-year
Median SalesPrice
Single-Family Homes
The median sale price has increased from $2 4m last February 2024, to $3m as of February 2025
Condos & Townhomes
The median sale price has decreased from $1 5m last February 2024, to $1 2m as of February 2025
AVGDays OntheMarket
Single-Family Homes
The average time spent on the market went down from 15 days last February 2024, to 8 days as of February 2025
Condos & Townhomes
The average time spent on the market went up from 36 days in February 2024, to 43 days as of February 2025.
Overbids
Single-Family Homes
The overbid percentage has increased from 105 7% last February 2024, to 107 7% a year later
Condos & Townhomes
The overbid percentage has decreased from 103.6% last February 2024, to 100.6% a year later.
SanMateo
What's in the San Mateo data?
There were 51 single-family homes for sale, providing 1.7 months of inventory. There were 57 new listings, and 30 homes sold at a median price of $2m. The median overbid percentage was at 108.8%, with an average of 18 days on the market.
There were 102 condo and townhome units for sale, providing 6 months of inventory. There were 57 new listings and 17 units sold at a median sale price of $1.1m. The median overbid percentage was at 99.3%, with an average of 60 days on the market.
Single-Family Homes
57 New Listings
30 Sold Listings
1.7 Months of Inventory
$2M Median Sale Price
108.8%
Median Sale vs List
18 Avg Days on Market
The data, sourced from MLS Listings Inc, includes all single-family homes, condos and townhomes in the California Area from February 2024 to February 2025. This may include preliminary data, and may vary from the time the data was gathered. All data is deemed reliable but not guaranteed. DRE# 01906450. Copyright KW Advisors Peninsula Estates | Burlingame | San Mateo 2025. Each office is independently owned and operated.
57 New Listings
Listings
SanMateo
FEBRUARY 2024 - FEBRUARY 2025
LISTINGS FOR SALE SOLD LISTINGS
Single-Family Homes
Last 12 months, year-over-year.
Condos & Townhomes
Last 12 months, year-over-year
Median SalesPrice
Single-Family Homes
The median sale price has increased from $1 9m last February 2024, to $2m as of February 2025
Condos & Townhomes
The median sale price has increased from $790k last February 2024, to $1 1m as of February 2025
AVGDays OntheMarket
Single-Family Homes
The average time spent on the market went down from 20 days last February 2024, to 18 days as of February 2025
Condos & Townhomes
The average time spent on the market went up from 31 days in February 2024, to 60 days as of February 2025.
Overbids
Single-Family Homes
The overbid percentage has increased from 107 3% last February 2024, to 108 8% a year later
Condos & Townhomes
The overbid percentage has decreased from 102.5% last February 2024, to 99.3% a year later.
SouthSan Francisco
What's in the South San Francisco data?
There were 14 single-family homes for sale, providing 0.9 months of inventory. There were 16 new listings, and 15 homes sold at a median pric of $1.4m. The median overbid percentage was at 111 1%, with an average of 17 days on the marke
There were 16 condo and townhome units for sale, providing 4 months of inventory. There were 9 new listings and 4 units sold at a median sale price of $820k. The median overbid percentage was at 107%, with an average of 9 days on the market.
16 New Listings
15 Sold Listings
0.9 Months of Inventory
$1.4M Median Sale Price
111.1%
Median Sale vs List
17 Avg Days on Market
Median SalesPrice
Single-Family Homes
The median sale price has increased from $1 3m last February 2024, to $1 4m as of February 2025
Condos & Townhomes
The median sale price has increased from $803k last February 2024, to $820k as of February 2025
AVGDays OntheMarket
Single-Family Homes
The average time spent on the market went down from 26 days last February 2024, to 17 days as of February 2025
Condos & Townhomes
The average time spent on the market went down from 43 days in February 2024, to 9 days as of February 2025.
Overbids
Single-Family Homes
The overbid percentage has increased from 105 7% last February 2024, to 111 1% a year later
Condos & Townhomes
The overbid percentage has increased from 100.8% last February 2024, to 107% a year later.