


Santa Clara County
Jump to Santa Clara County Report
San Mateo County
Jump to San Mateo County Report
San Francisco County
Jump to San Francisco County Report
Alameda County
Jump to Alameda County Report

That's really the question you should be asking yourself.
Our market is incredibly diverse, and rapidly changing. Values vary not just by neighborhood, but by street. Your home isn't necessarily worth what your neighbors’ home is. At the end of the day, it’s the current market that sets the value of your home.
So, do you know what your home is worth in today's market?
I can help...
Contact me for a confidential, no obligation assessment of your home's value.

If you’ve been putting off buying a home because you thought getting approved would be too hard, know this: qualifying for a mortgage is starting to get a bit more achievable, but lending standards are still strong.
Lenders are making it slightly easier for well-qualified buyers to access financing, which is opening more doors for people ready to make a move.
So, if strict requirements were holding you back, this shift could be the opportunity you’ve been waiting for, without repeating the risky lending practices that led to the housing crash back in 2008.


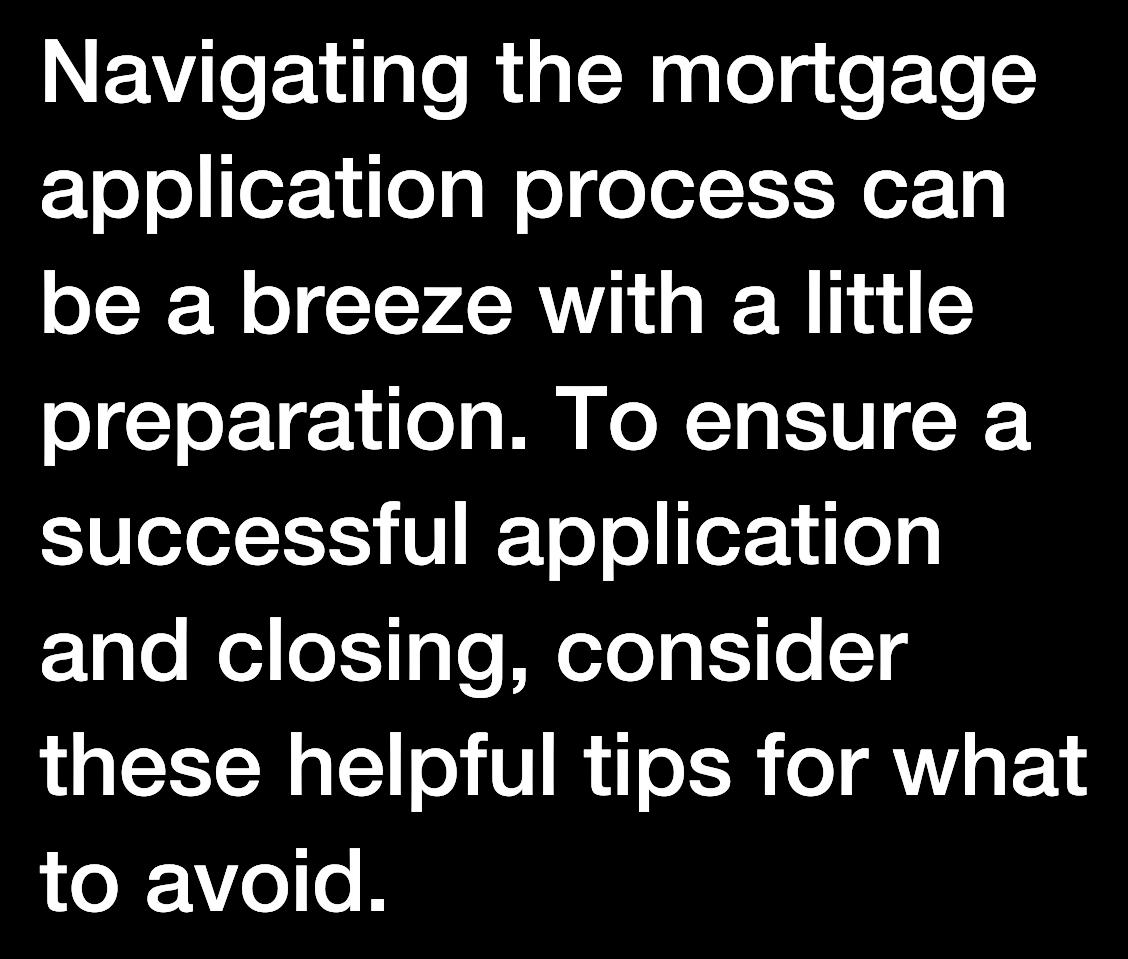


Avoid paying off debts or collections without professional advice.
Don't have your credit report pulled too many times - this can hurt your credit score. 3 4 5 6 1 2
Always consult your mortgage professional before making large financial moves. Use verified funds for deposits to prevent closing delays.


What's in the Santa
The market for Single Family Homes, Condo, and Townhomes units saw 1,137 closed sales at a median price of $1.7m. There was a total of 1,586 new listings with an average of 21 days on the market without price reduction and with an average price per square foot of $1,112.

June 2025
1,586
+7% Year-over-Year
$1,112 New Listings
1,137
Year-over-Year
Average Price Per SqFt
+1 7% Year-over-Year
$1.7M Closed Sales Median Sale Price
5% Year-over-Year
21 $2.4B
Average Days-on-Market Total Volume +31.3% Year-over-Year +3 2% Year-over-Year
Data includes all single family, townhome, and condominium sales in Santa Clara County sourced from MLS Listings The most recent quarter’s data is based on available numbers, but may change with late reported activity Data from sources deemed reliable but may contain errors and are subject to revision
1,075 New Listings
833 Closed Sales
18 Average Days-on-Market
$2M
Median Sale Price
$1,226
Average Price Per SqFt
$2B Total Volume
Data includes all single family, townhome, and condominium sales in Santa Clara County sourced from MLS Listings. The most recent quarter’s data is based on available numbers, but may change with late reported activity. Data from sources deemed reliable but may contain errors and are subject to revision.

511
304 Closed Sales
29 Average Days-on Market
$947K Median Sale Price
$801 Average Price Per SqFt
$330M Total Volume

The market for Single Family Homes, Condo, and Townhomes units saw 448 closed sales at a median price of $1.7m. There was a total of 627 new listings with an average of 26 days on the market without price reduction and with an average price per square foot of $1,130.

June 2025
627
Year-over-Year
448
Average Price Per SqFt
$1,130 New Listings
8% Year-over-Year
$1.7M
Year-over-Year -0 4%Year-over-Year
26 $1B Average Days-on-Market
Total Volume -0 7% Year-over-Year
Data includes all single family, townhome, and condominium sales in San Mateo County sourced from MLS Listings The most recent quarter’s data is based on available numbers, but may change with late reported activity Data from sources deemed reliable but may contain errors and are subject to revision
New Listings 22 Average Days-on-Market
Data includes all single family, townhome, and condominium sourced from MLS Listings. The most recent numbers, but may change with late reported activity. but may contain errors and are subject to revision.
Closed Sales
$781 Average Price Per SqFt
$81M
Total Volume
The market for Single Family Homes, Condo, and Townhomes units saw 424 closed sales at a median price of $1.5m. There was a total of 439 new listings with an average of 35 days on the market without price reduction and with an average price per square foot of $1,031.

June 2025
439
Average Price Per SqFt -2.7% Year-over-Year
$1,031 New Listings
+2 0% Year-over-Year
424
Year-over-Year
2% Year-over-Year
35 $748M Average Days-on-Market Total Volume 0.0% Year-over-Year +16 8% Year-over-Year
Data includes all single family, townhome, and condominium sales in San Francisco County sourced from MLS Listings The most recent quarter’s data is based on available numbers, but may change with late reported activity Data from sources deemed reliable but may contain errors and are subject to revision
New Listings 20 Average Days-on-Market
Data includes all single family, townhome, and County sourced from MLS Listings. The most recent numbers, but may change with late reported activity. but may contain errors and are subject to revision.
202 Closed Sales
1,018 Average Price Per SqFt
274M
Total Volume

The market for Single Family Homes, Condo, and Townhomes units saw 966 closed sales at a median price of $1.1m. There was a total of 1,455 new listings with an average of 28 days on the market without price reduction and with an average price per square foot of $734.

June 2025
1,455
Average Price Per SqFt +4.2% Year-over-Year
$734 New Listings
1% Year-over-Year
966
$1.1M
8% Year-over-Year
28 $1.2B Average Days-on-Market Total Volume +47.4% Year-over-Year +0 3% Year-over-Year
Data includes all single family, townhome, and condominium sales in Alameda County sourced from MLS Listings The most recent quarter’s data is based on available numbers, but may change with late reported activity Data from sources deemed reliable but may contain errors and are subject to revision
1,051 New Listings
24 Average Days-on-Market $ Av Pe $1.3M Median Sale Price 7 Cl $ To
Data includes all single family, townhome, and condominium sourced from MLS Listings. The most recent numbers, but may change with late reported activity. but may contain errors and are subject to revision.
207 Closed Sales
$592 Average Price Per SqFt
150M
Total Volume


The market for Single Family Homes, Condo, and Townhomes units saw 170 closed sales at a median price of $1.1m. There was a total of 293 new listings with an average of 28 days on the market without price reduction and with an average price per square foot of $832.

June 2025
293
$832 New Listings
170
Year-over-Year
Average Price Per SqFt
+29.7% Year-over-Year -8 6% Year-over-Year
$1.1M
5% Year-over-Year
28 $246M Average Days-on-Market Total Volume +3.7% Year-over-Year +20 5% Year-over-Year
Data includes all single family, townhome, and condominium sales in Santa Cruz County sourced from MLS Listings The most recent quarter’s data is based on available numbers, but may change with late reported activity Data from sources deemed reliable but may contain errors and are subject to revision
237 New Listings
26 Average Days-on-Market
$1.3M
Median Sale Price
$881 Average Price Per SqFt
130 Closed Sales $209M Total Volume
Data includes all single family, townhome, and condominium sales in Santa Cruz County sourced from MLS Listings. The most recent quarter’s data is based on available numbers, but may change with late reported activity. Data from sources deemed reliable but may contain errors and are subject to revision.

56 ew Listings
40 Closed Sales
34 Average s-on Market $674 Average Price Per SqFt
45K n Sale Price
$34M Total Volume


The market for Single Family Homes, Condo, and Townhomes units saw 178 closed sales at a median price of $941k. There was a total of 250 new listings with an average of 53 days on the market without price reduction and with an average price per square foot of $768.
June 2025
250
+0.8% Year-over-Year
Average Price Per SqFt
$768 New Listings
+0 4% Year-over-Year
178
$941K Closed Sales Median Sale Price
Year-over-Year
9% Year-over-Year
53
$253M Average Days-on-Market Total Volume +65.6% Year-over-Year +11 3% Year-over-Year
Data includes all single family, townhome, and condominium sales in Monterey County sourced from MLS Listings The most recent quarter’s data is based on available numbers, but may change with late reported activity Data from sources deemed reliable but may contain errors and are subject to revision
36 New Listings
20 Closed Sales
59 Average Days-on Market
$888K Median Sale Price
$667 Average Price Per SqFt
$19M Total Volume


Being an independently owned and operated franchise of Keller Williams, KW Bay Area Estates has the position as the Bay Area’s foremost luxury real estate services firm with the execution of best-in-class customer service. KWBAE’s unparalleled team consists of more than 250 associates and professionals strategically located in Los Gatos and Saratoga. Under the same ownership, we have our division of KW South Bay Commercial.
With uncompromising principles, KW Bay Area Estates has established a new standard of excellence within the industry. The company’s growth has been strategic and exciting. Since its inception, the team has successfully represented more than 10,000 transactions, totalling more than $13 billion in closed sales volume.
Dedicated to upholding unparalleled standards for integrity and client care, they strive to create a culture where agents thrive while developing their own businesses to their maximum potential. KW Bay Area Estates has distributed to their associates over $2.7 million in profit share.