That's the question you should be asking yourself.
Our market is incredibly diverse and rapidly changing. Values vary not just by neighborhood but by street. Your home isn't necessarily worth what your neighbors' home is. It's the current market that sets the value of your home.
So, do you know what your home is worth in today's market?
Icanhelp...
Contact me for a confidential, no obligation assessment of your home's value.
Lately, it feels like every headline about the housing market comes with a side of doubt. Are prices going up or down? Are we headed for a crash? Will rates ever come down? And all the media noise may leave you wondering: does it really make sense to buy a home right now?
But here’s one thing that doesn’t get enough airtime. Real estate has always been about the long game. And when you look at the big picture, not just the latest clickbait headlines, it’s easy to see why so many people say it’s still the best investment you can make –even now.
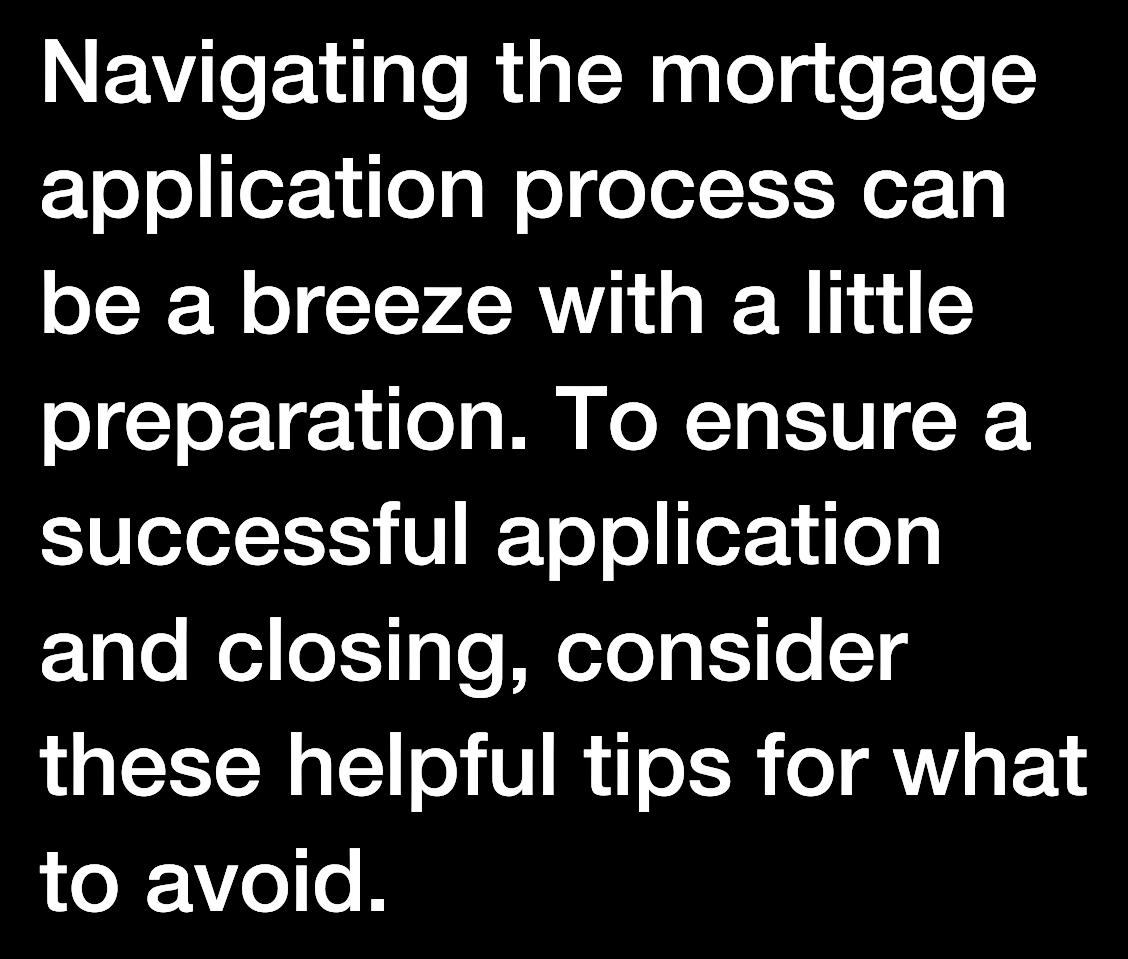
Smart Strategies for a Mortgage Application
Avoid paying off debts or collections without professional advice.
Don't have your credit report pulled too many times - this can hurt your credit score. 3 4 5 6 1 2
Always consult your mortgage professional before making large financial moves. Use verified funds for deposits to prevent closing delays.
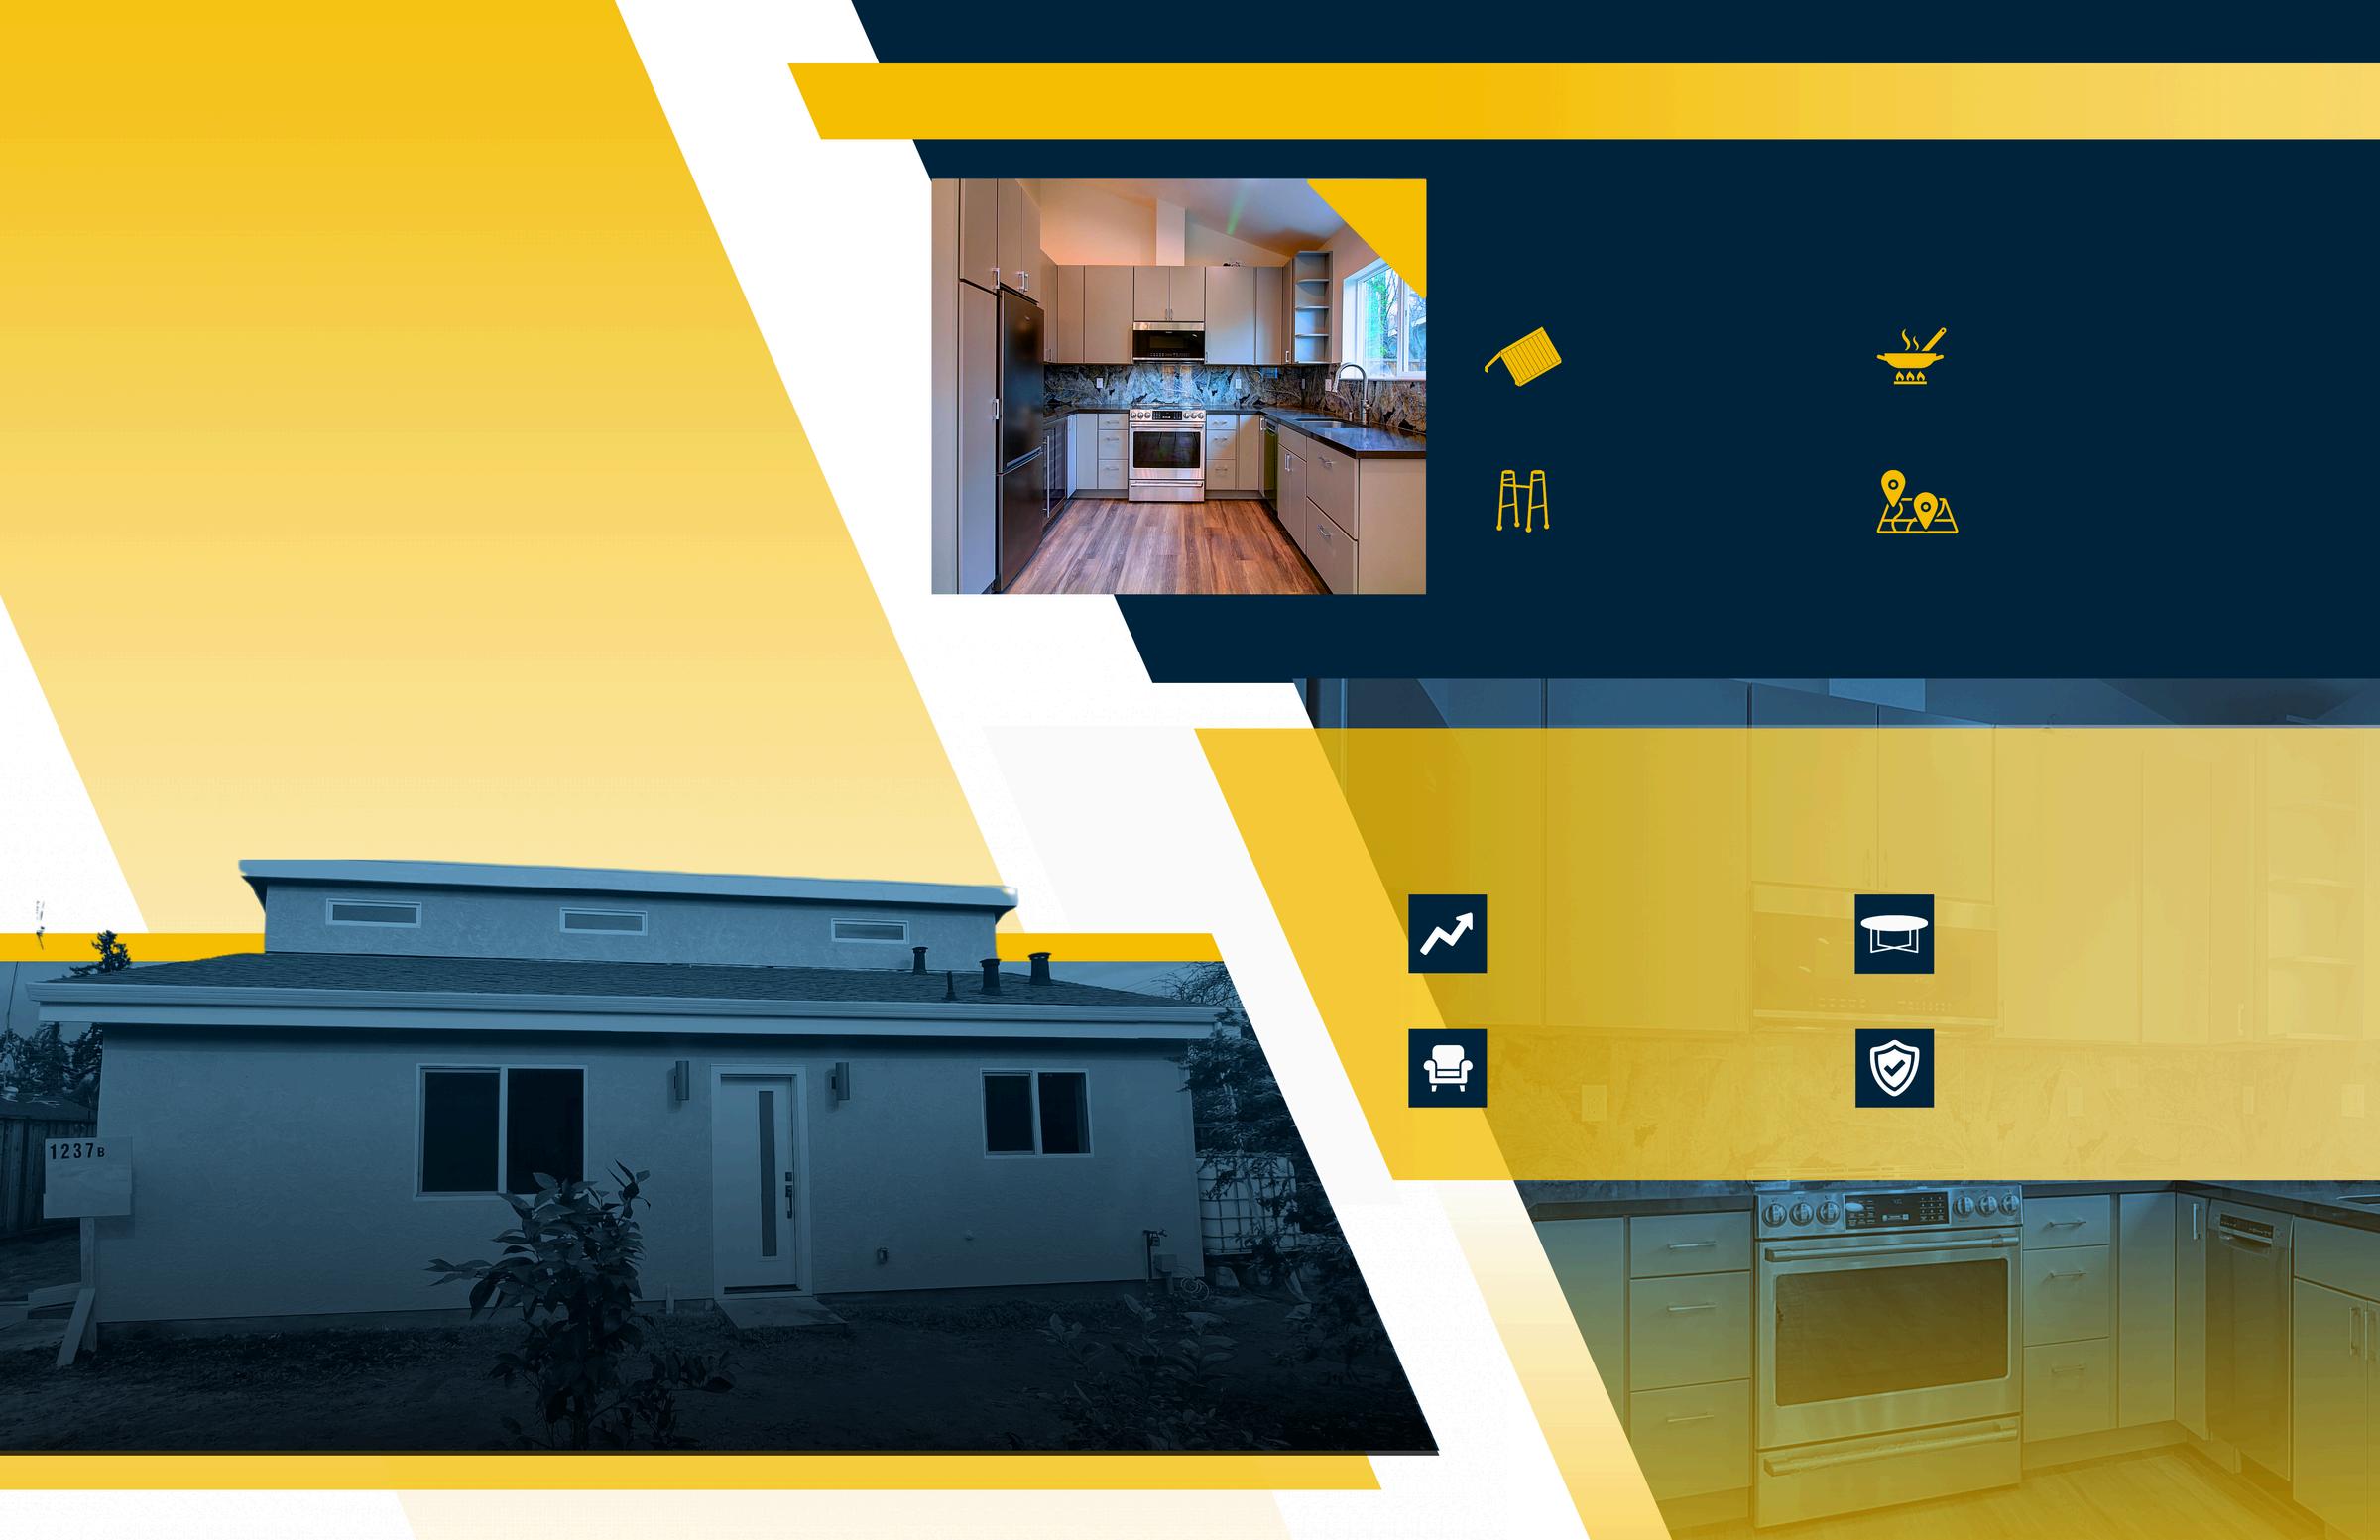
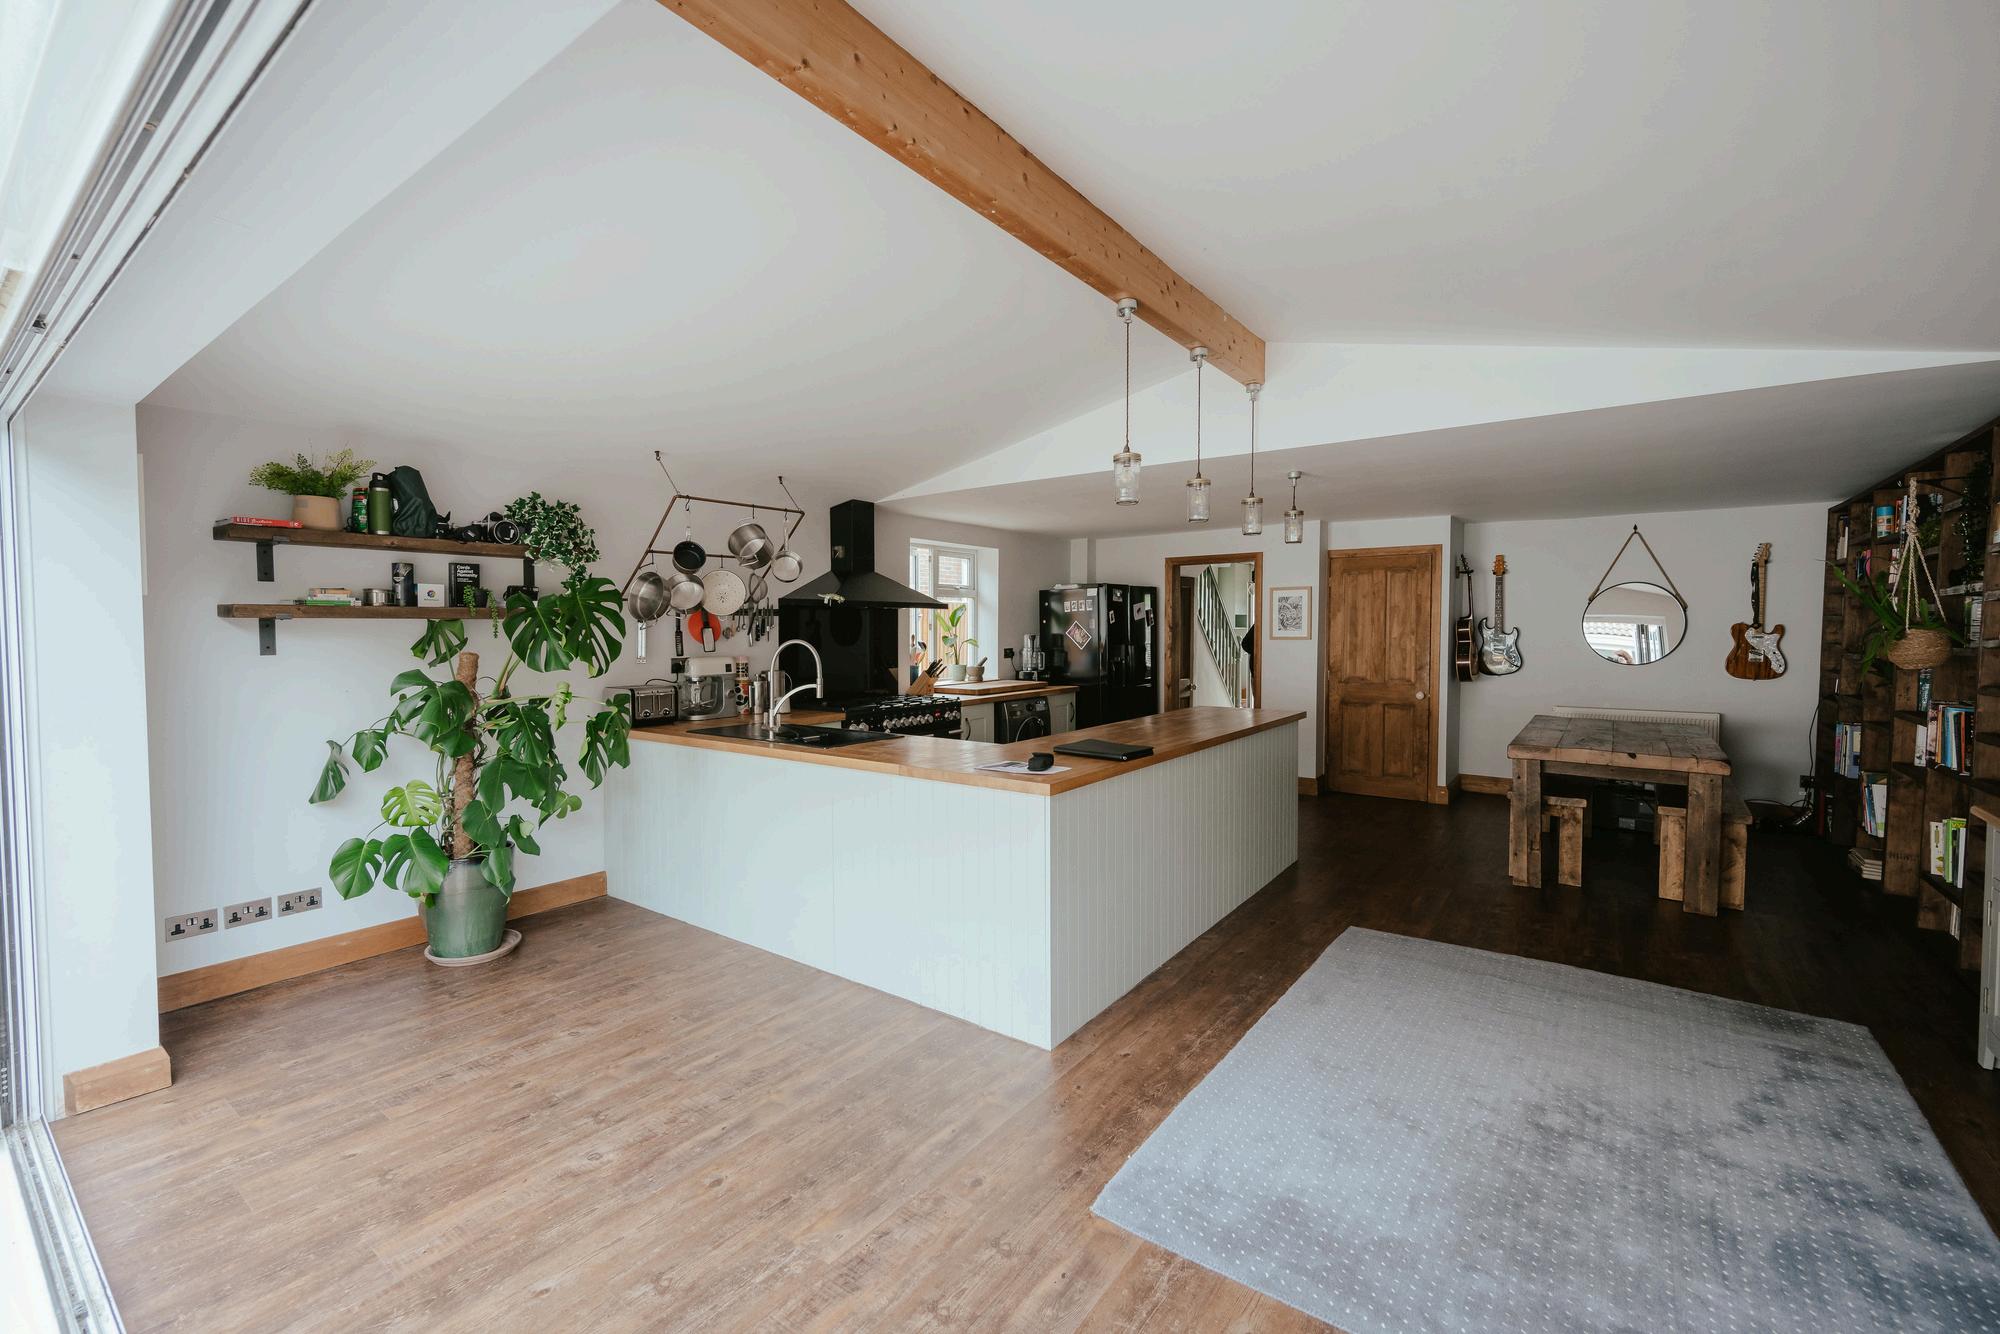
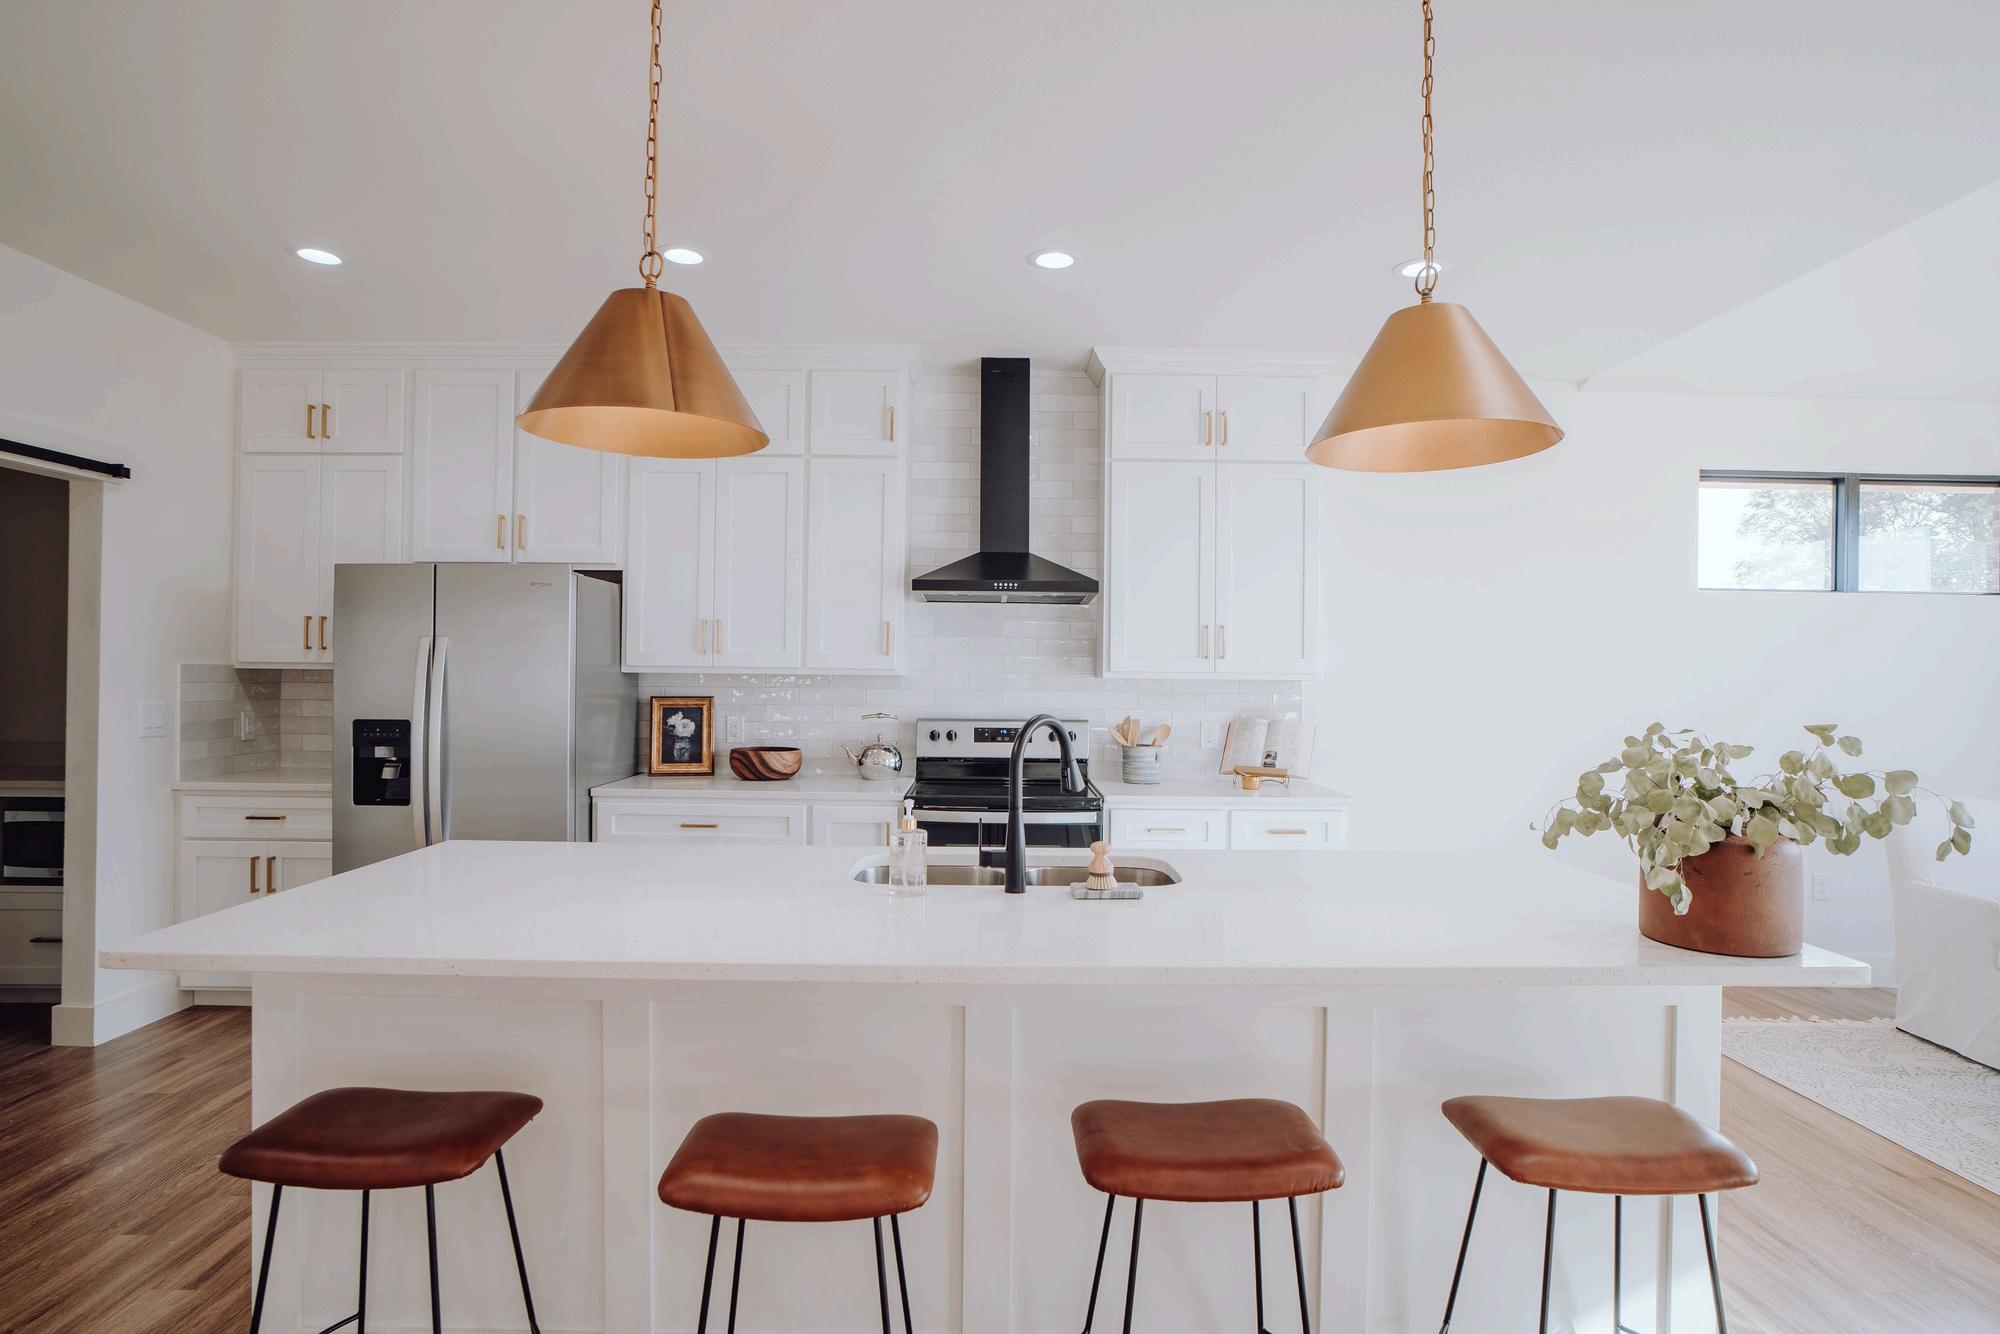
HomeRenovationsThatCanMakea BIG IMPACT AccordingtoExperts
Enhancing Property Value and Family Living Space with an Acton ADU
The Anenberg-Essert family in Campbell collaborated with Acton ADU to create a versatile, comfortable, and valuable addition to their property. This ADU project is a shining example of how a well-designed accessory dwelling unit can increase property value and serve a family’s unique needs.
GoalsandVision
The family envisioned an ADU that would function as an independent living space for family members, enhance their property’s worth, and provide seamless integration with the main home They wanted a space that balanced privacy with connectivity, feeling like a natural extension of their residence
Design and Construction Details
Constructed at 747 square feet, this ADU was designed with modern, high-quality finishes to serve both aesthetic and practical needs. Key features include:
Vaulted Ceilings
Creates a spacious, open atmosphere
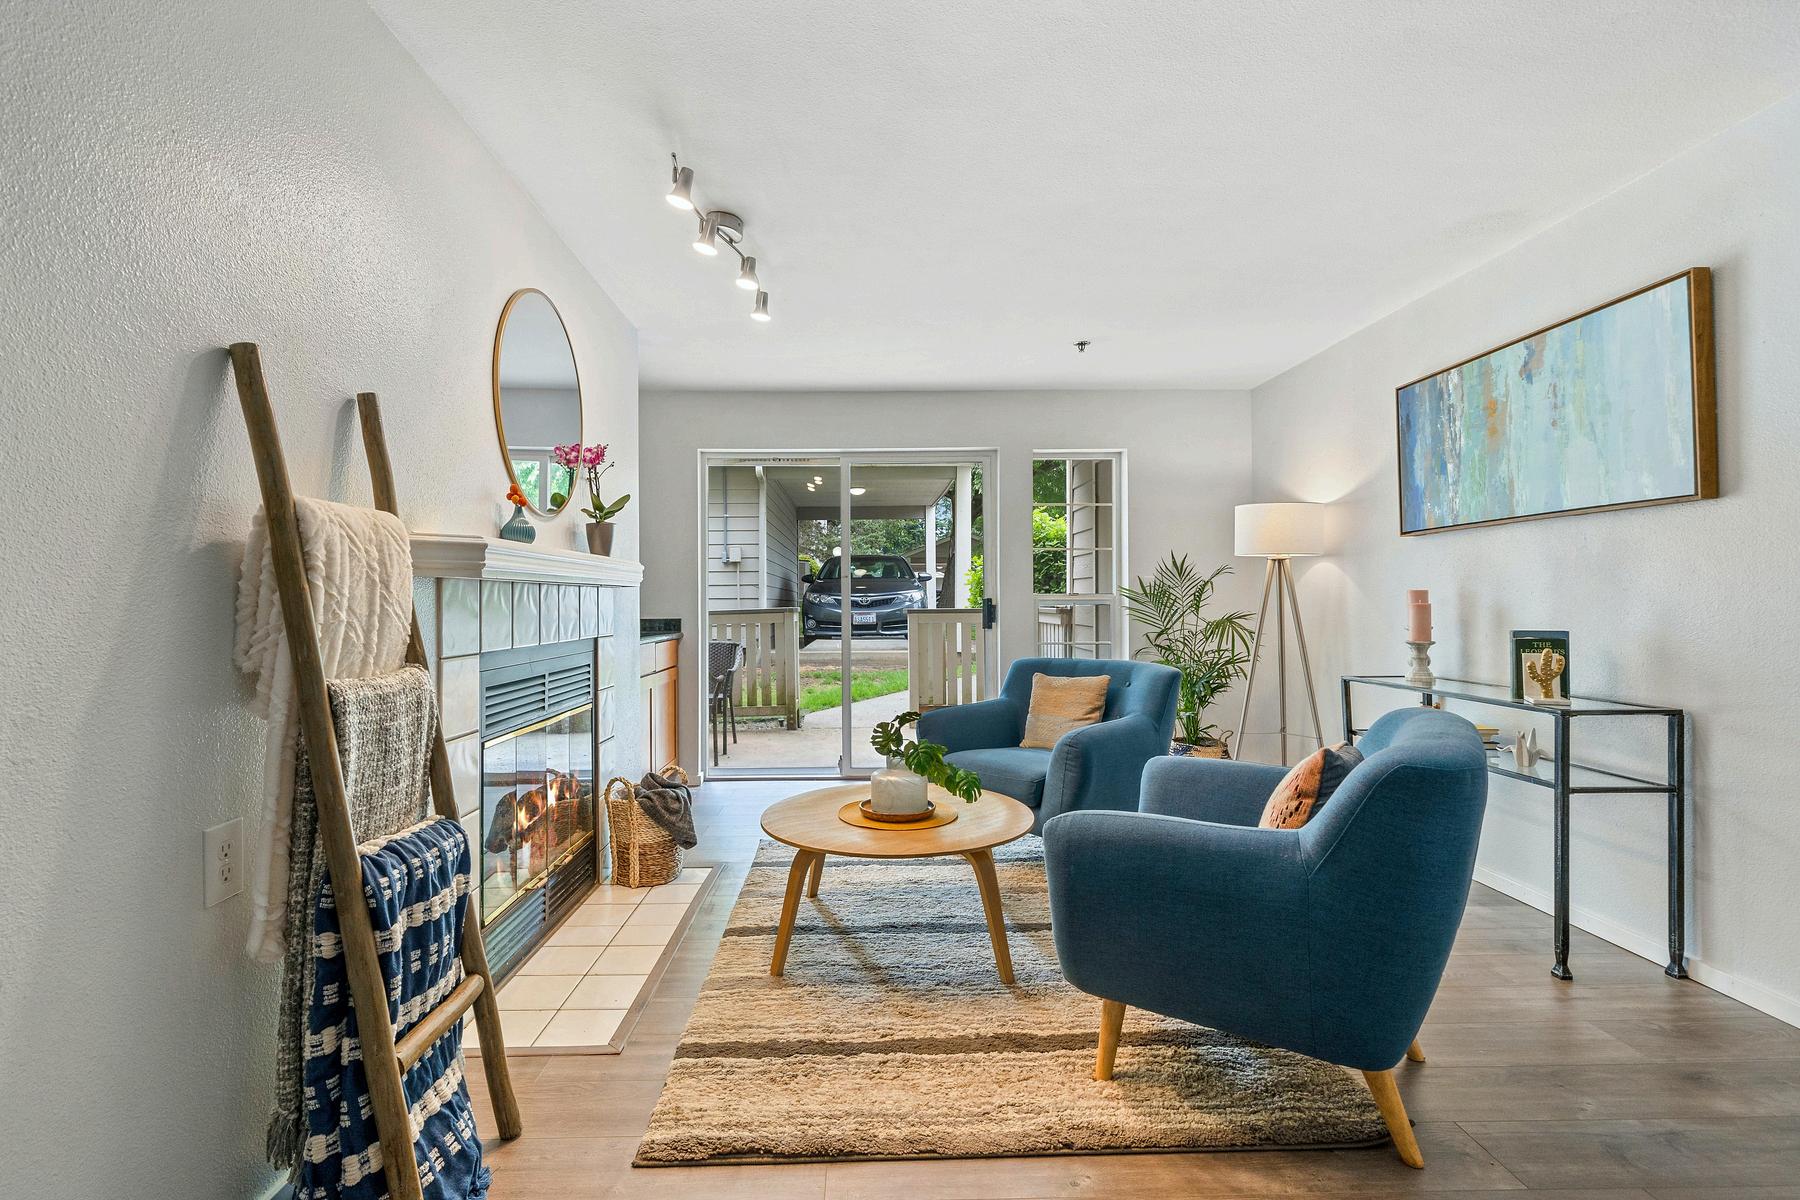
Senior-Friendly Living
Safe, independent space for elderly family members
Fully Equipped Kitchen
Modern amenities for everyday convenience
Open Living Area
Multipurpose area for relaxation and entertainment
Results and Impact
The completion of the Anenberg-Essert ADU led to several valuable outcomes:
Increased Property Value
The ADU addition significantly boosted property value
Flexible Living Space
A versatile space for family, guests, or as a rental
Modern Comforts
High-end finishes and amenities enhance both function and style.
Enhanced Family Living
The ADU enriches the AnenbergEssert family’s home with both privacy and connection
VENDOR DIRECTORY
When it comes to home ownership, knowing who you can trust is crucial. That's why we've curated a select list of trusted vendors who are ready to help with your home goals.
PaloAlto
What's in the Palo Alto data?
There were 53 single-family homes for sale, providing 1.4 months of inventory. There were 49 new listings, and 41 homes sold at a median price of $4.1m. The median overbid percentage was at 104%, with an average of 15 days on the market.
There were 27 condo and townhome units for sale, providing 2.5 months of inventory. There were 12 new listings and 8 units sold at a median sale price of $1.4m. The median overbid percentage was at 98%, with an average of 33 days on the market.
Single-Family Homes
49 New Listings
41 Sold Listings
1.4 Months of Inventory
$4.1M Median Sale Price
104%
Median Sale vs List
15 Avg Days on Market
The data, sourced from InfoSparks and Trend Graphix, includes all single-family homes, condos and townhomes in the California Area above from May 2024 to May 2025. This may include preliminary data, and may vary from the time the data was gathered. All data is deemed reliable but not guaranteed. DRE# 01511642. Copyright KW Advisors Palo Alto 2024. Each office is independently owned and operated.
Condo & Townhomes
12
New Listings
8
Sold Listings
2.5
Months of Inventory
$1.4M
Median Sale Price 98%
Median Sale vs List
33 Avg Days on Market
Median SalesPrice
Single-Family Homes
The median sale price has increased from $3 6m last May 2024, to $4 1m as of May 2025
Condos & Townhomes
The median sale price has remained the same from $1 4m last May 2024, to $1 4m as of May 2025
AVGDays OntheMarket
Single-Family Homes
The average time spent on the market went up from 13 days last May 2024, to 15 days as of May 2025
Condos & Townhomes
The average time spent on the market went up from 20 days in May 2024, to 33 days as of May 2025.
Overbids
Single-Family Homes
The overbid percentage has increased from 103% last May 2024, to 104% a year later
Condos & Townhomes
The overbid percentage has decreased from 100% last May 2024, to 98% a year later.
Redwood City
What's in the Redwood City data?
There were 65 single-family homes for sale, providing 1.3 months of inventory. There were 57 new listings, and 36 homes sold at a median price of $2.3m. The median overbid percentage was at 101%, with an average of 13 days on the market
There were 27 condo and townhome units for sale, providing 2.5 months of inventory. There were 16 new listings and 9 units sold at a median sale price of $1.3m. The median overbid percentage was at 99%, with an average of 27 days on the market.
Single-Family Homes
57 New Listings
36 Sold Listings
1.3 Months of Inventory
$2.3M Median Sale Price
101%
Median Sale vs List
13 Avg Days on Market
The data, sourced from InfoSparks and Trend Graphix, includes all single-family homes, condos and townhomes in the California Area above from May 2024 to May 2025. This may include preliminary data, and may vary from the time the data was gathered. All data is deemed reliable but not guaranteed. DRE# 01511642. Copyright KW Advisors Palo Alto 2024. Each office is independently owned and operated.
16
New Listings
9
Sold Listings
2.5
Months of Inventory
$1.3M
Median Sale Price 99%
Median Sale vs List
27
Avg Days on Market
Single-Family Homes
Last 12 months, year-over-year.
Condos & Townhomes
Last 12 months, year-over-year
Median SalesPrice
Single-Family Homes
The median sale price has decreased from $2 32m last May 2024, to $2 31m as of May 2025
Condos & Townhomes
The median sale price has increased from $1 2m last May 2024, to $1 3m as of May 2025
AVGDays OntheMarket
Single-Family Homes
The average time spent on the market went down from 17 days last May 2024, to 13 days as of May 2025
Condos & Townhomes
The average time spent on the market went down from 33 days in May 2024, to 27 days as of May 2025.
Overbids
Single-Family Homes
The overbid percentage has decreased from 105% last May 2024, to 101% a year later
Condos & Townhomes
The overbid percentage has increased from 98% last May 2024, to 99% a year later.
Portola Valley
What's in the Portola Valley data?
There were 26 single-family homes for sale, providing 3.3 months of inventory. There were 14 new listings, and 4 homes sold at a median price of $6.5m. The median overbid percentage was at 107%, with an average of 20 days on the market
There was no data for condo and townhouse units for this month.
Single-Family Homes
14 New Listings
4 Sold Listings
3.3 Months of Inventory
$6.5M Median Sale Price
107%
Median Sale vs List
20 Avg Days on Market
The data, sourced from InfoSparks and Trend Graphix, includes all single-family homes, condos and townhomes in the California Area above from May 2024 to May 2025. This may include preliminary data, and may vary from the time the data was gathered. All data is deemed reliable but not guaranteed. DRE# 01511642. Copyright KW Advisors Palo Alto 2024. Each office is independently owned and operated.
No data available for May 2025.
No data for this month.
Median SalesPrice
Single-Family Homes
The median sale price has increased from $3 4m last May 2024, to $6 5m as of May 2025
Condos & Townhomes
No data for this month
AVGDays OntheMarket
Single-Family Homes
The average time spent on the market went up from 14 days last May 2024, to 20 days as of May 2025
Condos & Townhomes
No data for this month
Overbids
Single-Family Homes
The overbid percentage has increased from 96% last May 2024, to 107% a year later
Condos & Townhomes
No data for this month
MenloPark
What's in the Menlo Park data?
There were 40 single-family homes for sale, providing 1.2 months of inventory. There were 46 new listings, and 26 homes sold at a median pric of $3.6m. The median overbid percentage was at 100%, with an average of 24 days on the market.
There were 15 condo and townhome units for sale, providing 3 months of inventory. There were 9 new listings and 8 units sold at a median sale price of $1.4m. The median overbid percentage was at 97%, with an average of 52 days on the market.
46 New Listings
26 Sold Listings
1.2 Months of Inventory
$3.6M Median Sale Price
100% Median Sale vs List
24 Avg Days on Market
9
New Listings
8
Sold Listings
3
Months of Inventory
$1.4M
Median Sale Price 97%
Median Sale vs List 52 Avg Days on Market
Median SalesPrice
Single-Family Homes
The median sale price has increased from $3 3m last May 2024, to $3 6m as of May 2025
Condos & Townhomes
The median sale price has decreased from $1 6m last May 2024, to $1 4m as of May 2025
AVGDays OntheMarket
Single-Family Homes
The average time spent on the market went up from 20 days last May 2024, to 24 days as of May 2025
Condos & Townhomes
The average time spent on the market went up from 27 days in May 2024, to 52 days as of May 2025.
Overbids
Single-Family Homes
The overbid percentage has increased from 96% last May 2024, to 100% a year later
Condos & Townhomes
The overbid percentage has decreased from 100% last May 2024, to 97% a year later.
Atherton
What's in the Atherton data?
There were 15 single-family homes for sale, providing 1.7 months of inventory. There were 16 new listings, and 7 homes sold at a median price of $8.6m. The median overbid percentage was at 106%, with an average of 9 days on the market.
There was no data for condo and townhouse units for this month.
Single-Family Homes
16 New Listings
7 Sold Listings
1.7 Months of Inventory
$8.6M Median Sale Price
106%
Median Sale vs List
9 Avg Days on Market
The data, sourced from InfoSparks and Trend Graphix, includes all single-family homes, condos and townhomes in the California Area above from May 2024 to May 2025. This may include preliminary data, and may vary from the time the data was gathered. All data is deemed reliable but not guaranteed. DRE# 01511642. Copyright KW Advisors Palo Alto 2024. Each office is independently owned and operated.
CONDO
Condo & Townhomes
No data available for May 2025.
Single-Family Homes
Last 12 months, year-over-year.
Condos & Townhomes
Last 12 months, year-over-year
Median SalesPrice
Single-Family Homes
The median sale price has decreased from $10m last May 2024, to $8 6m as of May 2025
Condos & Townhomes
The median sale price has decreased from $1 3m last May 2024, to $0 as of May 2025
AVGDays OntheMarket
Single-Family Homes
The average time spent on the market went down from 16 days last May 2024, to 9 days as of May 2025
Condos & Townhomes
The average time spent on the market went down from 11 days in May 2024, to 0 days as of May 2025.
Overbids
Single-Family Homes
The overbid percentage has increased from 99% last May 2024, to 106% a year later
Condos & Townhomes
The overbid percentage has decreased from 104% last May 2024, to 0% a year later.
Lo
What's
There we providing new listin of $4.5m 107%, wit
There we sale, prov were 8 ne sale price percentag days on t
37 New Listings
28 Sold Listings
0.9 Months of Inventory
$4.5M Median Sale Price
107% Median Sale vs List
13 Avg Days on Market
single-family homes, May 2025. This gathered. All data Advisors Palo Alto
Condo & Townhomes
8
New Listings
5
Sold Listings
1.6
Months of Inventory
$2.1M
Median Sale Price 98%
Median Sale vs List
23
Avg Days on Market
LosAltos
Single-Family Homes
Last 12 months, year-over-year.
Condos & Townhomes
Last 12 months, year-over-year
Median SalesPrice
Single-Family Homes
The median sale price has increased from $4 3m last May 2024, to $4 5m as of May 2025
Condos & Townhomes
The median sale price has decreased from $2 2m last May 2024, to $2 1m as of May 2025
AVGDays OntheMarket
Single-Family Homes
The average time spent on the market went up from 12 days last May 2024, to 13 days as of May 2025
Condos & Townhomes
The average time spent on the market went up from 17 days in May 2024, to 23 days as of May 2025.
Overbids
Single-Family Homes
The overbid percentage has increased from 104% last May 2024, to 107% a year later
Condos & Townhomes
The overbid percentage has decreased from 100% last May 2024, to 98% a year later.
SanJo
What's in the
There were 510 single providing 1.3 months new listings, and 332 price of $1.7m. The m was at 103%, with an market.
There were 365 condo sale, providing 2 7 mo were 243 new listings median sale price of $ percentage was at 10 days on the market.
564 New Listings
s
332 Sold Listings
1.3 Months of Inventory
$1.7M Median Sale Price
103%
Median Sale vs List
16 Avg Days on Market
Graphix, includes all single-family homes, from May 2024 to May 2025. This time the data was gathered. All data 511642. Copyright KW Advisors Palo Alto 2024. Each office is independently owned and operated.
Condo & Tow
243
New Listings
117
Sold Listings
2.7
Months of Inventory $870K
Median Sale Price 100%
Median Sale vs List 19 Avg Days on Market
r2025
Median SalesPrice
Single-Family Homes
The median sale price has decreased from $1 78m last May 2024, to $1 77m as of May 2025
Condos & Townhomes
The median sale price has decreased from $930k last May 2024, to $870k as of May 2025
AVGDays OntheMarket
Single-Family Homes
The average time spent on the market went up from 12 days last May 2024, to 16 days as of May 2025
Condos & Townhomes
The average time spent on the market went up from 15 days in May 2024, to 19 days as of May 2025.
Overbids
Single-Family Homes
The overbid percentage has decreased from 109% last May 2024, to 103% a year later
Condos & Townhomes
The overbid percentage has decreased from 105% last May 2024, to 100% a year later.
Moun View
What's in the data?
There were 19 singleproviding 0.7 months new listings, and 31 h of $2.7m. The median 104%, with an average
There were 54 condo sale, providing 1.7 mo were 48 new listings a sale price of $1.4m. T percentage was at 10 days on the market.
34 New Listings
s
31 Sold Listings
0.7 Months of Inventory
$2.7M Median Sale Price
104% Median Sale vs List
15 Avg Days on Market
Graphix, includes all single-family homes, from May 2024 to May 2025. This time the data was gathered. All data 511642. Copyright KW Advisors Palo Alto 2024. Each office is independently owned and operated.
48
New Listings
28 Sold Listings
1.7
Months of Inventory
$1.4M
Median Sale Price
102%
Median Sale vs List
23 Avg Days on Market
Single-Family Homes
Last 12 months, year-over-year.
Condos & Townhomes
Last 12 months, year-over-year
Median SalesPrice
Single-Family Homes
The median sale price has remained the same from $2 7m last May 2024, to $2 7m as of May 2025
Condos & Townhomes
The median sale price has increased from $1 3m last May 2024, to $1 4m as of May 2025
AVGDays OntheMarket
Single-Family Homes
The average time spent on the market went down from 16 days last May 2024, to 15 days as of May 2025
Condos & Townhomes
The average time spent on the market went up from 10 days in May 2024, to 23 days as of May 2025.
Overbids
Single-Family Homes
The overbid percentage has decreased from 108% last May 2024, to 104% a year later
Condos & Townhomes
The overbid percentage has decreased from 107% last May 2024, to 102% a year later.
SanM Coun
What's in the data?
There were 613 single providing 2 months of new listings, and 378 price of $2m. The med at 103 8%, with an ave market.
There were 327 condo sale, providing 3.4 mo were 152 new listings median sale price of $ percentage was at 10 days on the market
549
New Listings
378 Sold Listings
2 Months of Inventory
$2M Median Sale Price
103.8%
Median Sale vs List
19 Avg Days on Market
Graphix, includes all single-family homes, from May 2024 to May 2025. This time the data was gathered. All data 511642. Copyright KW Advisors Palo Alto 2024. Each office is independently owned and operated.
152
New Listings
3.4
Sold Listings
Months of Inventory $925K
Median Sale Price 100%
Median Sale vs List 31 Avg Days on Market 101
SanMateo
MAY 2024 - MAY 2025 LISTINGS FOR SALE
Single-Family Homes
Last 12 months, year-over-year.
Condos & Townhomes
Last 12 months, year-over-year
Median SalesPrice
Single-Family Homes
The median sale price has decreased from $2 3m last May 2024, to $2m as of May 2025
Condos & Townhomes
The median sale price has decreased from $927k last May 2024, to $925k as of May 2025
AVGDays OntheMarket
Single-Family Homes
The average time spent on the market went up from 16 days last May 2024, to 19 days as of May 2025
Condos & Townhomes
The average time spent on the market went up from 26 days in May 2024, to 31 days as of May 2025.
Overbids
Single-Family Homes
The overbid percentage has decreased from 106 3% last May 2024, to 103 8% a year later
Condos & Townhomes
The overbid percentage has decreased from 100.4% last May 2024, to 100% a year later.
SantaClara County
What's in the Santa Clara County data?
There were 1,179 single-family homes for sale, providing 1.7 months of inventory. There were 1,187 new listings, and 759 homes sold at a median price of $2.1m. The median overbid percentage was at 102 3%, with an average of 17 days on the market.
There were 809 condo and townhome units for sale, providing 2.8 months of inventory. There were 539 new listings and 288 units sold at a median sale price of $981k. The median overbid percentage was at 100.1%, with an average of 25 days on the market
Single-Family Homes
1,187 New Listings
759 Sold Listings
1.7 Months of Inventory
$2.1M Median Sale Price
102.3%
Median Sale vs List
17 Avg Days on Market
The data, sourced from InfoSparks and Trend Graphix, includes all single-family homes, condos and townhomes in the California Area above from May 2024 to May 2025. This may include preliminary data, and may vary from the time the data was gathered. All data is deemed reliable but not guaranteed. DRE# 01511642. Copyright KW Advisors Palo Alto 2024. Each office is independently owned and operated.
539
New Listings
288
Sold Listings
2.8
Months of Inventory
$981K
Median Sale Price
100.1%
Median Sale vs List
25 Avg Days on Market
SantaClaraCounty
MAY 2024 - MAY 2025
LISTINGS FOR SALE
Single-Family Homes
Last 12 months, year-over-year.
Condos & Townhomes
Last 12 months, year-over-year
Median SalesPrice
Single-Family Homes
The median sale price has increased from $2m last May 2024, to $2 1m as of May 2025
Condos & Townhomes
The median sale price has decreased from $1m last May 2024, to $981k as of May 2025
AVGDays OntheMarket
Single-Family Homes
The average time spent on the market went up from 14 days last May 2024, to 17 days as of May 2025
Condos & Townhomes
The average time spent on the market went up from 15 days in May 2024, to 25 days as of May 2025.
Overbids
Single-Family Homes
The overbid percentage has decreased from 107 7% last May 2024, to 102 3% a year later
Condos & Townhomes
The overbid percentage has decreased from 103.1% last May 2024, to 100.1% a year later.
Monterey County
What's in the Monterey County data?
There were 428 single-family homes for sale, providing 2.8 months of inventory. There were 214 new listings, and 135 homes sold at a median price of $905k. The median overbid percentage was at 95%, with an average of 40 days on the market.
There were 73 condo and townhome units for sale, providing 3.2 months of inventory. There were 27 new listings and 14 units sold at a median sale price of $678k. The median overbid percentage was at 96%, with an average of 67 days on the market
Single-Family Homes
214 New Listings
135 Sold Listings
2.8 Months of Inventory
$905K
Median Sale Price
95%
Median Sale vs List
40 Avg Days on Market
The data, sourced from InfoSparks and Trend Graphix, includes all single-family homes, condos and townhomes in the California Area above from May 2024 to May 2025. This may include preliminary data, and may vary from the time the data was gathered. All data is deemed reliable but not guaranteed. DRE# 01511642. Copyright KW Advisors Palo Alto 2024. Each office is independently owned and operated.
27
New Listings
14
Sold Listings
3.2
Months of Inventory $678K
Median Sale Price 96%
Median Sale vs List 67 Avg Days on Market
MontereyCounty
MAY 2024 - MAY 2025
Single-Family Homes
Last 12 months, year-over-year.
Condos & Townhomes
Last 12 months, year-over-year
Median SalesPrice
Single-Family Homes
The median sale price has decreased from $1m last May 2024, to $905k as of May 2025
Condos & Townhomes
The median sale price has increased from $670k last May 2024, to $678k as of May 2025
AVGDays OntheMarket
Single-Family Homes
The average time spent on the market went up from 32 days last May 2024, to 40 days as of May 2025
Condos & Townhomes
The average time spent on the market went up from 48 days in May 2024, to 67 days as of May 2025.
Overbids
Single-Family Homes
The overbid percentage has remained the same from 95% last May 2024, to 95% a year later
Condos & Townhomes
The overbid percentage has decreased from 98% last May 2024, to 96% a year later.
SantaCruz County
What's in the Santa Cruz County data?
There were 437 single-family homes for sale, providing 3.1 months of inventory. There were 274 new listings, and 122 homes sold at a median price of $1.3m. The median overbid percentage was at 98%, with an average of 25 days on the market
There were 119 condo and townhome units for sale, providing 3.7 months of inventory. There were 55 new listings and 32 units sold at a median sale price of $781k. The median overbid percentage was at 96%, with an average of 49 days on the market.
Single-Family Homes
274 New Listings
122 Sold Listings
3.1 Months of Inventory
$1.3M
Median Sale Price
98%
Median Sale vs List
25 Avg Days on Market
The data, sourced from InfoSparks and Trend Graphix, includes all single-family homes, condos and townhomes in the California Area above from May 2024 to May 2025. This may include preliminary data, and may vary from the time the data was gathered. All data is deemed reliable but not guaranteed. DRE# 01511642. Copyright KW Advisors Palo Alto 2024. Each office is independently owned and operated.
55
New Listings
32 Sold Listings
3.7
Months of Inventory
$781K
Median Sale Price 96%
Median Sale vs List 49 Avg Days on Market
SantaCruzCounty
MAY 2024 - MAY 2025
Single-Family Homes
Last 12 months, year-over-year.
Condos & Townhomes
Last 12 months, year-over-year
Median SalesPrice
Single-Family Homes
The median sale price has decreased from $1 36m last May 2024, to $1 35m as of May 2025
Condos & Townhomes
The median sale price has increased from $730k last May 2024, to $781k as of May 2025
AVGDays OntheMarket
Single-Family Homes
The average time spent on the market went down from 29 days last May 2024, to 25 days as of May 2025
Condos & Townhomes
The average time spent on the market went up from 27 days in May 2024, to 49 days as of May 2025.
Overbids
Single-Family Homes
The overbid percentage has decreased from 99% last May 2024, to 98% a year later
Condos & Townhomes
The overbid percentage has decreased from 99% last May 2024, to 96% a year later.
gle-Family Homes
11 New Listings
11 Sold Listings
2.2 Months of Inventory
$1M Median Sale Price
99%
Median Sale vs List
18 Avg Days on Market
data, sourced from InfoSparks and Trend Graphix, includes all single-family homes, and townhomes in the California Area above from May 2024 to May 2025. This include preliminary data, and may vary from the time the data was gathered. All data deemed reliable but not guaranteed. DRE# 01511642. Copyright KW Advisors Palo Alto 2024. Each office is independently owned and operated.
Sold Listings
New Listings 1 Month of Inventory $0 Median Sale Price 0%
Median Sale vs List 0 Avg Days on Market
Median SalesPrice
Single-Family Homes
The median sale price has increased from $925k last May 2024, to $1m as of May 2025
Condos & Townhomes
The median sale price has decreased from $635k last May 2024, to $0 as of May 2025
AVGDays OntheMarket
Single-Family Homes
The average time spent on the market went down from 28 days last May 2024, to 18 days as of May 2025
Condos & Townhomes
The average time spent on the market went down from 30 days in May 2024, to 0 days as of May 2025.
Overbids
Single-Family Homes
The overbid percentage has decreased from 104% last May 2024, to 99% a year later
Condos & Townhomes
The overbid percentage has decreased from 94% last May 2024, to 0% a year later.
Sunn
What's in the
There were 48 single providing 1 month of new listings, and 50 h of $2.6m. The media 106%, with an averag
There were 61 condo sale, providing 1.8 m were 42 new listings sale price of $1.2m. T percentage was at 10 days on the market.
67 New Listings
50 Sold Listings
1 Month of Inventory
$2.6M Median Sale Price
106%
Median Sale vs List
13 Avg Days on Market
Graphix, includes all single-family homes, from May 2024 to May 2025. This time the data was gathered. All data 511642. Copyright KW Advisors Palo Alto
42
New Listings
24 Sold Listings
1.8
Months of Inventory
$1.2M
Median Sale Price
101%
Median Sale vs List
22 Avg Days on Market
Sunnyvale
-
2025
Single-Family Homes
Last 12 months, year-over-year.
Condos & Townhomes
Last 12 months, year-over-year
Median SalesPrice
Single-Family Homes
The median sale price has increased from $2 61m last May 2024, to $2 68m as of May 2025
Condos & Townhomes
The median sale price has decreased from $1 28m last May 2024, to $1 2m as of May 2025
AVGDays OntheMarket
Single-Family Homes
The average time spent on the market went up from 7 days last May 2024, to 13 days as of May 2025
Condos & Townhomes
The average time spent on the market went up from 12 days in May 2024, to 22 days as of May 2025.
Overbids
Single-Family Homes
The overbid percentage has decreased from 114% last May 2024, to 106% a year later
Condos & Townhomes
The overbid percentage has decreased from 106% last May 2024, to 101% a year later.
Santa City
What's in the data?
There were 36 single providing 0.8 month new listings, and 42 of $1.8m. The media 106%, with an avera
There were 60 cond sale, providing 2.4 m were 31 new listings sale price of $845k. percentage was at 9 days on the market.
59 New Listings
42 Sold Listings
0.8 Months of Inventory
$1.8M Median Sale Price
106% Median Sale vs List
15 Avg Days on Market
Graphix, includes all single-family homes, above from May 2024 to May 2025. This the time the data was gathered. All data 511642. Copyright KW Advisors Palo Alto 2024. Each office is independently owned and operated.
31
New Listings
28 Sold Listings
2.4
Months of Inventory
$845K Median Sale Price
Median Sale vs List 30 Avg Days on Market
Median SalesPrice
Single-Family Homes
The median sale price has decreased from $2 1m last May 2024, to $1 8m as of May 2025
Condos & Townhomes
The median sale price has decreased from $1 3m last May 2024, to $845k as of May 2025
AVGDays OntheMarket
Single-Family Homes
The average time spent on the market went up from 10 days last May 2024, to 15 days as of May 2025
Condos & Townhomes
The average time spent on the market went up from 13 days in May 2024, to 30 days as of May 2025.
Overbids
Single-Family Homes
The overbid percentage has decreased from 113% last May 2024, to 106% a year later
Condos & Townhomes
The overbid percentage has decreased from 109% last May 2024, to 97% a year later.
Saratoga
What's in the Saratoga data?
There were 37 single-family homes for sale, providing 1.6 months of inventory. There we new listings, and 32 homes sold at a median of $4.4m. The median overbid percentage w 102%, with an average of 14 days on the ma
There were 18 condo and townhome units fo sale, providing 3.6 months of inventory. Ther were 15 new listings and 4 units sold at a me sale price of $913k. The median overbid percentage was at 100%, with an average of days on the market.
e-Family Homes
36 New Listings
32 Sold Listings
1.6 Months of Inventory
$4.4M Median Sale Price
102% Median Sale vs List
14 Avg Days on Market
sourced from InfoSparks and Trend Graphix, includes all single-family homes, townhomes in the California Area above from May 2024 to May 2025. This preliminary data, and may vary from the time the data was gathered. All data reliable but not guaranteed. DRE# 01511642. Copyright KW Advisors Palo Alto 2024. Each office is independently owned and operated.
15 New Listings
3.6 Months of Inventory
4 Sold Listings
MAY 2024 - MAY 2025
amily Homes months, year-over-year.
& Townhomes months, year-over-year
Median SalesPrice
Single-Family Homes
The median sale price has increased from $4m last May 2024, to $4 4m as of May 2025
Condos & Townhomes
The median sale price has decreased from $1 3m last May 2024, to $913k as of May 2025
AVGDays OntheMarket
Single-Family Homes
The average time spent on the market went up from 10 days last May 2024, to 14 days as of May 2025
Condos & Townhomes
The average time spent on the market went up from 15 days in May 2024, to 33 days as of May 2025.
Overbids
Single-Family Homes
The overbid percentage has decreased from 107% last May 2024, to 102% a year later
Condos & Townhomes
The overbid percentage has decreased from 104% last May 2024, to 100% a year later.