That's the question you should be asking yourself.
Our market is incredibly diverse and rapidly changing. Values vary not just by neighborhood but by street. Your home isn't necessarily worth what your neighbors' home is. It's the current market that sets the value of your home.
So, do you know what your home is worth in today's market?
Icanhelp...
Contact me for a confidential, no obligation assessment of your home's value.
Lately, it feels like every headline about the housing market comes with a side of doubt. Are prices going up or down? Are we headed for a crash? Will rates ever come down? And all the media noise may leave you wondering: does it really make sense to buy a home right now?
But here’s one thing that doesn’t get enough airtime. Real estate has always been about the long game. And when you look at the big picture, not just the latest clickbait headlines, it’s easy to see why so many people say it’s still the best investment you can make –even now.
Smart Strategies for a Mortgage Application
Avoid paying off debts or collections without professional advice.
Don't have your credit report pulled too many times - this can hurt your credit score. 3 4 5 6 1 2
Always consult your mortgage professional before making large financial moves. Use verified funds for deposits to prevent closing delays.
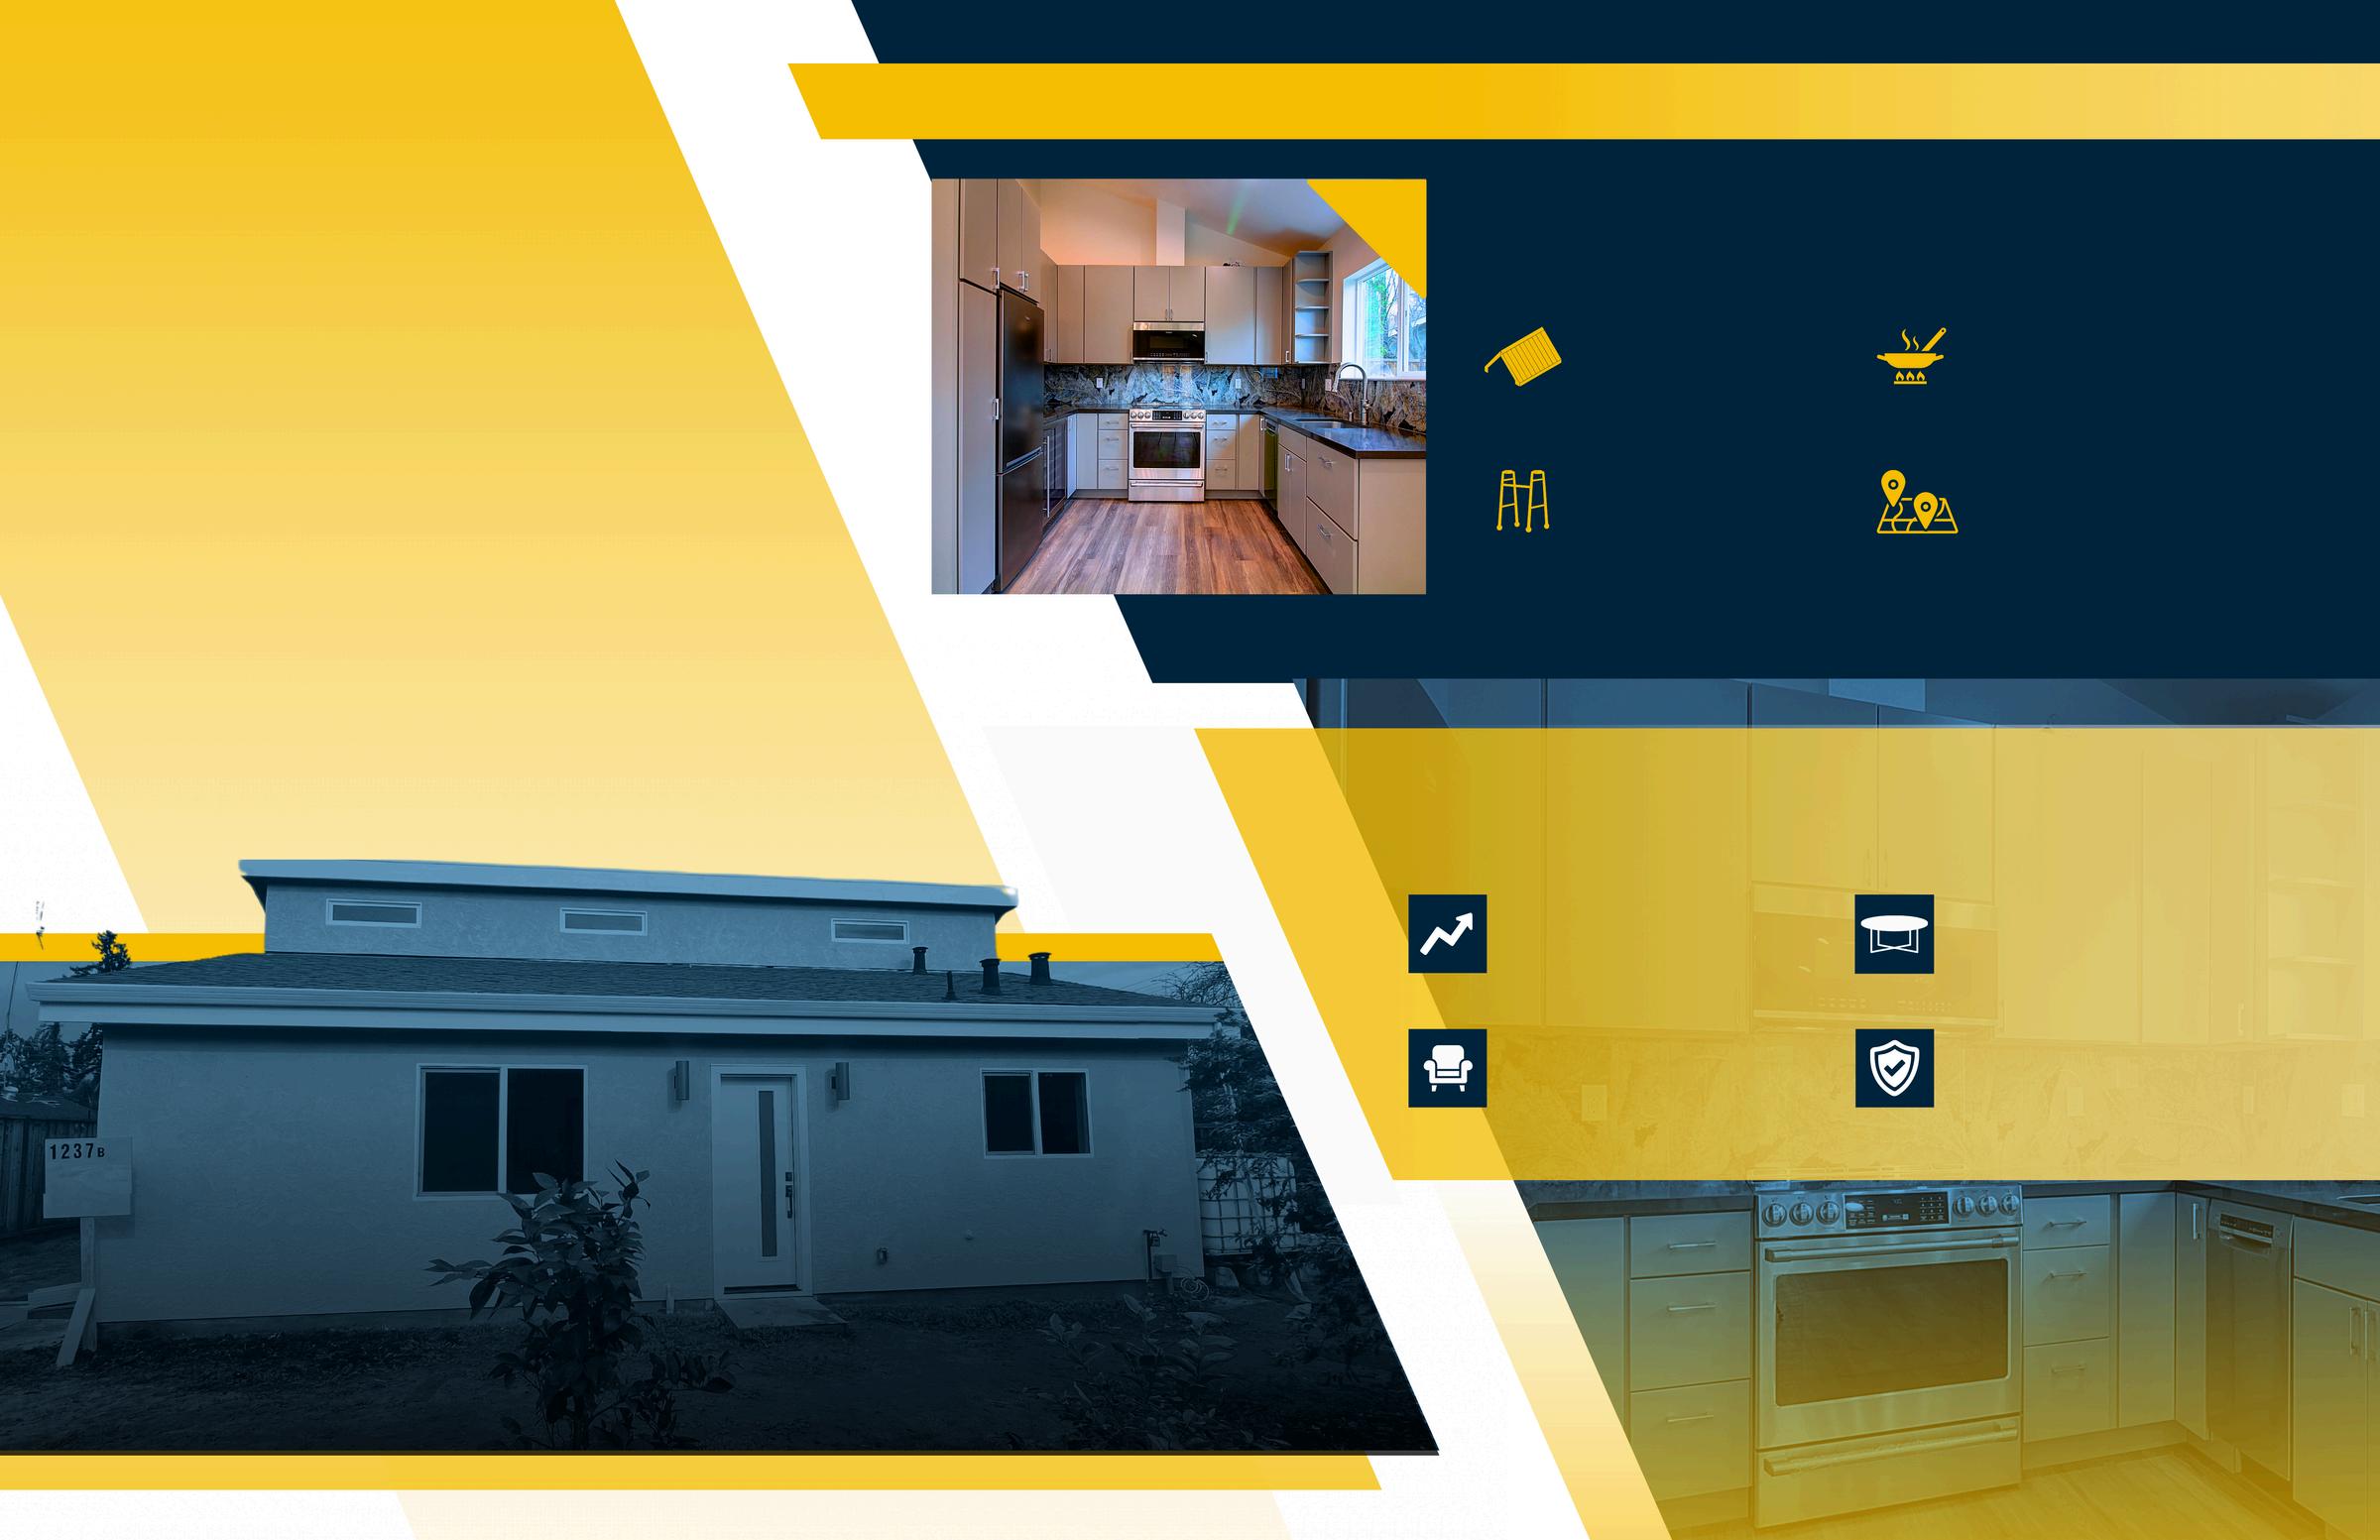
HomeRenovationsThatCanMakea BIG IMPACT AccordingtoExperts
Enhancing Property Value and Family Living Space with an Acton ADU
The Anenberg-Essert family in Campbell collaborated with Acton ADU to create a versatile, comfortable, and valuable addition to their property. This ADU project is a shining example of how a well-designed accessory dwelling unit can increase property value and serve a family’s unique needs.
GoalsandVision
The family envisioned an ADU that would function as an independent living space for family members, enhance their property’s worth, and provide seamless integration with the main home They wanted a space that balanced privacy with connectivity, feeling like a natural extension of their residence
Design and Construction Details
Constructed at 747 square feet, this ADU was designed with modern, high-quality finishes to serve both aesthetic and practical needs. Key features include:
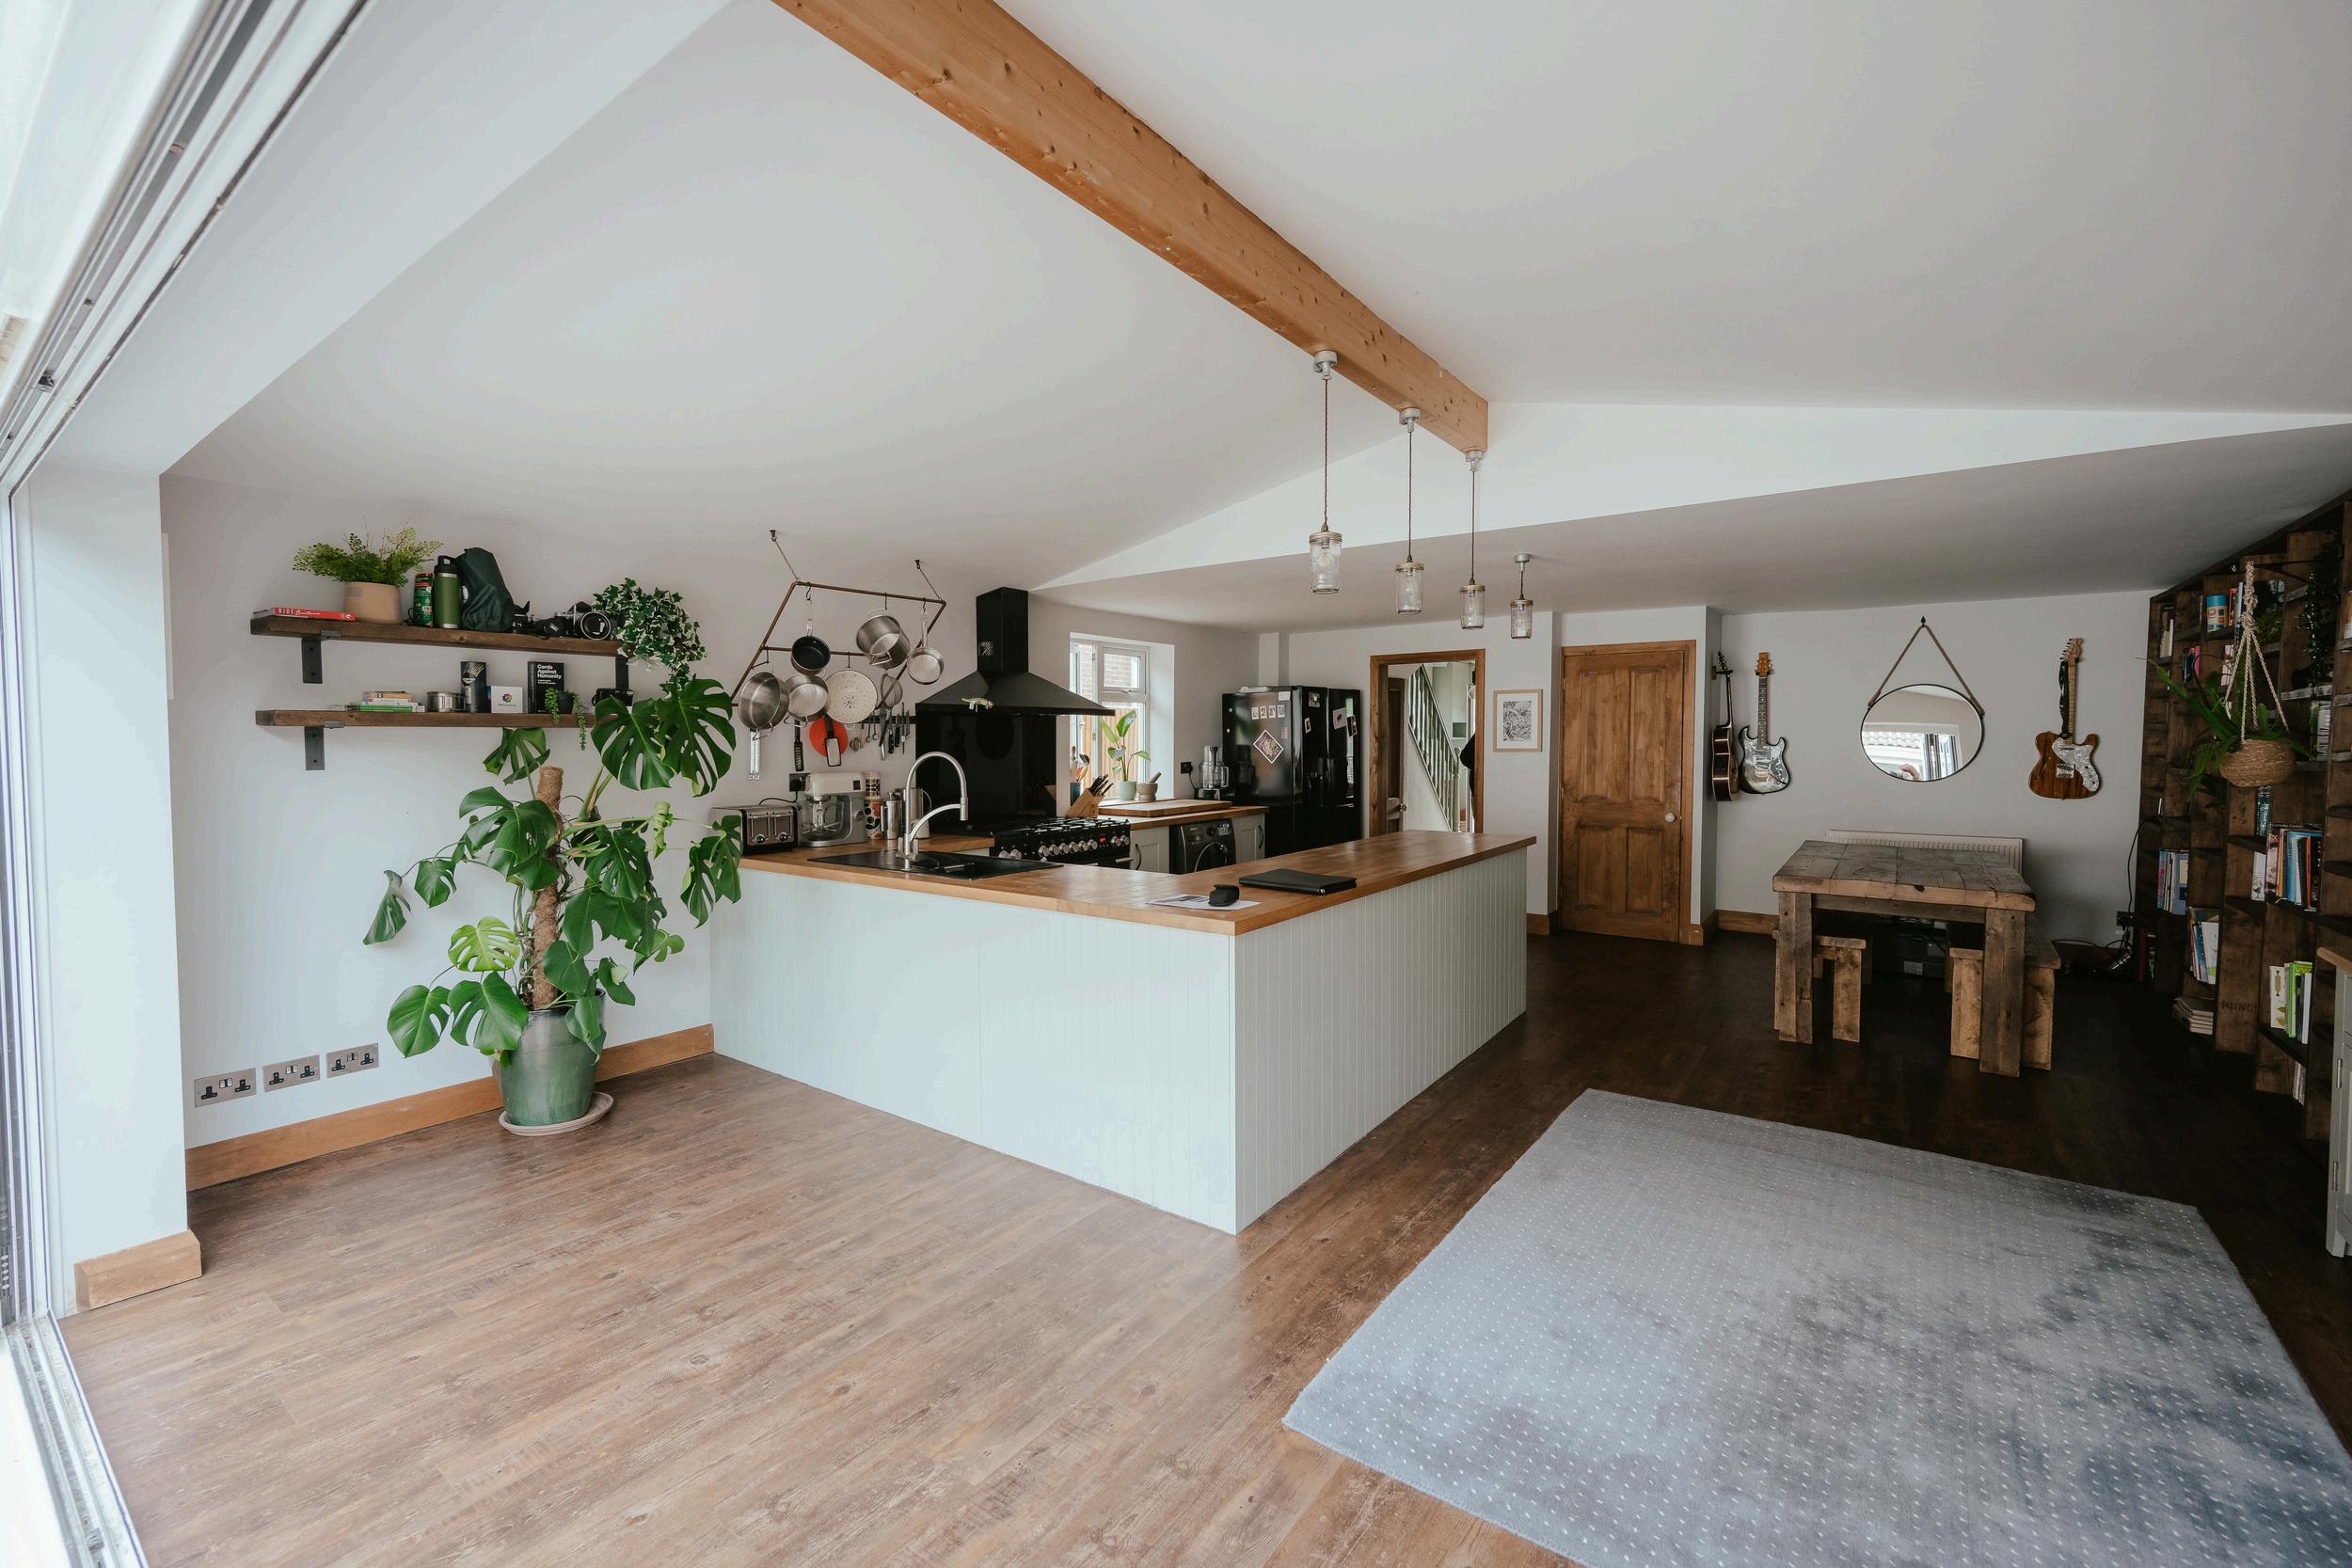
Vaulted Ceilings
Creates a spacious, open atmosphere
Senior-Friendly Living
Safe, independent space for elderly family members
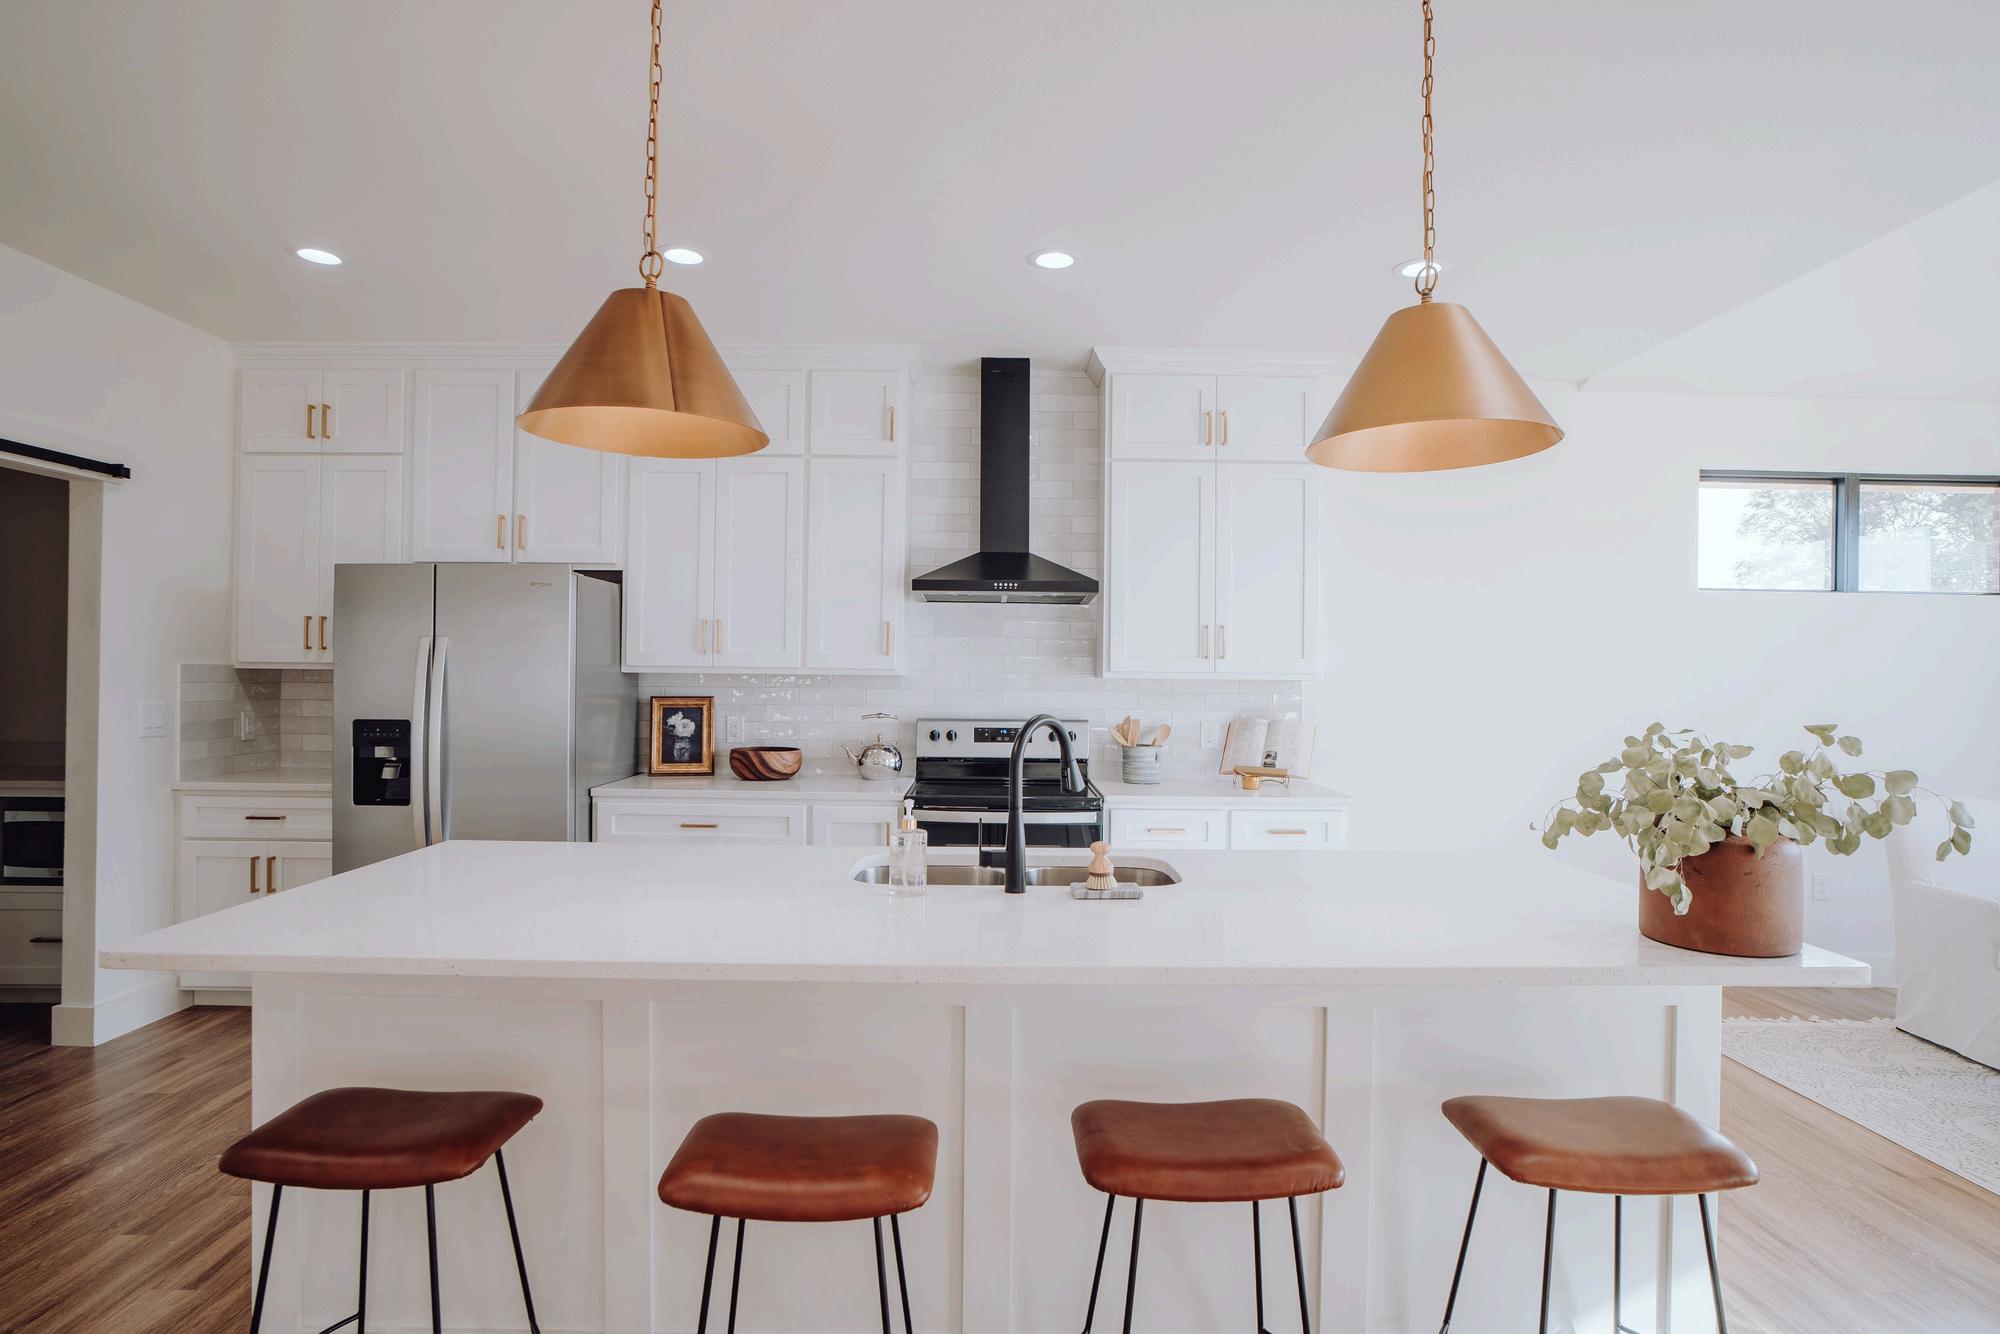
Fully Equipped Kitchen
Modern amenities for everyday convenience
Open Living Area
Multipurpose area for relaxation and entertainment
Results and Impact
The completion of the Anenberg-Essert ADU led to several valuable outcomes:
Increased Property Value
The ADU addition significantly boosted property value
Flexible Living Space
A versatile space for family, guests, or as a rental
Modern Comforts
High-end finishes and amenities enhance both function and style.
Enhanced Family Living
The ADU enriches the AnenbergEssert family’s home with both privacy and connection
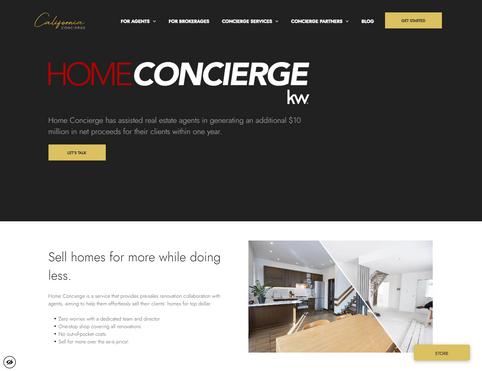
VENDOR DIRECTORY
When it comes to home ownership, knowing who you can trust is crucial. That's why we've curated a select list of trusted vendors who are ready to help with your home goals.
s nventory
16 Sold Listings
$2M Median Sale Price % vs List
16 Avg Days on Market
from Broker Metrics, includes all single-family homes, condos and California Area from May 2024 to May 2025. This may include and may vary from the time the data was gathered. All data is deemed guaranteed. DRE# 01345026. Copyright KW Advisors Fremont 2025. Each office is independently owned and operated.
29
New Listings
17 Sold Listings
3
Months of Inventory
$1.2M
Median Sale Price
101.1%
Median Sale vs List
26 Avg Days on Market
MAY 2024 - MAY 2025
Single-Family Homes
Last 12 months, year-over-year.
Condos & Townhomes
Last 12 months, year-over-year
Median SalesPrice
Single-Family Homes
The median sale price has increased from $1 6m last May 2024, to $2m as of May 2025
Condos & Townhomes
The median sale price has increased from $985k last May 2024, to $1 2m as of May 2025
AVGDays OntheMarket
Single-Family Homes
The average time spent on the market went up from 14 days last May 2024, to 16 days as of May 2025
Condos & Townhomes
The average time spent on the market went up from 17 days in May 2024, to 26 days as of May 2025.
Overbids
Single-Family Homes
The overbid percentage has decreased from 109 3% last May 2024, to 102% a year later
Condos & Townhomes
The overbid percentage has decreased from 108.1% last May 2024, to 101.1% a year later.
Frem
What's in
There were 26 providing 1.1 m new listings, a of $1.7m. The 104%, with an
There were 19 sale, providing were 73 new li sale price of $ percentage wa days on the m
135 New Listings
90 Sold Listings
1.1 Months of Inventory
$1.7M Median Sale Price
104% Median Sale vs List
19 Avg Days on Market
and include deemed 2025.
Condo & Town
73
New Listings
3.7
Months of Inventory $975K
Median Sale Price 97.3%
Median Sale vs List 39 Avg Days on Market 34 Sold Listings
MAY 2024 - MAY 2025
INGS FOR SALE SOLD LISTINGS
amily Homes months, year-over-year.
& Townhomes months, year-over-year
Median SalesPrice
Single-Family Homes
The median sale price has decreased from $1 8m last May 2024, to $1 7m as of May 2025
Condos & Townhomes
The median sale price has decreased from $1m last May 2024, to $975k as of May 2025
AVGDays OntheMarket
Single-Family Homes
The average time spent on the market went up from 12 days last May 2024, to 19 days as of May 2025
Condos & Townhomes
The average time spent on the market went up from 18 days in May 2024, to 39 days as of May 2025.
Overbids
Single-Family Homes
The overbid percentage has decreased from 111 6% last May 2024, to 104% a year later
Condos & Townhomes
The overbid percentage has decreased from 103.5% last May 2024, to 97.3% a year later.
Newark
What's in the Newark data?
There were 76 single-family homes for sale, providing 2.2 months of inventory. There we new listings, and 20 homes sold at a median of $1.3m. The median overbid percentage w 99%, with an average of 32 days on the mark
There were 51 condo and townhome units fo sale, providing 2.2 months of inventory. Ther were 17 new listings and 8 units sold at a me sale price of $790k. The median overbid percentage was at 99.9%, with an average of days on the market.
34 New Listings
20 Sold Listings
2.2 Months of Inventory
$1.3M Median Sale Price
99%
Median Sale vs List
32 Avg Days on Market
sourced from Broker Metrics, includes all single-family homes, condos and the California Area from May 2024 to May 2025. This may include data, and may vary from the time the data was gathered. All data is deemed not guaranteed. DRE# 01345026. Copyright KW Advisors Fremont 2025. Each office is independently owned and operated.
17
New Listings
8 Sold Listings
2.2 Months of Inventory
$790K Median Sale Price 99.9% Median Sale vs List 38 Avg Days on Market
MAY 2024 - MAY 2025
amily Homes months, year-over-year.
& Townhomes months, year-over-year
Median SalesPrice
Single-Family Homes
The median sale price has decreased from $1 5m last May 2024, to $1 3m as of May 2025
Condos & Townhomes
The median sale price has decreased from $1 1m last May 2024, to $790k as of May 2025
AVGDays OntheMarket
Single-Family Homes
The average time spent on the market went up from 9 days last May 2024, to 32 days as of May 2025
Condos & Townhomes
The average time spent on the market went up from 16 days in May 2024, to 38 days as of May 2025.
Overbids
Single-Family Homes
The overbid percentage has decreased from 109 7% last May 2024, to 99% a year later
Condos & Townhomes
The overbid percentage has decreased from 107.9% last May 2024, to 99.9% a year later.
UnionCity
What's in the Union City data?
There were 68 single-family homes for sale, providing 1.5 months of inventory. There were 36 new listings, and 21 homes sold at a median price of $1.5m. The median overbid percentage was at 102.5%, with an average of 15 days on the market.
There were 42 condo and townhome units for sale, providing 3.3 months of inventory. There were 18 new listings and 5 units sold at a median sale price of $550k. The median overbid percentage was at 101.2%, with an average of 35 days on the market.
SFH
Single-Family Homes
36 New Listings
21 Sold Listings
1.5 Months of Inventory
$1.5M
Median Sale Price
102.5%
Median Sale vs List
15 Avg Days on Market
The data, sourced from Broker Metrics, includes all single-family homes, condos and townhomes in the California Area from May 2024 to May 2025. This may include preliminary data, and may vary from the time the data was gathered. All data is deemed reliable but not guaranteed. DRE# 01345026. Copyright KW Advisors Fremont 2025. Each office is independently owned and operated.
18
New Listings
5
Sold Listings
3.3
Months of Inventory
101.2%
Median Sale vs List
$550K
Median Sale Price
35
Avg Days on Market
Single-Family Homes
Last 12 months, year-over-year.
Condos & Townhomes
Last 12 months, year-over-year
Median SalesPrice
Single-Family Homes
The median sale price has increased from $1 5m last May 2024, to $1 52m as of May 2025
Condos & Townhomes
The median sale price has decreased from $725k last May 2024, to $550k as of May 2025
AVGDays OntheMarket
Single-Family Homes
The average time spent on the market went up from 9 days last May 2024, to 15 days as of May 2025
Condos & Townhomes
The average time spent on the market went up from 17 days in May 2024, to 35 days as of May 2025.
Overbids
Single-Family Homes
The overbid percentage has decreased from 108 4% last May 2024, to 102 5% a year later
Condos & Townhomes
The overbid percentage has decreased from 105.1% last May 2024, to 101.2% a year later.
Hayw
What's in the
There were 241 single providing 1.8 months new listings, and 62 h of $887k. The median 99.7%, with an averag
There were 145 condo sale, providing 2.5 mo were 50 new listings a sale price of $635k. T percentage was at 98 days on the market.
103 New Listings
62 Sold Listings
1.8 Months of Inventory
$887K Median Sale Price
99.7%
Median Sale vs List
27 Avg Days on Market
single-family homes, condos and to May 2025. This may include was gathered. All data is deemed
Copyright KW Advisors Fremont 2025.
50
New Listings
22 Sold Listings
2.5
Months of Inventory
$635K
Median Sale Price 98.5%
Median Sale vs List 25 Avg Days on Market
2 months, year-over-year. s & Townhomes
2 months, year-over-year
Median SalesPrice
Single-Family Homes
The median sale price has decreased from $1m last May 2024, to $887k as of May 2025
Condos & Townhomes
The median sale price has decreased from $800k last May 2024, to $635k as of May 2025
AVGDays OntheMarket
Single-Family Homes
The average time spent on the market went up from 11 days last May 2024, to 27 days as of May 2025
Condos & Townhomes
The average time spent on the market went up from 24 days in May 2024, to 25 days as of May 2025.
Overbids
Single-Family Homes
The overbid percentage has decreased from 105 2% last May 2024, to 99 7% a year later
Condos & Townhomes
The overbid percentage has decreased from 102.3% last May 2024, to 98.5% a year later.
Castro Valley
What's in the Castro Valley data?
There were 113 single-family homes for sale, providing 1.5 months of inventory. There were 60 new listings, and 33 homes sold at a median price of $1.3m. The median overbid percentage was at 102 6%, with an average of 21 days on the market
There were 34 condo and townhome units for sale, providing 3 months of inventory. There were 11 new listings and 4 units sold at a median sale price of $750k. The median overbid percentage was at 92.9%, with an average of 66 days on the market.
SFH
Single-Family Homes
60 New Listings
33 Sold Listings
1.5 Months of Inventory
$1.3M
Median Sale Price
102.6%
Median Sale vs List
21 Avg Days on Market
The data, sourced from Broker Metrics, includes all single-family homes, condos and townhomes in the California Area from May 2024 to May 2025. This may include preliminary data, and may vary from the time the data was gathered. All data is deemed reliable but not guaranteed. DRE# 01345026. Copyright KW Advisors Fremont 2025. Each office is independently owned and operated.
Listings
CastroValley
Single-Family Homes
Last 12 months, year-over-year.
Condos & Townhomes
Last 12 months, year-over-year
Median SalesPrice
Single-Family Homes
The median sale price has increased from $1 2m last May 2024, to $1 3m as of May 2025
Condos & Townhomes
The median sale price has decreased from $1 2m last May 2024, to $750k as of May 2025
AVGDays OntheMarket
Single-Family Homes
The average time spent on the market went up from 16 days last May 2024, to 21 days as of May 2025
Condos & Townhomes
The average time spent on the market went up from 14 days in May 2024, to 66 days as of May 2025.
Overbids
Single-Family Homes
The overbid percentage has decreased from 105 5% last May 2024, to 102 6% a year later
Condos & Townhomes
The overbid percentage has decreased from 108.2% last May 2024, to 92.9% a year later.
San Leandro
What's in the San Leandro
data?
There were 122 single-family homes for sale, providing 1.6 months of inventory. There were 60 new listings, and 34 homes sold at a median price of $902k. The median overbid percentage was at 103%, with an average of 24 days on the market
There were 42 condo and townhome units for sale, providing 6.4 months of inventory. There were 15 new listings and 4 units sold at a median sale price of $633k. The median overbid percentage was at 101.1%, with an average of 37 days on the market.
SFH
Single-Family Homes
60 New Listings
34 Sold Listings
1.6 Months of Inventory
$902K
Median Sale Price
103%
Median Sale vs List
24 Avg Days on Market
The data, sourced from Broker Metrics, includes all single-family homes, condos and townhomes in the California Area from May 2024 to May 2025. This may include preliminary data, and may vary from the time the data was gathered. All data is deemed reliable but not guaranteed. DRE# 01345026. Copyright KW Advisors Fremont 2025. Each office is independently owned and operated.
15
New Listings
4 Sold Listings
6.4
Months of Inventory
$633K
Median Sale Price
101.1%
Median Sale vs List
37 Avg Days on Market
SanLeandro
Single-Family Homes
Last 12 months, year-over-year.
Condos & Townhomes
Last 12 months, year-over-year
Median SalesPrice
Single-Family Homes
The median sale price has increased from $882k last May 2024, to $902k as of May 2025
Condos & Townhomes
The median sale price has increased from $580k last May 2024, to $633k as of May 2025
AVGDays OntheMarket
Single-Family Homes
The average time spent on the market went up from 17 days last May 2024, to 24 days as of May 2025
Condos & Townhomes
The average time spent on the market went up from 27 days in May 2024, to 37 days as of May 2025.
Overbids
Single-Family Homes
The overbid percentage has decreased from 106 2% last May 2024, to 103% a year later
Condos & Townhomes
The overbid percentage has increased from 100.5% last May 2024, to 101.1% a year later.
Tri-Cit
What's in the Tri-C
There were 408 single-family providing 1 3 months of inve new listings, and 131 homes price of $1.6m. The median o was at 103.2%, with an avera market.
There were 289 condo and to sale, providing 3.3 months of were 108 new listings and 48 median sale price of $868k. T percentage was at 98%, with days on the market.
205 New Listings
1.3 Months of Inventory
103.2%
Median Sale vs List
131 Sold Listings
$1.6M Median Sale Price
20 Avg Days on Market
single-family homes, condos and 2025. This may include gathered. All data is deemed Advisors Fremont 2025.
108
New Listings
48 Sold Listings
3.3
Months of Inventory
$868K
Median Sale Price 98%
Median Sale vs List
38 Avg Days on Market
MAY 2024 - MAY 2025
TINGS FOR SALE SOLD LISTINGS
Family Homes months, year-over-year.
& Townhomes months, year-over-year
Median SalesPrice
Single-Family Homes
The median sale price has decreased from $1 678m last May 2024, to $1 675m as of May 2025
Condos & Townhomes
The median sale price has decreased from $1m last May 2024, to $868k as of May 2025
AVGDays OntheMarket
Single-Family Homes
The average time spent on the market went up from 11 days last May 2024, to 20 days as of May 2025
Condos & Townhomes
The average time spent on the market went up from 17 days in May 2024, to 38 days as of May 2025.
Overbids
Single-Family Homes
The overbid percentage has decreased from 110 8% last May 2024, to 103 2% a year later
Condos & Townhomes
The overbid percentage has decreased from 103.8% last May 2024, to 98% a year later.
Plea
What's in
There were 204 providing 1.8 m new listings, an of $1.6m. The m 97.5%, with an a
There were 38 c sale, providing 3 12 new listings price of $955k. was at 97.9%, w market.
100 New Listings
43 Sold Listings
1.8 Months of Inventory
$1.6M Median Sale Price
97.5% Median Sale vs List
22 Avg Days on Market
includes all single-family homes, condos and May 2024 to May 2025. This may include time the data was gathered. All data is deemed 01345026. Copyright KW Advisors Fremont 2025. Each office is independently owned and operated.
New Listings
3
Months of Inventory
Sold Listings
$955K
Median Sale Price 97.9%
Median Sale vs List 28 Avg Days on Market 12
Median SalesPrice
Single-Family Homes
The median sale price has decreased from $1 9m last May 2024, to $1 6m as of May 2025
Condos & Townhomes
The median sale price has decreased from $960k last May 2024, to $955k as of May 2025
AVGDays OntheMarket
Single-Family Homes
The average time spent on the market went up from 12 days last May 2024, to 22 days as of May 2025
Condos & Townhomes
The average time spent on the market went up from 17 days in May 2024, to 28 days as of May 2025.
Overbids
Single-Family Homes
The overbid percentage has decreased from 104 1% last May 2024, to 97 5% a year later
Condos & Townhomes
The overbid percentage has decreased from 103.4% last May 2024, to 97.9% a year later.
SanRamon
What's in the San Ramon data?
There were 163 single-family homes for sale, providing 1.4 months of inventory. There were 80 new listings, and 39 homes sold at a median price of $1.8m. The median overbid percentage was at 100.2%, with an average of 21 days on the market.
There were 120 condo and townhome units for sale, providing 4 months of inventory. There were 38 new listings and 10 units sold at a median sale price of $732k. The median overbid percentage was at 97.6%, with an average of 27 days on the market.
SFH
Single-Family Homes
80 New Listings
39 Sold Listings
1.4 Months of Inventory
$1.8M
Median Sale Price
100.2%
Median Sale vs List
21 Avg Days on Market
The data, sourced from Broker Metrics, includes all single-family homes, condos and townhomes in the California Area from May 2024 to May 2025. This may include preliminary data, and may vary from the time the data was gathered. All data is deemed reliable but not guaranteed. DRE# 01345026. Copyright KW Advisors Fremont 2025. Each office is independently owned and operated.
38 New Listings
4 Months of Inventory
Listings
MAY 2024 - MAY 2025
ISTINGS FOR SALE
le-Family Homes 12 months, year-over-year.
dos & Townhomes
12 months, year-over-year
Median SalesPrice
Single-Family Homes
The median sale price has decreased from $2m last May 2024, to $1 8m as of May 2025
Condos & Townhomes
The median sale price has decreased from $1 1m last May 2024, to $732k as of May 2025
AVGDays OntheMarket
Single-Family Homes
The average time spent on the market went up from 11 days last May 2024, to 21 days as of May 2025
Condos & Townhomes
The average time spent on the market went up from 18 days in May 2024, to 27 days as of May 2025.
Overbids
Single-Family Homes
The overbid percentage has decreased from 105 4% last May 2024, to 100 2% a year later
Condos & Townhomes
The overbid percentage has decreased from 101% last May 2024, to 97.6% a year later.
Liverm
What's in the Liver
There were 227 single-family providing 1.6 months of inve new listings, and 67 homes s of $1.3m. The median overbi 100%, with an average of 20
There were 70 condo and tow sale, providing 2.1 months of were 29 new listings and 10 sale price of $737k. The med percentage was at 102%, wit days on the market.
104 New Listings
1.6 Months of Inventory
100% Median Sale vs List
67 Sold Listings
$1.3M Median Sale Price
20 Avg Days on Market
homes, condos and 2025. This may include gathered. All data is deemed Advisors Fremont 2025.
29
New Listings
10
Sold Listings
2.1
Months of Inventory
$737K
Median Sale Price
102%
Median Sale vs List
34 Avg Days on Market
Livermore
MAY 2024 - MAY 2025
LISTINGS FOR SALE SOLD LISTINGS
Single-Family Homes
Last 12 months, year-over-year.
Condos & Townhomes
Last 12 months, year-over-year
Median SalesPrice
Single-Family Homes
The median sale price has decreased from $1 31m last May 2024, to $1 3m as of May 2025
Condos & Townhomes
The median sale price has increased from $693k last May 2024, to $737k as of May 2025
AVGDays OntheMarket
Single-Family Homes
The average time spent on the market went up from 12 days last May 2024, to 20 days as of May 2025
Condos & Townhomes
The average time spent on the market went up from 16 days in May 2024, to 34 days as of May 2025.
Overbids
Single-Family Homes
The overbid percentage has decreased from 103 7% last May 2024, to 100% a year later
Condos & Townhomes
The overbid percentage has increased from 101.5% last May 2024, to 102% a year later.
Cupertino
What's in the Cupertino data?
There were 81 single-family homes for sale, providing 1.4 months of inventory. There were 32 new listings, and 20 homes sold at a median price of $3.4m. The median overbid percentage was at 104.4%, with an average of 19 days on the market.
There were 30 condo and townhome units for sale, providing 1.9 months of inventory. There were 13 new listings and 11 units sold at a median sale price of $1.5m. The median overbid percentage was at 104.7%, with an average of 15 days on the market.
SFH
Single-Family Homes
32 New Listings
20 Sold Listings
1.4 Months of Inventory
$3.4M
Median Sale Price
104.4%
Median Sale vs List
19 Avg Days on Market
The data, sourced from Broker Metrics, includes all single-family homes, condos and townhomes in the California Area from May 2024 to May 2025. This may include preliminary data, and may vary from the time the data was gathered. All data is deemed reliable but not guaranteed. DRE# 01345026. Copyright KW Advisors Fremont 2025. Each office is independently owned and operated.
New Listings
11
Sold Listings
1.9
Months of Inventory
$1.5M
Median Sale Price
104.7%
Median Sale vs List
15 Avg Days on Market
Cupertino
MAY 2024 - MAY 2025 LISTINGS FOR SALE
Single-Family Homes
Last 12 months, year-over-year.
Condos & Townhomes
Last 12 months, year-over-year
Median SalesPrice
Single-Family Homes
The median sale price has increased from $3 3m last May 2024, to $3 4m as of May 2025
Condos & Townhomes
The median sale price has increased from $1 3m last May 2024, to $1 5m as of May 2025
AVGDays OntheMarket
Single-Family Homes
The average time spent on the market went down from 20 days last May 2024, to 19 days as of May 2025
Condos & Townhomes
The average time spent on the market went down from 16 days in May 2024, to 15 days as of May 2025.
Overbids
Single-Family Homes
The overbid percentage has decreased from 109 2% last May 2024, to 104 4% a year later
Condos & Townhomes
The overbid percentage has decreased from 106.5% last May 2024, to 104.7% a year later.
Oakland
What's in the Oakland data?
There were 805 single-family homes for sale, providing 2.7 months of inventory. There were 302 new listings, and 175 homes sold at a median price of $930k. The median overbid percentage was at 111%, with an average of 31 days on the market.
There were 372 condo and townhome units for sale, providing 5 2 months of inventory There were 93 new listings and 34 units sold at a median sale price of $553k. The median overbid percentage was at 97.9%, with an average of 48 days on the market.
SFH
Single-Family Homes
302 New Listings
175 Sold Listings
2.7 Months of Inventory
$930K Median Sale Price
111%
Median Sale vs List
31 Avg Days on Market
The data, sourced from Broker Metrics, includes all single-family homes, condos and townhomes in the California Area from May 2024 to May 2025. This may include preliminary data, and may vary from the time the data was gathered. All data is deemed reliable but not guaranteed. DRE# 01345026. Copyright KW Advisors Fremont 2025. Each office is independently owned and operated.
93 New Listings 5.2
Months of Inventory
34 Sold Listings
$553K
Median Sale Price 97.9%
Median Sale vs List 48 Avg Days on Market
ct2024
Median SalesPrice
Single-Family Homes
The median sale price has decreased from $1m last May 2024, to $930k as of May 2025
Condos & Townhomes
The median sale price has decreased from $653k last May 2024, to $553k as of May 2025
AVGDays OntheMarket
Single-Family Homes
The average time spent on the market went up from 27 days last May 2024, to 31 days as of May 2025
Condos & Townhomes
The average time spent on the market went up from 43 days in May 2024, to 48 days as of May 2025.
Overbids
Single-Family Homes
The overbid percentage has increased from 110 6% last May 2024, to 111% a year later
Condos & Townhomes
The overbid percentage has decreased from 98.5% last May 2024, to 97.9% a year later.