Jump to Southern/Central Marin Southern/Central Marin
What’syourhome reallyworthin today’smarket?
That's the question you should be asking yourself.
Our market is incredibly diverse and rapidly changing. Values vary not just by neighborhood but by street. Your home isn't necessarily worth what your neighbors' home is. It's the current market that sets the value of your home.
So, do you know what your home is worth in today's market?
Icanhelp...
Contact me for a confidential, no obligation assessment of your home's value.
If you’ve been putting off buying a home because you thought getting approved would be too hard, know this: qualifying for a mortgage is starting to get a bit more achievable, but lending standards are still strong.
Lenders are making it slightly easier for well-qualified buyers to access financing, which is opening more doors for people ready to make a move.
So, if strict requirements were holding you back, this shift could be the opportunity you’ve been waiting for, without repeating the risky lending practices that led to the housing crash back in 2008.
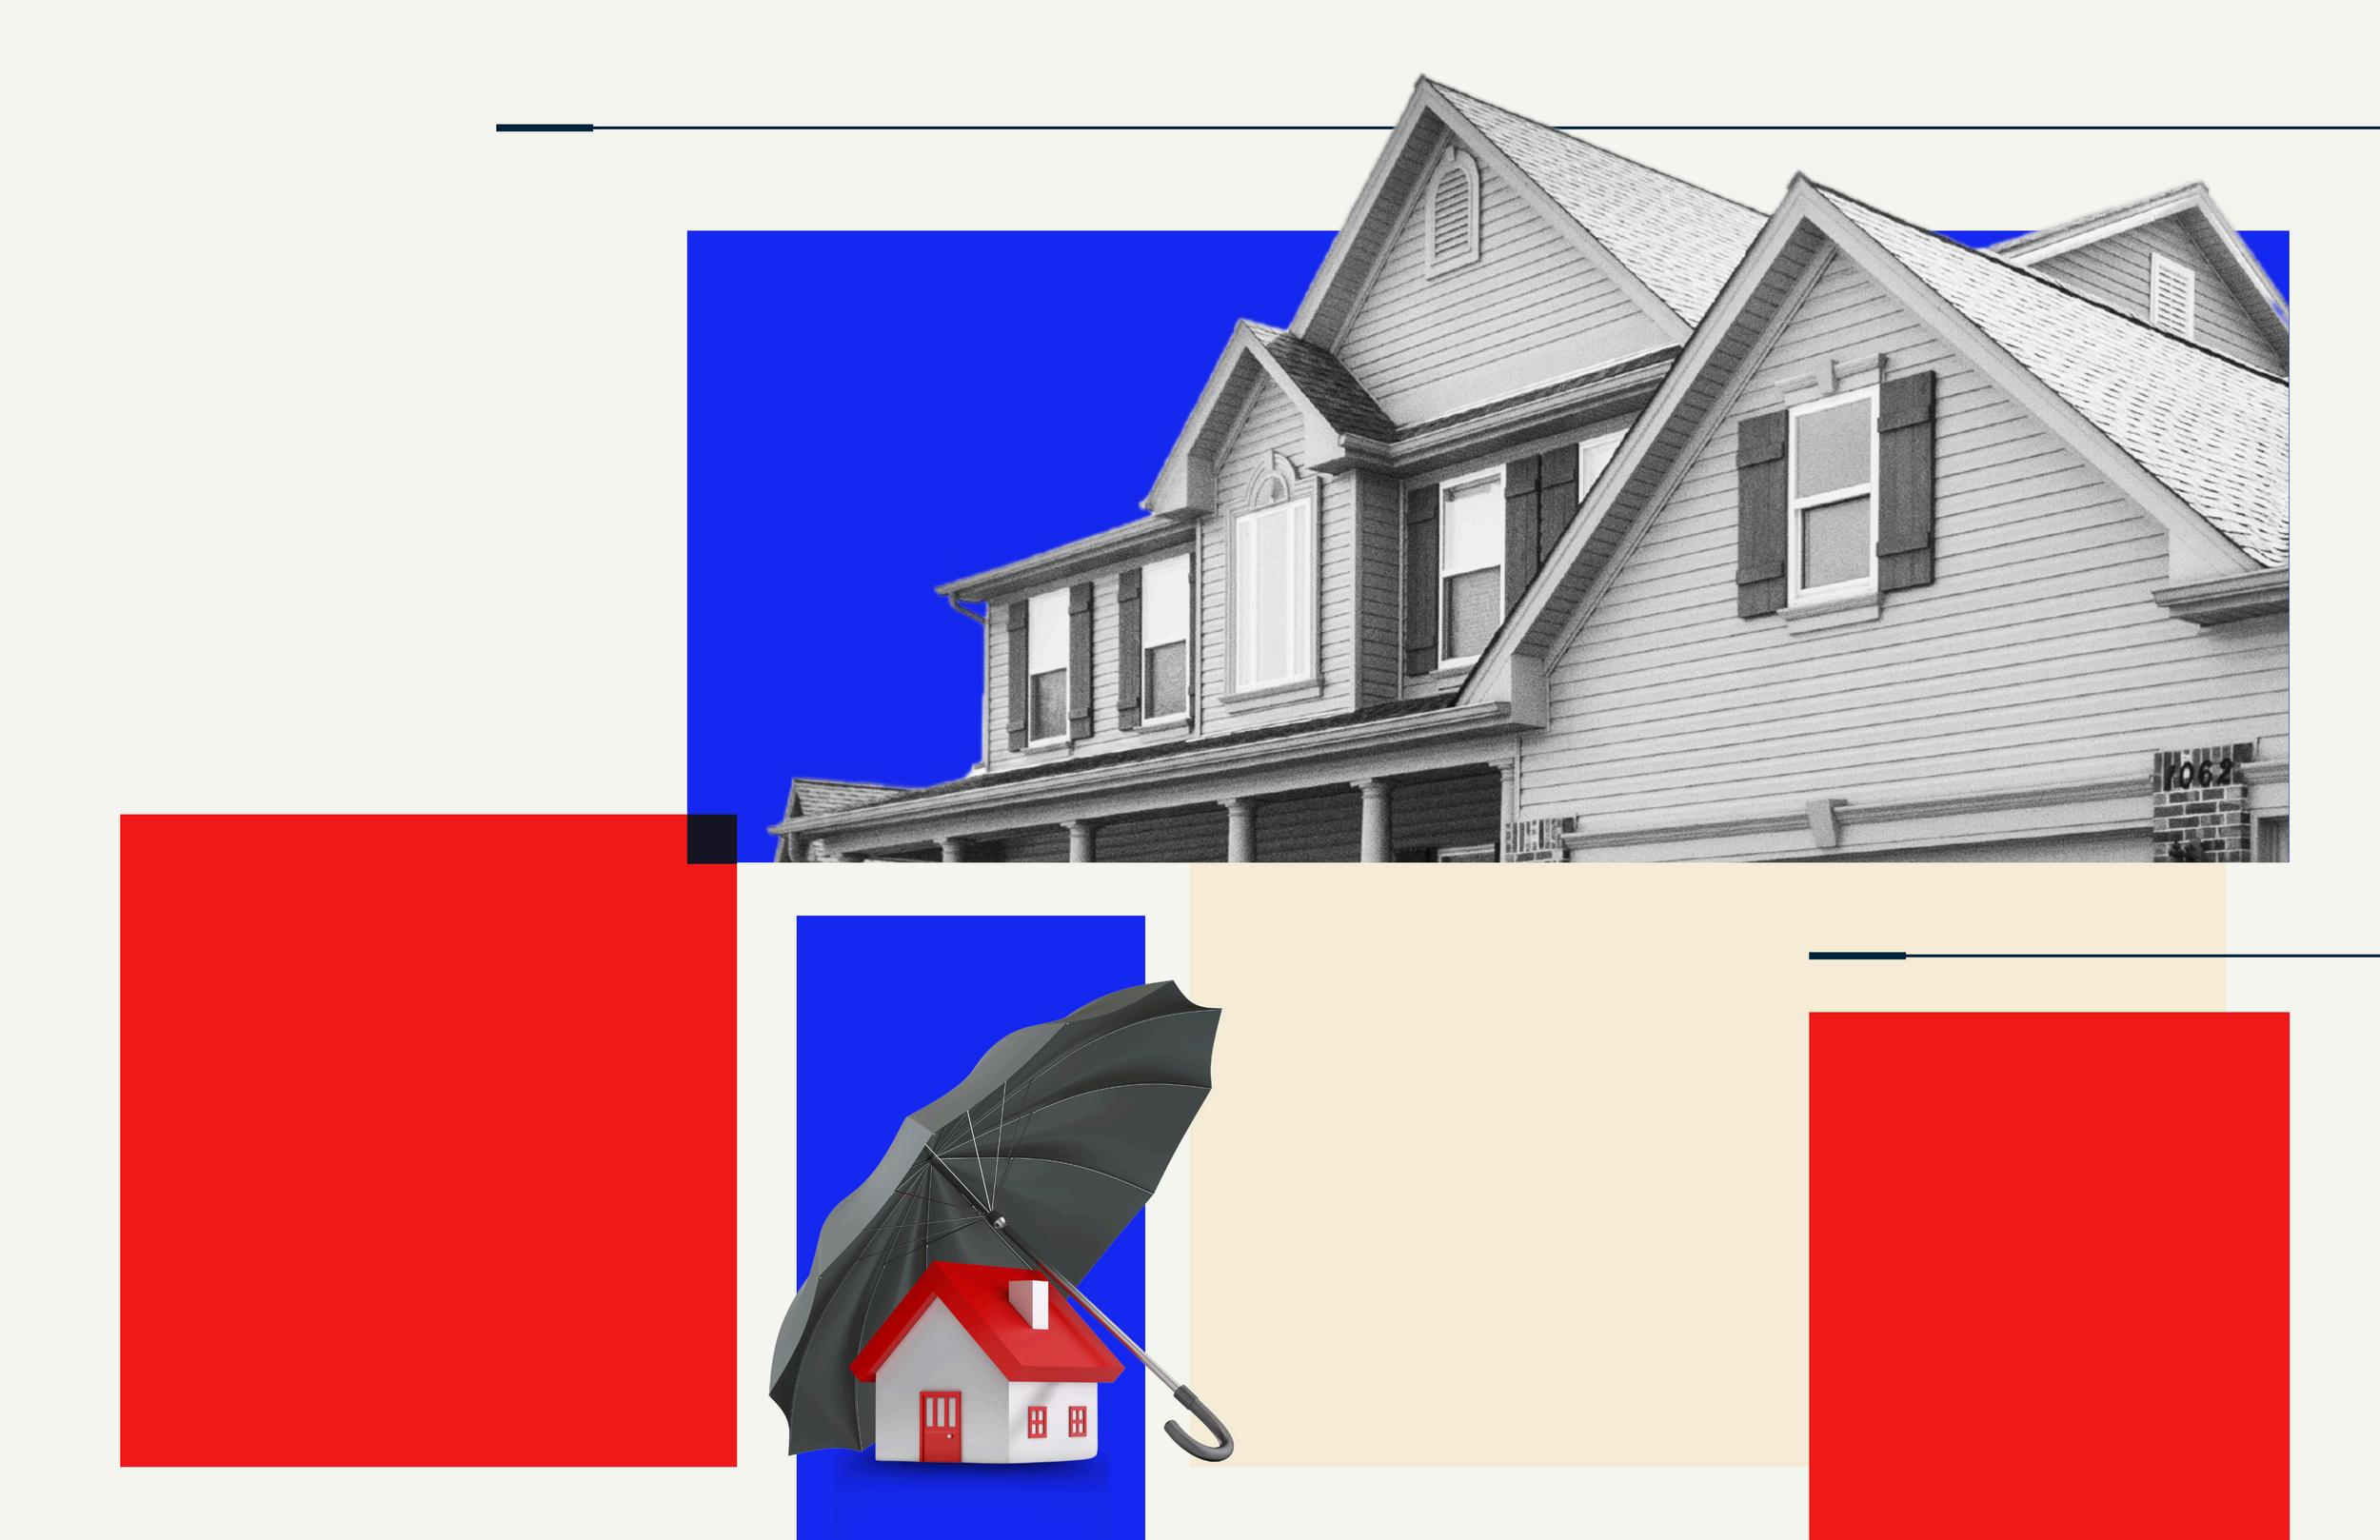
Smart Strategies for a Mortgage Application
Avoid paying off debts or collections without professional advice.
Don't have your credit report pulled too many times - this can hurt your credit score. 3 4 5 6 1 2
Always consult your mortgage professional before making large financial moves. Use verified funds for deposits to prevent closing delays.
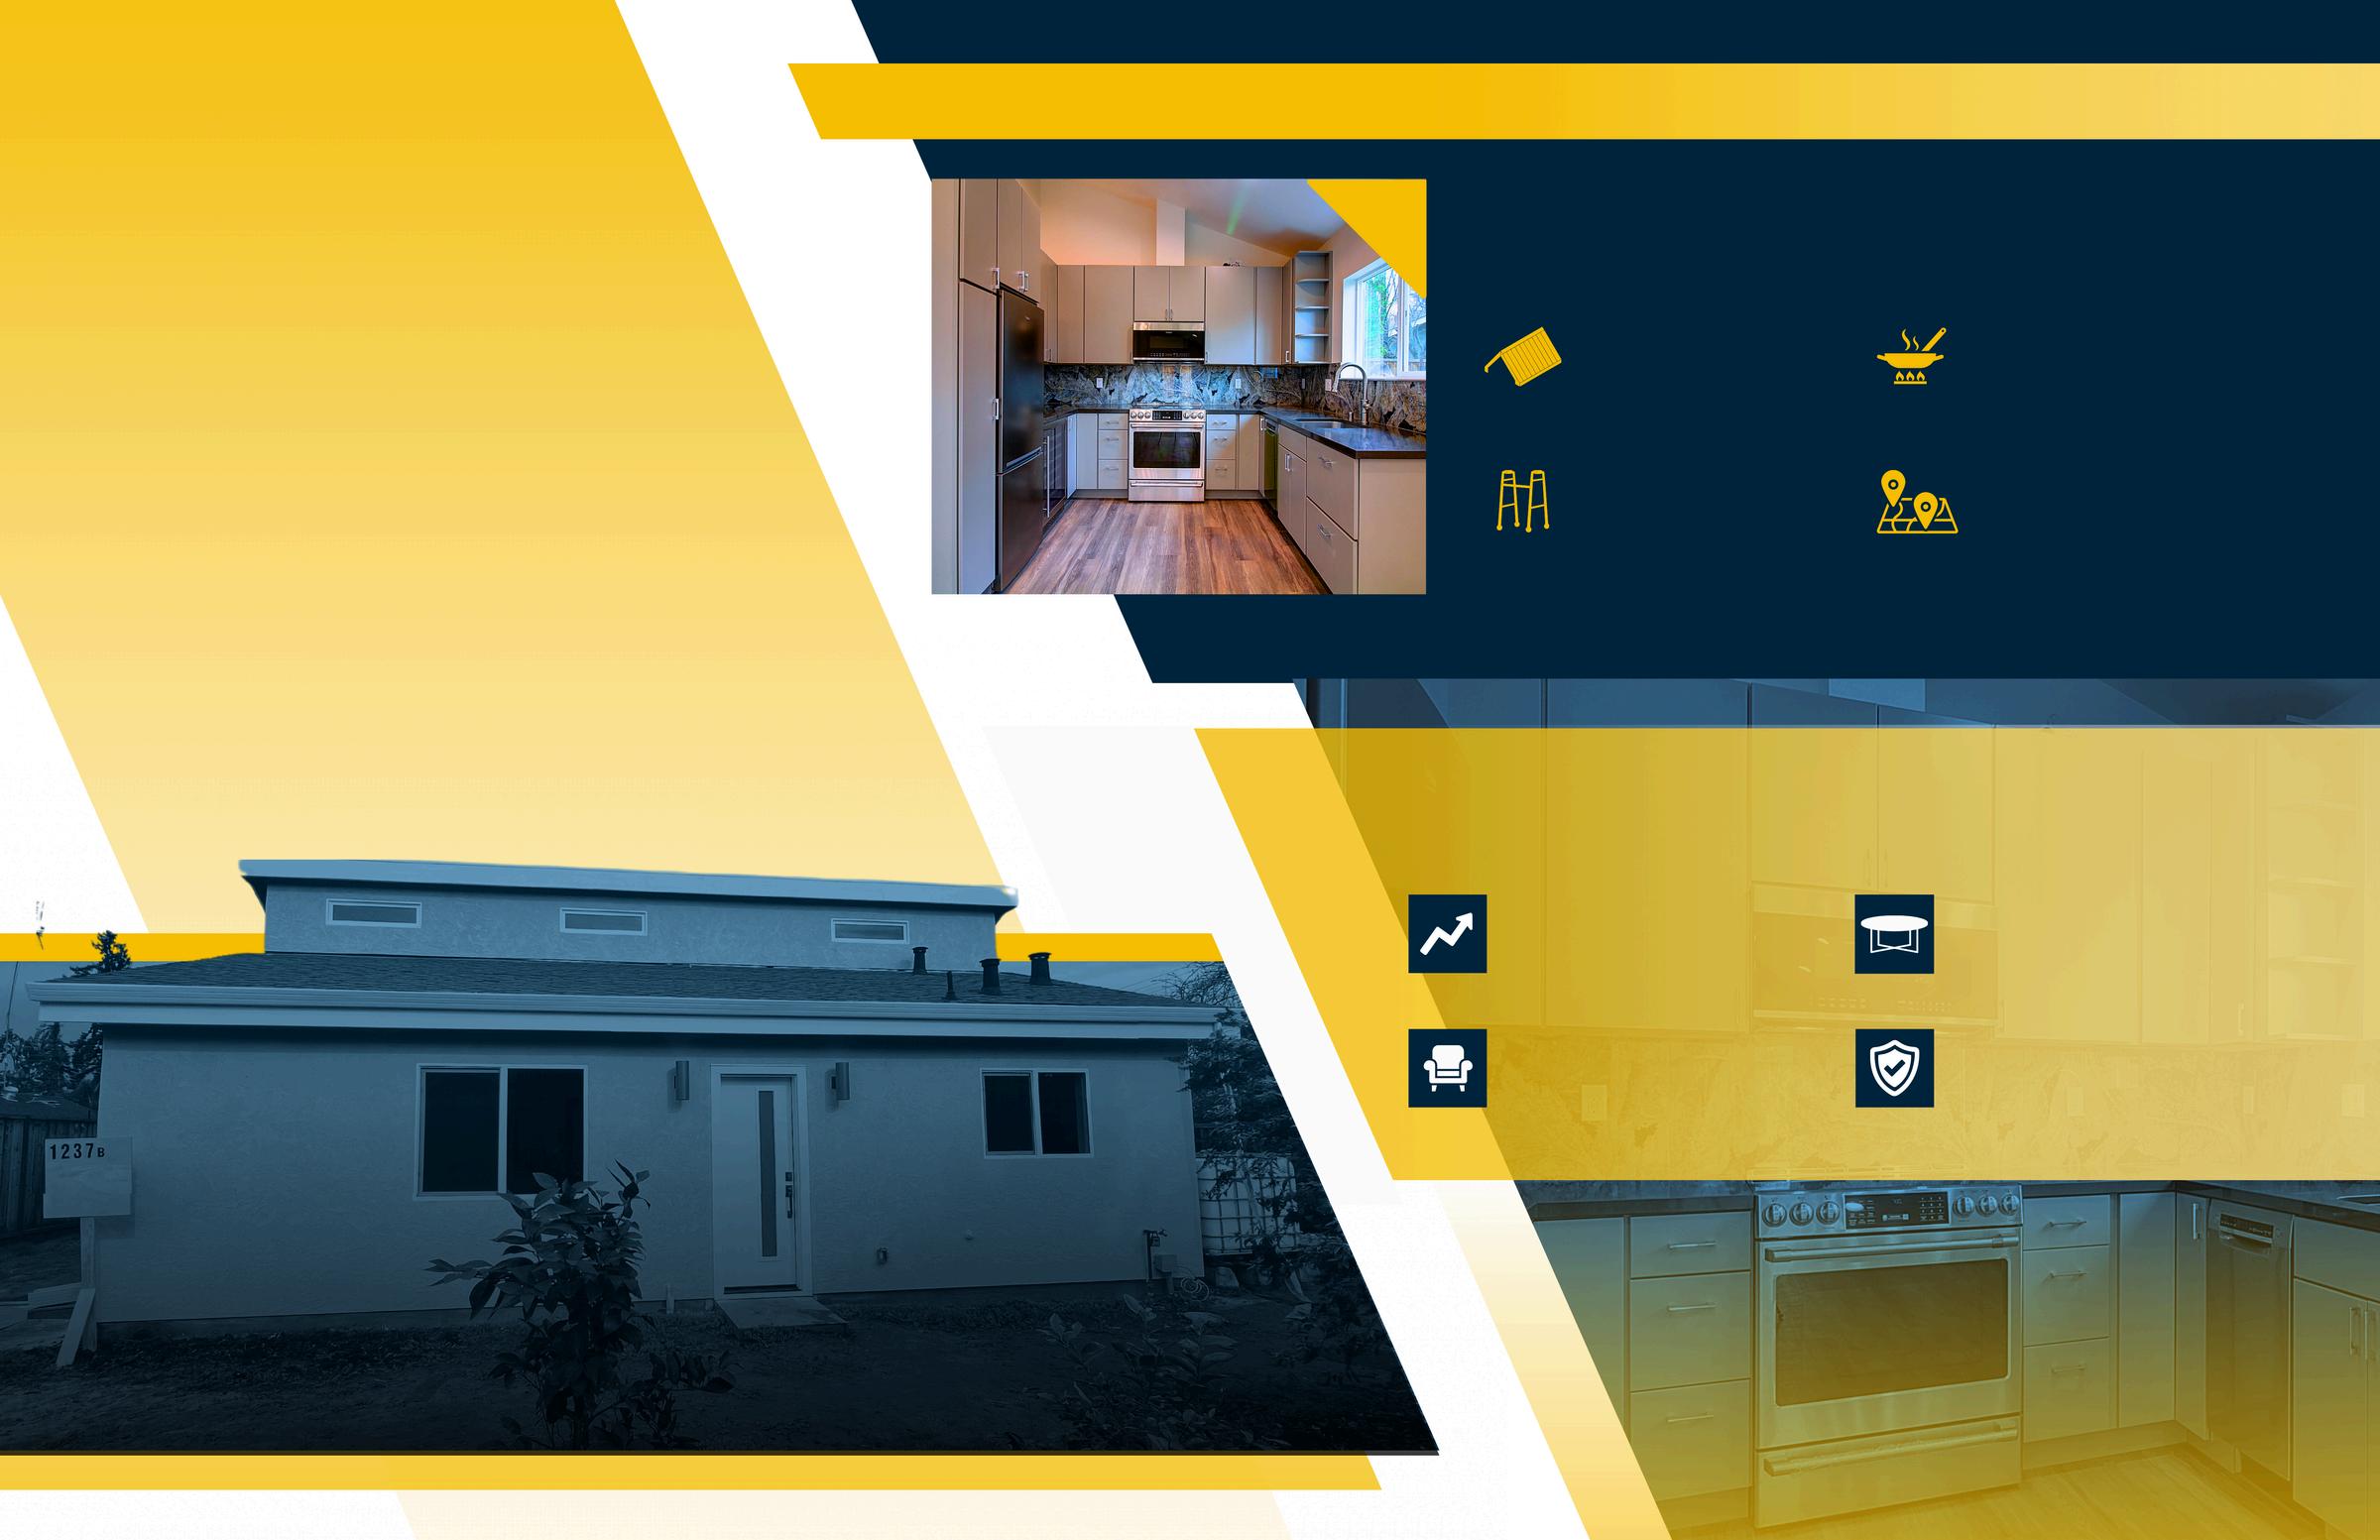
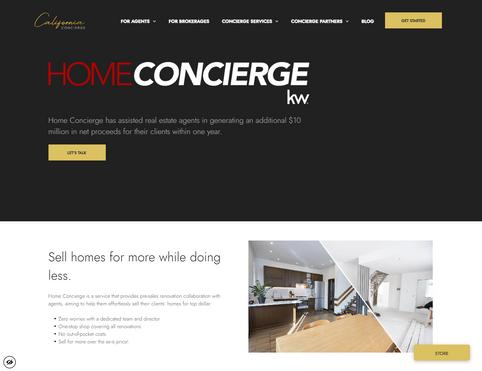
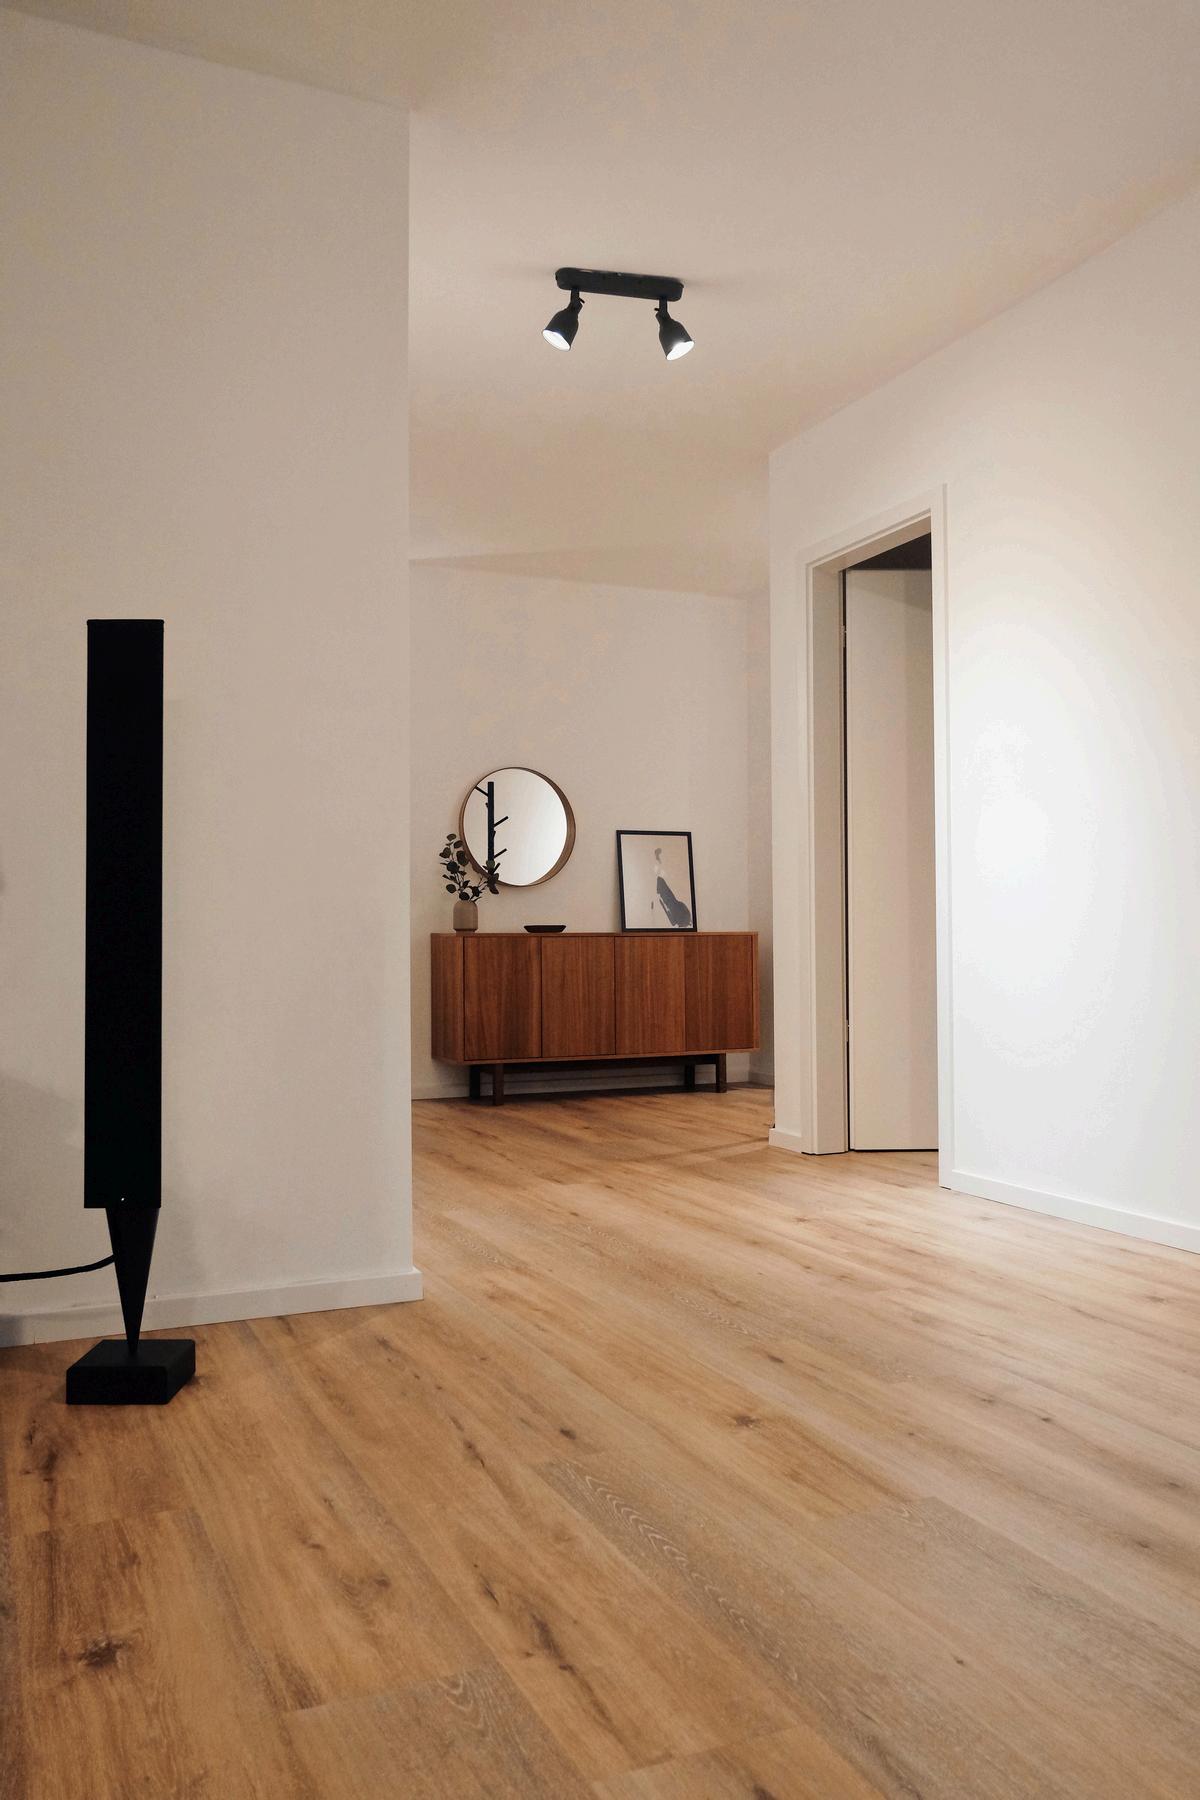
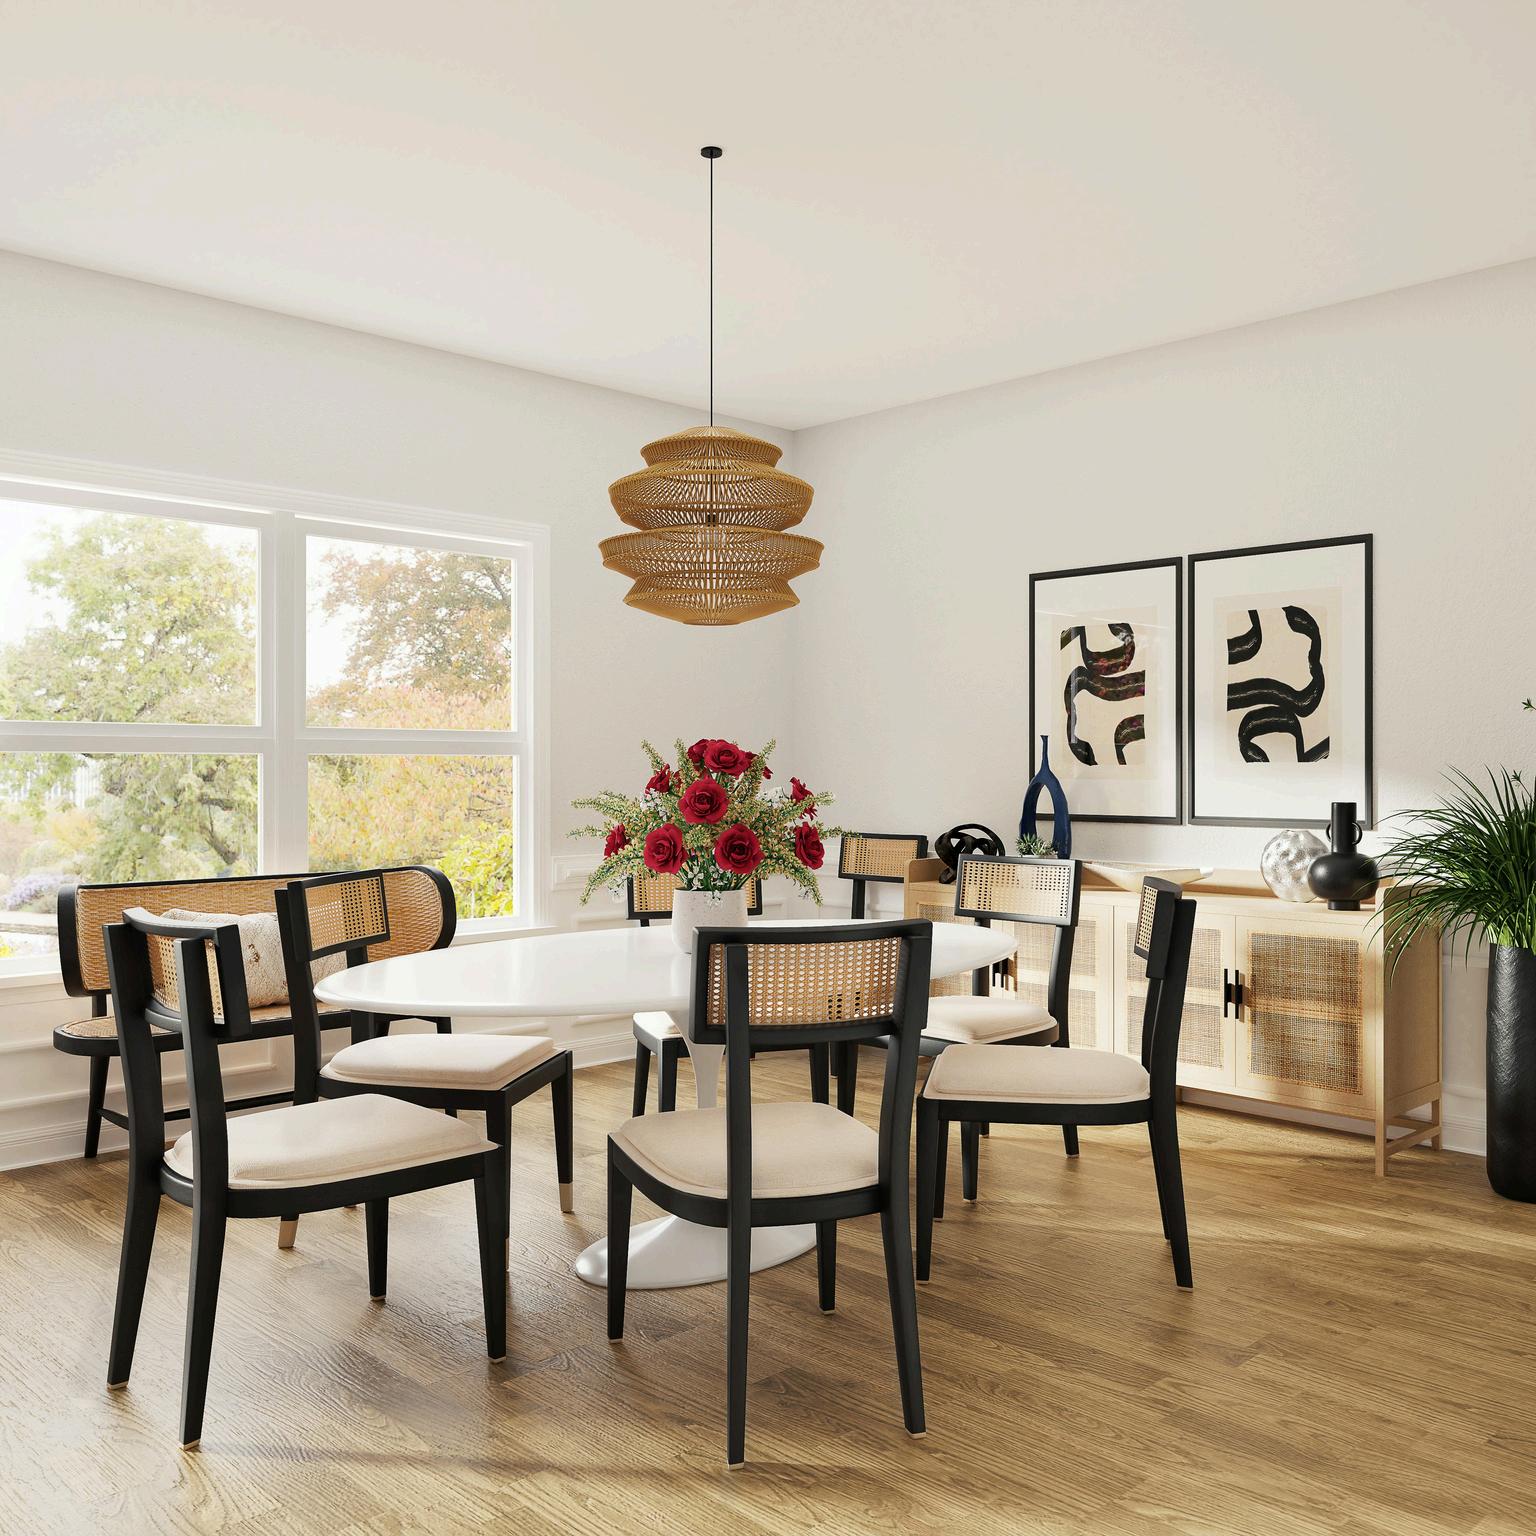
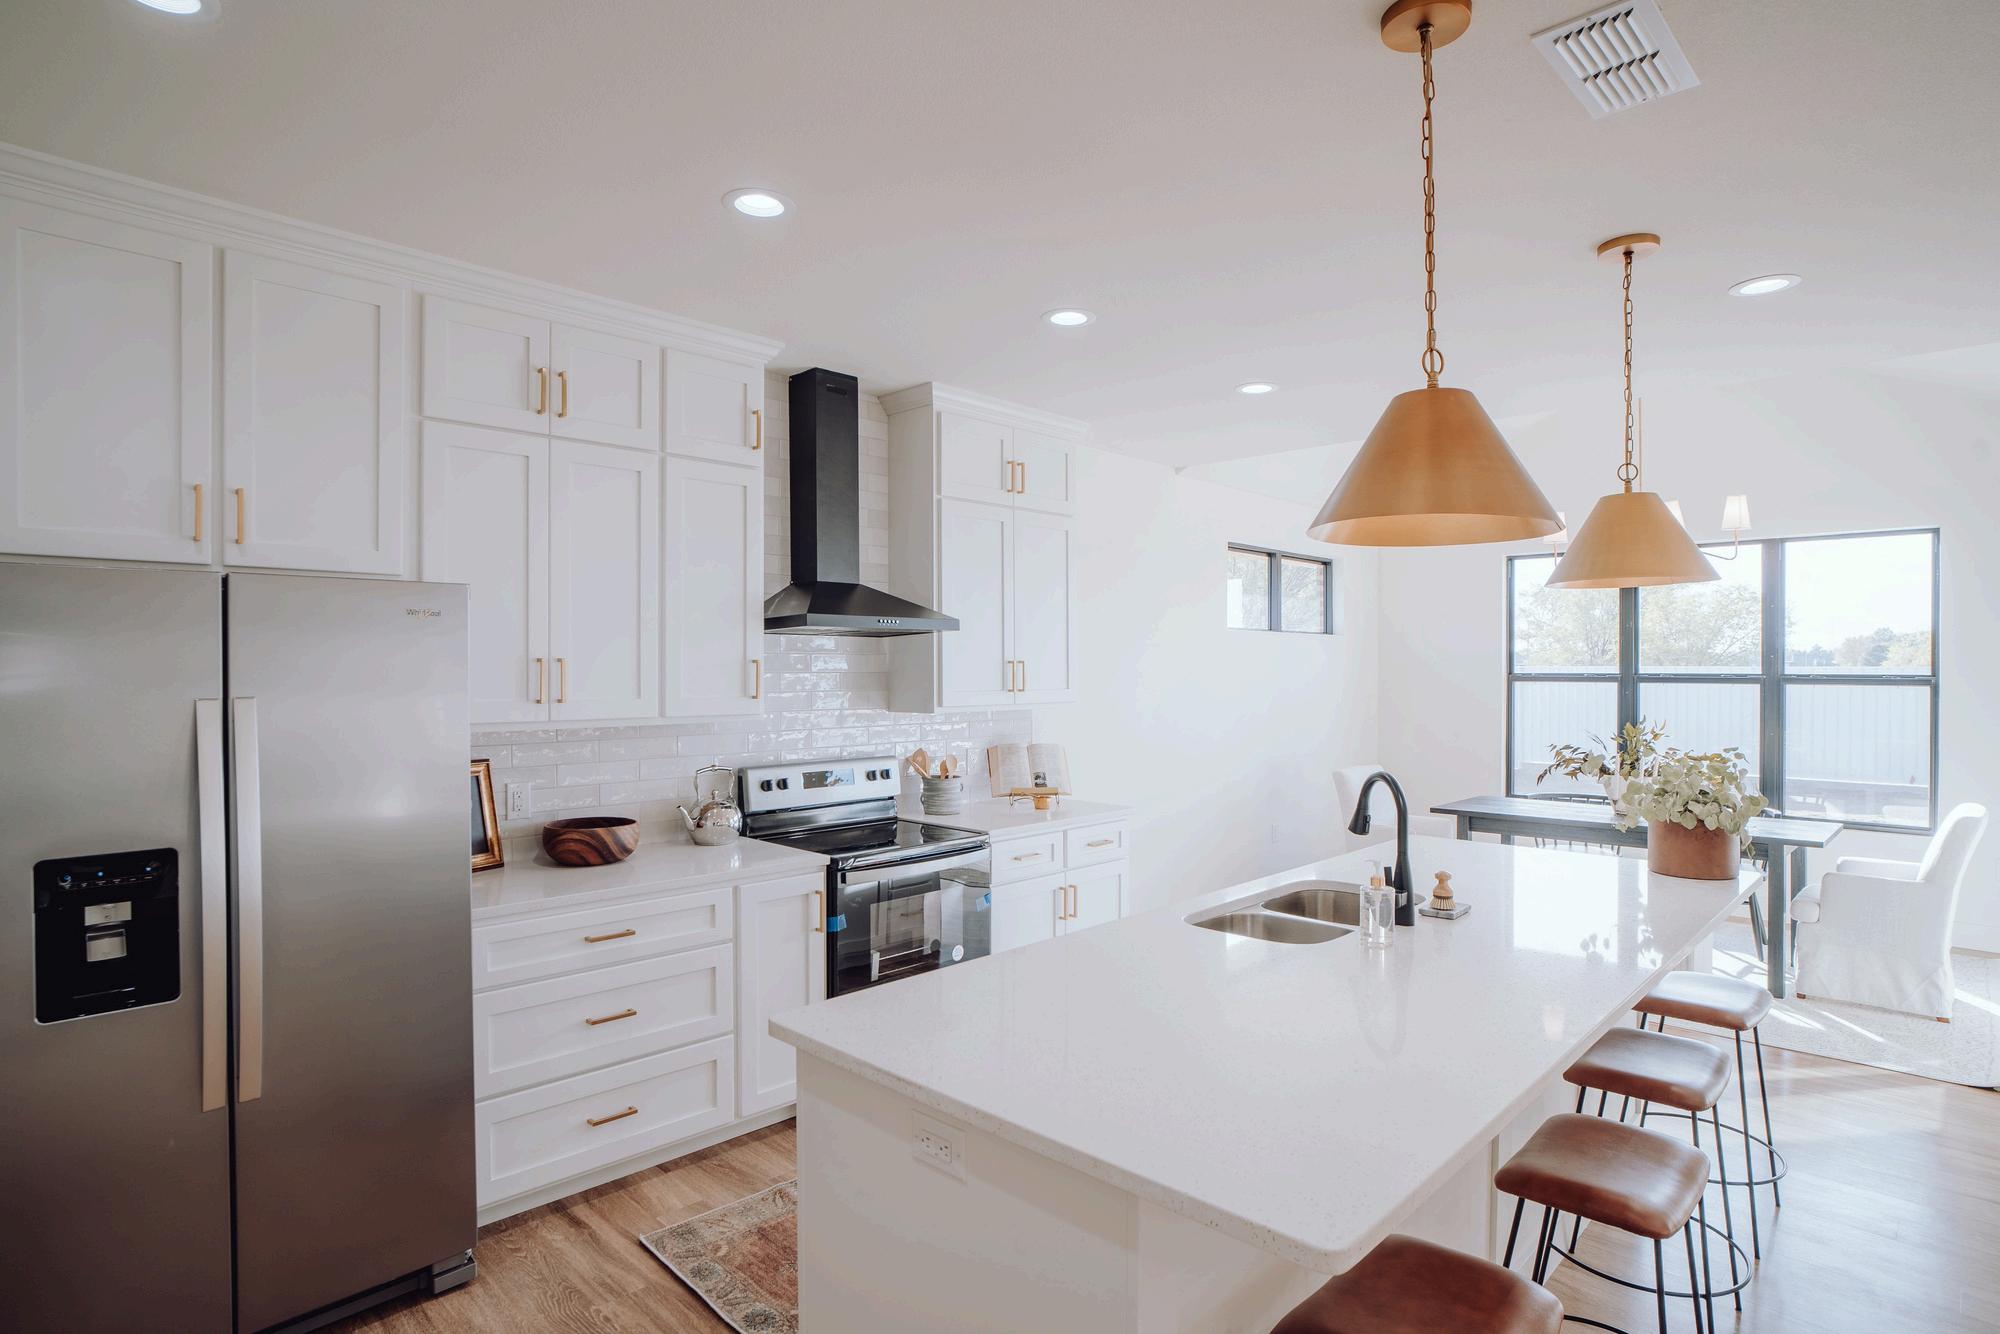
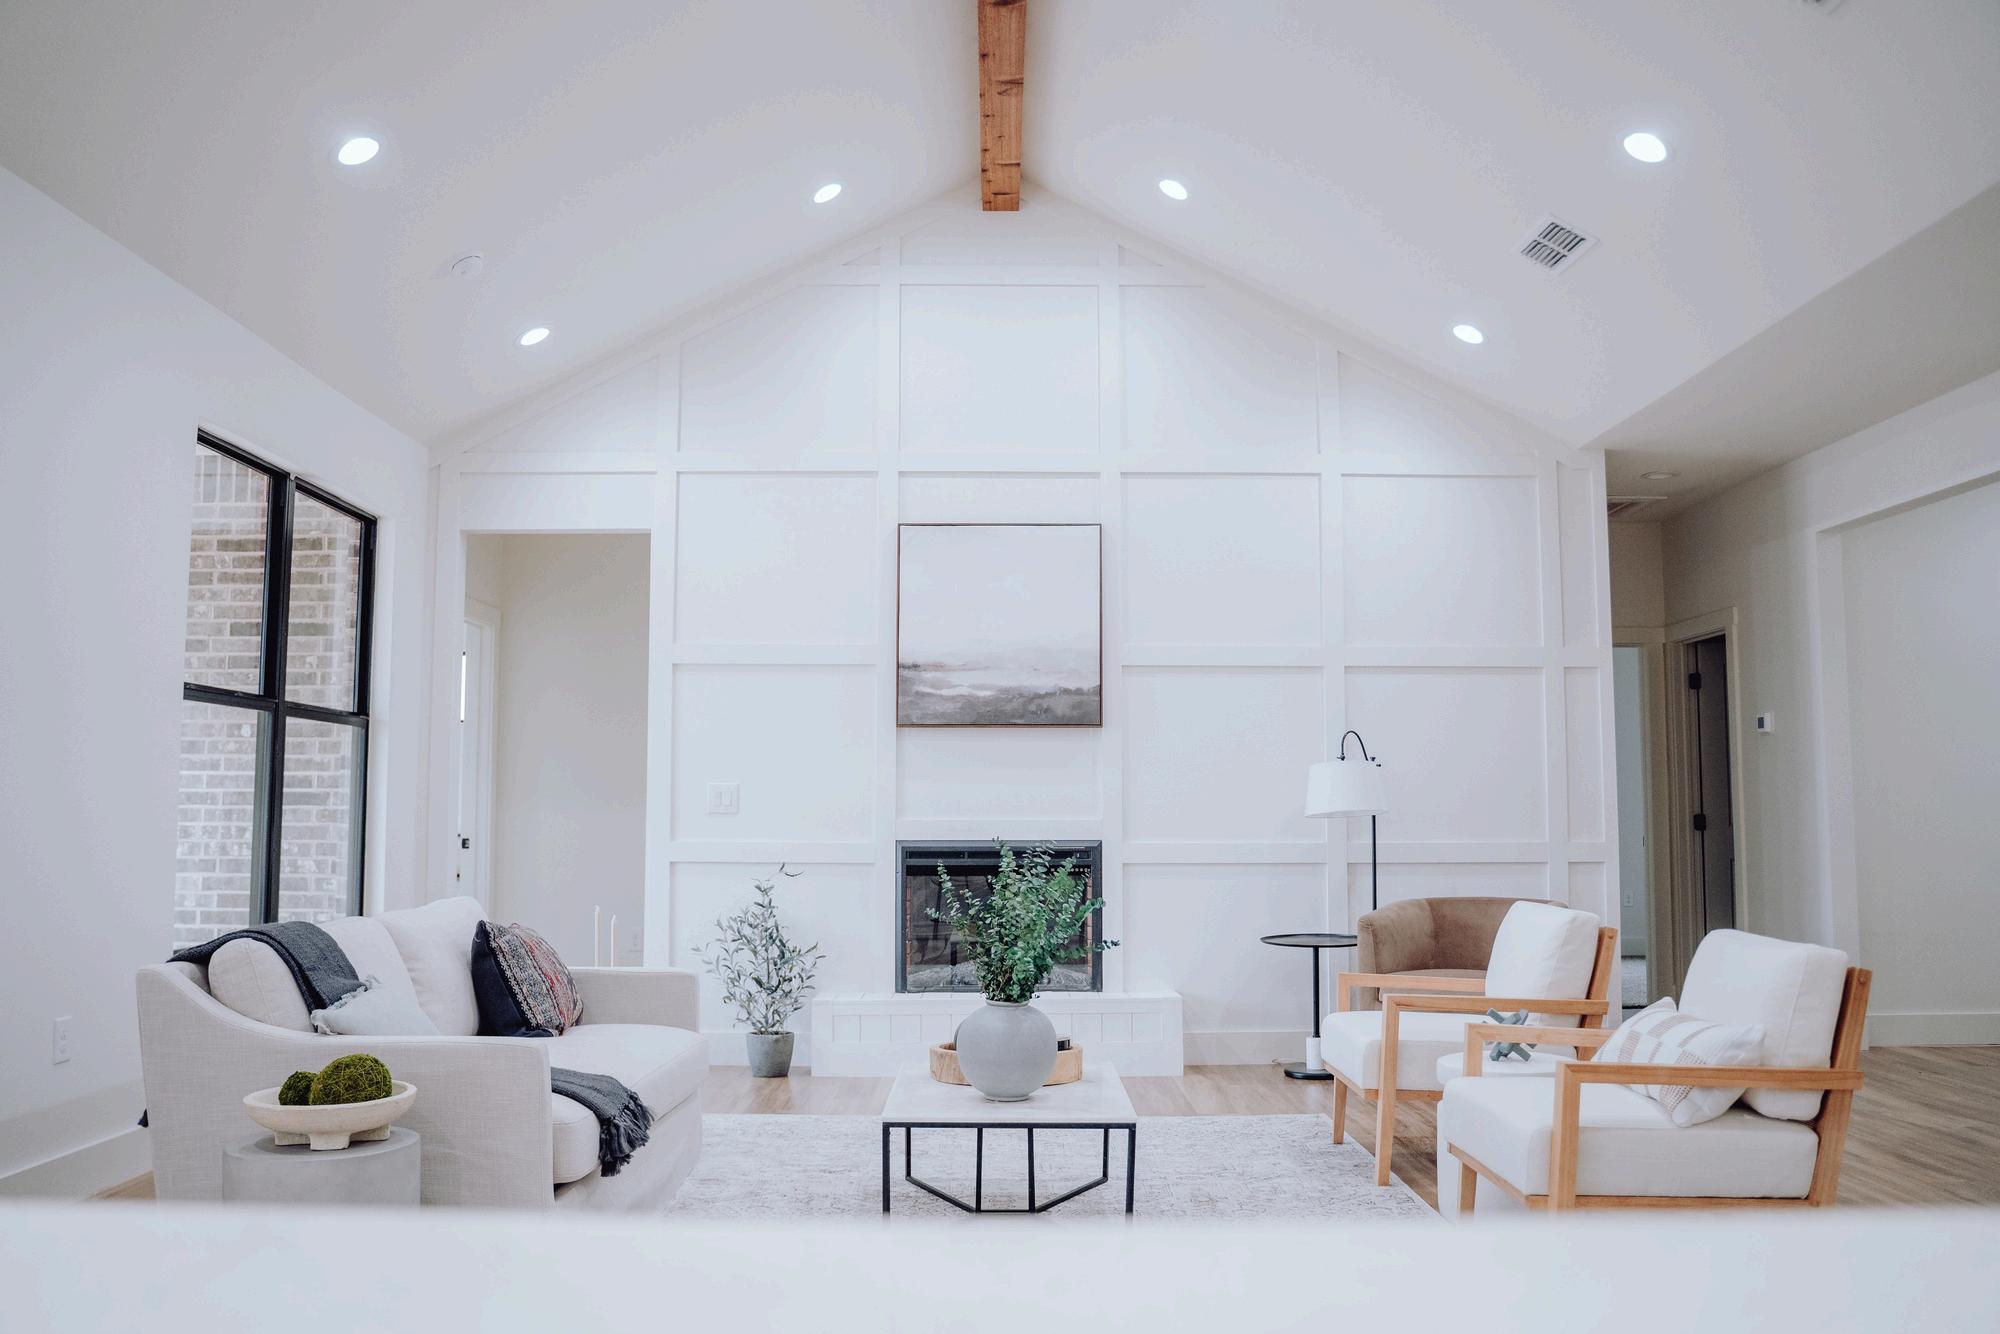
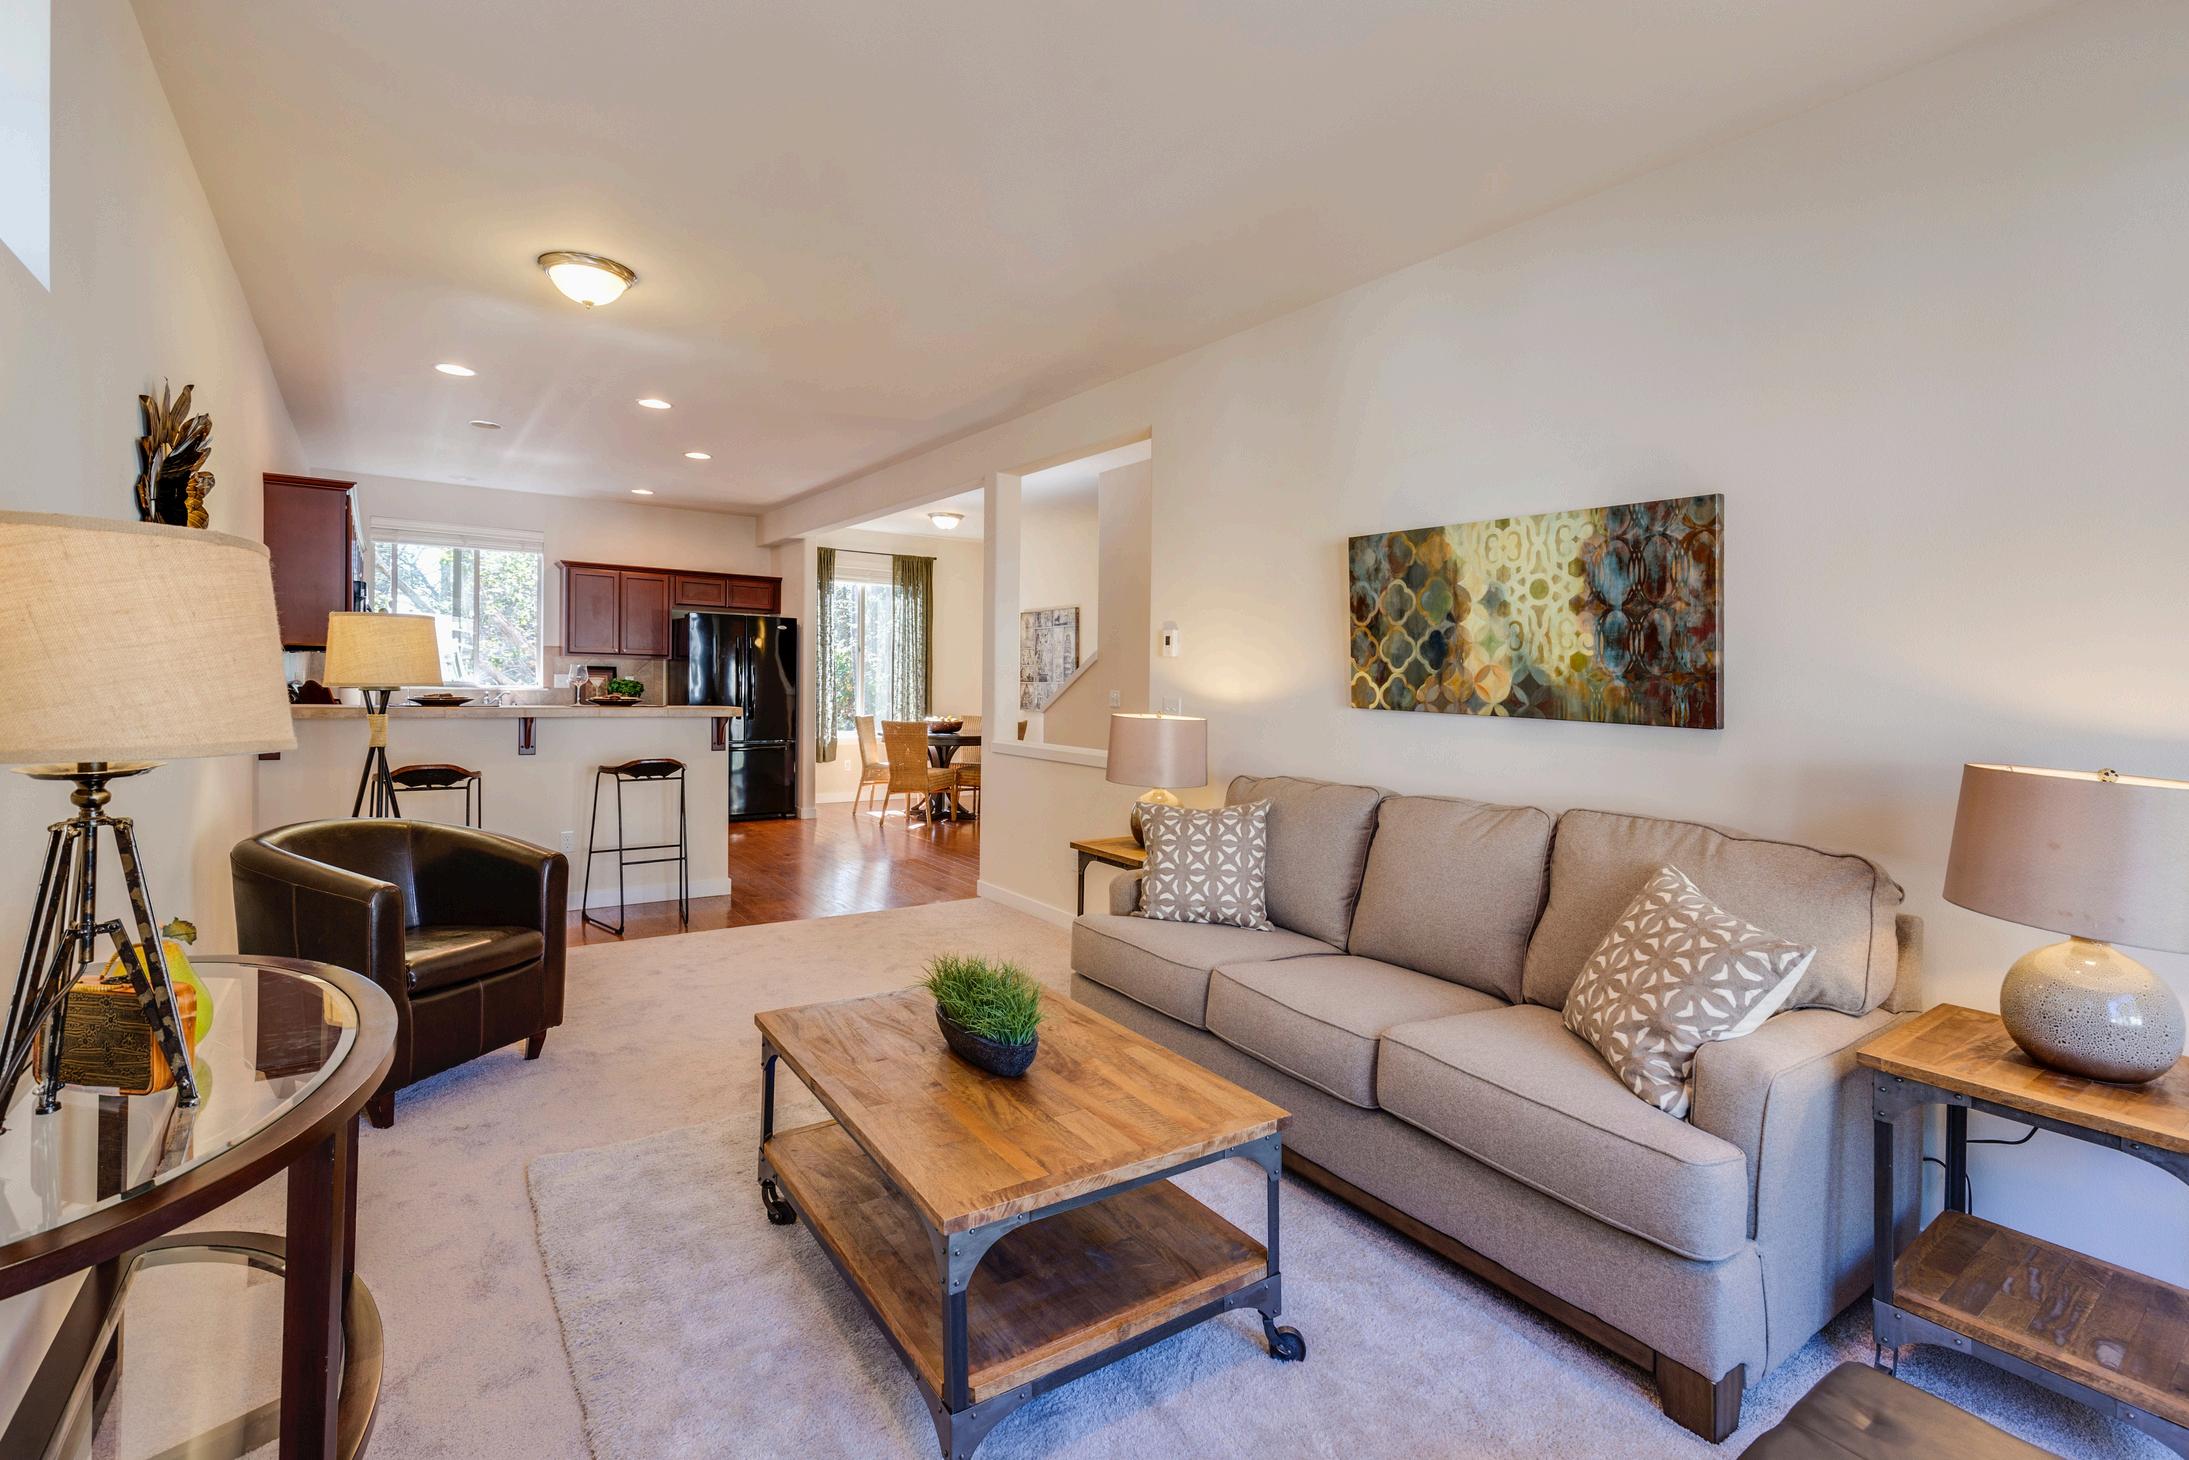
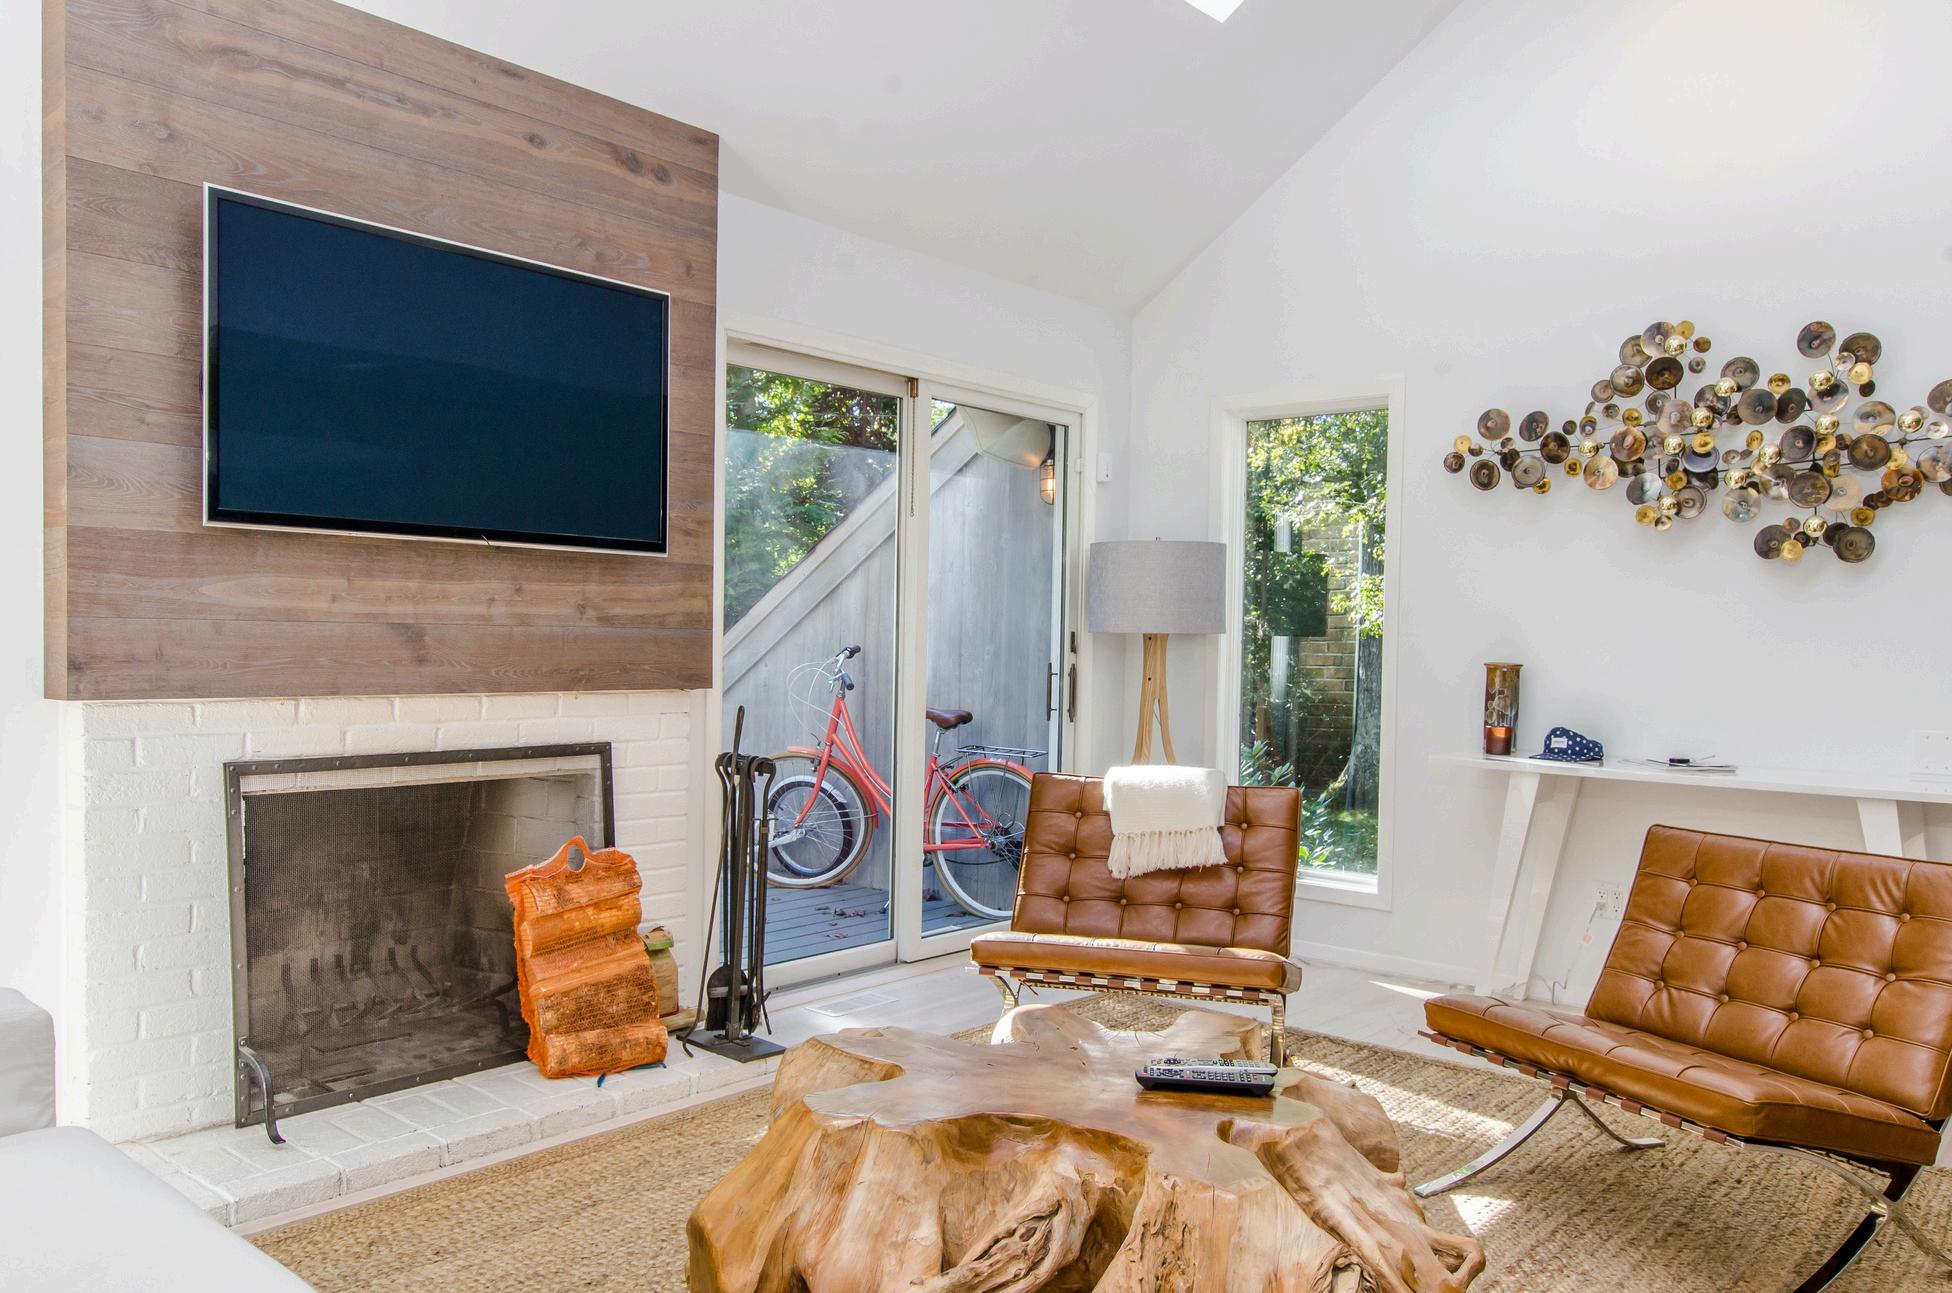
HomeRenovationsThatCanMakea BIG IMPACT AccordingtoExperts
Enhancing Property Value and Family Living Space with an Acton ADU
The Anenberg-Essert family in Campbell collaborated with Acton ADU to create a versatile, comfortable, and valuable addition to their property. This ADU project is a shining example of how a well-designed accessory dwelling unit can increase property value and serve a family’s unique needs.
GoalsandVision
The family envisioned an ADU that would function as an independent living space for family members, enhance their property’s worth, and provide seamless integration with the main home They wanted a space that balanced privacy with connectivity, feeling like a natural extension of their residence
Design and Construction Details
Constructed at 747 square feet, this ADU was designed with modern, high-quality finishes to serve both aesthetic and practical needs. Key features include:
Vaulted Ceilings
Creates a spacious, open atmosphere
Senior-Friendly Living
Safe, independent space for elderly family members
Fully Equipped Kitchen
Modern amenities for everyday convenience
Open Living Area
Multipurpose area for relaxation and entertainment
Results and Impact
The completion of the Anenberg-Essert ADU led to several valuable outcomes:
Increased Property Value
The ADU addition significantly boosted property value
Flexible Living Space
A versatile space for family, guests, or as a rental
Modern Comforts
High-end finishes and amenities enhance both function and style.
Enhanced Family Living
The ADU enriches the AnenbergEssert family’s home with both privacy and connection
VENDOR DIRECTORY
When it comes to home ownership, knowing who you can trust is crucial. That's why we've curated a select list of trusted vendors who are ready to help with your home goals.
Alameda
What's in the Alameda data?
There were 1,149 single-family homes for sale, providing 1.8 months of inventory. There were 757 new listings, and 633 homes sold at a median price of $1.3m. The median overbid percentage was at 106.7%, with an average of 24 days on the market.
There were 676 condo and townhome units for sale, providing 4 3 months of inventory There were 280 new listings and 158 units sold at a median sale price of $650k. The median overbid percentage was at 99.6%, with an average of 40 days on the market.
mily Homes ory
633 Sold Listings
$1.3M Median Sale Price
7% ist
24 Avg Days on Market
InfoSparks, includes all single-family homes, condos and California Area above from June 2024 to June 2025. This may include vary from the time the data was gathered. All data is deemed guaranteed. DRE# 01995149. Copyright KW Advisors San Francisco | Napa Valley 2025. Each office is independently owned and operated.
Condo & Townhomes
280
New Listings
158 Sold Listings
4.3
Months of Inventory
$650K
Median Sale Price 99.6%
Median Sale vs List 40 Avg Days on Market
Alameda
JUNE 2024 - JUNE 2025
Single-Family Homes
Last 12 months, year-over-year.
Condos & Townhomes
Last 12 months, year-over-year
Single-Family Homes
The median sale price has remained the same from $1 3m last June 2024, to $1 3m as of June 2025
Condos & Townhomes
The median sale price has decreased from $790k last June 2024, to $650k as of June 2025
AVGDays OntheMarket
Single-Family Homes
The average time spent on the market went up from 18 days last June 2024, to 24 days as of June 2025
Condos & Townhomes
The average time spent on the market went up from 24 days in June 2024, to 40 days as of June 2025.
Overbids
Single-Family Homes
The overbid percentage has decreased from 109% last June 2024, to 106 7% a year later
Condos & Townhomes
The overbid percentage has decreased from 102.1% last June 2024, to 99.6% a year later.
Contra Costa
What's in the Contra Costa data?
There were 1,792 single-family homes for sale, providing 2.9 months of inventory. There were 1,066 new listings, and 640 homes sold at a median price of $923k. The median overbid percentage was at 100%, with an average of 28 days on the market.
There were 588 condo and townhome units for sale, providing 3.5 months of inventory. There were 286 new listings and 153 units sold at a median sale price of $599k. The median overbid percentage was at 100%, with an average of 32 days on the market
Single-Family Homes
1,066 New Listings
640 Sold Listings
2.9 Months of Inventory
$923K Median Sale Price
100%
Median Sale vs List
28 Avg Days on Market
The data, sourced from InfoSparks, includes all single-family homes, condos and townhomes in the California Area above from June 2024 to June 2025. This may include preliminary data, and may vary from the time the data was gathered. All data is deemed reliable but not guaranteed. DRE# 01995149. Copyright KW Advisors San Francisco | Napa Valley 2025. Each office is independently owned and operated.
286 New Listings
3.5
Months of Inventory $599K Median Sale Price 100%
Median Sale vs List 32 Avg Days on Market 153 Sold Listings
raCosta
JUNE 2024 - JUNE 2025
mes year-over-year.
omes , year-over-year
Median SalesPrice
Single-Family Homes
The median sale price has increased from $903k last June 2024, to $923k as of June 2025
Condos & Townhomes
The median sale price has decreased from $637k last June 2024, to $599k as of June 2025
AVGDays OntheMarket
Single-Family Homes
The average time spent on the market went up from 21 days last June 2024, to 28 days as of June 2025
Condos & Townhomes
The average time spent on the market went up from 30 days in June 2024, to 32 days as of June 2025.
Overbids
Single-Family Homes
The overbid percentage has decreased from 100 8% last June 2024, to 100% a year later
Condos & Townhomes
The overbid percentage has remained the same from 100% last June 2024, to 100% a year later.
Napa County
What's in the Napa County data?
There were 467 single-family homes for sale, providing 6.8 months of inventory. There were 81 new listings, and 50 homes sold at a median price of $1m. The median overbid percentage was at 97 8%, with an average of 66 days on the market
There were 62 condo and townhome units for sale, providing 6.4 months of inventory. There were 14 new listings and 8 units sold at a median sale price of $708k. The median overbid percentage was at 97.3%, with an average of 68 days on the market.
81 New Listings
50 Sold Listings
6.8 Months of Inventory
$1M Median Sale Price
97.8%
Median Sale vs List
66 Avg Days on Market
New Listings 6.4
Months of Inventory $708K Median Sale Price 97.3%
Median Sale vs List 68 Avg Days on Market 8 Sold Listings
NapaCounty
JUNE 2024 - JUNE 2025
Single-Family Homes
Last 12 months, year-over-year.
Condos & Townhomes
Last 12 months, year-over-year
Median SalesPrice
Single-Family Homes
The median sale price has increased from $1 01m last June 2024, to $1 07m as of June 2025
Condos & Townhomes
The median sale price has decreased from $740k last June 2024, to $708k as of June 2025
AVGDays OntheMarket
Single-Family Homes
The average time spent on the market went down from 73 days last June 2024, to 66 days as of June 2025
Condos & Townhomes
The average time spent on the market went down from 100 days in June 2024, to 68 days as of June 2025.
Overbids
Single-Family Homes
The overbid percentage has decreased from 99 2% last June 2024, to 97 8% a year later
Condos & Townhomes
The overbid percentage has decreased from 100% last June 2024, to 97.3% a year later.
San Francisco County
What's in the San Francisco County data?
There were 284 single-family homes for sale, providing 1.5 months of inventory. There were 204 new listings, and 216 homes sold at a median price of $1.7m. The median overbid percentage was at 111.4%, with an average of 21 days on the market.
There were 617 condo and townhome units for sale, providing 3.4 months of inventory. There were 223 new listings and 196 units sold at a median sale price of $1.2m. The median overbid percentage was at 100%, with an average of 50 days on the market.
204 New Listings
mily Homes
216 Sold Listings
1.5 Months of Inventory
$1.7M Median Sale Price
111.4%
Median Sale vs List
21 Avg Days on Market
InfoSparks, includes all single-family homes, condos and California Area above from June 2024 to June 2025. This may include vary from the time the data was gathered. All data is deemed guaranteed. DRE# 01995149. Copyright KW Advisors San Francisco | Napa Valley 2025. Each office is independently owned and operated.
Condo & Townhomes
223
New Listings
196
Sold Listings
3.4
Months of Inventory
$1.2M
Median Sale Price 100%
Median Sale vs List 50 Avg Days on Market
SanFranciscoCounty
JUNE 2024 - JUNE 2025
LISTINGS FOR SALE SOLD LISTINGS
gle-Family Homes
t 12 months, year-over-year.
ndos & Townhomes
t 12 months, year-over-year
Median SalesPrice
Single-Family Homes
The median sale price has increased from $1 6m last June 2024, to $1 7m as of June 2025
Condos & Townhomes
The median sale price has increased from $1m last June 2024, to $1 2m as of June 2025
AVGDays OntheMarket
Single-Family Homes
The average time spent on the market went down from 30 days last June 2024, to 21 days as of June 2025
Condos & Townhomes
The average time spent on the market went up from 43 days in June 2024, to 50 days as of June 2025.
Overbids
Single-Family Homes
The overbid percentage has increased from 110 5% last June 2024, to 111 4% a year later
Condos & Townhomes
The overbid percentage has remained the same from 100% last June 2024, to 100% a year later.
He-Family Homes
412 New Listings
344 Sold Listings
1.8 Months of Inventory
$2M Median Sale Price
102.2%
Median Sale vs List
23 Avg Days on Market
sourced from InfoSparks, includes all single-family homes, condos and in the California Area above from June 2024 to June 2025. This may include data, and may vary from the time the data was gathered. All data is deemed not guaranteed. DRE# 01995149. Copyright KW Advisors San Francisco | Napa Valley 2025. Each office is independently owned and operated.
New Listings
82
Sold Listings
3.4
Months of Inventory
$868K
Median Sale Price 99.3%
Median Sale vs List 45 Avg Days on Market
Median SalesPrice
Single-Family Homes
The median sale price has increased from $1 9m last June 2024, to $2m as of June 2025
Condos & Townhomes
The median sale price has decreased from $1000k last June 2024, to $868k as of June 2025
AVGDays OntheMarket
Single-Family Homes
The average time spent on the market went up from 19 days last June 2024, to 23 days as of June 2025
Condos & Townhomes
The average time spent on the market went up from 29 days in June 2024, to 45 days as of June 2025.
Overbids
Single-Family Homes
The overbid percentage has decreased from 105% last June 2024, to 102 2% a year later
Condos & Townhomes
The overbid percentage has decreased from 100% last June 2024, to 99.3% a year later.
SantaC County
What's in the Sant County data?
There were 1,126 single-fam providing 1.7 months of inve new listings, and 809 homes price of $2.1m. The median o was at 101 2%, with an avera market.
There were 803 condo and to sale, providing 2.8 months of were 455 new listings and 29 median sale price of $947k. T percentage was at 100%, wit days on the market
941 New Listings
1.7 Months of Inventory
101.2%
Median Sale vs List
809 Sold Listings
$2.1M Median Sale Price
19 Avg Days on Market
homes, condos and 2025. This may include gathered. All data is deemed Advisors San Francisco | Napa Valley 2025. Each office is independently owned and operated.
Condo 455
New Listings
294
Sold Listings
2.8
Months of Inventory
$947K
Median Sale Price 100%
Median Sale vs List
27 Avg Days on Market
Median SalesPrice
Single-Family Homes
The median sale price has increased from $1 9m last June 2024, to $2 1m as of June 2025
Condos & Townhomes
The median sale price has decreased from $1m last June 2024, to $947k as of June 2025
AVGDays OntheMarket
Single-Family Homes
The average time spent on the market went up from 15 days last June 2024, to 19 days as of June 2025
Condos & Townhomes
The average time spent on the market went up from 18 days in June 2024, to 27 days as of June 2025.
Overbids
Single-Family Homes
The overbid percentage has decreased from 106% last June 2024, to 101 2% a year later
Condos & Townhomes
The overbid percentage has decreased from 102.7% last June 2024, to 100% a year later.
Solano County
What's in the Solano County
data?
There were 803 single-family homes for sale, providing 2.7 months of inventory. There were 353 new listings, and 274 homes sold at a median price of $573k. The median overbid percentage was at 100%, with an average of 53 days on the market.
There were 92 condo and townhome units for sale, providing 3.5 months of inventory. There were 45 new listings and 24 units sold at a median sale price of $367k. The median overbid percentage was at 99.4%, with an average of 68 days on the market
Single-Family Homes
353 New Listings
274 Sold Listings
2.7 Months of Inventory
$573K
Median Sale Price
100%
Median Sale vs List
53
Avg Days on Market
The data, sourced from InfoSparks, includes all single-family homes, condos and townhomes in the California Area above from June 2024 to June 2025. This may include preliminary data, and may vary from the time the data was gathered. All data is deemed reliable but not guaranteed. DRE# 01995149. Copyright KW Advisors San Francisco | Napa Valley 2025. Each office is independently owned and operated.
45
New Listings
3.5
Sold Listings
Months of Inventory $367K Median Sale Price 99.4%
Median Sale vs List 68 Avg Days on Market 24
Median SalesPrice
Single-Family Homes
The median sale price has decreased from $602k last June 2024, to $573k as of June 2025
Condos & Townhomes
The median sale price has increased from $355k last June 2024, to $367k as of June 2025
AVGDays OntheMarket
Single-Family Homes
The average time spent on the market went up from 37 days last June 2024, to 53 days as of June 2025
Condos & Townhomes
The average time spent on the market went up from 41 days in June 2024, to 68 days as of June 2025.
Overbids
Single-Family Homes
The overbid percentage has remained the same from 100% last June 2024, to 100% a year later
Condos & Townhomes
The overbid percentage has decreased from 100% last June 2024, to 99.4% a year later.
Sonoma County
What's in the Sonoma data?
There were 1,129 single-family homes for sale, providing 3.5 months of inventory. There were 293 new listings, and 363 homes sold at a median price of $849k. The median overbid percentage was at 100%, with an average of 45 days on the market.
There were 148 condo and townhome units for sale, providing 3.7 months of inventory. There were 43 new listings and 42 units sold at a median sale price of $460k. The median overbid percentage was at 100%, with an average of 54 days on the market.
293 New Listings
363 Sold Listings
3.5 Months of Inventory
$849K Median Sale Price
100%
Median Sale vs List
45 Avg Days on Market
Listings
Listings
Median SalesPrice
Single-Family Homes
The median sale price has increased from $828k last June 2024, to $849k as of June 2025
Condos & Townhomes
The median sale price has decreased from $475k last June 2024, to $460k as of June 2025
AVGDays OntheMarket
Single-Family Homes
The average time spent on the market went up from 41 days last June 2024, to 45 days as of June 2025
Condos & Townhomes
The average time spent on the market went up from 46 days in June 2024, to 54 days as of June 2025.
Overbids
Single-Family Homes
The overbid percentage has remained the same from 100% last June 2024, to 100% a year later
Condos & Townhomes
The overbid percentage has remained the same from 100% last June 2024, to 100% a year later.
Southe Centra Marin
What's in the Sout Marin data?
There were 422 single-family providing 2.7 months of inve new listings, and 185 homes price of $1.6m. The median was at 100%, with an averag market.
There were 139 condo and to sale, providing 3.4 months o were 37 new listings and 46 sale price of $897k. The med percentage was at 100%, wit days on the market.
108 New Listings
2.7 Months of Inventory
100%
Median Sale vs List
185 Sold Listings
$1.6M Median Sale Price
33 Avg Days on Market
homes, condos and 2025. This may include gathered. All data is deemed Advisors San Francisco | Napa Valley 2025. Each office is independently owned and operated.
Condo
37
New Listings
3.4
Months of Inventory $897K Median Sale Price
Median Sale vs List 44 Avg Days on Market 46 Sold Listings
Median SalesPrice
Single-Family Homes
The median sale price has decreased from $1 7m last June 2024, to $1 6m as of June 2025
Condos & Townhomes
The median sale price has increased from $745k last June 2024, to $897k as of June 2025
AVGDays OntheMarket
Single-Family Homes
The average time spent on the market went up from 32 days last June 2024, to 33 days as of June 2025
Condos & Townhomes
The average time spent on the market went up from 35 days in June 2024, to 44 days as of June 2025.
Overbids
Single-Family Homes
The overbid percentage has remained the same from 100% last June 2024, to 100% a year later
Condos & Townhomes
The overbid percentage has remained the same from 100% last June 2024, to 100% a year later.