That's the question you should be asking yourself.
Our market is incredibly diverse and rapidly changing. Values vary not just by neighborhood but by street. Your home isn't necessarily worth what your neighbors' home is. It's the current market that sets the value of your home.
So, do you know what your home is worth in today's market?
Icanhelp...
Contact me for a confidential, no obligation assessment of your home's value.
If you’ve been putting off buying a home because you thought getting approved would be too hard, know this: qualifying for a mortgage is starting to get a bit more achievable, but lending standards are still strong.
Lenders are making it slightly easier for well-qualified buyers to access financing, which is opening more doors for people ready to make a move.
So, if strict requirements were holding you back, this shift could be the opportunity you’ve been waiting for, without repeating the risky lending practices that led to the housing crash back in 2008.
ntory
222 Sold Listings
$1.7M Median Sale Price
3% s List
20 Avg Days on Market
from MLS Listings Inc., and Courted.io, includes all single-family townhomes in the California Area above from June 2024 to June include preliminary data and may vary from the time the data was deemed reliable but not guaranteed. DRE# 01906450. Copyright KW Estates | Burlingame | San Mateo 2025. Each office is independently
3.3 Months of Inventory $ M
102.3%
Median Sale vs List Av
Median SalesPrice
Single-Family Homes
The median sale price has increased from $1 6m last June 2024, to $1 7m as of June 2025
Condos & Townhomes
The median sale price has increased from $1m last June 2024, to $1 2m as of June 2025
AVGDays OntheMarket
Single-Family Homes
The average time spent on the market went down from 29 days last June 2024, to 20 days as of June 2025
Condos & Townhomes
The average time spent on the market went up from 42 days in June 2024, to 52 days as of June 2025.
Overbids
Single-Family Homes
The overbid percentage has decreased from 113 7% last June 2024, to 112 3% a year later
Condos & Townhomes
The overbid percentage has increased from 100.6% last June 2024, to 102.3% a year later.
SanMateo County
What's in the San Mateo County data?
There were 686 single-family homes for sale, providing 1.9 months of inventory. There were 462 new listings, and 361 homes sold at a median price of $2m. The median overbid percentage was at 103 4%, with an average of 22 days on the market.
There were 358 condo and townhome units for sale, providing 4.1 months of inventory. There were 161 new listings and 87 units sold at a median sale price of $850k. The median overbid percentage was at 99.1%, with an average of 43 days on the market
SFH
Single-Family Homes
462 New Listings
361 Sold Listings
1.9 Months of Inventory
$2M Median Sale Price
103.4% Median Sale vs List
22 Avg Days on Market
The data, sourced from MLS Listings Inc., and Courted.io, includes all single-family homes, condos, and townhomes in the California Area above from June 2024 to June 2025. This may include preliminary data and may vary from the time the data was gathered. All data is deemed reliable but not guaranteed. DRE# 01906450. Copyright KW Advisors Peninsula Estates | Burlingame | San Mateo 2025. Each office is independently owned and operated.
161
New Listings
87
Sold Listings
4.1
Months of Inventory
$850K
Median Sale Price 99.1%
Median Sale vs List 43 Avg Days on Market
SanMateoCounty
JUNE 2024 - JUNE 2025
LISTINGS FOR SALE SOLD LISTINGS
Single-Family Homes
Last 12 months, year-over-year.
Condos & Townhomes
Last 12 months, year-over-year
Median SalesPrice
Single-Family Homes
The median sale price has increased from $1 9m last June 2024, to $2m as of June 2025
Condos & Townhomes
The median sale price has decreased from $1m last June 2024, to $850k as of June 2025
AVGDays OntheMarket
Single-Family Homes
The average time spent on the market went up from 19 days last June 2024, to 22 days as of June 2025
Condos & Townhomes
The average time spent on the market went up from 30 days in June 2024, to 43 days as of June 2025.
Overbids
Single-Family Homes
The overbid percentage has decreased from 107 2% last June 2024, to 103 4% a year later
Condos & Townhomes
The overbid percentage has decreased from 101.3% last June 2024, to 99.1% a year later.
SantaClara County
What's in the Santa Clara County data?
There were 1,259 single-family homes for sa providing 1.9 months of inventory. There we new listings, and 647 homes sold at a media price of $2.1m. The median overbid percent was at 103.8%, with an average of 20 days o market.
There were 847 condo and townhome units sale, providing 3.7 months of inventory. The were 393 new listings and 229 units sold at median sale price of $990k. The median ove percentage was at 101.5%, with an average days on the market.
e-Family Homes
4 ngs
647 Sold Listings
9 f Inventory
$2.1M Median Sale Price
3.8% ale vs List
20 Avg Days on Market
sourced from MLS Listings Inc., and Courted.io, includes all single-family condos, and townhomes in the California Area above from June 2024 to June may include preliminary data and may vary from the time the data was data is deemed reliable but not guaranteed. DRE# 01906450. Copyright KW Peninsula Estates | Burlingame | San Mateo 2025. Each office is independently owned and operated.
Condo & To
393
New Listings
3.7 Months of Inventory $ M 101.5%
Median Sale vs List Av
SantaClaraCounty
JUNE 2024 - JUNE 2025
LISTINGS FOR SALE SOLD LISTINGS
ingle-Family Homes ast 12 months, year-over-year.
ondos & Townhomes ast 12 months, year-over-year
Median SalesPrice
Single-Family Homes
The median sale price has increased from $1 9m last June 2024, to $2 1m as of June 2025
Condos & Townhomes
The median sale price has decreased from $1m last June 2024, to $990k as of June 2025
AVGDays OntheMarket
Single-Family Homes
The average time spent on the market went down from 28 days last June 2024, to 20 days as of June 2025
Condos & Townhomes
The average time spent on the market went down from 36 days in June 2024, to 30 days as of June 2025.
Overbids
Single-Family Homes
The overbid percentage has decreased from 107 1% last June 2024, to 103 8% a year later
Condos & Townhomes
The overbid percentage has decreased from 104.3% last June 2024, to 101.5% a year later.
Atherton
What's in the Atherton data?
There were 16 single-family homes for sale, providing 2.3 months of inventory. There we new listings, and 7 homes sold at a median of $13.7m. The median overbid percentage 95.8%, with an average of 40 days on the ma
There was no data for condo and townhouse for this month.
ngs
7 Sold Listings
3 f Inventory
$13.7M Median Sale Price
.8% ale vs List
40 Avg Days on Market
sourced from MLS Listings Inc., and Courted.io, includes all single-family condos, and townhomes in the California Area above from June 2024 to June may include preliminary data and may vary from the time the data was data is deemed reliable but not guaranteed. DRE# 01906450. Copyright KW Peninsula Estates | Burlingame | San Mateo 2025. Each office is independently owned and operated.
COND
Condo & Townh
No data available for June 2025.
JUNE 2024 - JUNE 2025 GS FOR SALE
mily Homes onths, year-over-year.
No data available
Townhomes onths, year-over-year
Median SalesPrice
Single-Family Homes
The median sale price has increased from $10 1m last June 2024, to $13 7m as of June 2025
Condos & Townhomes
No data for this month
AVGDays OntheMarket
Single-Family Homes
The average time spent on the market went down from 102 days last June 2024, to 40 days as of June 2025
Condos & Townhomes
No data for this month
Overbids
Single-Family Homes
The overbid percentage has decreased from 98 3% last June 2024, to 95 8% a year later
Condos & Townhomes
No data for this month
Wh Ther prov new of $1 95.3 Ther prov new price at 0%
ntory
4 Sold Listings
$1.3M Median Sale Price
% List
58 Avg Days on Market
from MLS Listings Inc., and Courted.io, includes all single-family townhomes in the California Area above from June 2024 to June include preliminary data and may vary from the time the data was deemed reliable but not guaranteed. DRE# 01906450. Copyright KW Estates | Burlingame | San Mateo 2025. Each office is independently
Condo
New Listings
Months of Inventory
Median Sale vs List
Median SalesPrice
Single-Family Homes
The median sale price has increased from $1 345m last June 2024, to $1 348m as of June 2025
Condos & Townhomes
The median sale price has remained the same from $0 last June 2024, to $0 as of June 2025
AVGDays OntheMarket
Single-Family Homes
The average time spent on the market went up from 23 days last June 2024, to 58 days as of June 2025
Condos & Townhomes
The average time spent on the market remained the same from 0 days in June 2024, to 0 days as of June 2025.
Overbids
Single-Family Homes
The overbid percentage has decreased from 113 4% last June 2024, to 95 3% a year later
Condos & Townhomes
The overbid percentage has remained the same from 0% last June 2024, to 0% a year later.
ntory
0 Sold Listings
$0 Median Sale Price List
0 Avg Days on Market
MLS Listings Inc., and Courted.io, includes all single-family townhomes in the California Area above from June 2024 to June preliminary data and may vary from the time the data was deemed reliable but not guaranteed. DRE# 01906450. Copyright KW Estates | Burlingame | San Mateo 2025. Each office is independently
C Condo
No data available for June 2025.
No data available.
Median SalesPrice
Single-Family Homes
The median sale price has remained the same from $0 last June 2024, to $0 as of June 2025
Condos & Townhomes
No data for this month
AVGDays OntheMarket
Single-Family Homes
The average time spent on the market remained the same from 0 days last June 2024, to 0 days as of June 2025
Condos & Townhomes
No data for this month
Overbids
Single-Family Homes
The overbid percentage has remained the same from 0% last June 2024, to 0% a year later ter
Condos & Townhomes
No data for this month
Belmont
What's in the Belmont data?
There were 15 single-family homes for sale, providing 0.8 months of inventory. There were 17 new listings, and 19 homes sold at a median price of $2.3m. The median overbid percentage was at 107.1%, with an average of 18 days on the market.
There were 7 condo and townhome units for sale, providing 3.5 months of inventory. There were 3 new listings and 2 units sold at a median sale price of $1.1m. The median overbid percentage was at 101.8%, with an average of 38 days on the market.
SFH
Single-Family Homes
17 New Listings
19 Sold Listings
0.8 Months of Inventory
$2.3M Median Sale Price
107.1% Median Sale vs List
18 Avg Days on Market
The data, sourced from MLS Listings Inc., and Courted.io, includes all single-family homes, condos, and townhomes in the California Area above from June 2024 to June 2025. This may include preliminary data and may vary from the time the data was gathered. All data is deemed reliable but not guaranteed. DRE# 01906450. Copyright KW Advisors Peninsula Estates | Burlingame | San Mateo 2025. Each office is independently owned and operated.
3
New Listings
2
Sold Listings
3.5
Months of Inventory
$1.1M
Median Sale Price
101.8%
Median Sale vs List
38 Avg Days on Market
JUNE 2024 - JUNE 2025
amily Homes months, year-over-year.
& Townhomes months, year-over-year
Median SalesPrice
Single-Family Homes
The median sale price has decreased from $2 5m last June 2024, to $2 3m as of June 2025
Condos & Townhomes
The median sale price has decreased from $1 7m last June 2024, to $1 1m as of June 2025
AVGDays OntheMarket
Single-Family Homes
The average time spent on the market went up from 9 days last June 2024, to 18 days as of June 2025
Condos & Townhomes
The average time spent on the market went up from 21 days in June 2024, to 38 days as of June 2025.
Overbids
Single-Family Homes
The overbid percentage has decreased from 111 4% last June 2024, to 107 1% a year later
Condos & Townhomes
The overbid percentage has increased from 101.4% last June 2024, to 101.8% a year later.
Burlingame
What's in the Burlingame data?
There were 23 single-family homes for sale, providing 1.8 months of inventory. There were 23 new listings, and 13 homes sold at a median price of $2.9m. The median overbid percentage was at 106.7%, with an average of 15 days on the market.
There were 18 condo and townhome units for sale, providing 4.5 months of inventory. There were 8 new listings and 4 units sold at a median sale price of $1.3m. The median overbid percentage was at 97.6%, with an average of 17 days on the market.
SFH
Single-Family Homes
23 New Listings
13 Sold Listings
1.8 Months of Inventory
$2.9M Median Sale Price
106.7% Median Sale vs List
15 Avg Days on Market
The data, sourced from MLS Listings Inc., and Courted.io, includes all single-family homes, condos, and townhomes in the California Area above from June 2024 to June 2025. This may include preliminary data and may vary from the time the data was gathered. All data is deemed reliable but not guaranteed. DRE# 01906450. Copyright KW Advisors Peninsula Estates | Burlingame | San Mateo 2025. Each office is independently owned and operated.
8
New Listings
& Townhomes
4 Sold Listings
4.5
Months of Inventory
$1.3M
Median Sale Price 97.6%
Median Sale vs List
17 Avg Days on Market
Burlingame
JUNE 2024 - JUNE 2025 LISTINGS FOR SALE
Single-Family Homes
Last 12 months, year-over-year.
Condos & Townhomes
Last 12 months, year-over-year
Median SalesPrice
Single-Family Homes
The median sale price has decreased from $3 1m last June 2024, to $2 9m as of June 2025
Condos & Townhomes
The median sale price has increased from $1 32m last June 2024, to $1 34m as of June 2025
AVGDays OntheMarket
Single-Family Homes
The average time spent on the market went down from 23 days last June 2024, to 15 days as of June 2025
Condos & Townhomes
The average time spent on the market remained the same from 17 days in June 2024, to 17 days as of June 2025.
Overbids
Single-Family Homes
The overbid percentage has increased from 104 7% last June 2024, to 106 7% a year later
Condos & Townhomes
The overbid percentage has decreased from 104.5% last June 2024, to 97.6% a year later.
DalyCity
What's in the Daly City data?
There were 42 single-family homes for sale, providing 1.4 months of inventory. There were 34 new listings, and 31 homes sold at a median price of $1.2m. The median overbid percentage was at 104.5%, with an average of 20 days on the market.
There were 25 condo and townhome units for sale, providing 5 months of inventory. There were 10 new listings and 5 units sold at a median sale price of $547k. The median overbid percentage was at 98.8%, with an average of 33 days on the market.
SFH
Single-Family Homes
34 New Listings
31 Sold Listings
1.4 Months of Inventory
$1.2M Median Sale Price
104.5%
Median Sale vs List
20 Avg Days on Market
The data, sourced from MLS Listings Inc., and Courted.io, includes all single-family homes, condos, and townhomes in the California Area above from June 2024 to June 2025. This may include preliminary data and may vary from the time the data was gathered. All data is deemed reliable but not guaranteed. DRE# 01906450. Copyright KW Advisors Peninsula Estates | Burlingame | San Mateo 2025. Each office is independently owned and operated.
JUNE 2024 - JUNE 2025
Median SalesPrice
Single-Family Homes
The median sale price has decreased from $1 29m last June 2024, to $1 24m as of June 2025
Condos & Townhomes
The median sale price has decreased from $775k last June 2024, to $547k as of June 2025
AVGDays OntheMarket
Single-Family Homes
The average time spent on the market went up from 16 days last June 2024, to 20 days as of June 2025
Condos & Townhomes
The average time spent on the market went down from 42 days in June 2024, to 33 days as of June 2025.
Overbids
Single-Family Homes
The overbid percentage has decreased from 111 3% last June 2024, to 104 5% a year later
Condos & Townhomes
The overbid percentage has decreased from 102.5% last June 2024, to 98.8% a year later.
EastPalo Alto
What's in the East Palo Alto data?
There were 12 single-family homes for sale, providing 3 months of inventory. There were 6 new listings, and 4 homes sold at a median price of $1.1m. The median overbid percentage was at 102 3%, with an average of 38 days on the market
There were 2 condo and townhome units for sale, providing 0 months of inventory. There was 1 new listing and 0 units sold at a median sale price of $0. The median overbid percentage was at 0%, with an average of 0 days on the market.
Single-Family Homes
6 New Listings
4 Sold Listings
3 Months of Inventory
$1.1M Median Sale Price
102.3% Median Sale vs List
38 Avg Days on Market
The data, sourced from MLS Listings Inc., and Courted.io, includes all single-family homes, condos, and townhomes in the California Area above from June 2024 to June 2025. This may include preliminary data and may vary from the time the data was gathered. All data is deemed reliable but not guaranteed. DRE# 01906450. Copyright KW Advisors Peninsula Estates | Burlingame | San Mateo 2025. Each office is independently owned and operated.
Condo & Townhomes
1
New Listing
0
Months of Inventory $0
Median Sale Price 0%
Median Sale vs List 0 Avg Days on Market 0 Sold Listings
JUNE 2024 - JUNE 2025
LISTINGS FOR SALE SOLD LISTINGS
Single-Family Homes
Last 12 months, year-over-year.
Condos & Townhomes
Last 12 months, year-over-year
Median SalesPrice
Single-Family Homes
The median sale price has decreased from $1 2m last June 2024, to $1 1m as of June 2025
Condos & Townhomes
No data for this month
AVGDays OntheMarket
Single-Family Homes
The average time spent on the market went up from 31 days last June 2024, to 38 days as of June 2025
Condos & Townhomes
No data for this month
Overbids
Single-Family Homes
The overbid percentage has decreased from 108 6% last June 2024, to 102 3% a year later
Condos & Townhomes
No data for this month
FosterCity
What's in the Foster City data?
There were 10 single-family homes for sale, providing 0.7 months of inventory. There were 11 new listings, and 14 homes sold at a median price of $2.1m. The median overbid percentage was at 105.3%, with an average of 14 days on the market.
There were 33 condo and townhome units for sale, providing 3.7 months of inventory. There were 15 new listings and 9 units sold at a median sale price of $660k. The median overbid percentage was at 99%, with an average of 77 days on the market.
Single-Family Homes
11 New Listings
14 Sold Listings
0.7 Months of Inventory
$2.1M Median Sale Price
105.3% Median Sale vs List
14 Avg Days on Market
The data, sourced from MLS Listings Inc., and Courted.io, includes all single-family homes, condos, and townhomes in the California Area above from June 2024 to June 2025. This may include preliminary data and may vary from the time the data was gathered. All data is deemed reliable but not guaranteed. DRE# 01906450. Copyright KW Advisors Peninsula Estates | Burlingame | San Mateo 2025. Each office is independently owned and operated.
New Listings
3.7
Months of Inventory $660K
Median Sale Price 99%
Median Sale vs List 7 Avg Days on Market 9 Sold Listings
JUNE 2024 - JUNE 2025
Single-Family Homes
Last 12 months, year-over-year.
Condos & Townhomes
Last 12 months, year-over-year
Median SalesPrice
Single-Family Homes
The median sale price has decreased from $2 187m last June 2024, to $2 180m as of June 2025
Condos & Townhomes
The median sale price has decreased from $1 3m last June 2024, to $660k as of June 2025
AVGDays OntheMarket
Single-Family Homes
The average time spent on the market went down from 22 days last June 2024, to 14 days as of June 2025
Condos & Townhomes
The average time spent on the market went up from 15 days in June 2024, to 77 days as of June 2025.
Overbids
Single-Family Homes
The overbid percentage has increased from 104 7% last June 2024, to 105 3% a year later
Condos & Townhomes
The overbid percentage has decreased from 102.2% last June 2024, to 99% a year later.
HalfM Bay
What's in the Half data?
There were 32 single-family providing 3.6 months of inve new listings, and 9 homes so of $1.5m. The median overb 99 6%, with an average of 53
There were 11 condo and tow sale, providing 11 months of 3 new listings and 1 unit sold price of $599k. The median o was at 99.8%, with an averag market.
16 New Listings
3.6 Months of Inventory
99.6%
Median Sale vs List
9 Sold Listings
$1.5M Median Sale Price
53 Avg Days on Market
includes all single-family from June 2024 to June the time the data was 01906450. Copyright KW office is independently
New Listings
Listing
Median SalesPrice
Single-Family Homes
The median sale price has decreased from $1 7m last June 2024, to $1 5m as of June 2025
Condos & Townhomes
The median sale price has decreased from $1 1m last June 2024, to $599k as of June 2025
AVGDays OntheMarket
Single-Family Homes
The average time spent on the market went down from 55 days last June 2024, to 53 days as of June 2025
Condos & Townhomes
The average time spent on the market went up from 7 days in June 2024, to 279 days as of June 2025.
Overbids
Single-Family Homes
The overbid percentage has decreased from 101% last June 2024, to 99 6% a year later
Condos & Townhomes
The overbid percentage has decreased from 104.9% last June 2024, to 99.8% a year later.
Hillsborough
What's in the Hillsborough data?
There were 41 single-family homes for sale, providing 2.9 months of inventory. There were 19 new listings, and 14 homes sold at a median price of $4.9m. The median overbid percentage was at 99.1%, with an average of 23 days on the market.
There was no data for condo and townhouse units for this month.
19 New Listings
14 Sold Listings
2.9 Months of Inventory
$4.9M Median Sale Price
99.1% Median Sale vs List
23 Avg Days on Market
No data available for June 2025.
Median SalesPrice
Single-Family Homes
The median sale price has decreased from $5 6m last June 2024, to $4 9m as of June 2025
Condos & Townhomes
No data for this month
AVGDays OntheMarket
Single-Family Homes
The average time spent on the market went down from 43 days last June 2024, to 23 days as of June 2025
Condos & Townhomes
No data for this month
Overbids
Single-Family Homes
The overbid percentage has increased from 95 1% last June 2024, to 99 1% a year later
Condos & Townhomes
No data for this month
MenloPark
What's in the Menlo Park data?
There were 42 single-family homes for sale, providing 1.8 months of inventory. There were 30 new listings, and 23 homes sold at a median price of $3.1m. The median overbid percentage was at 101.5%, with an average of 21 days on the market.
There were 21 condo and townhome units for sale, providing 5.3 months of inventory. There were 10 new listings and 4 units sold at a median sale price of $1m. The median overbid percentage was at 99.8%, with an average of 18 days on the market.
Single-Family Homes
30 New Listings
23 Sold Listings
1.8 Months of Inventory
$3.1M Median Sale Price
101.5% Median Sale vs List
21 Avg Days on Market
The data, sourced from MLS Listings Inc., and Courted.io, includes all single-family homes, condos, and townhomes in the California Area above from June 2024 to June 2025. This may include preliminary data and may vary from the time the data was gathered. All data is deemed reliable but not guaranteed. DRE# 01906450. Copyright KW Advisors Peninsula Estates | Burlingame | San Mateo 2025. Each office is independently owned and operated.
New Listings 5.3
Months of Inventory 99.8%
Median Sale vs List
Median SalesPrice
Single-Family Homes
The median sale price has decreased from $3 7m last June 2024, to $3 1m as of June 2025
Condos & Townhomes
The median sale price has decreased from $1 7m last June 2024, to $1m as of June 2025
AVGDays OntheMarket
Single-Family Homes
The average time spent on the market went down from 31 days last June 2024, to 21 days as of June 2025
Condos & Townhomes
The average time spent on the market went down from 41 days in June 2024, to 18 days as of June 2025.
Overbids
Single-Family Homes
The overbid percentage has decreased from 103 9% last June 2024, to 101 5% a year later
Condos & Townhomes
The overbid percentage has increased from 98.5% last June 2024, to 99.8% a year later.
Millbrae
What's in the Millbrae data?
There were 14 single-family homes for sale, providing 2.3 months of inventory. There were 15 new listings, and 6 homes sold at a median price of $1.7m. The median overbid percentage was at 107.6%, with an average of 12 days on the market.
There were 12 condo and townhome units for sale, providing 4 months of inventory. There were 3 new listings and 3 units sold at a median sale price of $965k. The median overbid percentage was at 99.8%, with an average of 17 days on the market.
Single-Family Homes
15 New Listings
6 Sold Listings
2.3 Months of Inventory
$1.7M Median Sale Price
107.6% Median Sale vs List
12 Avg Days on Market
The data, sourced from MLS Listings Inc., and Courted.io, includes all single-family homes, condos, and townhomes in the California Area above from June 2024 to June 2025. This may include preliminary data and may vary from the time the data was gathered. All data is deemed reliable but not guaranteed. DRE# 01906450. Copyright KW Advisors Peninsula Estates | Burlingame | San Mateo 2025. Each office is independently owned and operated.
3
New Listings
3
Sold Listings
4
Months of Inventory
$965K
Median Sale Price 99.8%
Median Sale vs List 17 Avg Days on Market
Median SalesPrice
Single-Family Homes
The median sale price has decreased from $2 1m last June 2024, to $1 7m as of June 2025
Condos & Townhomes
The median sale price has increased from $875k last June 2024, to $965k as of June 2025
AVGDays OntheMarket
Single-Family Homes
The average time spent on the market went down from 16 days last June 2024, to 12 days as of June 2025
Condos & Townhomes
The average time spent on the market remained the same from 17 days in June 2024, to 17 days as of June 2025.
Overbids
Single-Family Homes
The overbid percentage has decreased from 111 9% last June 2024, to 107 6% a year later
Condos & Townhomes
The overbid percentage has decreased from 100% last June 2024, to 99.8% a year later.
Pacifica
What's in the Paci
There were 57 single-family h providing 2.5 months of inve new listings, and 23 homes s of $1.4m. The median overbi 104.6%, with an average of 3
There were 24 condo and tow sale, providing 0 months of in 11 new listings and 0 units s price of $0. The median over at 0%, with an average of 0 d
30 New Listings
2.5 Months of Inventory
104.6% Median Sale vs List
23 Sold Listings
$1.4M Median Sale Price
34 Avg Days on Market
includes all single-family from June 2024 to June the time the data was 01906450. Copyright KW office is independently
New Listings
Sold Listings
Months of Inventory
Median Sale vs List
Days on Market
Median SalesPrice
Single-Family Homes
The median sale price has increased from $1 3m last June 2024, to $1 4m as of June 2025
Condos & Townhomes
The median sale price has decreased from $759k last June 2024, to $0 as of June 2025
AVGDays OntheMarket
Single-Family Homes
The average time spent on the market went up from 22 days last June 2024, to 34 days as of June 2025
Condos & Townhomes
The average time spent on the market went down from 75 days in June 2024, to 0 days as of June 2025.
Overbids
Single-Family Homes
The overbid percentage has decreased from 106 2% last June 2024, to 104 6% a year later
Condos & Townhomes
The overbid percentage has decreased from 101.5% last June 2024, to 0% a year later.
Portola Valley
What's in the Portola Valley data?
There were 29 single-family homes for sale, providing 4.8 months of inventory. There were 5 new listings, and 6 homes sold at a median price of $2.9m. The median overbid percentage was at 99%, with an average of 60 days on the market
There was no data for condo and townhouse units for this month.
Single-Family Homes
5 New Listings
6 Sold Listings
4.8 Months of Inventory
$2.9M Median Sale Price
99% Median Sale vs List
60 Avg Days on Market
The data, sourced from MLS Listings Inc., and Courted.io, includes all single-family homes, condos, and townhomes in the California Area above from June 2024 to June 2025. This may include preliminary data and may vary from the time the data was gathered. All data is deemed reliable but not guaranteed. DRE# 01906450. Copyright KW Advisors Peninsula Estates | Burlingame | San Mateo 2025. Each office is independently owned and operated.
CONDO
Condo & Townhomes
No data available for June 2025.
ortolaValley
JUNE 2024 - JUNE 2025
TINGS FOR SALE SOLD LISTINGS
Family Homes
2 months, year-over-year.
No data available.
s & Townhomes
2 months, year-over-year
Median SalesPrice
Single-Family Homes
The median sale price has decreased from $4 5m last June 2024, to $2 9m as of June 2025
Condos & Townhomes
No data for this month
AVGDays OntheMarket
Single-Family Homes
The average time spent on the market went up from 37 days last June 2024, to 60 days as of June 2025
Condos & Townhomes
No data for this month
Overbids
Single-Family Homes
The overbid percentage has decreased from 108 3% last June 2024, to 99% a year later
Condos & Townhomes
No data for this month
Redwood City
What's in the Redwood City data?
There were 73 single-family homes for sale, providing 2.1 months of inventory. There were 37 new listings, and 35 homes sold at a median price of $2.3m. The median overbid percentage was at 100 4%, with an average of 23 days on the market
There were 24 condo and townhome units for sale, providing 2.7 months of inventory. There were 12 new listings and 9 units sold at a median sale price of $1.1m. The median overbid percentage was at 98%, with an average of 32 days on the market.
Single-Family Homes
37 New Listings
35 Sold Listings
2.1 Months of Inventory
$2.3M Median Sale Price
100.4% Median Sale vs List
23 Avg Days on Market
The data, sourced from MLS Listings Inc., and Courted.io, includes all single-family homes, condos, and townhomes in the California Area above from June 2024 to June 2025. This may include preliminary data and may vary from the time the data was gathered. All data is deemed reliable but not guaranteed. DRE# 01906450. Copyright KW Advisors Peninsula Estates | Burlingame | San Mateo 2025. Each office is independently owned and operated.
New Listings
9
Sold Listings
2.7
Months of Inventory
$1.1M
Median Sale Price 98%
Median Sale vs List
32
Avg Days on Market
JUNE 2024 - JUNE 2025
Single-Family Homes
Last 12 months, year-over-year.
Condos & Townhomes
Last 12 months, year-over-year
Median SalesPrice
Single-Family Homes
The median sale price has increased from $2m last June 2024, to $2 3m as of June 2025
Condos & Townhomes
The median sale price has decreased from $1 4m last June 2024, to $1 1m as of June 2025
AVGDays OntheMarket
Single-Family Homes
The average time spent on the market went down from 30 days last June 2024, to 23 days as of June 2025
Condos & Townhomes
The average time spent on the market went down from 43 days in June 2024, to 32 days as of June 2025.
Overbids
Single-Family Homes
The overbid percentage has decreased from 106 4% last June 2024, to 100 4% a year later
Condos & Townhomes
The overbid percentage has decreased from 103.9% last June 2024, to 98% a year later.
e-Family Homes
26 New Listings
16 Sold Listings
2 Months of Inventory
$1.4M
Median Sale Price
109%
Median Sale vs List
16 Avg Days on Market
sourced from MLS Listings Inc., and Courted.io, includes all single-family condos, and townhomes in the California Area above from June 2024 to June may include preliminary data and may vary from the time the data was data is deemed reliable but not guaranteed. DRE# 01906450. Copyright KW Peninsula Estates | Burlingame | San Mateo 2025. Each office is independently owned and operated.
New Listings
2.1 Months of Inventory $440K Median Sale Price 98.8% Median Sale vs List 44 Avg Days on Market 8 Sold Listings
Median SalesPrice
Single-Family Homes
The median sale price has decreased from $1 5m last June 2024, to $1 4m as of June 2025
Condos & Townhomes
The median sale price has decreased from $505k last June 2024, to $440k as of June 2025
AVGDays OntheMarket
Single-Family Homes
The average time spent on the market went up from 11 days last June 2024, to 16 days as of June 2025
Condos & Townhomes
The average time spent on the market went down from 45 days in June 2024, to 44 days as of June 2025.
Overbids
Single-Family Homes
The overbid percentage has decreased from 109 6% last June 2024, to 109% a year later
Condos & Townhomes
The overbid percentage has decreased from 99.4% last June 2024, to 98.8% a year later.
SanCarlos
What's in the San Carlos data?
There were 36 single-family homes for sale, providing 1.8 months of inventory. There were 35 new listings, and 19 homes sold at a median price of $2.7m. The median overbid percentage was at 103.9%, with an average of 17 days on the market.
There were 27 condo and townhome units for sale, providing 3.4 months of inventory. There were 10 new listings and 8 units sold at a median sale price of $962k. The median overbid percentage was at 100.5%, with an average of 22 days on the market.
Single-Family Homes
35 New Listings
19 Sold Listings
1.8 Months of Inventory
$2.7M Median Sale Price
103.9% Median Sale vs List
17 Avg Days on Market
The data, sourced from MLS Listings Inc., and Courted.io, includes all single-family homes, condos, and townhomes in the California Area above from June 2024 to June 2025. This may include preliminary data and may vary from the time the data was gathered. All data is deemed reliable but not guaranteed. DRE# 01906450. Copyright KW Advisors Peninsula Estates | Burlingame | San Mateo 2025. Each office is independently owned and operated.
New Listings
8
Sold Listings
3.4
Months of Inventory
100.5%
Median Sale vs List
$962K
Median Sale Price
22
Avg Days on Market
Carlos
JUNE 2024 - JUNE 2025
mes year-over-year.
omes , year-over-year
Median SalesPrice
Single-Family Homes
The median sale price has increased from $2 1m last June 2024, to $2 7m as of June 2025
Condos & Townhomes
The median sale price has increased from $937k last June 2024, to $962k as of June 2025
AVGDays OntheMarket
Single-Family Homes
The average time spent on the market went down from 20 days last June 2024, to 17 days as of June 2025
Condos & Townhomes
The average time spent on the market went down from 25 days in June 2024, to 22 days as of June 2025.
Overbids
Single-Family Homes
The overbid percentage has decreased from 106 4% last June 2024, to 103 9% a year later
Condos & Townhomes
The overbid percentage has increased from 98.8% last June 2024, to 100.5% a year later.
SanMateo
What's in the San Mateo data?
There were 53 single-family homes for sale, providing 1.1 months of inventory. There were 54 new listings, and 50 homes sold at a median price of $2.1m. The median overbid percentage was at 103.9%, with an average of 19 days on the market.
There were 96 condo and townhome units for sale, providing 3.8 months of inventory. There were 43 new listings and 25 units sold at a median sale price of $825k. The median overbid percentage was at 98.6%, with an average of 40 days on the market.
54 New Listings
mily Homes
50 Sold Listings
1.1 Months of Inventory
$2.1M Median Sale Price
103.9%
Median Sale vs List
19 Avg Days on Market
MLS Listings Inc., and Courted.io, includes all single-family townhomes in the California Area above from June 2024 to June preliminary data and may vary from the time the data was deemed reliable but not guaranteed. DRE# 01906450. Copyright KW | Burlingame | San Mateo 2025. Each office is independently
43
New Listings
25 Sold Listings
3.8
Months of Inventory
$825K
Median Sale Price 98.6%
Median Sale vs List
40 Avg Days on Market
SanMateo
JUNE 2024 - JUNE 2025
LISTINGS FOR SALE SOLD LISTINGS
gle-Family Homes
t 12 months, year-over-year.
ndos & Townhomes
t 12 months, year-over-year
Median SalesPrice
Single-Family Homes
The median sale price has increased from $2m last June 2024, to $2 1m as of June 2025
Condos & Townhomes
The median sale price has decreased from $1m last June 2024, to $825k as of June 2025
AVGDays OntheMarket
Single-Family Homes
The average time spent on the market went up from 11 days last June 2024, to 19 days as of June 2025
Condos & Townhomes
The average time spent on the market went up from 34 days in June 2024, to 40 days as of June 2025.
Overbids
Single-Family Homes
The overbid percentage has decreased from 108 4% last June 2024, to 103 9% a year later
Condos & Townhomes
The overbid percentage has decreased from 102.1% last June 2024, to 98.6% a year later.
SouthSan Francisco
What's in the South San Francisco data?
There were 35 single-family homes for sale, providing 2.1 months of inventory. There were 25 new listings, and 17 homes sold at a median price of $1.2m. The median overbid percentage was at 105 6%, with an average of 21 days on the market
There were 19 condo and townhome units for sale, providing 4.8 months of inventory. There were 9 new listings and 4 units sold at a median sale price of $837k. The median overbid percentage was at 103.1%, with an average of 64 days on the market.
25 New Listings
17 Sold Listings
2.1 Months of Inventory
$1.2M Median Sale Price
105.6% Median Sale vs List
21 Avg Days on Market
9
New Listings
4
Sold Listings
4.8
Months of Inventory
103.1%
Median Sale vs List
$837K
Median Sale Price
64
Avg Days on Market
SouthSanFrancisco
JUNE 2024 - JUNE 2025
LISTINGS FOR SALE
Single-Family Homes
Last 12 months, year-over-year.
Condos & Townhomes
Last 12 months, year-over-year
Median SalesPrice
Single-Family Homes
The median sale price has remained the same from $1 2m last June 2024, to $1 2m as of June 2025
Condos & Townhomes
The median sale price has increased from $662k last June 2024, to $837k as of June 2025
AVGDays OntheMarket
Single-Family Homes
The average time spent on the market went up from 16 days last June 2024, to 21 days as of June 2025
Condos & Townhomes
The average time spent on the market went down from 104 days in June 2024, to 64 days as of June 2025.
Overbids
Single-Family Homes
The overbid percentage has decreased from 112% last June 2024, to 105 6% a year later
Condos & Townhomes
The overbid percentage has increased from 97.3% last June 2024, to 103.1% a year later.
Wo
What's in
There were 4 providing 15. new listings, of $7.1m. The 96.8%, with a
There was no for this mont
e-Family Homes
tings
3 Sold Listings
.7 of Inventory
$7.1M Median Sale Price
.8% Sale vs List
46 Avg Days on Market
sourced from MLS Listings Inc., and Courted.io, includes all single-family condos, and townhomes in the California Area above from June 2024 to June may include preliminary data and may vary from the time the data was data is deemed reliable but not guaranteed. DRE# 01906450. Copyright KW Peninsula Estates | Burlingame | San Mateo 2025. Each office is independently owned and operated.
CONDO
Condo & Townhomes
No data available for June 2025.
Woodside
JUNE 2024 - JUNE 2025
LISTINGS FOR SALE SOLD LISTINGS
gle-Family Homes st 12 months, year-over-year.
No data available.
ndos & Townhomes st 12 months, year-over-year
Median SalesPrice
Single-Family Homes
The median sale price has increased from $3 4m last June 2024, to $7 1m as of June 2025
Condos & Townhomes
No data for this month
AVGDays OntheMarket
Single-Family Homes
The average time spent on the market went up from 18 days last June 2024, to 46 days as of June 2025
Condos & Townhomes
No data for this month
Overbids
Single-Family Homes
The overbid percentage has decreased from 104 1% last June 2024, to 96 8% a year later
Condos & Townhomes
No data for this month
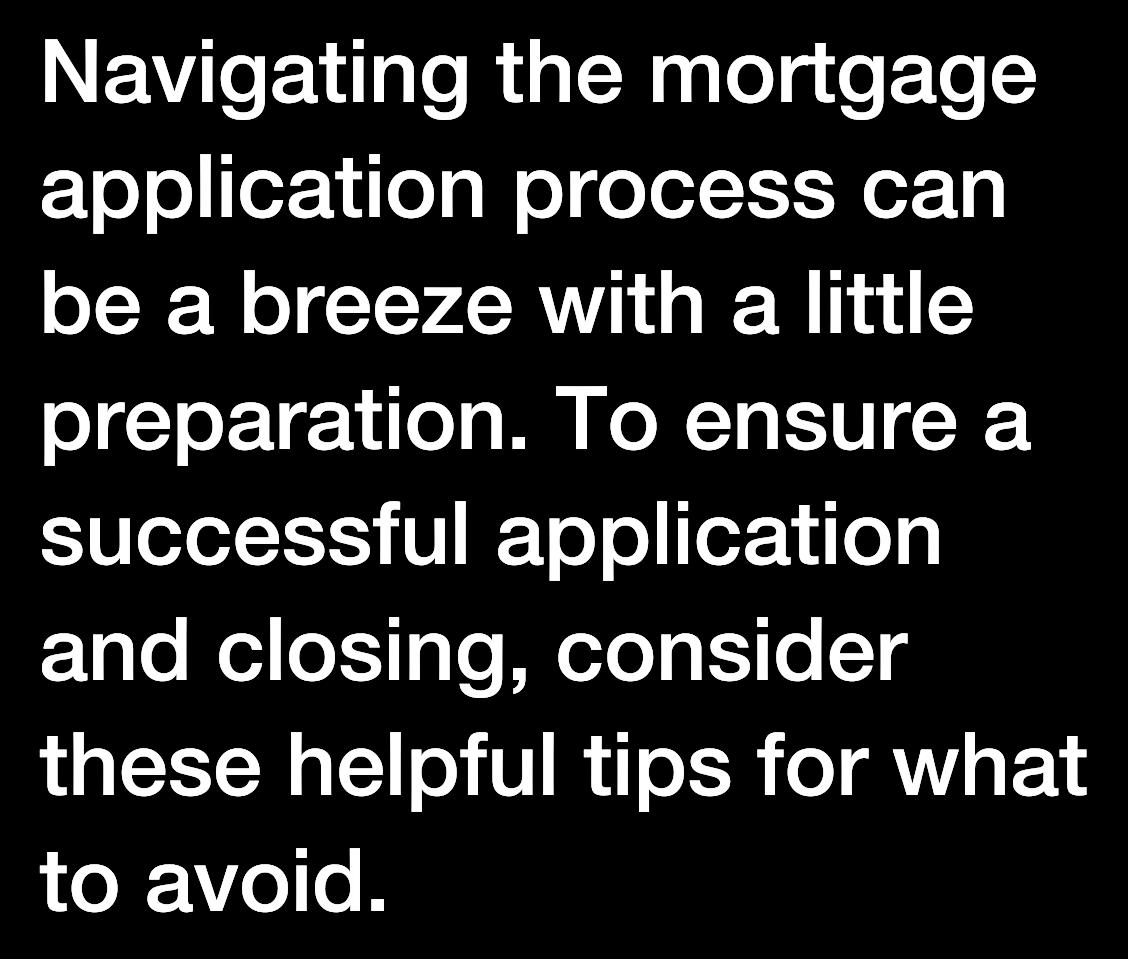
Smart Strategies for a Mortgage Application
Avoid paying off debts or collections without professional advice.
Don't have your credit report pulled too many times - this can hurt your credit score. 3 4 5 6 1 2
Always consult your mortgage professional before making large financial moves. Use verified funds for deposits to prevent closing delays.
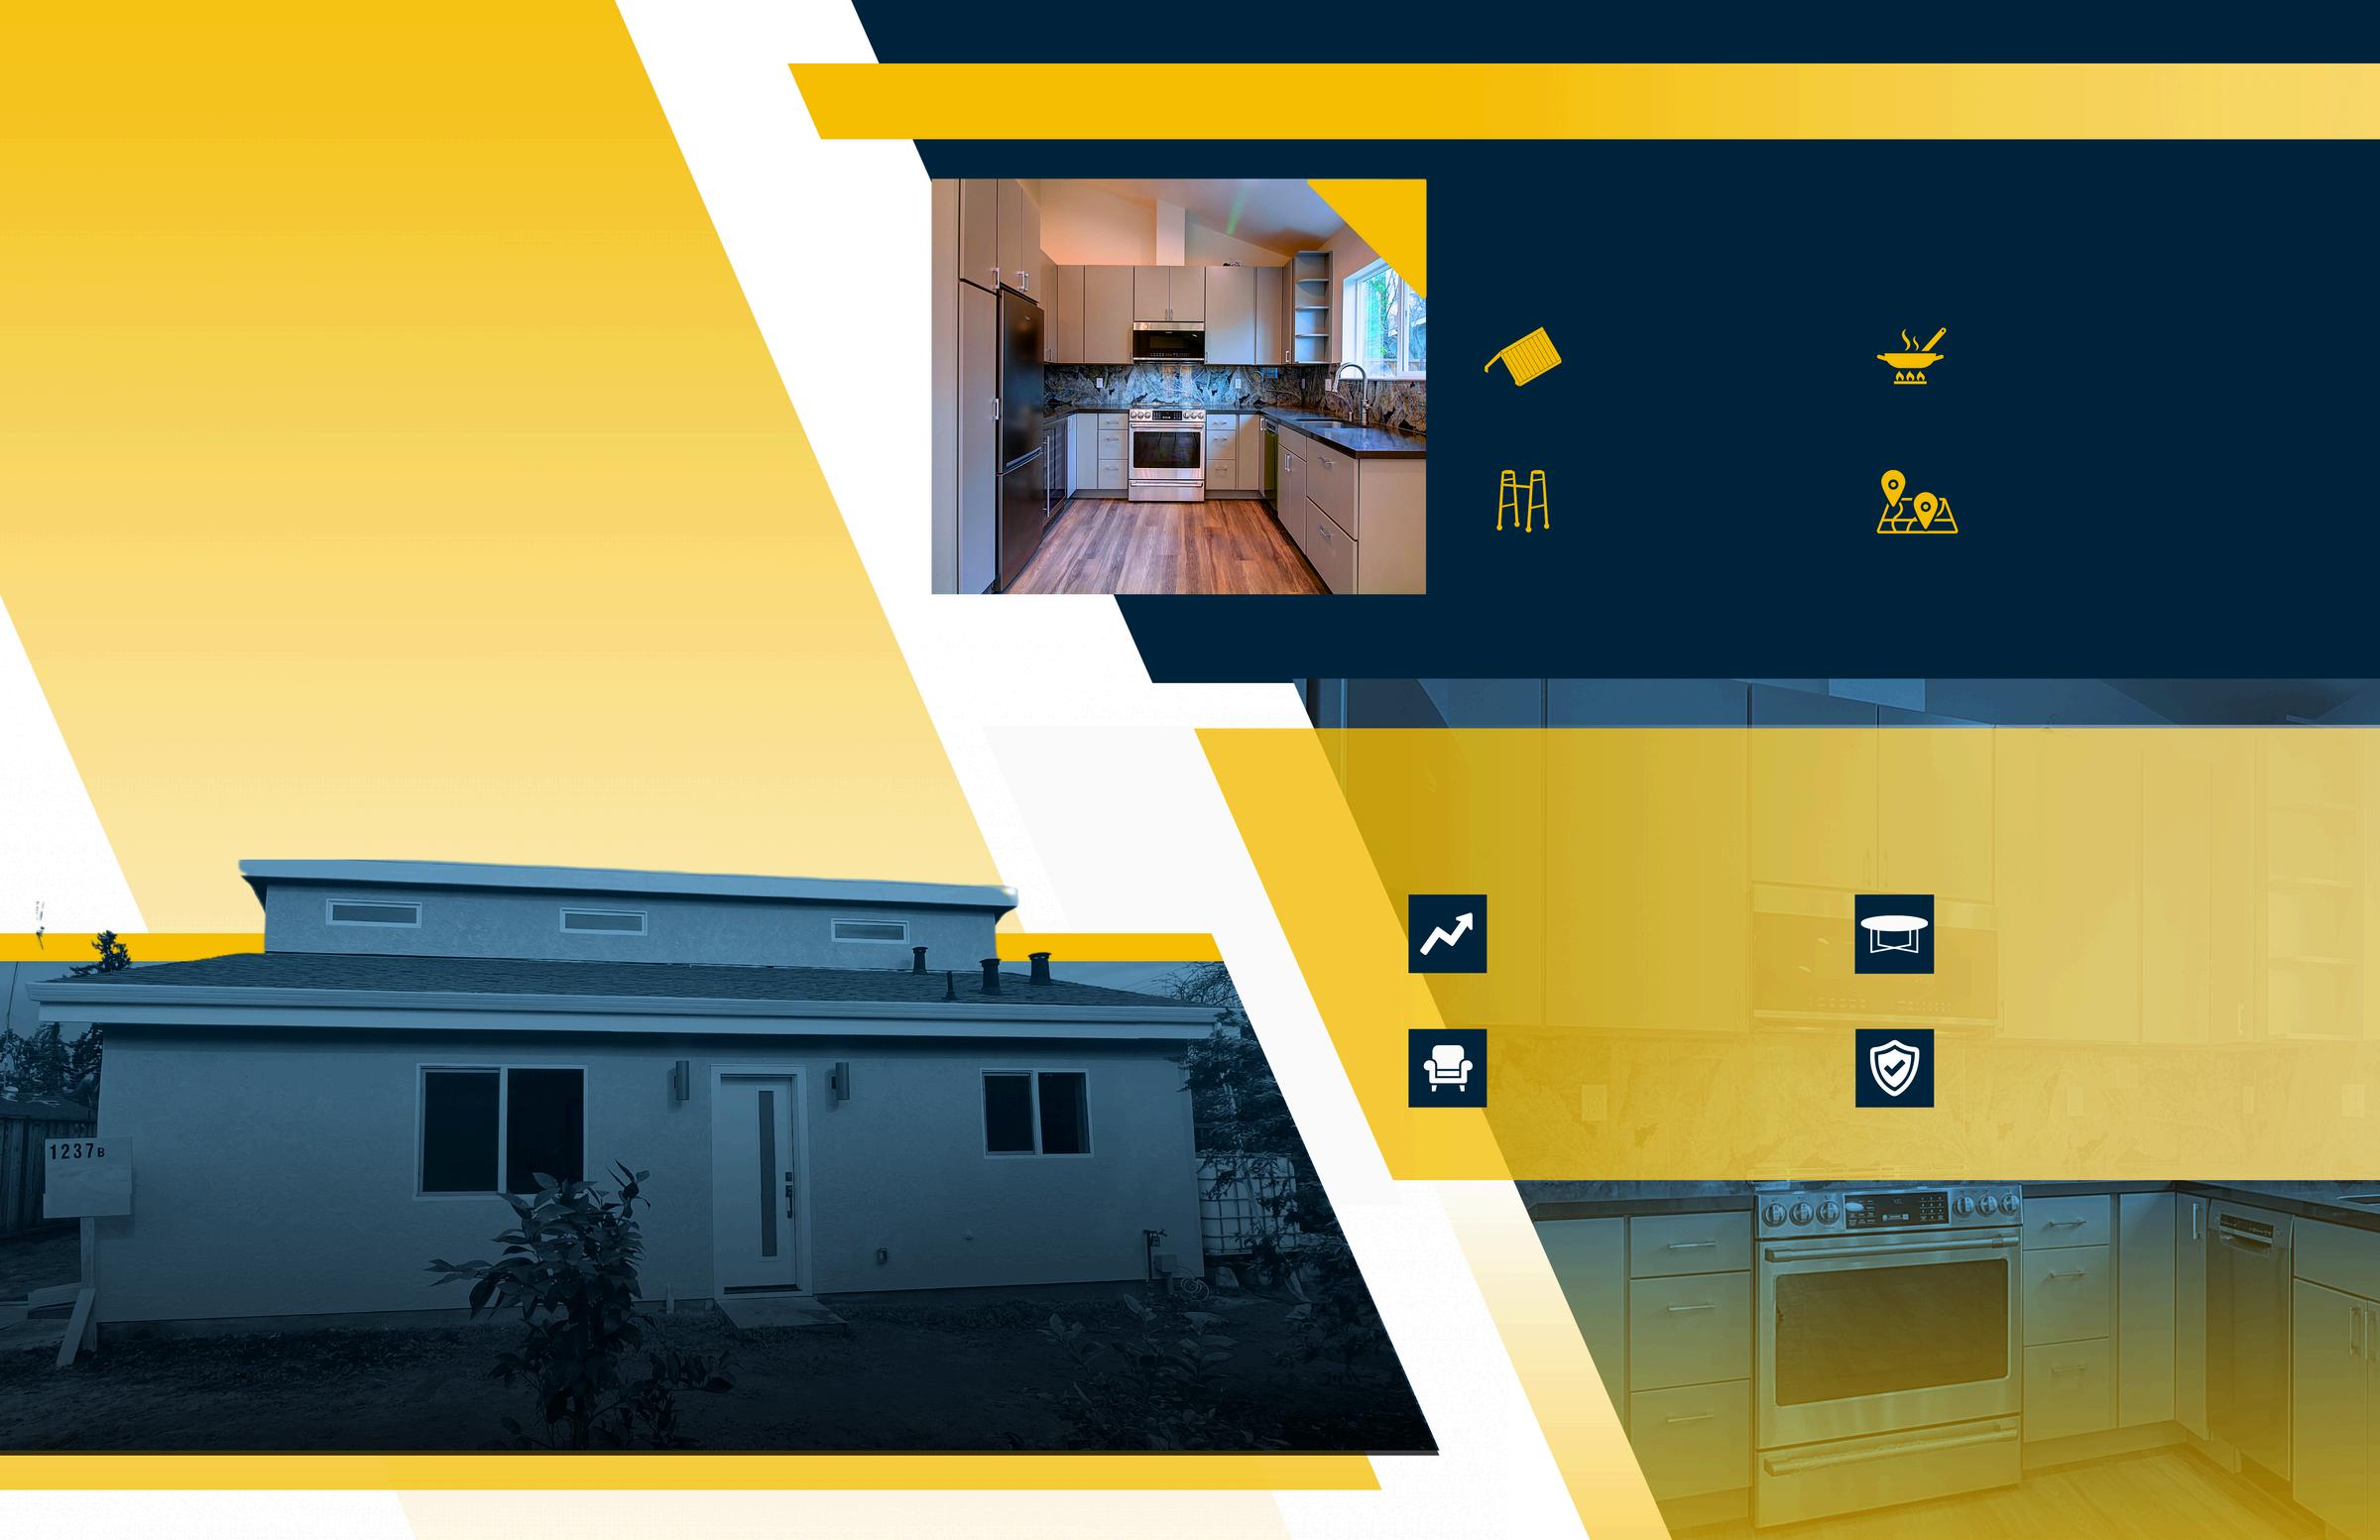
HomeRenovationsThatCanMakea BIG IMPACT AccordingtoExperts
Enhancing Property Value and Family Living Space with an Acton ADU
The Anenberg-Essert family in Campbell collaborated with Acton ADU to create a versatile, comfortable, and valuable addition to their property. This ADU project is a shining example of how a well-designed accessory dwelling unit can increase property value and serve a family’s unique needs.
GoalsandVision
The family envisioned an ADU that would function as an independent living space for family members, enhance their property’s worth, and provide seamless integration with the main home They wanted a space that balanced privacy with connectivity, feeling like a natural extension of their residence
Design and Construction Details
Constructed at 747 square feet, this ADU was designed with modern, high-quality finishes to serve both aesthetic and practical needs. Key features include:
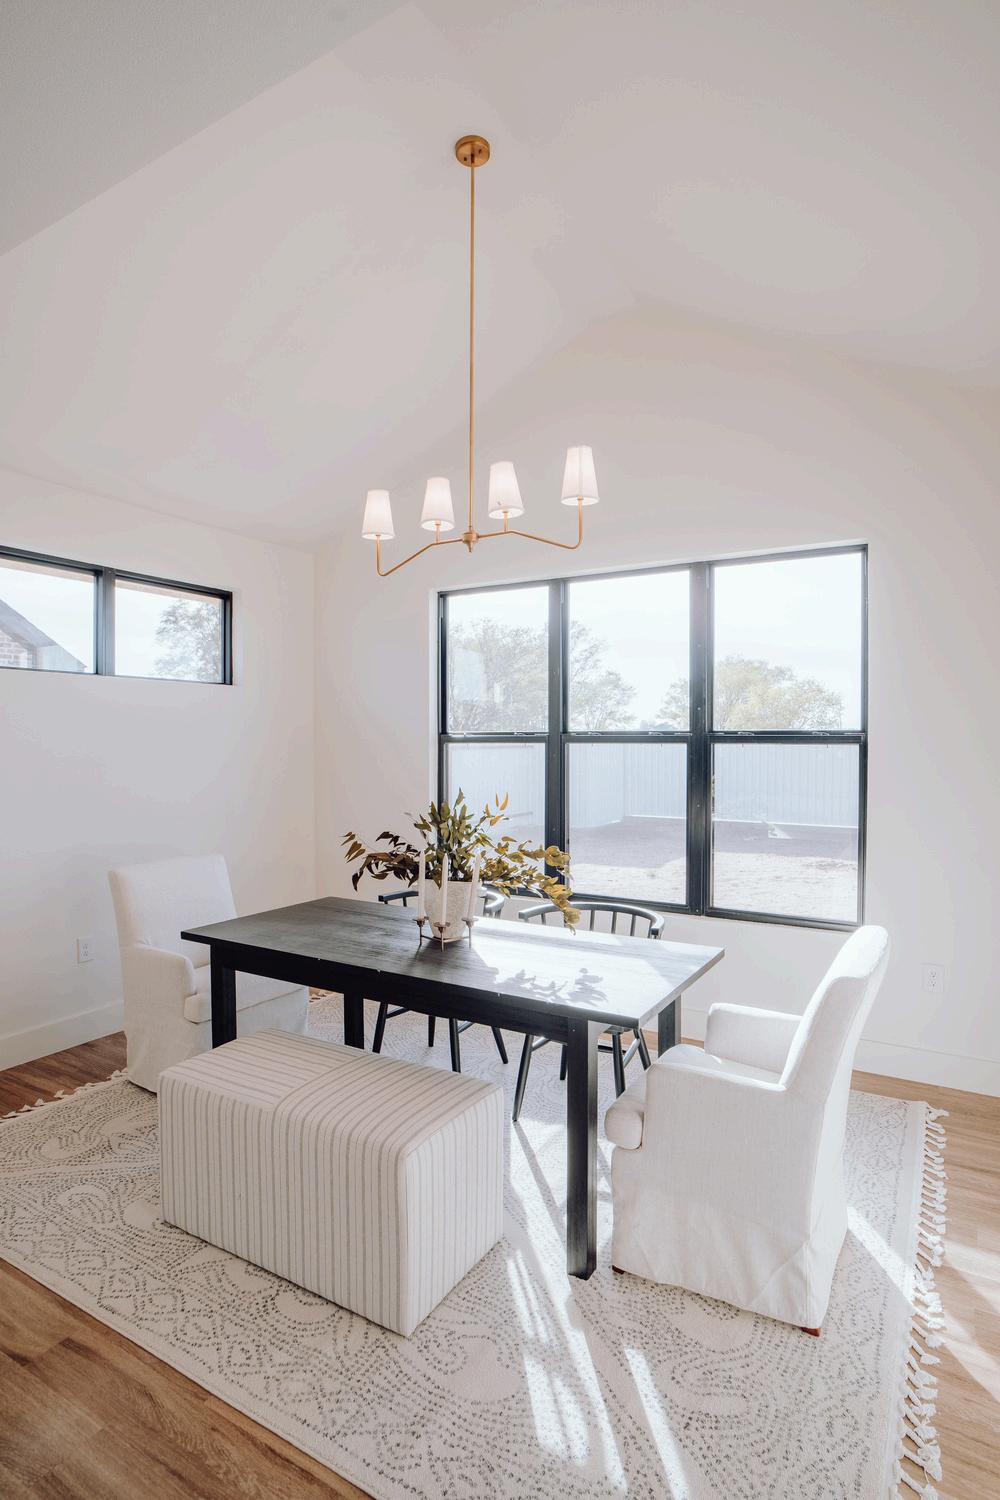
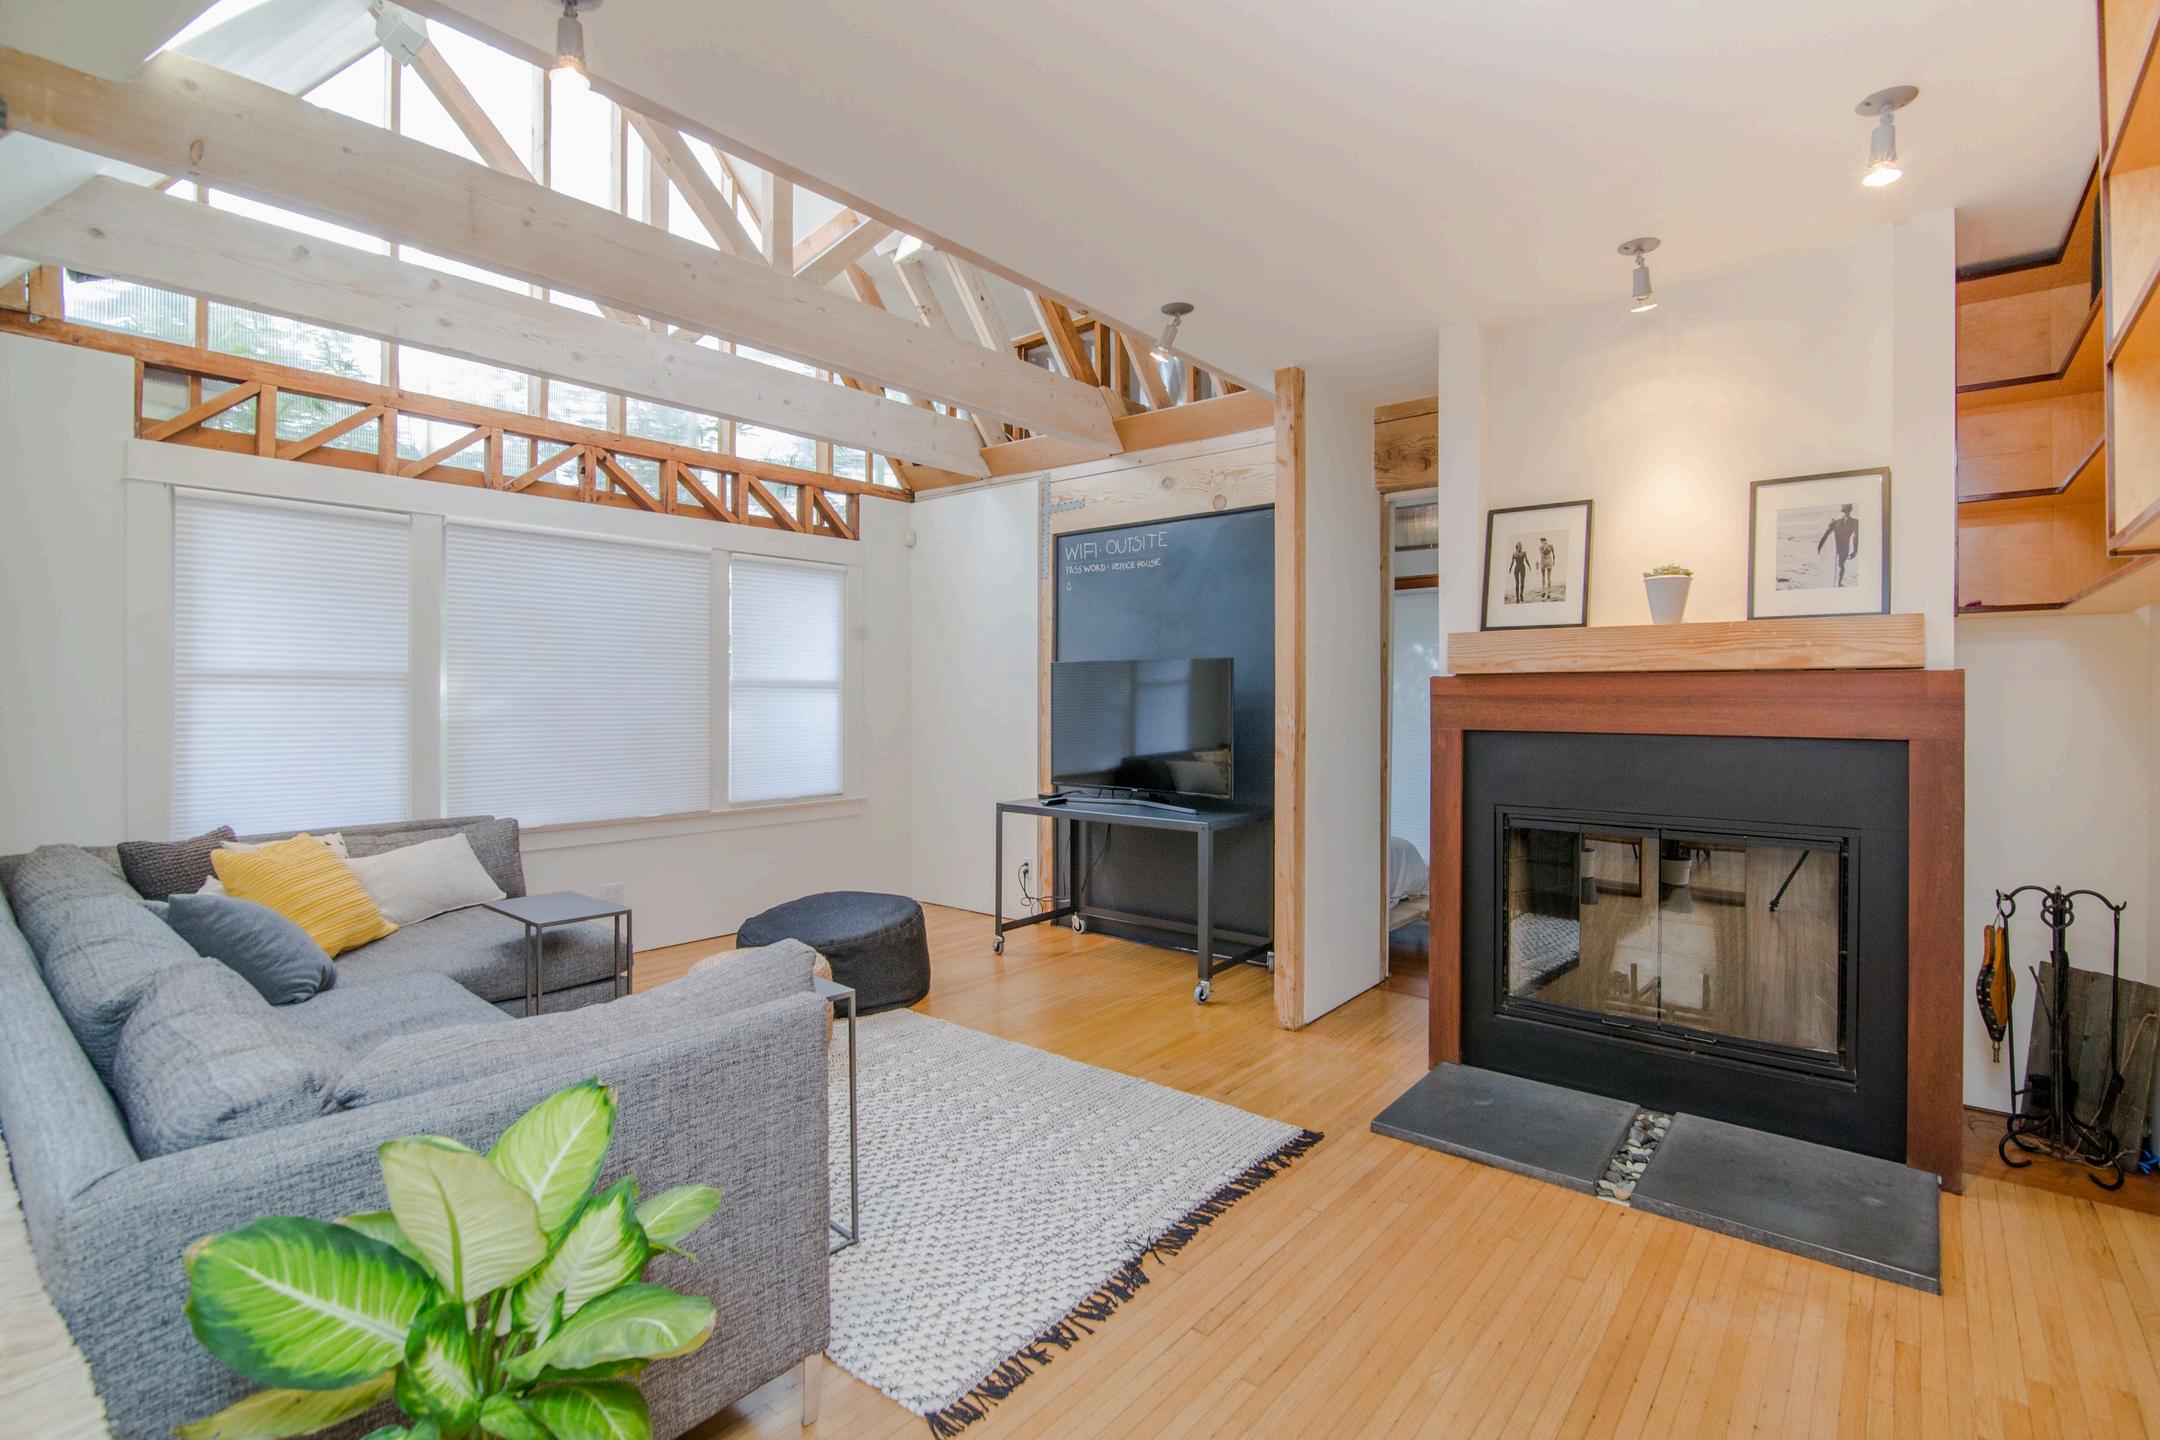
Vaulted Ceilings
Creates a spacious, open atmosphere
Senior-Friendly Living
Safe, independent space for elderly family members
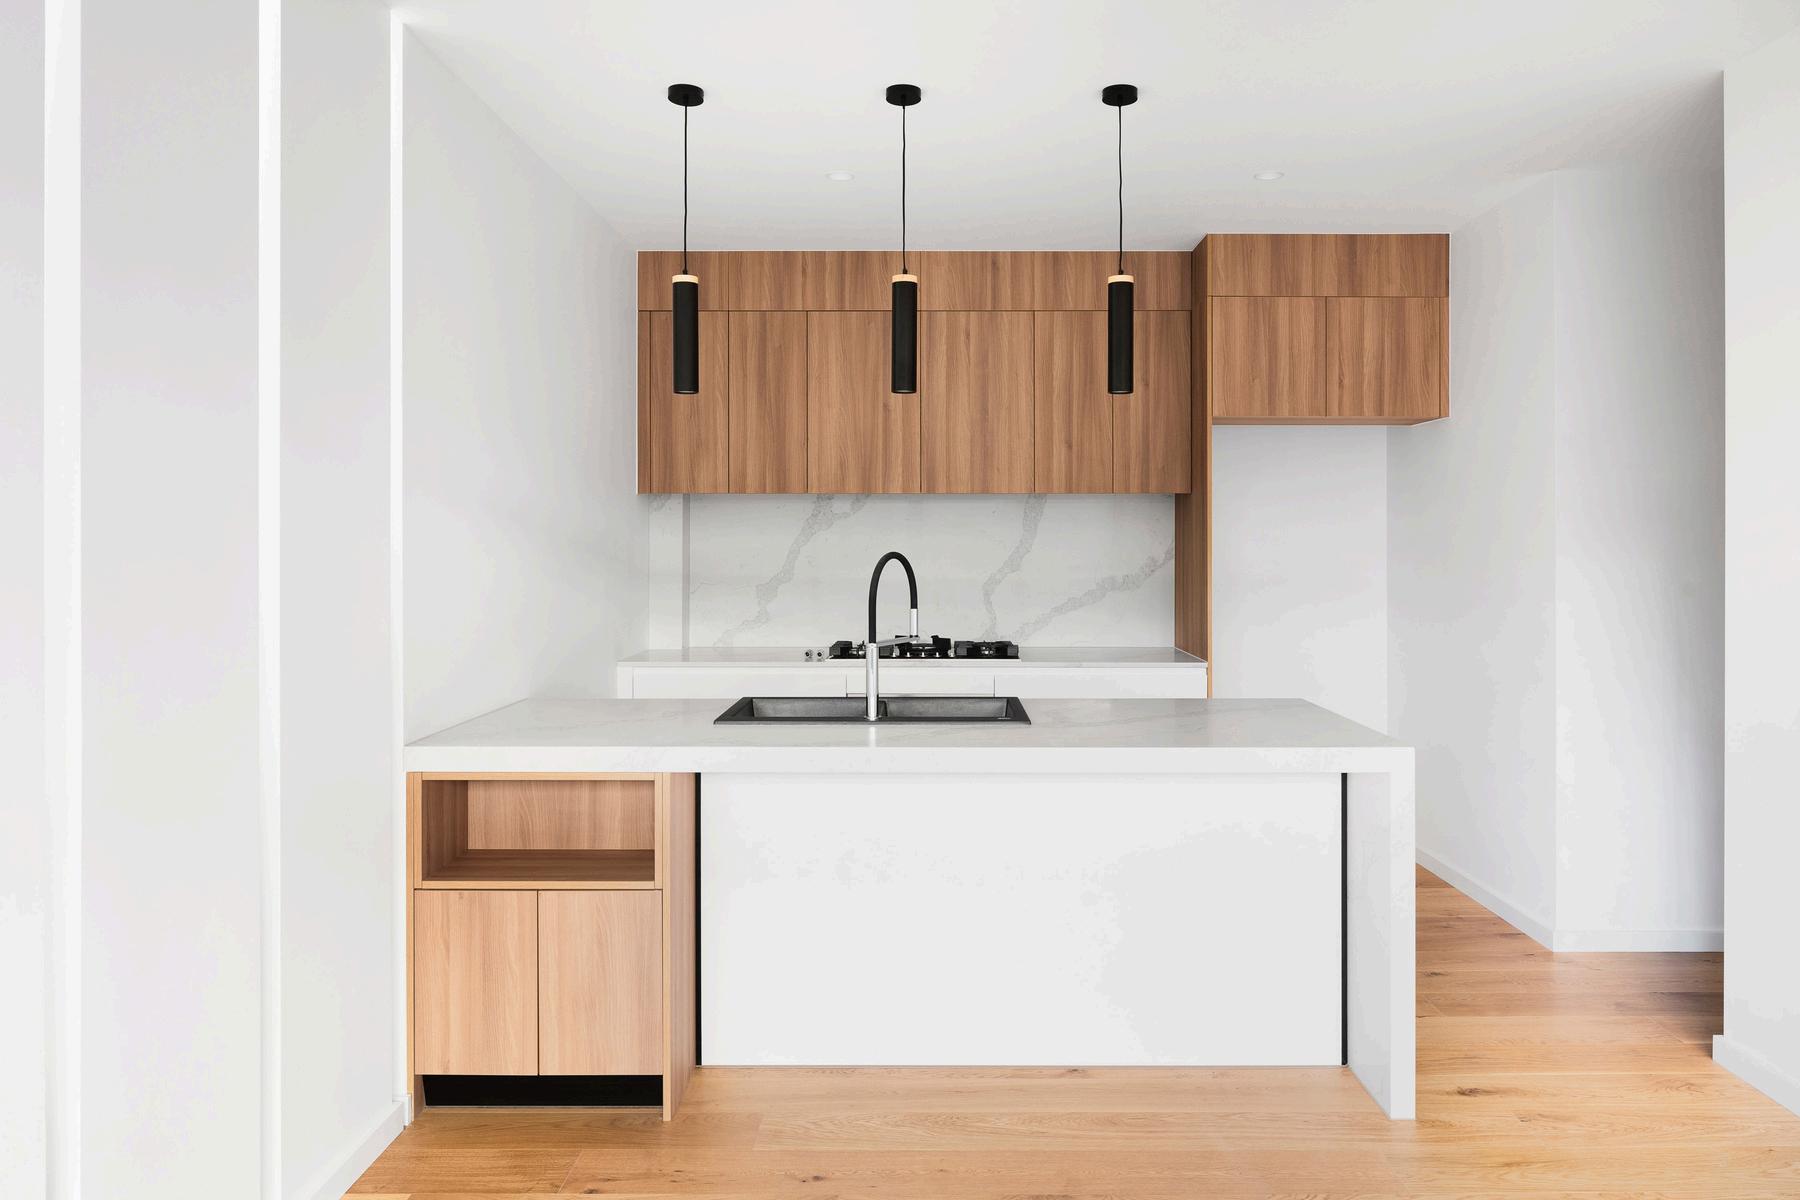
Fully Equipped Kitchen
Modern amenities for everyday convenience
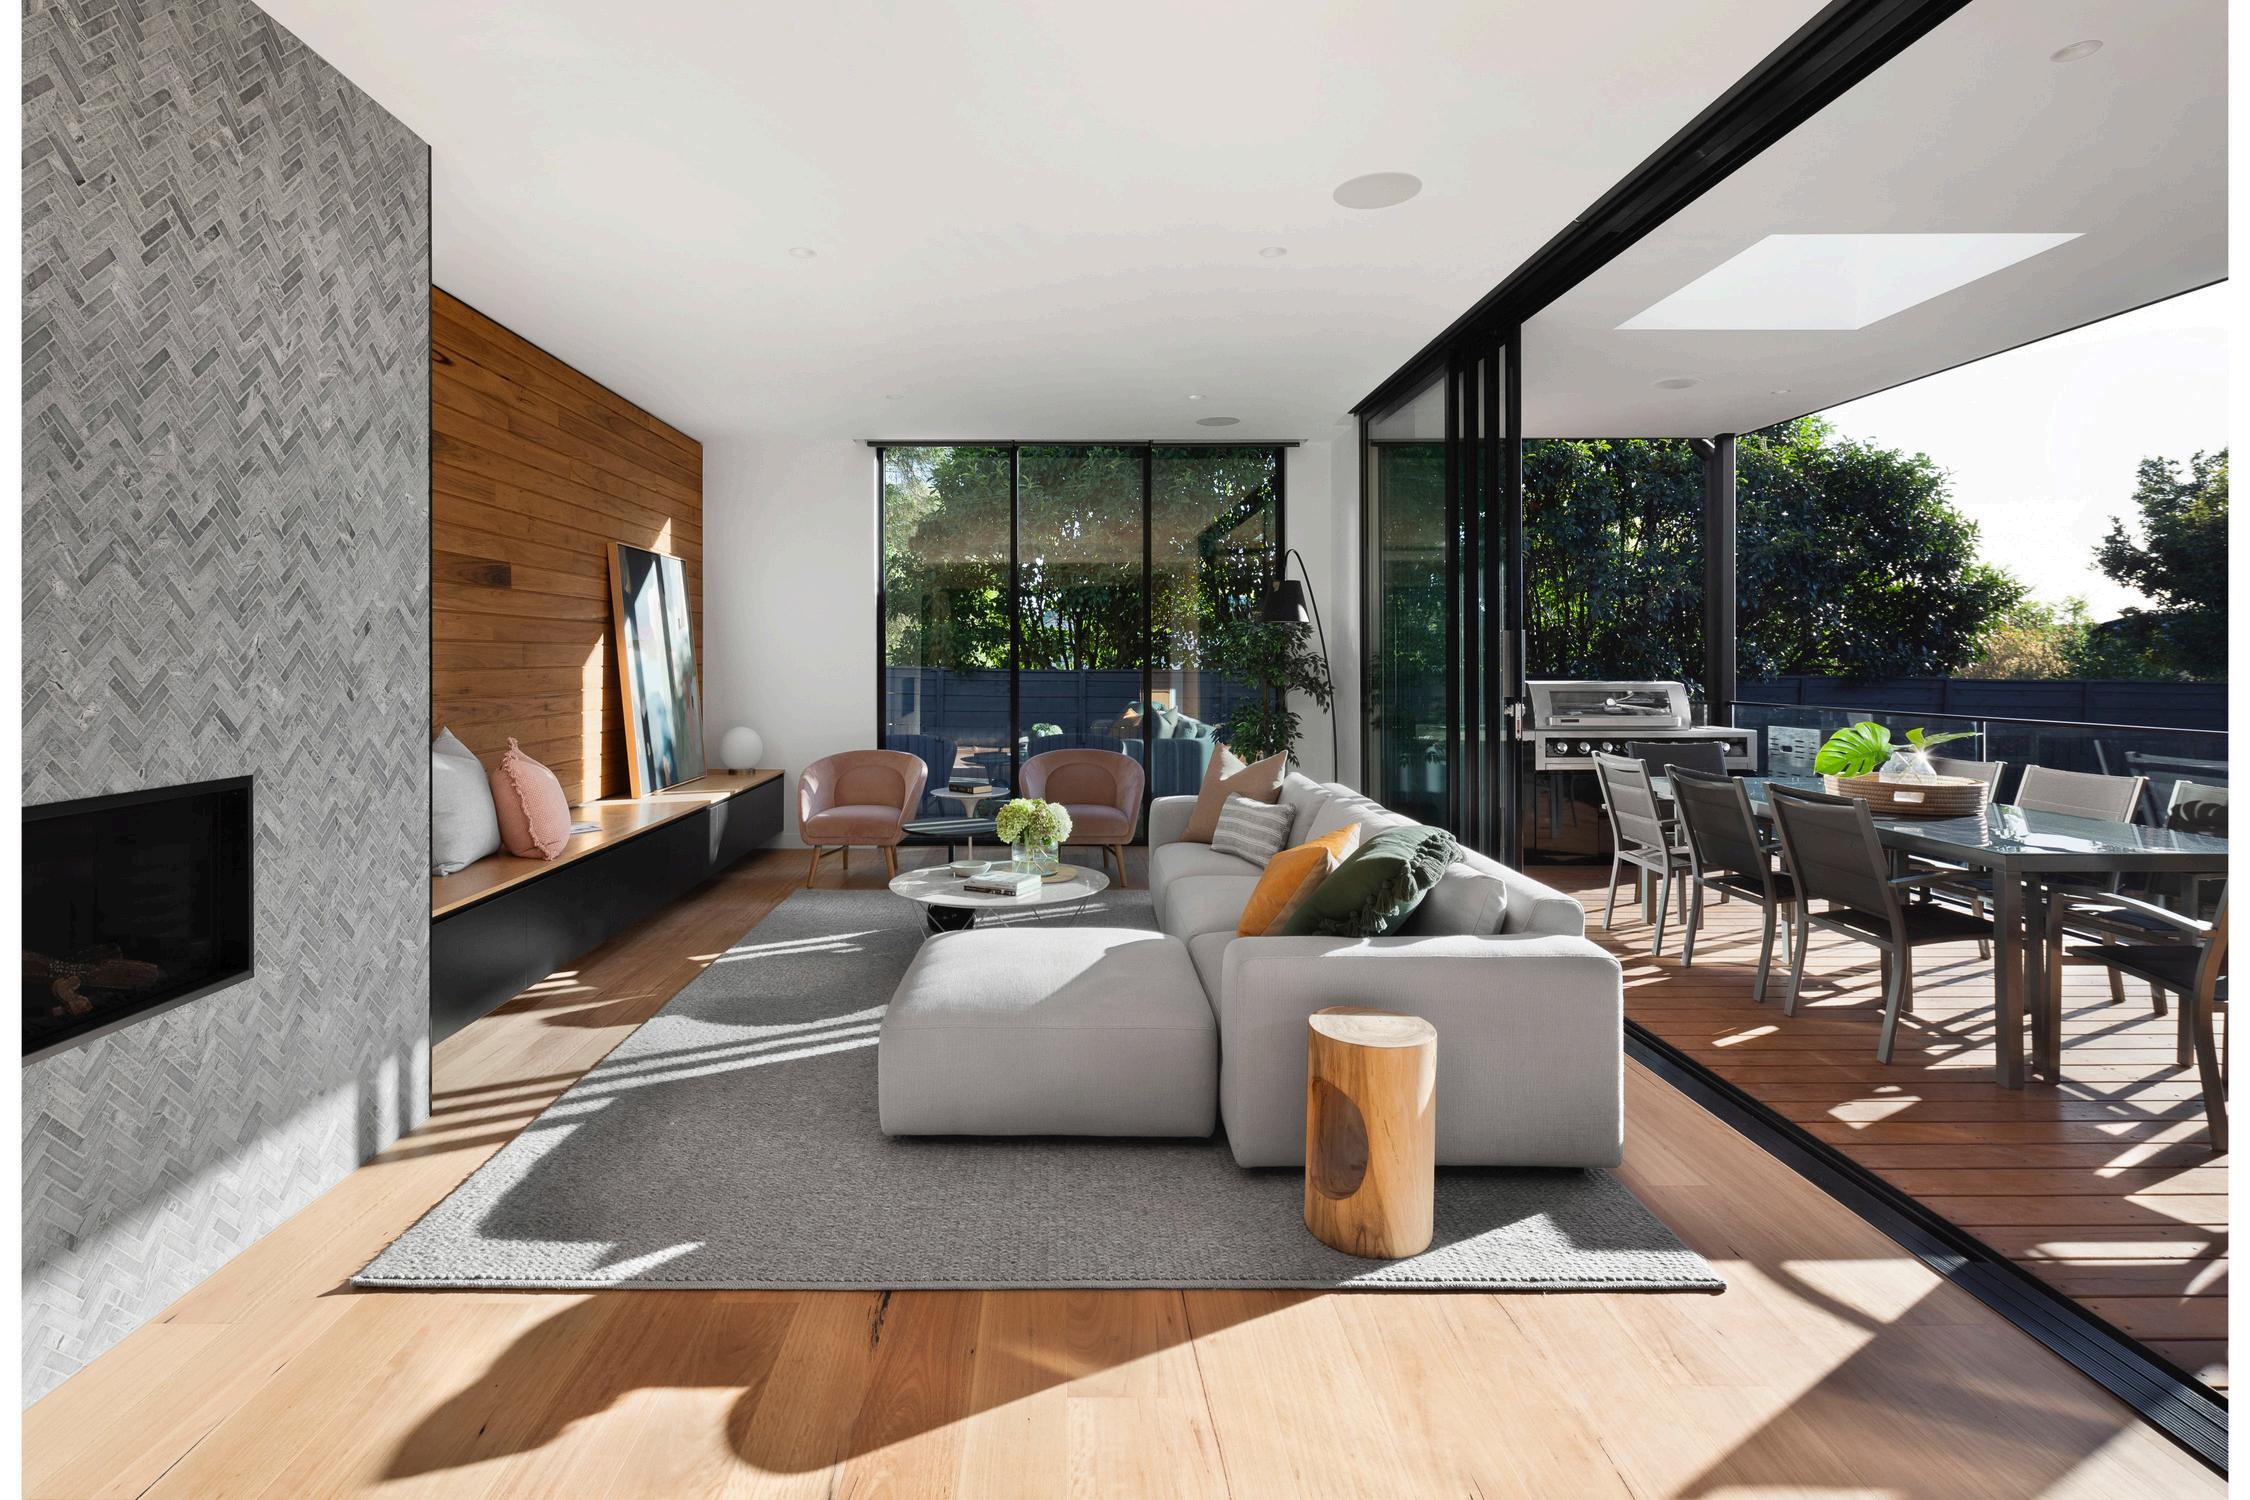
Open Living Area
Multipurpose area for relaxation and entertainment
Results and Impact
The completion of the Anenberg-Essert ADU led to several valuable outcomes:
Increased Property Value
The ADU addition significantly boosted property value
Flexible Living Space
A versatile space for family, guests, or as a rental
Modern Comforts
High-end finishes and amenities enhance both function and style.
Enhanced Family Living
The ADU enriches the AnenbergEssert family’s home with both privacy and connection
VENDOR DIRECTORY
When it comes to home ownership, knowing who you can trust is crucial. That's why we've curated a select list of trusted vendors who are ready to help with your home goals.