That's the question you should be asking yourself.
Our market is incredibly diverse and rapidly changing. Values vary not just by neighborhood but by street. Your home isn't necessarily worth what your neighbors' home is. It's the current market that sets the value of your home.
So, do you know what your home is worth in today's market?
Icanhelp...
Contact me for a confidential, no obligation assessment of your home's value.
If you’ve been putting off buying a home because you thought getting approved would be too hard, know this: qualifying for a mortgage is starting to get a bit more achievable, but lending standards are still strong.
Lenders are making it slightly easier for well-qualified buyers to access financing, which is opening more doors for people ready to make a move.
So, if strict requirements were holding you back, this shift could be the opportunity you’ve been waiting for, without repeating the risky lending practices that led to the housing crash back in 2008.
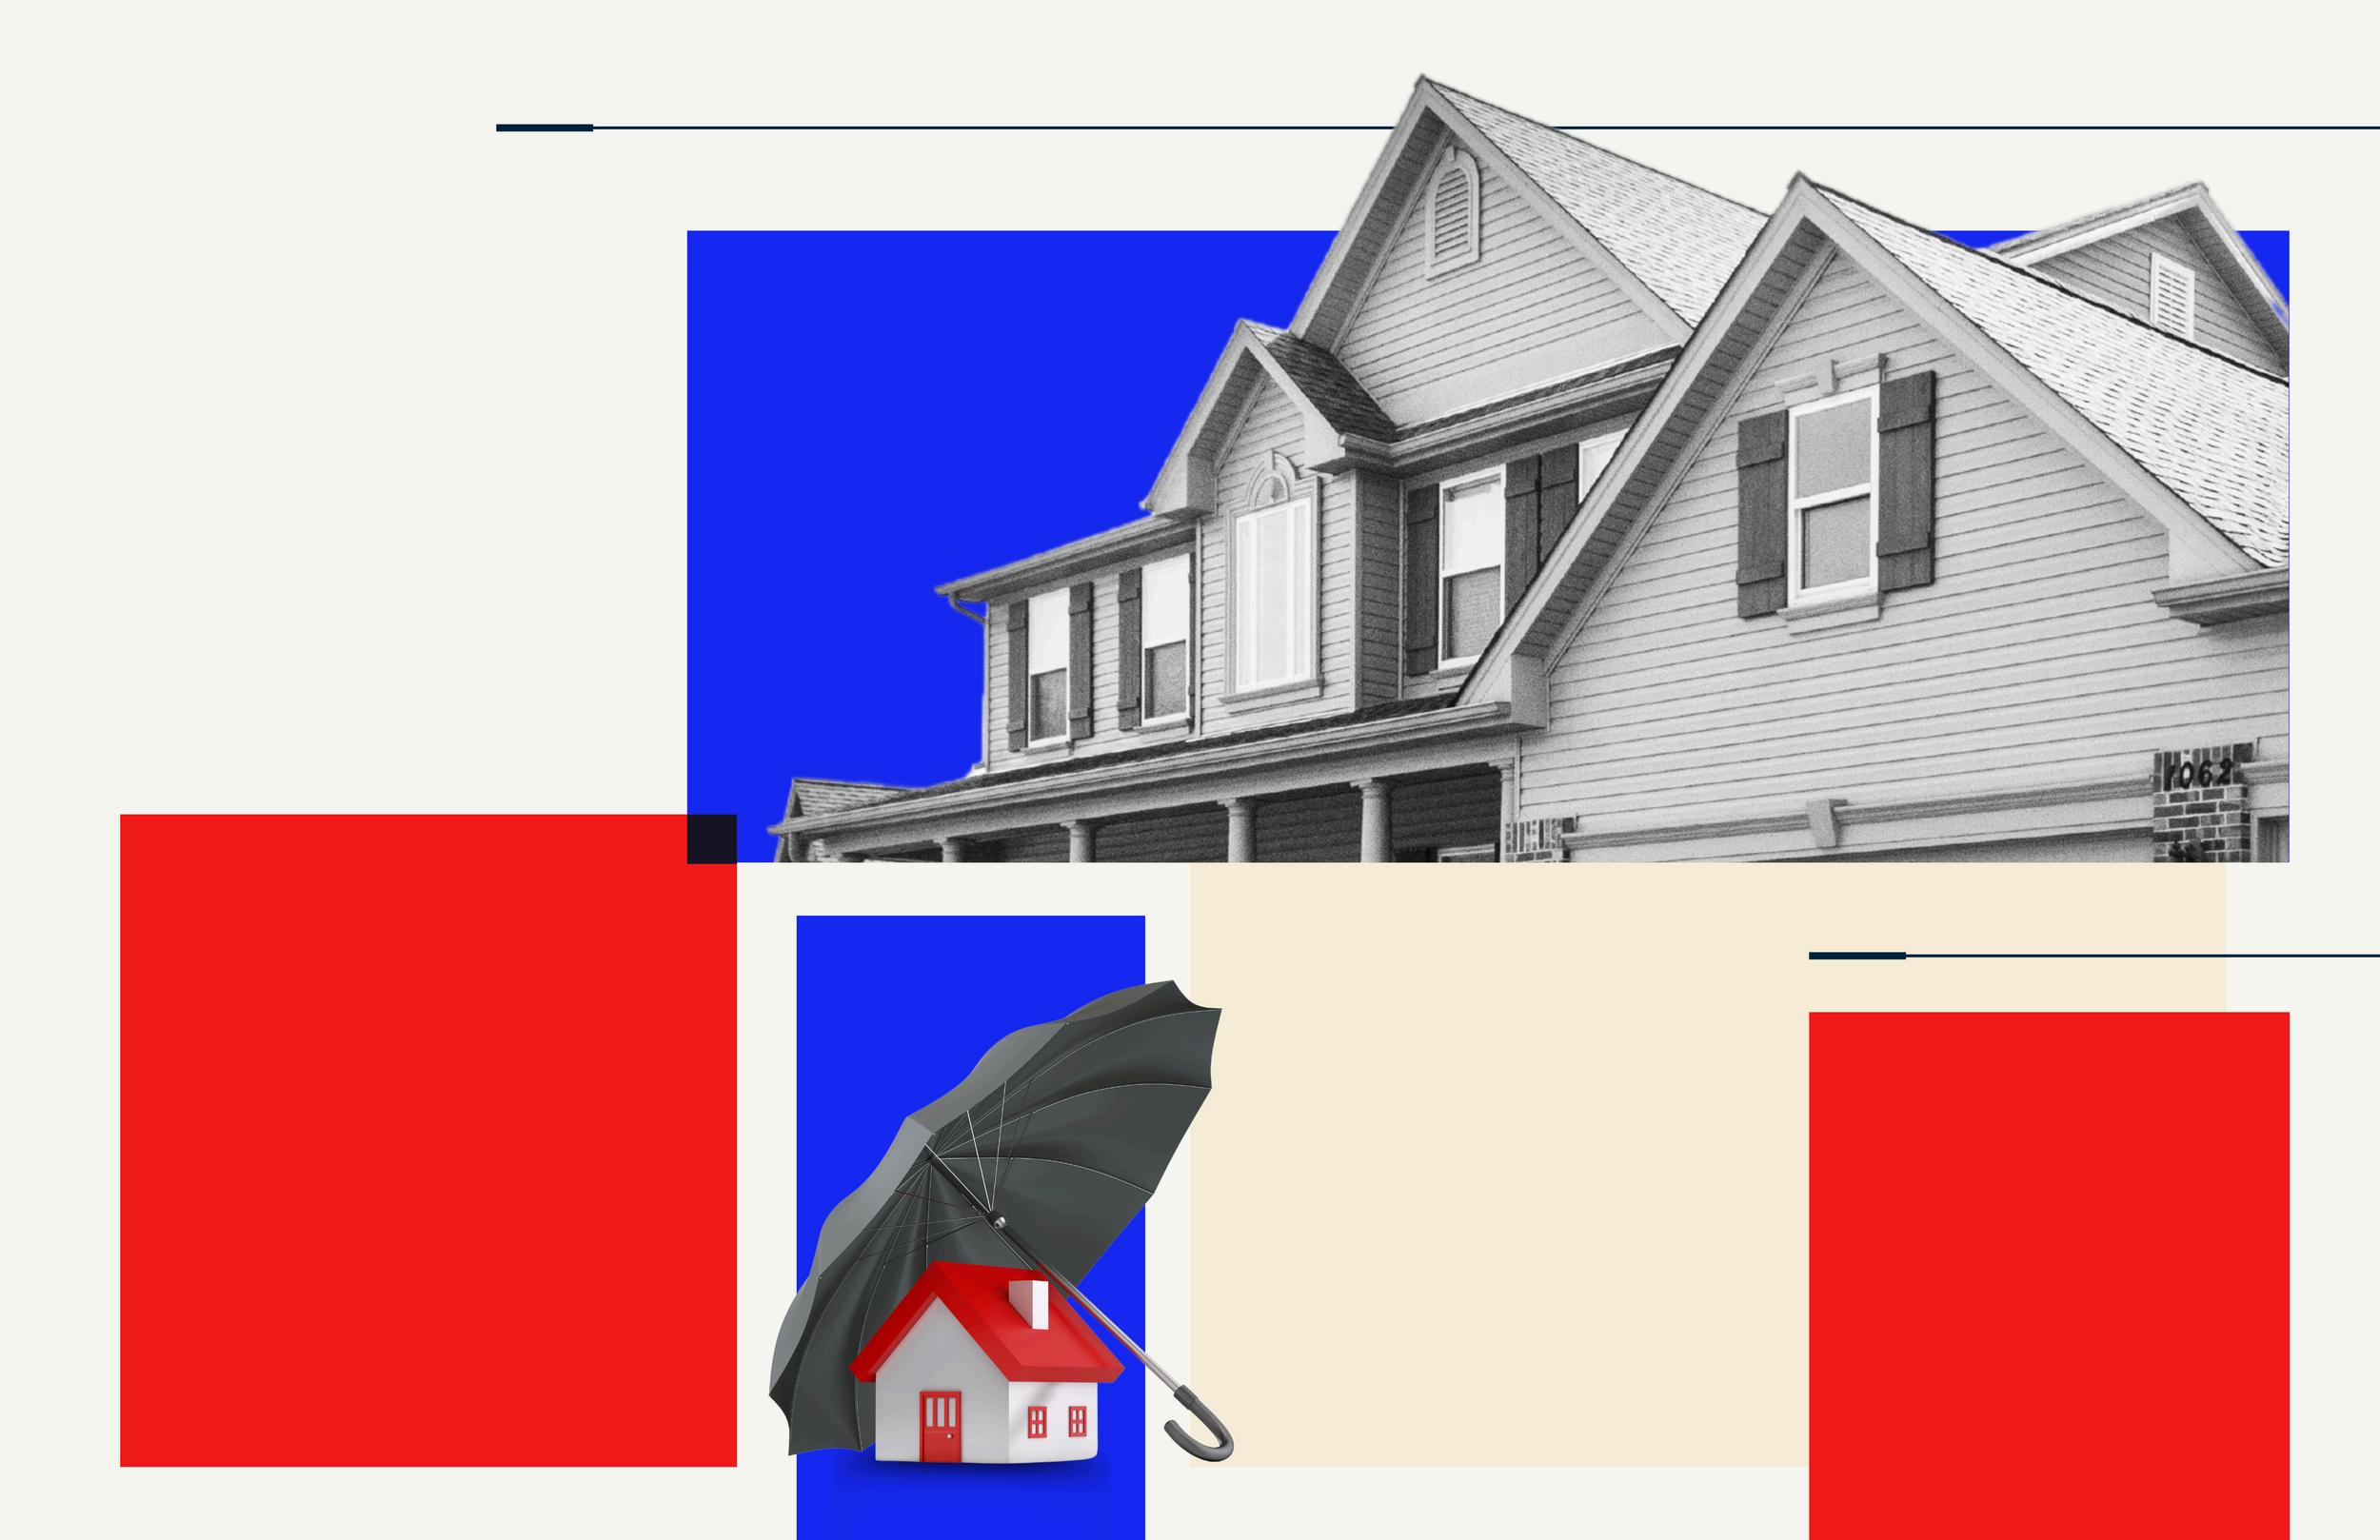
Smart Strategies for a Mortgage Application
Avoid paying off debts or collections without professional advice.
Don't have your credit report pulled too many times - this can hurt your credit score. 3 4 5 6 1 2
Always consult your mortgage professional before making large financial moves. Use verified funds for deposits to prevent closing delays.
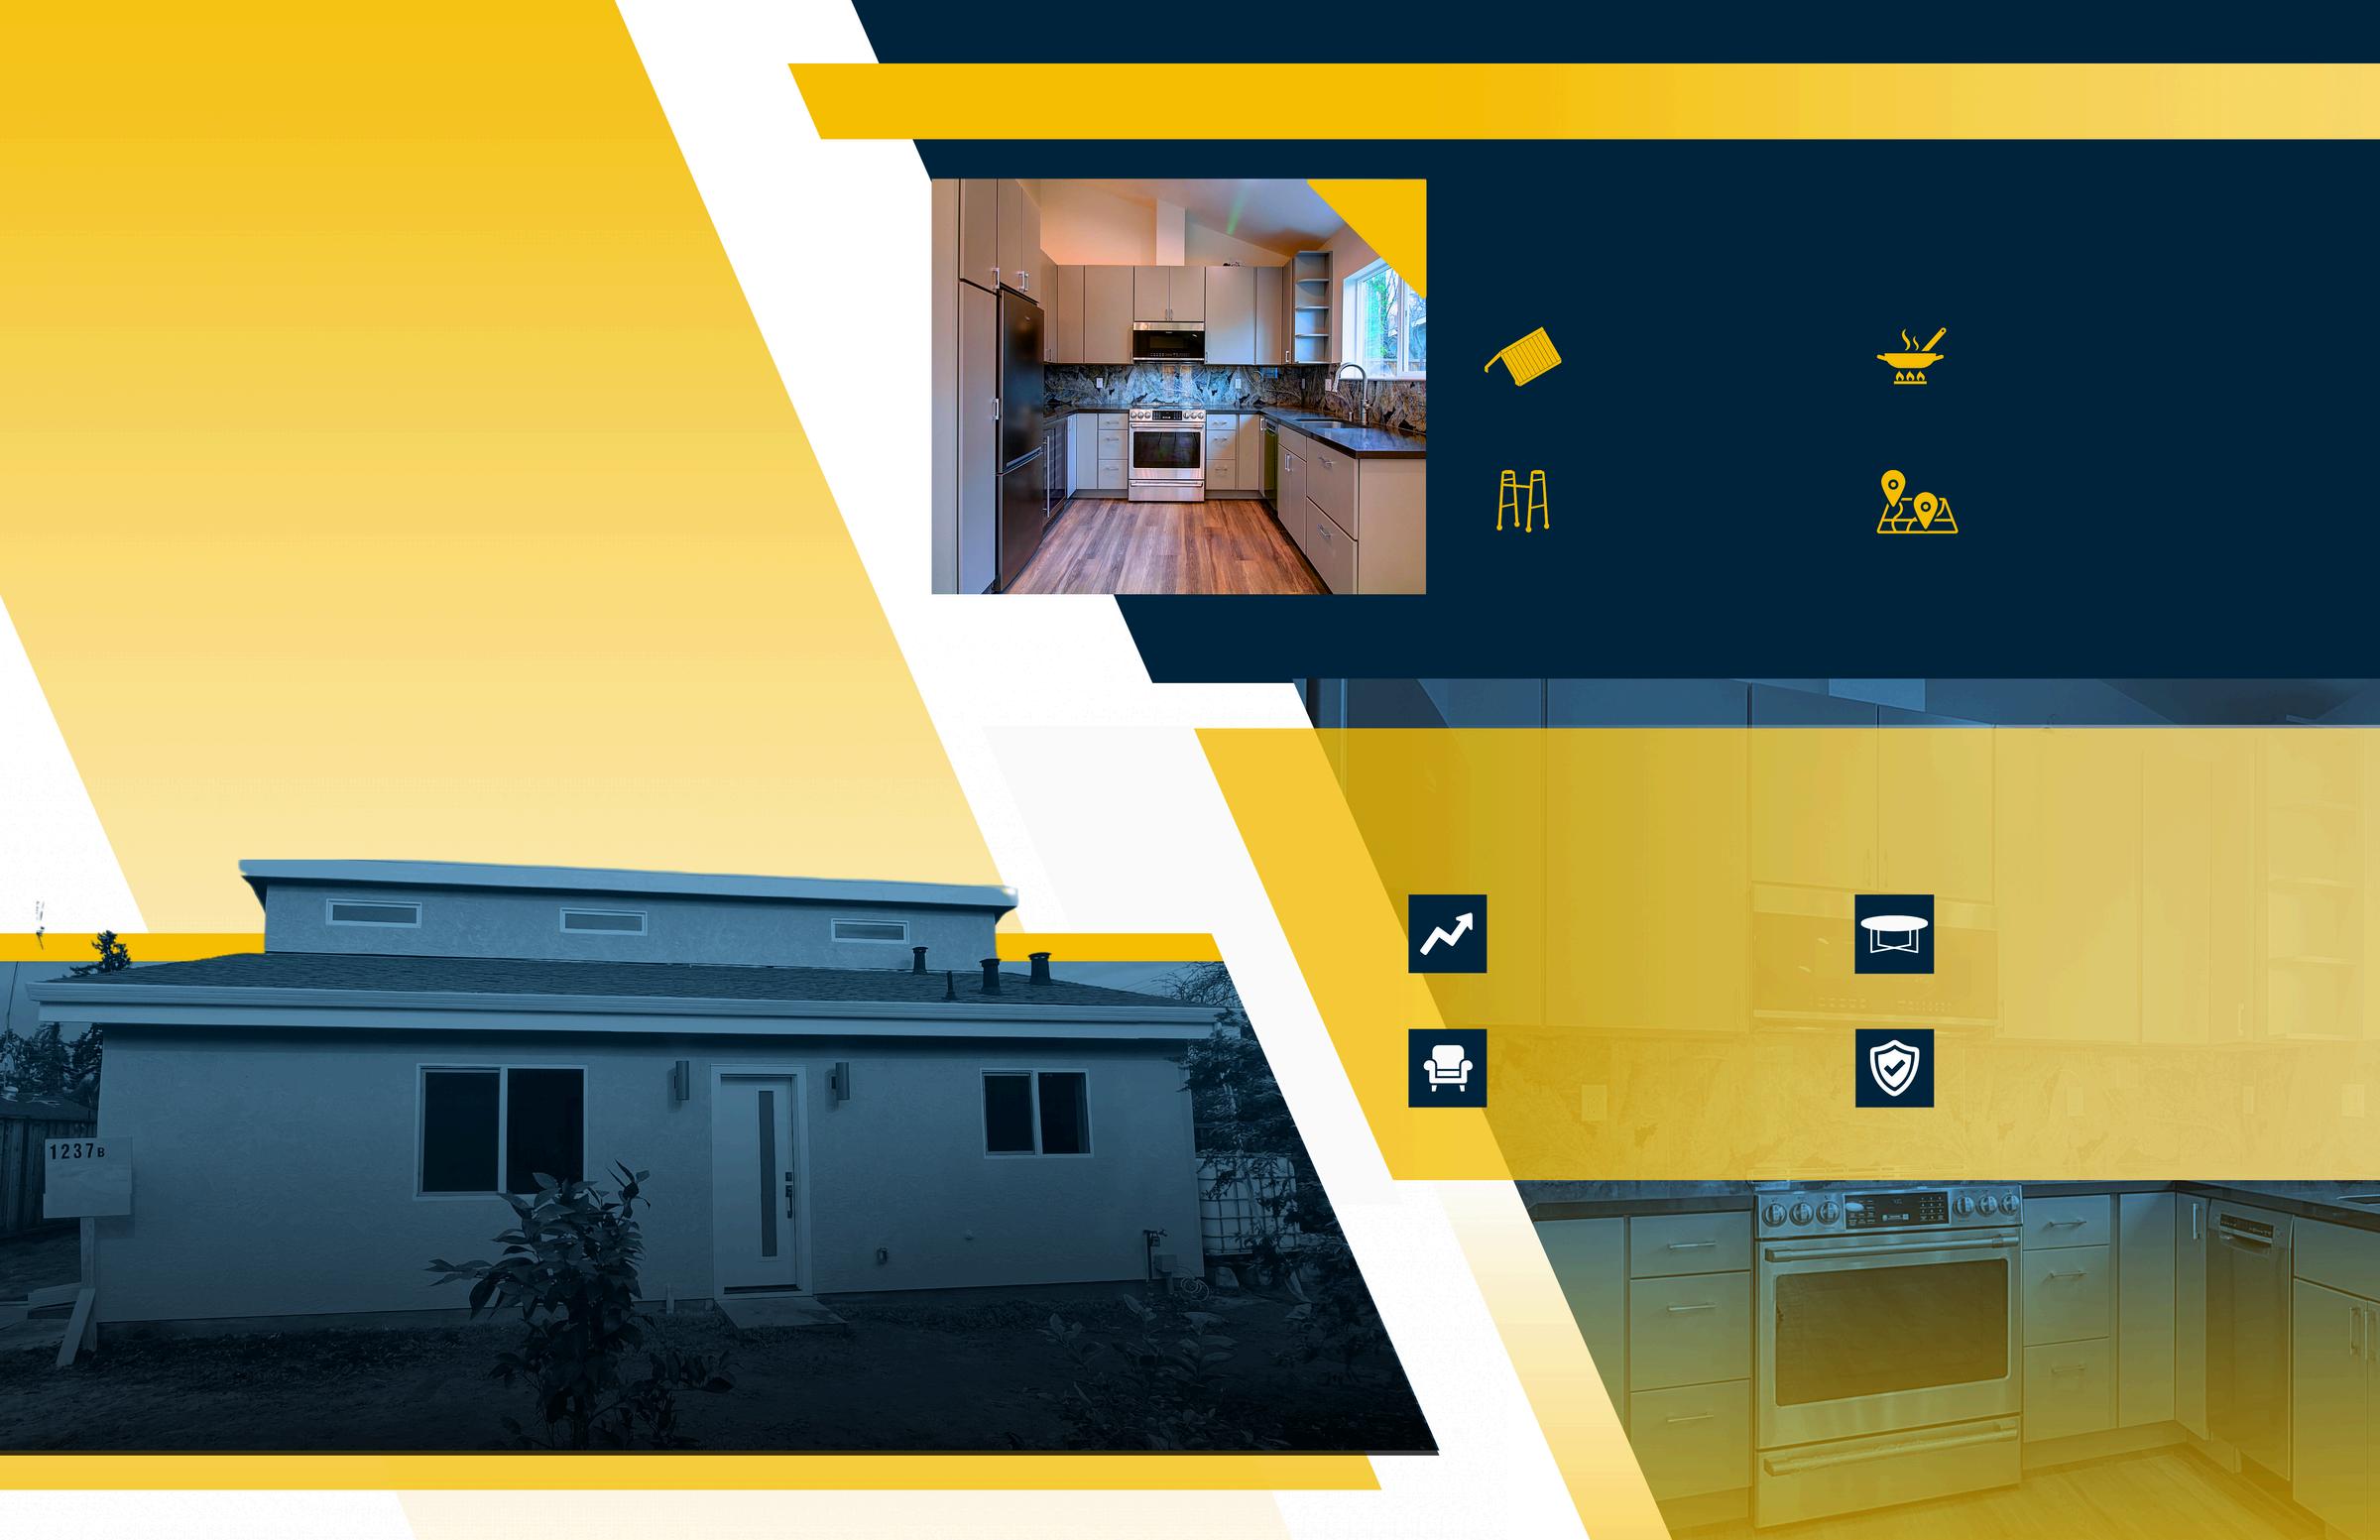
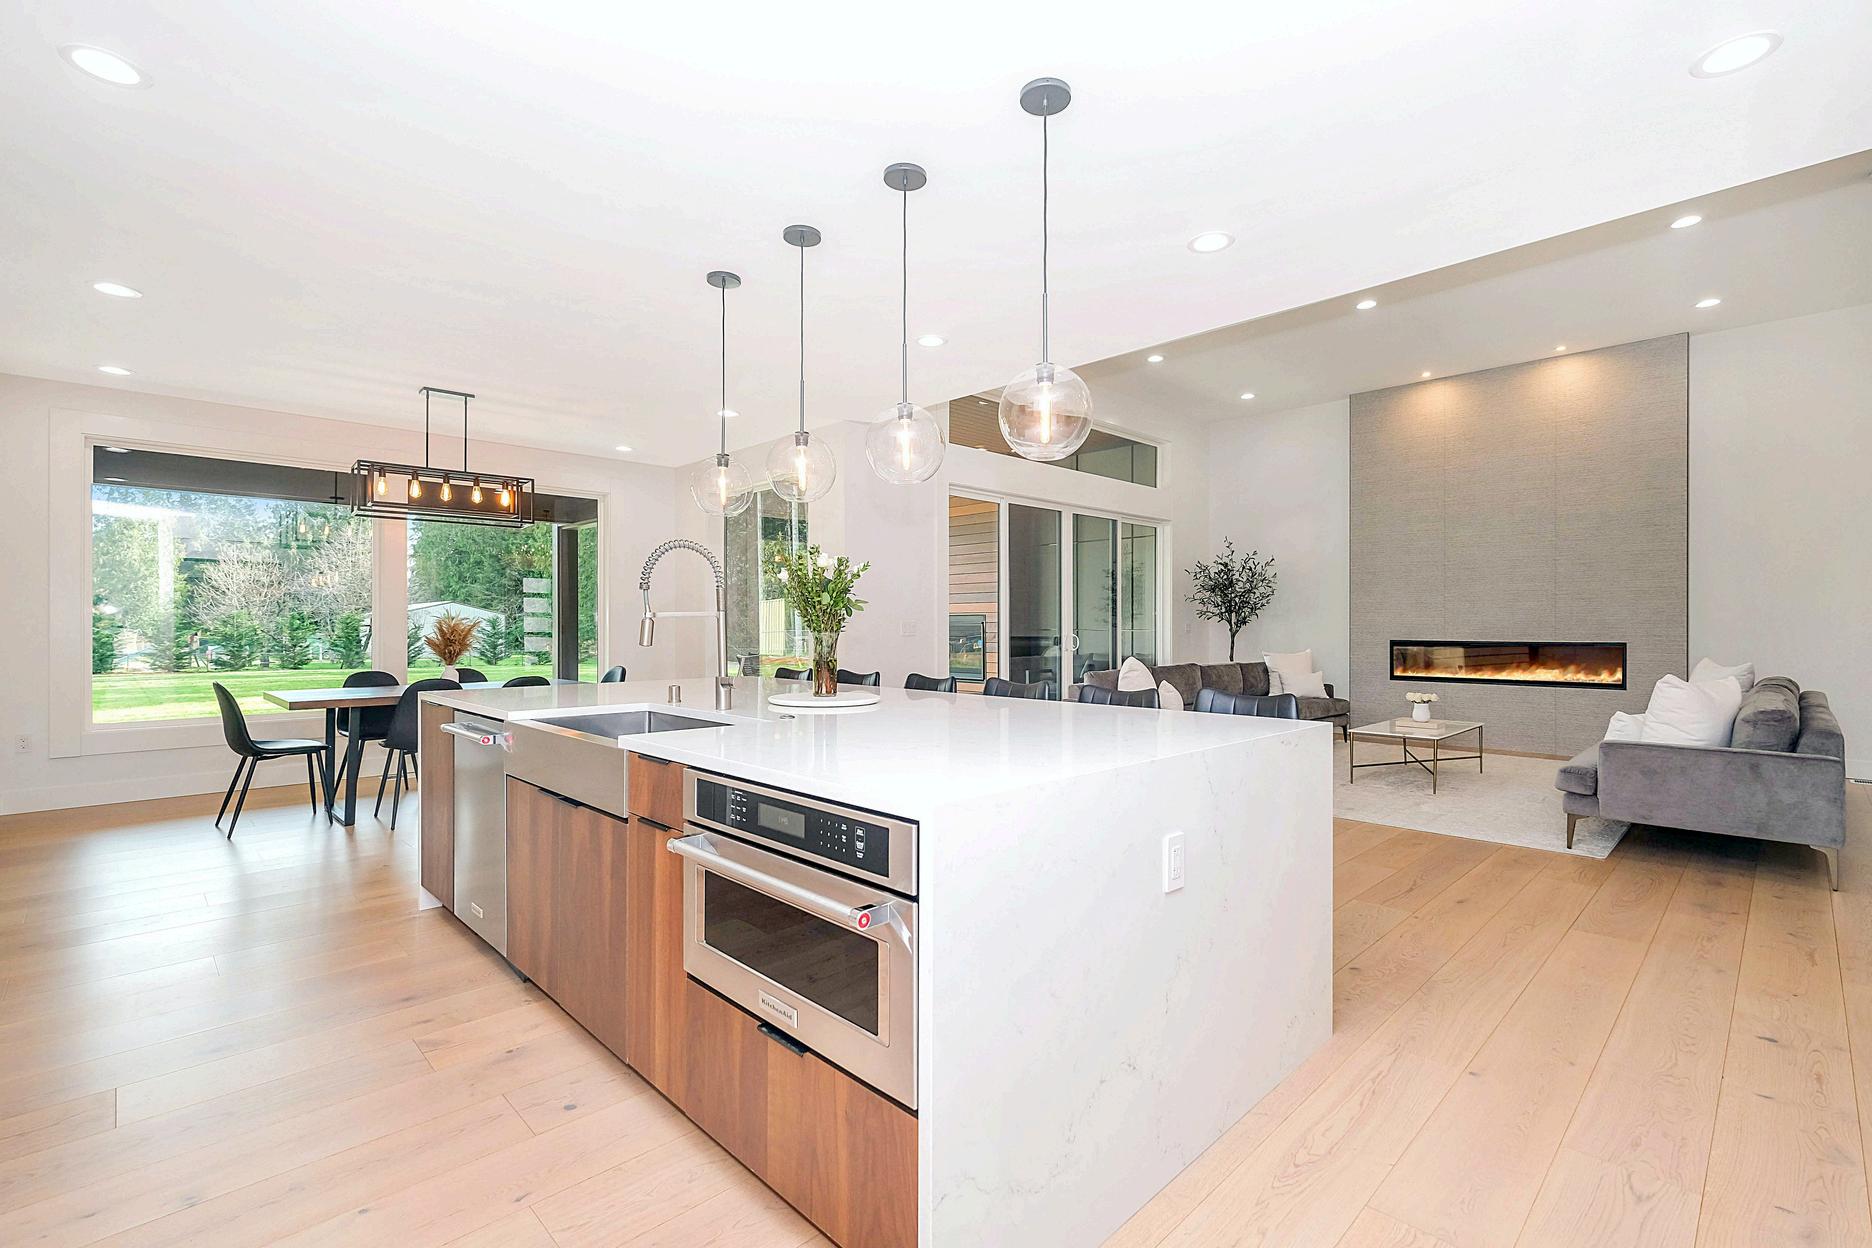
HomeRenovationsThatCanMakea BIG IMPACT AccordingtoExperts
Enhancing Property Value and Family Living Space with an Acton ADU
The Anenberg-Essert family in Campbell collaborated with Acton ADU to create a versatile, comfortable, and valuable addition to their property. This ADU project is a shining example of how a well-designed accessory dwelling unit can increase property value and serve a family’s unique needs.
GoalsandVision
The family envisioned an ADU that would function as an independent living space for family members, enhance their property’s worth, and provide seamless integration with the main home They wanted a space that balanced privacy with connectivity, feeling like a natural extension of their residence
Design and Construction Details
Constructed at 747 square feet, this ADU was designed with modern, high-quality finishes to serve both aesthetic and practical needs. Key features include:
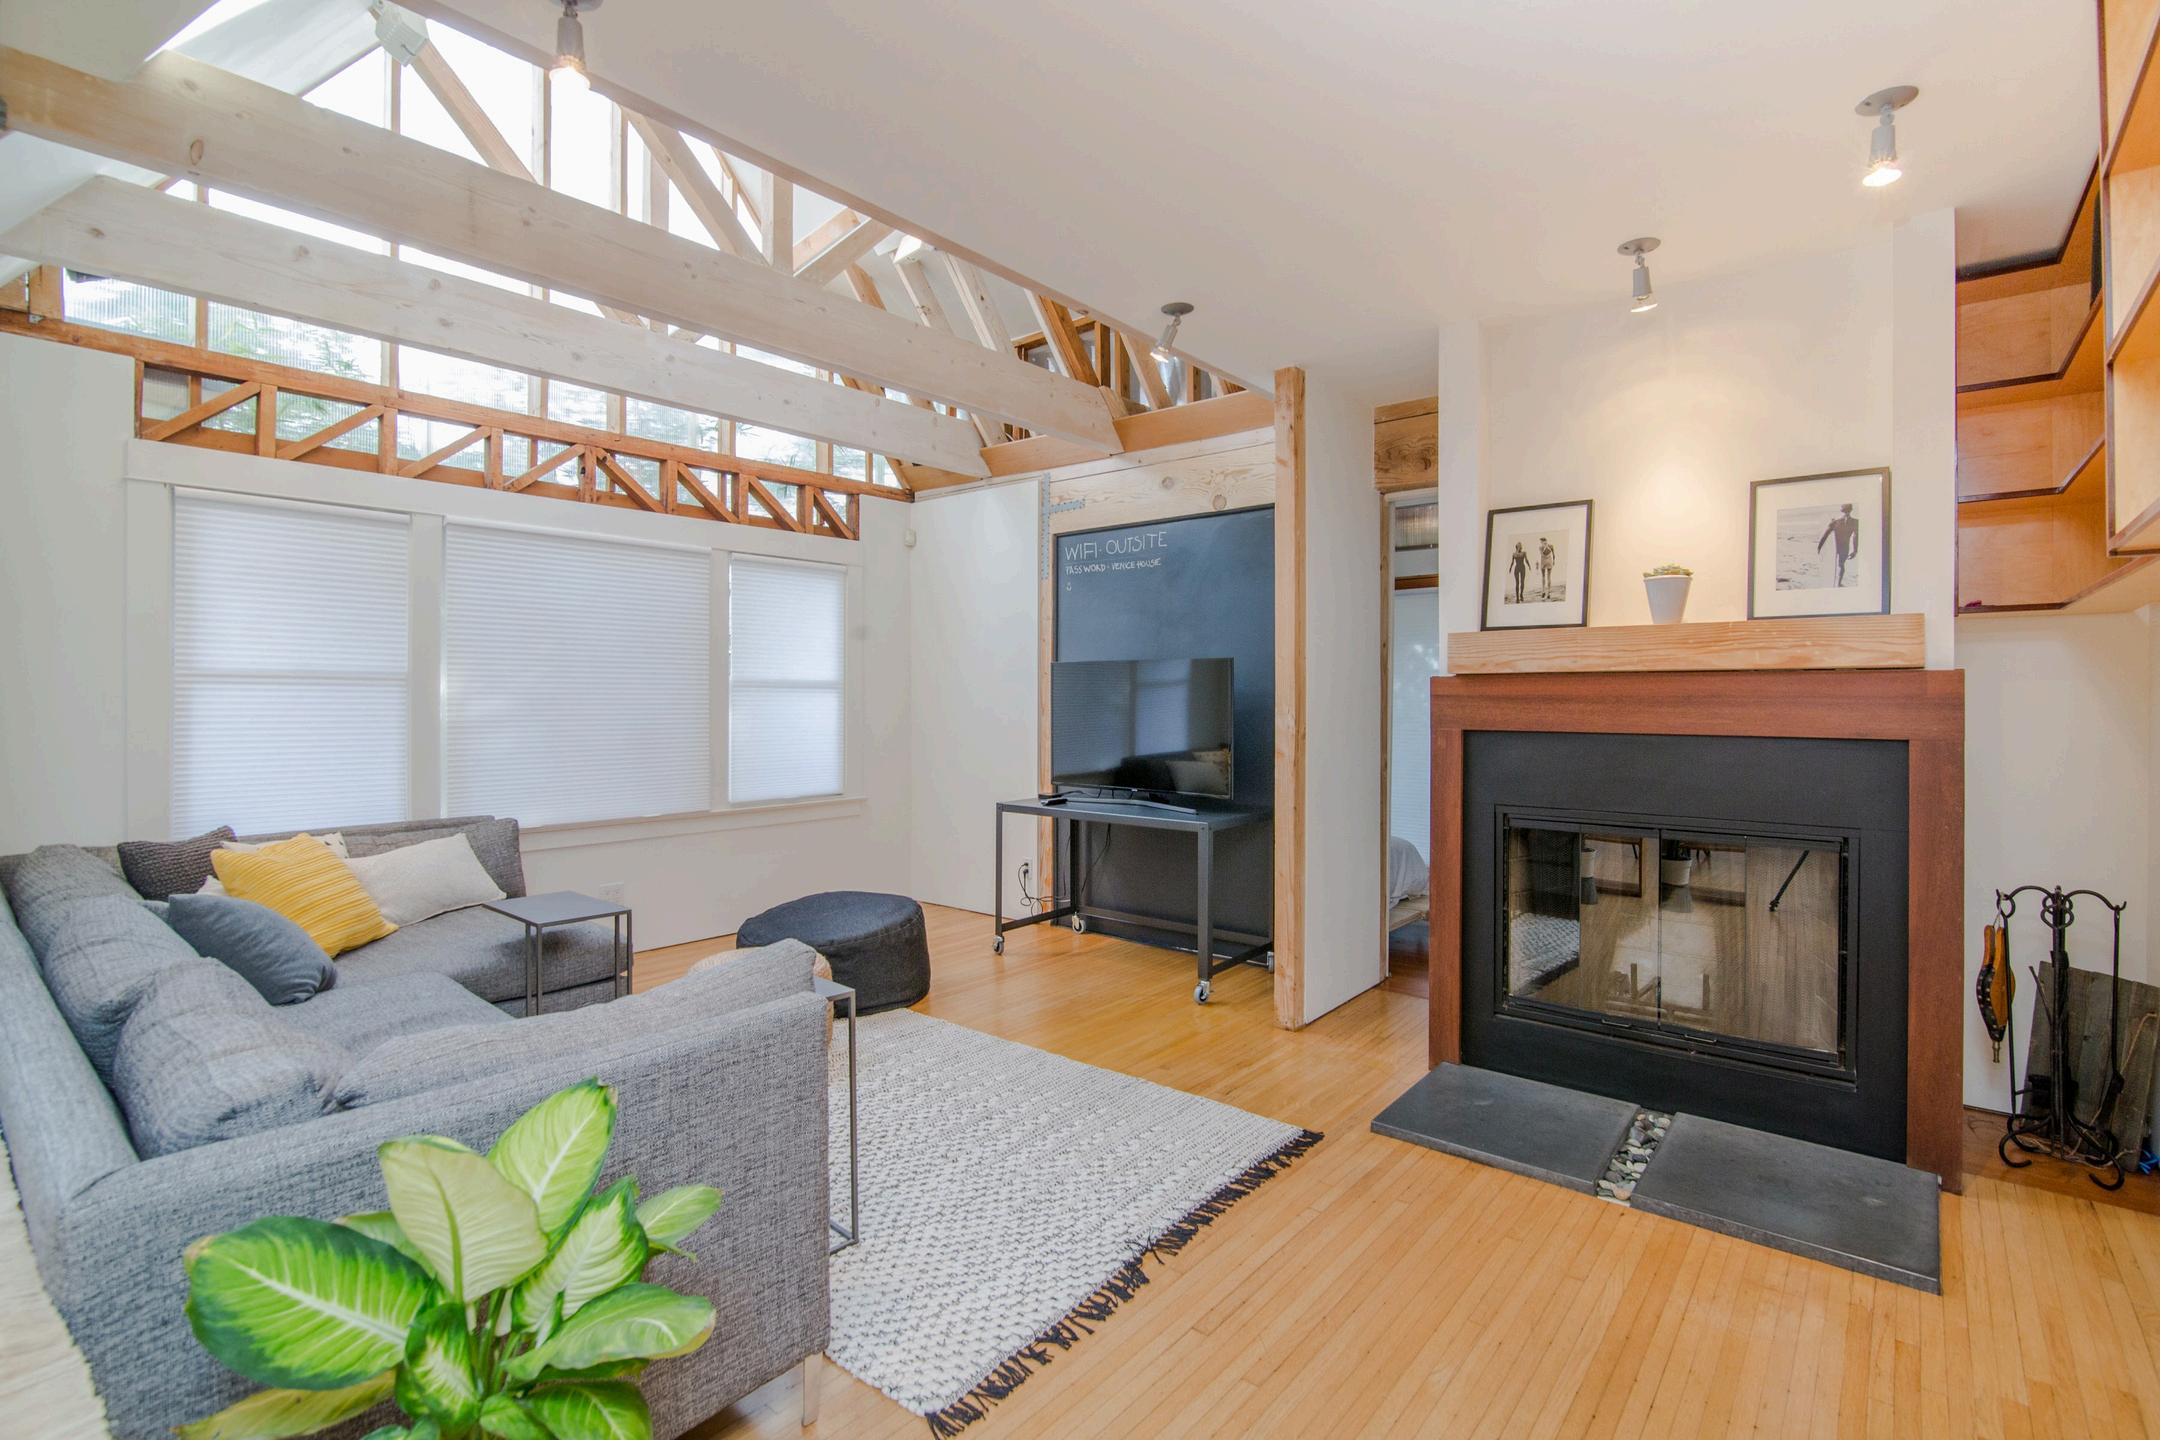
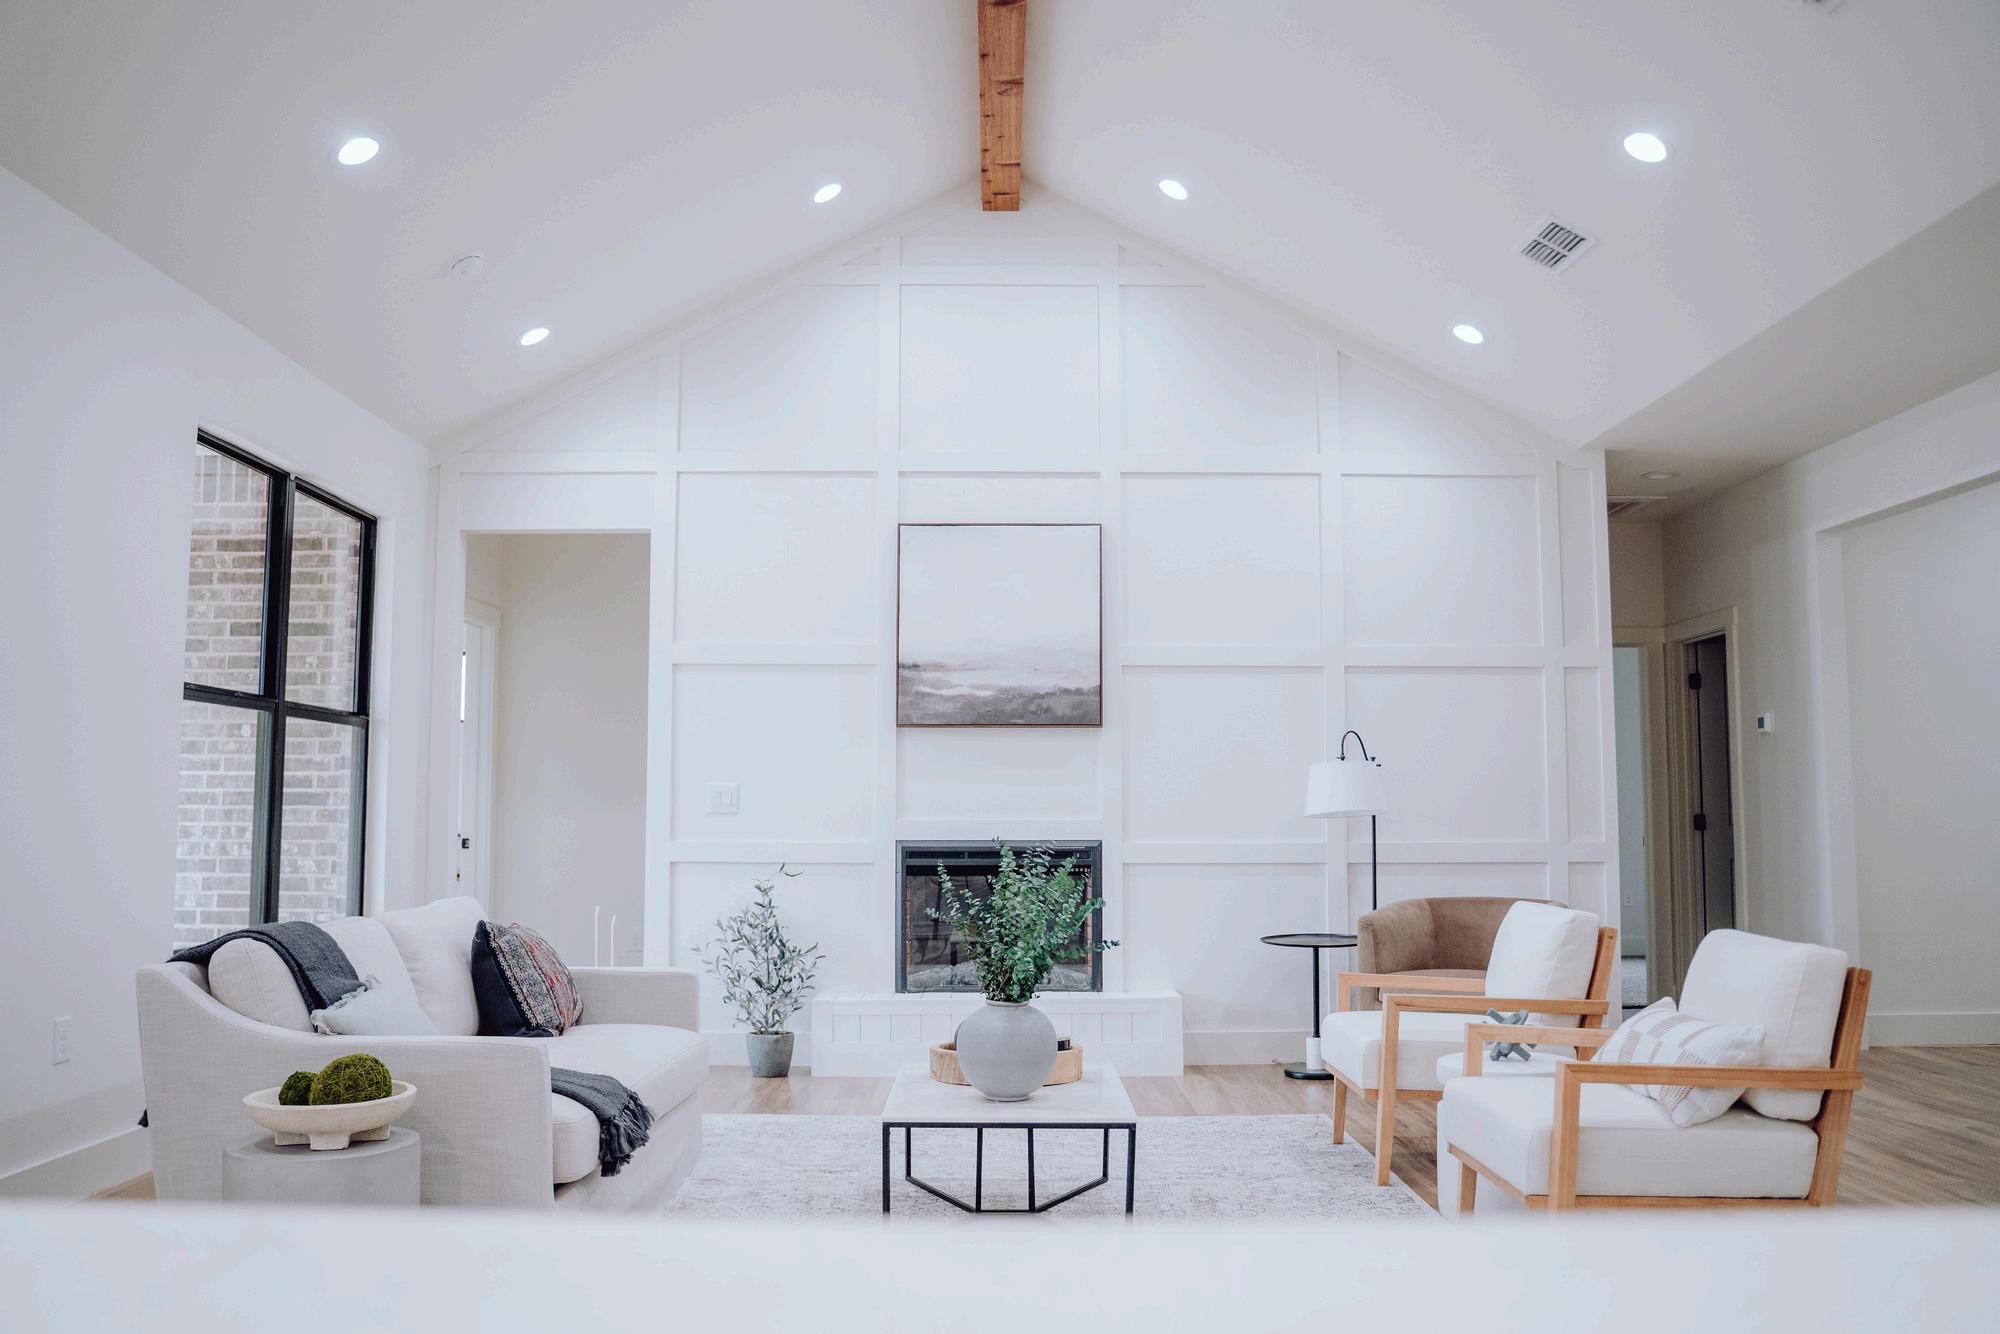
Vaulted Ceilings
Creates a spacious, open atmosphere
Senior-Friendly Living
Safe, independent space for elderly family members
Fully Equipped Kitchen
Modern amenities for everyday convenience
Open Living Area
Multipurpose area for relaxation and entertainment
Results and Impact
The completion of the Anenberg-Essert ADU led to several valuable outcomes:
Increased Property Value
The ADU addition significantly boosted property value
Flexible Living Space
A versatile space for family, guests, or as a rental
Modern Comforts
High-end finishes and amenities enhance both function and style.
Enhanced Family Living
The ADU enriches the AnenbergEssert family’s home with both privacy and connection
VENDOR DIRECTORY
When it comes to home ownership, knowing who you can trust is crucial. That's why we've curated a select list of trusted vendors who are ready to help with your home goals.
PaloAlto
What's in the Palo Alto data?
There were 66 single-family homes for sale, providing 1.8 months of inventory. There were 42 new listings, and 37 homes sold at a median price of $3.7m. The median overbid percentage was at 105.3%, with an average of 16 days on the market.
There were 33 condo and townhome units for sale, providing 3.7 months of inventory. There were 11 new listings and 9 units sold at a median sale price of $1.7m. The median overbid percentage was at 112.8%, with an average of 27 days on the market.
Single-Family Homes
42 New Listings
37 Sold Listings
1.8 Months of Inventory
$3.7M
Median Sale Price
105.3%
Median Sale vs List
16 Avg Days on Market
The data, sourced from Courted.io, includes all single-family homes, condos and townhomes in the California Area above from June 2024 to June 2025. This may include preliminary data, and may vary from the time the data was gathered. All data is deemed reliable but not guaranteed. DRE# 01511642. Copyright KW Advisors Palo Alto 2025. Each office is independently owned and operated.
New Listings
9
Sold Listings
3.7
Months of Inventory
$1.7M
Median Sale Price
112.8%
Median Sale vs List
27 Avg Days on Market
PaloAlto
JUNE 2024 - JUNE 2025
Single-Family Homes
Last 12 months, year-over-year.
Condos & Townhomes
Last 12 months, year-over-year
Median SalesPrice
Single-Family Homes
The median sale price has decreased from $3 9m last June 2024, to $3 7m as of June 2025
Condos & Townhomes
The median sale price has increased from $1 3m last June 2024, to $1 7m as of June 2025
AVGDays OntheMarket
Single-Family Homes
The average time spent on the market went down from 24 days last June 2024, to 16 days as of June 2025
Condos & Townhomes
The average time spent on the market went down from 30 days in June 2024, to 27 days as of June 2025.
Overbids
Single-Family Homes
The overbid percentage has increased from 104 5% last June 2024, to 105 3% a year later
Condos & Townhomes
The overbid percentage has increased from 98.7% last June 2024, to 112.8% a year later.
Redwood City
What's in the Redwood City data?
There were 73 single-family homes for sale, providing 2.1 months of inventory. There were 37 new listings, and 35 homes sold at a median price of $2.3m. The median overbid percentage was at 100 4%, with an average of 23 days on the market
There were 24 condo and townhome units for sale, providing 2.7 months of inventory. There were 12 new listings and 9 units sold at a median sale price of $1.1m. The median overbid percentage was at 98%, with an average of 32 days on the market.
Single-Family Homes
37 New Listings
35 Sold Listings
2.1 Months of Inventory
$2.3M
Median Sale Price
100.4%
Median Sale vs List
23 Avg Days on Market
The data, sourced from Courted.io, includes all single-family homes, condos and townhomes in the California Area above from June 2024 to June 2025. This may include preliminary data, and may vary from the time the data was gathered. All data is deemed reliable but not guaranteed. DRE# 01511642. Copyright KW Advisors Palo Alto 2025. Each office is independently owned and operated.
Listings
2.7 Months of Inventory
Listings
woodCity
JUNE 2024 - JUNE 2025
Median SalesPrice
Single-Family Homes
The median sale price has increased from $2m last June 2024, to $2 3m as of June 2025
Condos & Townhomes
The median sale price has decreased from $1 4m last June 2024, to $1 1m as of June 2025
AVGDays OntheMarket
Single-Family Homes
The average time spent on the market went down from 30 days last June 2024, to 23 days as of June 2025
Condos & Townhomes
The average time spent on the market went down from 43 days in June 2024, to 32 days as of June 2025.
Overbids
Single-Family Homes
The overbid percentage has decreased from 106 4% last June 2024, to 100 4% a year later
Condos & Townhomes
The overbid percentage has decreased from 103.9% last June 2024, to 98% a year later.
Portola Valley
What's in the Portola Valley data?
There were 29 single-family homes for sale, providing 4.8 months of inventory. There were 5 new listings, and 6 homes sold at a median price of $2.9m. The median overbid percentage was at 99%, with an average of 60 days on the market
There was no data for condo and townhouse units for this month.
Single-Family Homes
5 New Listings
6 Sold Listings
4.8 Months of Inventory
$2.9M Median Sale Price
99%
Median Sale vs List
60 Avg Days on Market
The data, sourced from Courted.io, includes all single-family homes, condos and townhomes in the California Area above from June 2024 to June 2025. This may include preliminary data, and may vary from the time the data was gathered. All data is deemed reliable but not guaranteed. DRE# 01511642. Copyright KW Advisors Palo Alto 2025. Each office is independently owned and operated.
CONDO
Condo & Townhomes
No data available for June 2025.
PortolaValley
JUNE 2024 - JUNE 2025 LISTINGS FOR SALE
Single-Family Homes
Last 12 months, year-over-year.
No data for this month.
Condos & Townhomes
Last 12 months, year-over-year
Median SalesPrice
Single-Family Homes
The median sale price has decreased from $4 5m last June 2024, to $2 9m as of June 2025
Condos & Townhomes
No data for this month
AVGDays OntheMarket
Single-Family Homes
The average time spent on the market went up from 37 days last June 2024, to 60 days as of June 2025
Condos & Townhomes
No data for this month
Overbids
Single-Family Homes
The overbid percentage has decreased from 108 3% last June 2024, to 99% a year later
Condos & Townhomes
No data for this month
Menlo
What's in the Men
There were 42 single-family providing 1.8 months of inve new listings, and 23 homes s of $3.1m. The median overb 101.5%, with an average of 2
There were 21 condo and tow sale, providing 5.3 months o were 10 new listings and 4 u sale price of $1m. The media was at 99.8%, with an averag market.
30 New Listings
1.8 Months of Inventory
101.5% Median Sale vs List
23 Sold Listings
$3.1M Median Sale Price
21 Avg Days on Market
single-family homes, condos and 2025. This may include gathered. All data is deemed Advisors Palo Alto 2025. Each
New Listings 5.3
Sold Listings
Months of Inventory $1M Median Sale Price 99.8%
Median Sale vs List 18 Avg Days on Market 4
Median SalesPrice
Single-Family Homes
The median sale price has decreased from $3 7m last June 2024, to $3 1m as of June 2025
Condos & Townhomes
The median sale price has decreased from $1 7m last June 2024, to $1m as of June 2025
AVGDays OntheMarket
Single-Family Homes
The average time spent on the market went down from 31 days last June 2024, to 21 days as of June 2025
Condos & Townhomes
The average time spent on the market went down from 41 days in June 2024, to 18 days as of June 2025.
Overbids
Single-Family Homes
The overbid percentage has decreased from 103 9% last June 2024, to 101 5% a year later
Condos & Townhomes
The overbid percentage has increased from 98.5% last June 2024, to 99.8% a year later.
Atherton
What's in the Atherton data?
There were 16 single-family homes for sale, providing 2.3 months of inventory. There were 2 new listings, and 7 homes sold at a median price of $13.7m. The median overbid percentage was at 95.8%, with an average of 40 days on the market.
There was no data for condo and townhouse units for this month.
2 New Listings
7 Sold Listings
2.3 Months of Inventory
$13.7M Median Sale Price
95.8% Median Sale vs List
40 Avg Days on Market
C Condo
No data available for June 2025.
No data for this month.
Median SalesPrice
Single-Family Homes
The median sale price has increased from $10 1m last June 2024, to $13 7m as of June 2025
Condos & Townhomes
No data for this month
AVGDays OntheMarket
Single-Family Homes
The average time spent on the market went down from 102 days last June 2024, to 40 days as of June 2025
Condos & Townhomes
No data for this month
Overbids
Single-Family Homes
The overbid percentage has decreased from 98 3% last June 2024, to 95 8% a year later
Condos & Townhomes
No data for this month
LosAltos
What's in the Los Altos data?
There were 27 single-family homes for sale, providing 0.8 months of inventory. There were 26 new listings, and 32 homes sold at a median price of $5m. The median overbid percentage was at 104.9%, with an average of 14 days on the market.
There were 8 condo and townhome units for sale, providing 1 month of inventory. There were 10 new listings and 8 units sold at a median sale price of $1.8m. The median overbid percentage was at 100.5%, with an average of 4 days on the market.
Single-Family Homes
26 New Listings
32 Sold Listings
0.8 Months of Inventory
$5M Median Sale Price
104.9%
Median Sale vs List
14 Avg Days on Market
The data, sourced from Courted.io, includes all single-family homes, condos and townhomes in the California Area above from June 2024 to June 2025. This may include preliminary data, and may vary from the time the data was gathered. All data is deemed reliable but not guaranteed. DRE# 01511642. Copyright KW Advisors Palo Alto 2025. Each office is independently owned and operated.
New Listings
8
Sold Listings
1
Month of Inventory
$1.8M
Median Sale Price
100.5%
Median Sale vs List
4 Avg Days on Market
Median SalesPrice
Single-Family Homes
The median sale price has increased from $4 7m last June 2024, to $5m as of June 2025
Condos & Townhomes
The median sale price has decreased from $1 85m last June 2024, to $1 84m as of June 2025
AVGDays OntheMarket
Single-Family Homes
The average time spent on the market went up from 12 days last June 2024, to 14 days as of June 2025
Condos & Townhomes
The average time spent on the market went down from 59 days in June 2024, to 4 days as of June 2025.
Overbids
Single-Family Homes
The overbid percentage has decreased from 110 4% last June 2024, to 104 9% a year later
Condos & Townhomes
The overbid percentage has increased from 99.6% last June 2024, to 100.5% a year later.
SanJos
What's in the San
There were 622 single-family providing 2 months of invent new listings, and 312 homes price of $1.7m. The median o was at 103.3%, with an avera market.
There were 459 condo and to sale, providing 4 5 months of were 206 new listings and 10 median sale price of $820k. T percentage was at 100.4%, w days on the market.
420 New Listings
2 Months of Inventory
103.3%
Median Sale vs List
312 Sold Listings
$1.7M Median Sale Price
19 Avg Days on Market
single-family homes, condos and 2025. This may include gathered. All data is deemed Advisors Palo Alto 2025. Each
New Listings
4.5
Sold Listings
Months of Inventory $820K Median Sale Price
100.4%
Median Sale vs List 34 Avg Days on Market 101
Median SalesPrice
Single-Family Homes
The median sale price has increased from $1 74m last June 2024, to $1 75m as of June 2025
Condos & Townhomes
The median sale price has decreased from $865k last June 2024, to $820k as of June 2025
AVGDays OntheMarket
Single-Family Homes
The average time spent on the market went down from 28 days last June 2024, to 19 days as of June 2025
Condos & Townhomes
The average time spent on the market went down from 35 days in June 2024, to 34 days as of June 2025.
Overbids
Single-Family Homes
The overbid percentage has decreased from 108% last June 2024, to 103 3% a year later
Condos & Townhomes
The overbid percentage has decreased from 103.8% last June 2024, to 100.4% a year later.
He-Family Homes
23 New Listings
26 Sold Listings
1 Month of Inventory
$3M Median Sale Price
107% Median Sale vs List
18 Avg Days on Market
sourced from Courted.io, includes all single-family homes, condos and in the California Area above from June 2024 to June 2025. This may include data, and may vary from the time the data was gathered. All data is deemed not guaranteed. DRE# 01511642. Copyright KW Advisors Palo Alto 2025. Each office is independently owned and operated.
New Listings
22
Sold Listings
2.9
Months of Inventory $1.5M
102.4%
Median Sale Price
Median Sale vs List 27 Avg Days on Market
Median SalesPrice
Single-Family Homes
The median sale price has increased from $2 5m last June 2024, to $3m as of June 2025
Condos & Townhomes
The median sale price has increased from $1 2m last June 2024, to $1 5m as of June 2025
AVGDays OntheMarket
Single-Family Homes
The average time spent on the market went down from 24 days last June 2024, to 18 days as of June 2025
Condos & Townhomes
The average time spent on the market went down from 38 days in June 2024, to 27 days as of June 2025.
Overbids
Single-Family Homes
The overbid percentage has decreased from 108 1% last June 2024, to 107% a year later
Condos & Townhomes
The overbid percentage has decreased from 104.6% last June 2024, to 102.4% a year later.
SanMate County
What's in the San Mate data?
There were 562 single-family homes providing 2.2 months of inventory. Th new listings, and 259 homes sold at price of $2.1m. The median overbid p was at 102 7%, with an average of 25 market.
There were 299 condo and townhom sale, providing 4.5 months of invento were 128 new listings and 67 units s median sale price of $875k. The med percentage was at 98.8%, with an av days on the market
334 New Listings
259 Sold Listings
2.2 Months of Inventory
$2.1M Median Sale Price
102.7%
Median Sale vs List
25 Avg Days on Market
single-family homes, condos and 2024 to June 2025. This may include data was gathered. All data is deemed Copyright KW Advisors Palo Alto 2025. Each
128
New Listings
67 Sold Listings
4.5
Months of Inventory
$875K
Median Sale Price 98.8%
Median Sale vs List 41 Avg Days on Market
SanMateo
JUNE 2024 - JUNE 2025
LISTINGS FOR SALE SOLD LISTINGS
Single-Family Homes
Last 12 months, year-over-year.
Condos & Townhomes
Last 12 months, year-over-year
Median SalesPrice
Single-Family Homes
The median sale price has increased from $2 12m last June 2024, to $2 13m as of June 2025
Condos & Townhomes
The median sale price has decreased from $1 1m last June 2024, to $875k as of June 2025
AVGDays OntheMarket
Single-Family Homes
The average time spent on the market went down from 35 days last June 2024, to 25 days as of June 2025
Condos & Townhomes
The average time spent on the market went down from 46 days in June 2024, to 41 days as of June 2025.
Overbids
Single-Family Homes
The overbid percentage has decreased from 106 9% last June 2024, to 102 7% a year later
Condos & Townhomes
The overbid percentage has decreased from 101.3% last June 2024, to 98.8% a year later.
SantaClara County
What's in the Santa Clara County data?
There were 1,259 single-family homes for sale, providing 1.9 months of inventory. There were 854 new listings, and 647 homes sold at a median price of $2.1m. The median overbid percentage was at 103 8%, with an average of 20 days on the market.
There were 847 condo and townhome units for sale, providing 3.7 months of inventory. There were 393 new listings and 229 units sold at a median sale price of $990k. The median overbid percentage was at 101.5%, with an average of 30 days on the market
854 New Listings
mily Homes
647 Sold Listings
1.7 Months of Inventory
$2.1M Median Sale Price
103.8%
Median Sale vs List
20 Avg Days on Market
Courted.io, includes all single-family homes, condos and California Area above from June 2024 to June 2025. This may include vary from the time the data was gathered. All data is deemed guaranteed. DRE# 01511642. Copyright KW Advisors Palo Alto 2025. Each office is independently owned and operated.
Condo & Townhomes
393
New Listings
229
Sold Listings
3.7
Months of Inventory
$990K
Median Sale Price
101.5%
Median Sale vs List
30 Avg Days on Market
SantaClaraCounty
JUNE 2024 - JUNE 2025
LISTINGS FOR SALE SOLD LISTINGS
gle-Family Homes
t 12 months, year-over-year.
ndos & Townhomes
t 12 months, year-over-year
Median SalesPrice
Single-Family Homes
The median sale price has increased from $1 9m last June 2024, to $2 1m as of June 2025
Condos & Townhomes
The median sale price has decreased from $1m last June 2024, to $990k as of June 2025
AVGDays OntheMarket
Single-Family Homes
The average time spent on the market went down from 28 days last June 2024, to 20 days as of June 2025
Condos & Townhomes
The average time spent on the market went down from 36 days in June 2024, to 30 days as of June 2025.
Overbids
Single-Family Homes
The overbid percentage has decreased from 107 1% last June 2024, to 103 8% a year later
Condos & Townhomes
The overbid percentage has decreased from 104.3% last June 2024, to 101.5% a year later.
Monterey County
What's in the Monterey County data?
There were 498 single-family homes for sale, providing 4.3 months of inventory. There were 182 new listings, and 117 homes sold at a median price of $1m. The median overbid percentage was at 98 4%, with an average of 60 days on the market.
There were 80 condo and townhome units for sale, providing 4.7 months of inventory. There were 30 new listings and 17 units sold at a median sale price of $1m. The median overbid percentage was at 97.3%, with an average of 70 days on the market
182 New Listings
117 Sold Listings
4.3 Months of Inventory
$1M Median Sale Price
98.4%
Median Sale vs List
60 Avg Days on Market
30
New Listings
17 Sold Listings
4.7
Months of Inventory
$1M
Median Sale Price 97.3%
Median Sale vs List 70 Avg Days on Market
MontereyCounty
JUNE 2024 - JUNE 2025 LISTINGS FOR SALE
Single-Family Homes
Last 12 months, year-over-year.
Condos & Townhomes
Last 12 months, year-over-year
Median SalesPrice
Single-Family Homes
The median sale price has increased from $1 03m last June 2024, to $1 04m as of June 2025
Condos & Townhomes
The median sale price has increased from $950k last June 2024, to $1m as of June 2025
AVGDays OntheMarket
Single-Family Homes
The average time spent on the market went up from 54 days last June 2024, to 60 days as of June 2025
Condos & Townhomes
The average time spent on the market went down from 79 days in June 2024, to 70 days as of June 2025.
Overbids
Single-Family Homes
The overbid percentage has decreased from 99 6% last June 2024, to 98 4% a year later
Condos & Townhomes
The overbid percentage has decreased from 97.6% last June 2024, to 97.3% a year later.
SantaCruz County
What's in the Santa Cruz County data?
There were 508 single-family homes for sale, providing 5 months of inventory. There were 201 new listings, and 102 homes sold at a median price of $1.3m. The median overbid percentage was at 99.1%, with an average of 32 days on the market
There were 141 condo and townhome units for sale, providing 4.9 months of inventory. There were 53 new listings and 29 units sold at a median sale price of $850k. The median overbid percentage was at 97.6%, with an average of 48 days on the market.
Single-Family Homes
201 New Listings
102 Sold Listings
5 Months of Inventory
$1.3M
Median Sale Price
99.1%
Median Sale vs List
32 Avg Days on Market
The data, sourced from Courted.io, includes all single-family homes, condos and townhomes in the California Area above from June 2024 to June 2025. This may include preliminary data, and may vary from the time the data was gathered. All data is deemed reliable but not guaranteed. DRE# 01511642. Copyright KW Advisors Palo Alto 2025. Each office is independently owned and operated.
aCruzCounty
JUNE 2024 - JUNE 2025 R SALE SOLD LISTINGS
mes year-over-year. omes , year-over-year
Median SalesPrice
Single-Family Homes
The median sale price has decreased from $1 4m last June 2024, to $1 3m as of June 2025
Condos & Townhomes
The median sale price has increased from $830k last June 2024, to $850k as of June 2025
AVGDays OntheMarket
Single-Family Homes
The average time spent on the market went down from 52 days last June 2024, to 32 days as of June 2025
Condos & Townhomes
The average time spent on the market went up from 41 days in June 2024, to 48 days as of June 2025.
Overbids
Single-Family Homes
The overbid percentage has decreased from 100 4% last June 2024, to 99 1% a year later
Condos & Townhomes
The overbid percentage has decreased from 100.2% last June 2024, to 97.6% a year later.
East PaloAlto
What's in the East Palo Alto data?
There were 12 single-family homes for sale, providing 3 months of inventory. There were 6 new listings, and 4 homes sold at a median price of $1.1m. The median overbid percentage was at 102 3%, with an average of 38 days on the market
There were 2 condo and townhome units for sale, providing 0 months of inventory. There was 1 new listing and 0 units sold at a median sale price of $0. The median overbid percentage was at 0%, with an average of 0 days on the market.
6 New Listings
mily Homes
4 Sold Listings
3 Months of Inventory
$1.1M Median Sale Price
102.3%
Median Sale vs List
38 Avg Days on Market
Courted.io, includes all single-family homes, condos and California Area above from June 2024 to June 2025. This may include vary from the time the data was gathered. All data is deemed guaranteed. DRE# 01511642. Copyright KW Advisors Palo Alto 2025. Each office is independently owned and operated.
Condo & Townhomes
1
New Listing
0
Months of Inventory $0
Median Sale Price 0%
Median Sale vs List 0 Avg Days on Market 0 Sold Listings
JUNE 2024 - JUNE 2025
LISTINGS FOR SALE SOLD LISTINGS
Single-Family Homes
Last 12 months, year-over-year.
Condos & Townhomes
Last 12 months, year-over-year
Median SalesPrice
Single-Family Homes
The median sale price has decreased from $1 2m last June 2024, to $1 1m as of June 2025
Condos & Townhomes
No data for this month
AVGDays OntheMarket
Single-Family Homes
The average time spent on the market went up from 31 days last June 2024, to 38 days as of June 2025
Condos & Townhomes
No data for this month
Overbids
Single-Family Homes
The overbid percentage has decreased from 108 6% last June 2024, to 102 3% a year later
Condos & Townhomes
No data for this month
Sunnyv
What's in the Sunn
There were 50 single-family h providing 1.1 months of inve new listings, and 44 homes s of $2.7m. The median overbi 109.5%, with an average of 1
There were 64 condo and tow sale, providing 2.3 months of were 31 new listings and 28 sale price of $1.3m. The med percentage was at 102.6%, w days on the market.
51 New Listings
1.1 Months of Inventory
109.5% Median Sale vs List
44 Sold Listings
$2.7M Median Sale Price
13 Avg Days on Market
single-family homes, condos and 2025. This may include gathered. All data is deemed Advisors Palo Alto 2025. Each
31
New Listings
28
Sold Listings
2.3
Months of Inventory
$1.3M
Median Sale Price
102.6%
Median Sale vs List
24 Avg Days on Market
JUNE 2024 - JUNE 2025
STINGS FOR SALE
e-Family Homes
12 months, year-over-year.
os & Townhomes
12 months, year-over-year
Median SalesPrice
Single-Family Homes
The median sale price has increased from $2 6m last June 2024, to $2 7m as of June 2025
Condos & Townhomes
The median sale price has decreased from $1 5m last June 2024, to $1 3m as of June 2025
AVGDays OntheMarket
Single-Family Homes
The average time spent on the market went down from 21 days last June 2024, to 13 days as of June 2025
Condos & Townhomes
The average time spent on the market went down from 28 days in June 2024, to 24 days as of June 2025.
Overbids
Single-Family Homes
The overbid percentage has decreased from 111 9% last June 2024, to 109 5% a year later
Condos & Townhomes
The overbid percentage has decreased from 109.1% last June 2024, to 102.6% a year later.
SantaC City
What's in the Sant data?
There were 38 single-family h providing 1.1 months of inve new listings, and 36 homes s of $1.9m. The median overbi 104 7%, with an average of 1
There were 71 condo and tow sale, providing 3.7 months of were 23 new listings and 19 sale price of $1.2m. The med percentage was at 103.6%, w days on the market.
44 New Listings
1.1 Months of Inventory
104.7% Median Sale vs List
36 Sold Listings
$1.9M Median Sale Price
14 Avg Days on Market
single-family homes, condos and 2025. This may include gathered. All data is deemed Advisors Palo Alto 2025. Each
23
New Listings
19
Sold Listings
3.7
Months of Inventory
$1.2M
Median Sale Price
103.6%
Median Sale vs List
34 Avg Days on Market
SantaClaraCity
JUNE 2024 - JUNE 2025
LISTINGS FOR SALE
Single-Family Homes
Last 12 months, year-over-year.
Condos & Townhomes
Last 12 months, year-over-year
Median SalesPrice
Single-Family Homes
The median sale price has increased from $1 8m last June 2024, to $1 9m as of June 2025
Condos & Townhomes
The median sale price has increased from $1 24m last June 2024, to $1 25m as of June 2025
AVGDays OntheMarket
Single-Family Homes
The average time spent on the market went down from 29 days last June 2024, to 14 days as of June 2025
Condos & Townhomes
The average time spent on the market went down from 51 days in June 2024, to 34 days as of June 2025.
Overbids
Single-Family Homes
The overbid percentage has decreased from 110 4% last June 2024, to 104 7% a year later
Condos & Townhomes
The overbid percentage has increased from 103.4% last June 2024, to 103.6% a year later.
Saratoga
What's in the Saratoga data?
There were 36 single-family homes for sale, providing 2.1 months of inventory. There were 18 new listings, and 17 homes sold at a median price of $5m. The median overbid percentage was at 103.4%, with an average of 20 days on the market.
There were 20 condo and townhome units for sale, providing 20 months of inventory. There were 6 new listings and 1 unit sold at a median sale price of $2.2m. The median overbid percentage was at 100%, with an average of 0 days on the market.
Single-Family Homes
18 New Listings
17 Sold Listings
2.1 Months of Inventory
$5M
Median Sale Price
103.4%
Median Sale vs List
20 Avg Days on Market
The data, sourced from Courted.io, includes all single-family homes, condos and townhomes in the California Area above from June 2024 to June 2025. This may include preliminary data, and may vary from the time the data was gathered. All data is deemed reliable but not guaranteed. DRE# 01511642. Copyright KW Advisors Palo Alto 2025. Each office is independently owned and operated.
Condo & To
New Listings
1
Sold Listing
20
Months of Inventory
$2.2M
Median Sale Price 100%
Median Sale vs List 0 Avg Days on Market
Median SalesPrice
Single-Family Homes
The median sale price has increased from $4m last June 2024, to $5m as of June 2025
Condos & Townhomes
The median sale price has increased from $1 3m last June 2024, to $2 2m as of June 2025
AVGDays OntheMarket
Single-Family Homes
The average time spent on the market went down from 31 days last June 2024, to 20 days as of June 2025
Condos & Townhomes
The average time spent on the market went down from 30 days in June 2024, to 0 days as of June 2025.
Overbids
Single-Family Homes
The overbid percentage has decreased from 103 6% last June 2024, to 103 4% a year later
Condos & Townhomes
The overbid percentage has decreased from 102.9% last June 2024, to 100% a year later.