


District 1 - Northwest
Sea Cliff, Lake Street, Richmond (Inner, Central, Outer), Jordan Park/Laurel Heights, Lone Mountain
Jump to District 1 - Northwest
District 2 - West
Sunset & Parkside (Inner, Central, Outer), Golden Gate Heights
Jump to District 2 - West
District 3 - Southwest
Lake Shore, Lakeside, Merced Manor, Merced Heights, Ingleside, Ingleside Heights, Oceanview
Jump to District 3 - Southwest
District 4 - Central SW
St. Francis Wood, Forest Hill, West Portal, Forest Knolls, Diamond Heights, Midtown Terrace, Miraloma Park, Sunnyside, Balboa Terrace, Ingleside Terrace, Mt Davidson Manor, Sherwood Forest, Monterey Heights, Westwood Highlands
Jump to District 4 - Central SW
District 5 - Central
Noe Valley, Eureka Valley/Dolores Heights (Castro, Liberty Hill), Cole Valley, Glen Park, Corona Heights, Clarendon Heights, Ashbury Heights, Buena Vista Park, Haight Ashbury, Duboce Triangle, Twin Peaks, Mission Dolores, Parnassus Heights
Jump to District 5 - Central

Hayes Valley, North of Panhandle (NOPA), Alamo Square, Western Addition, Anza Vista, Lower Pacific Heights
Jump to District 6 - Central North
Pacific Heights, Presidio Heights, Cow Hollow, Marina
Jump to District 7 - North
Russian Hill, Nob Hill, Telegraph Hill, North Beach, Financial District, North Waterfront, Downtown, Van Ness/Civic Center, Tenderloin
Jump to District 8 - Northeast
SoMa, South Beach, Mission Bay, Potrero Hill, Dogpatch, Bernal Heights, Inner Mission, Yerba Buena
Jump to District 9 - East
Bayview, Bayview Heights, Excelsior, Portola, Visitacion Valley, Silver Terrace, Mission Terrace, Crocker Amazon, Outer Mission
Jump to District 10 - Southeast
That's the question you should be asking yourself.
Our market is incredibly diverse and rapidly changing. Values vary not just by neighborhood but by street. Your home isn't necessarily worth what your neighbors' home is. It's the current market that sets the value of your home.
So, do you know what your home is worth in today's market?
Icanhelp...
Contact me for a confidential, no obligation assessment of your home's value.


More people are taking steps to buy a home. And, if you’ve been waiting for the right time to move, this may be the sign you’ve been looking for.
For the past few years, a lot of would-be homebuyers hit pause on their plans. With rising mortgage rates and affordability challenges, buying just didn’t seem doable. But now, more of them are getting back out there. That’s because they’re getting used to the fact that this may be the new normal for the market – especially as forecasts show mortgage rates may be starting to stabilize.


Avoid paying off debts or collections without professional advice.
Don't have your credit report pulled too many times - this can hurt your credit score. 3 4 5 6 1 2
Always consult your mortgage professional before making large financial moves. Use verified funds for deposits to prevent closing delays.
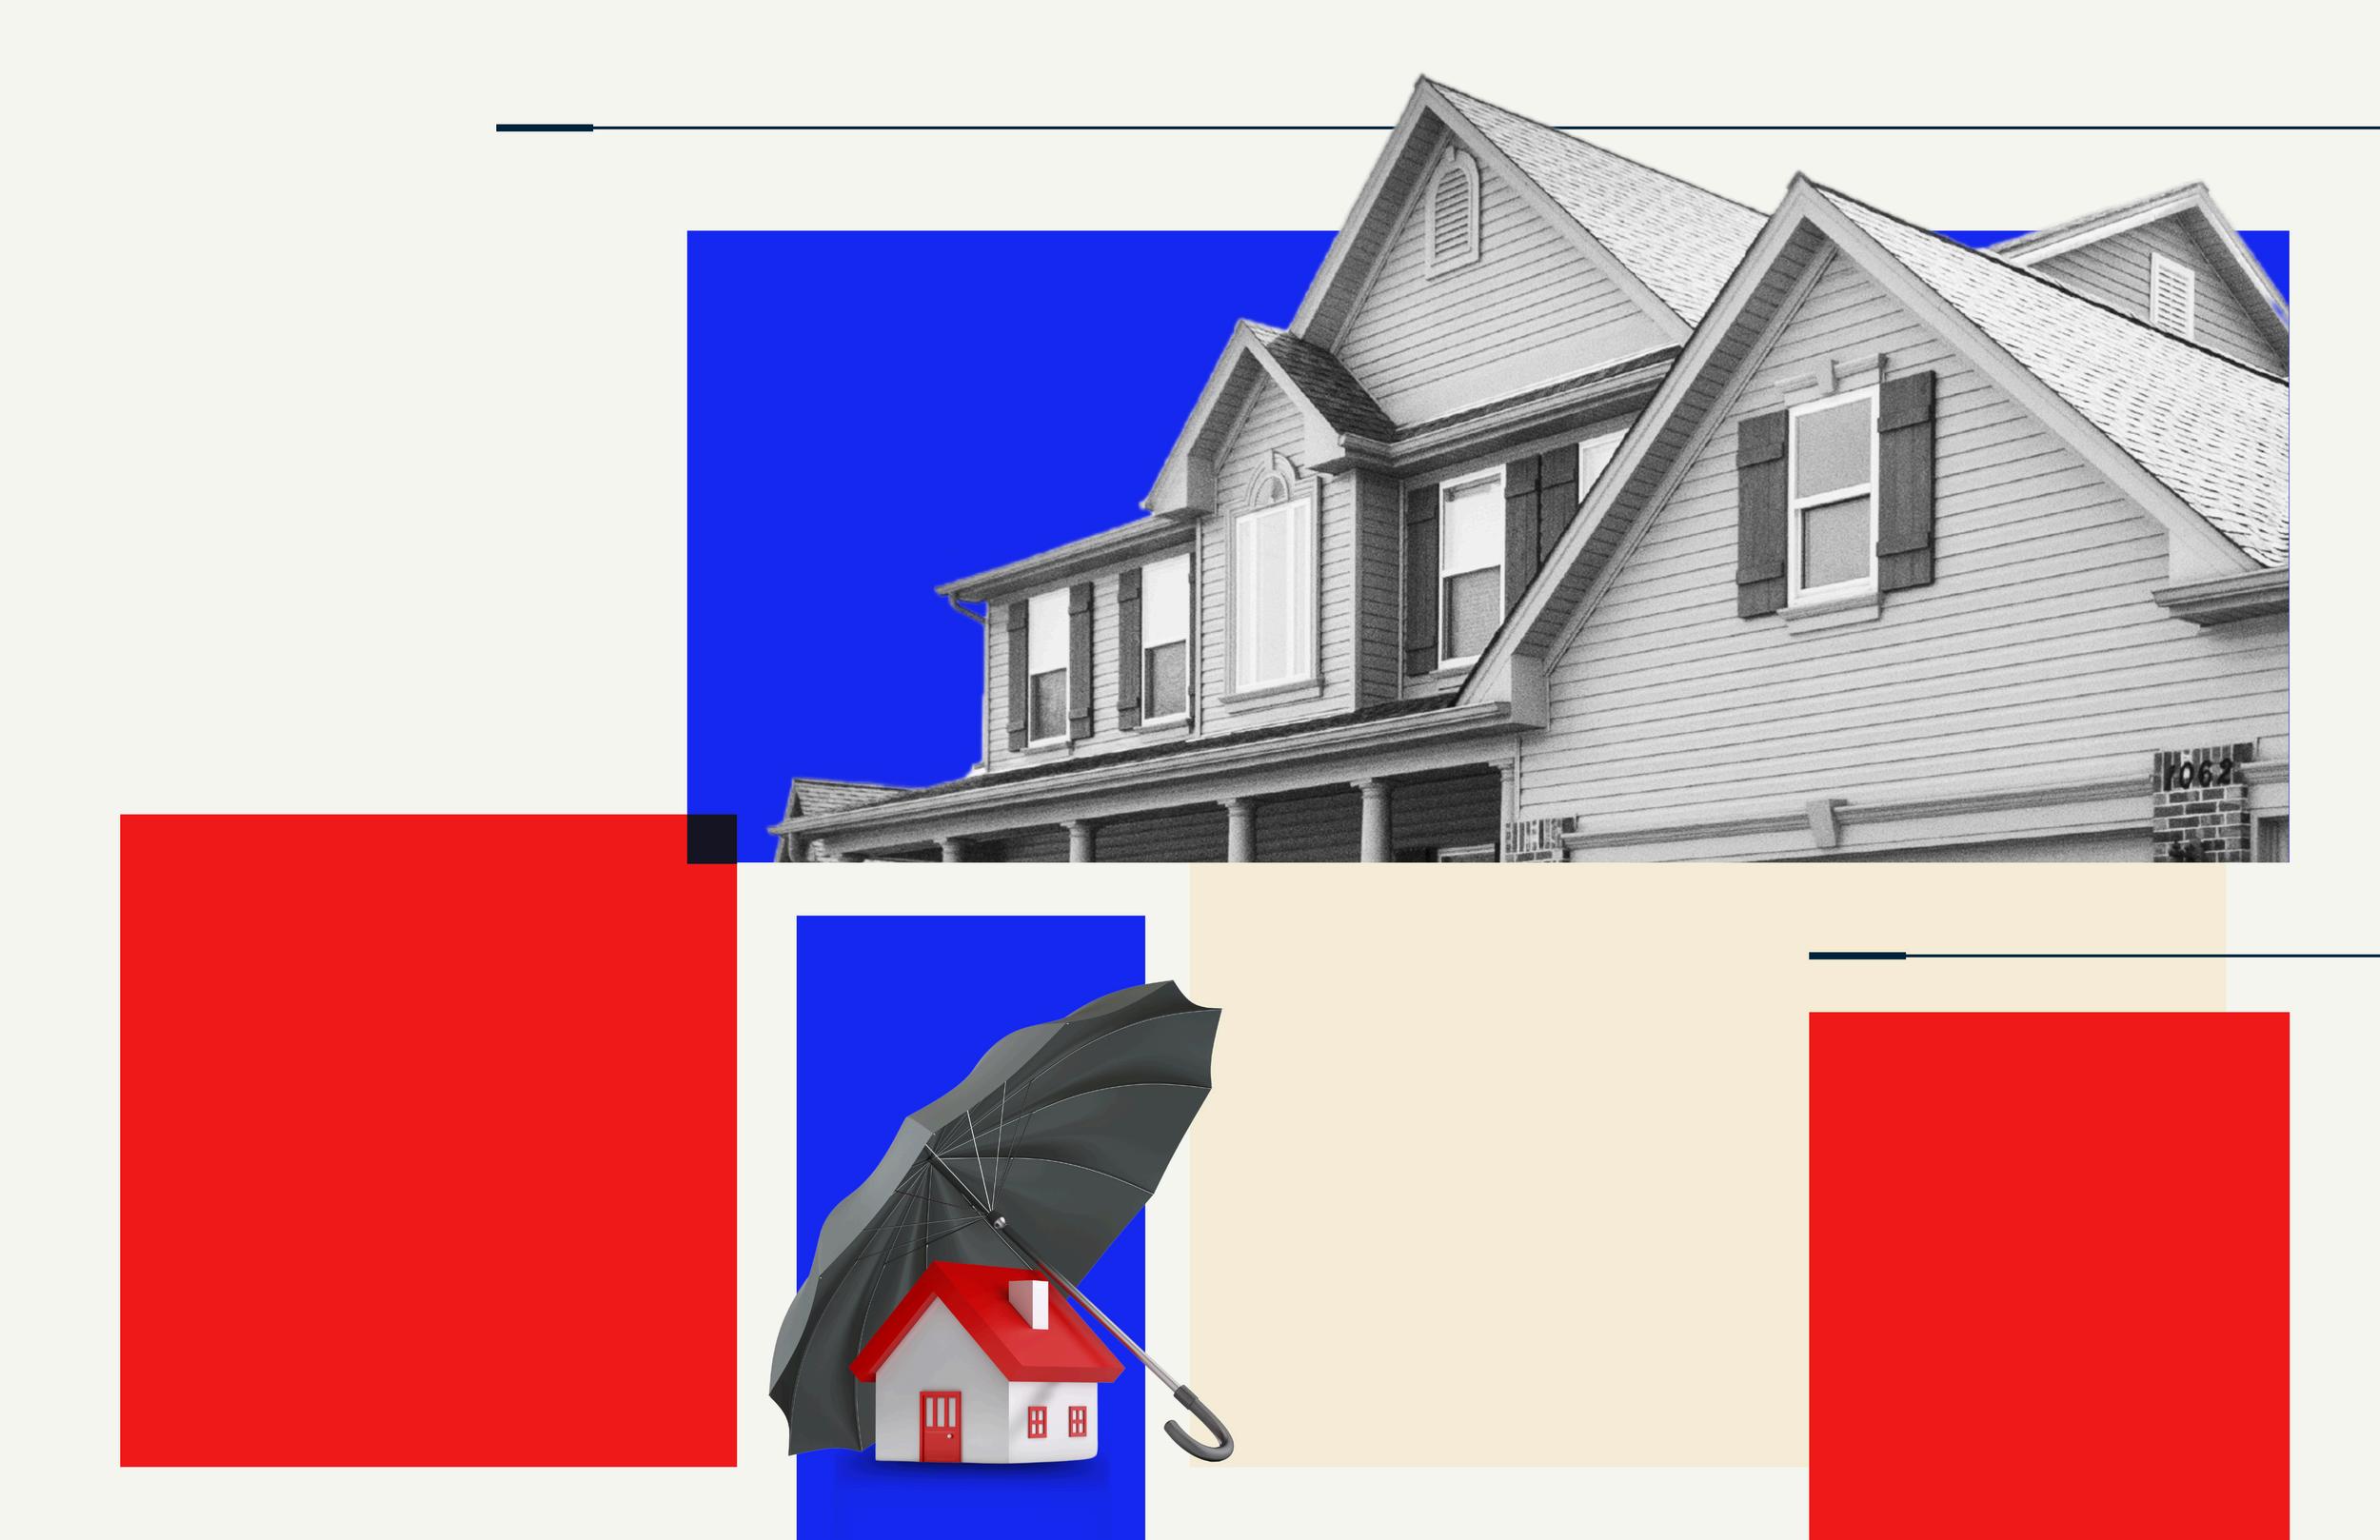


In2024,thehomebuyingmarketfacessignificantchallenges highprices, steepinterestrates,andlimitedhousinginventory.Formany,renovatingtheir currenthomeisamoreattractiveoptionthanpurchasinganewone.Whilethe LIRAreportpredictsadeclineinrenovationspending,expertsemphasizethat small-scaleupdatesortargetedlargerprojectscanstilldelivermajorbenefits.
Beforedivingintoarenovation,it’sessentialtoplan carefullyandbudgetwisely.Workingwithreputable professionalsiskey,especiallythoseoffering financingoptionsandtransferablewarranties.Sharing yourbudgetwithcontractorsupfrontandinvolving designersearlyensuresthatyourrenovationruns smoothlyandachievesbothfinancialandfunctional success Adetailedplanwillkeeptheprojectontrack andhelpavoidcostlysurprises


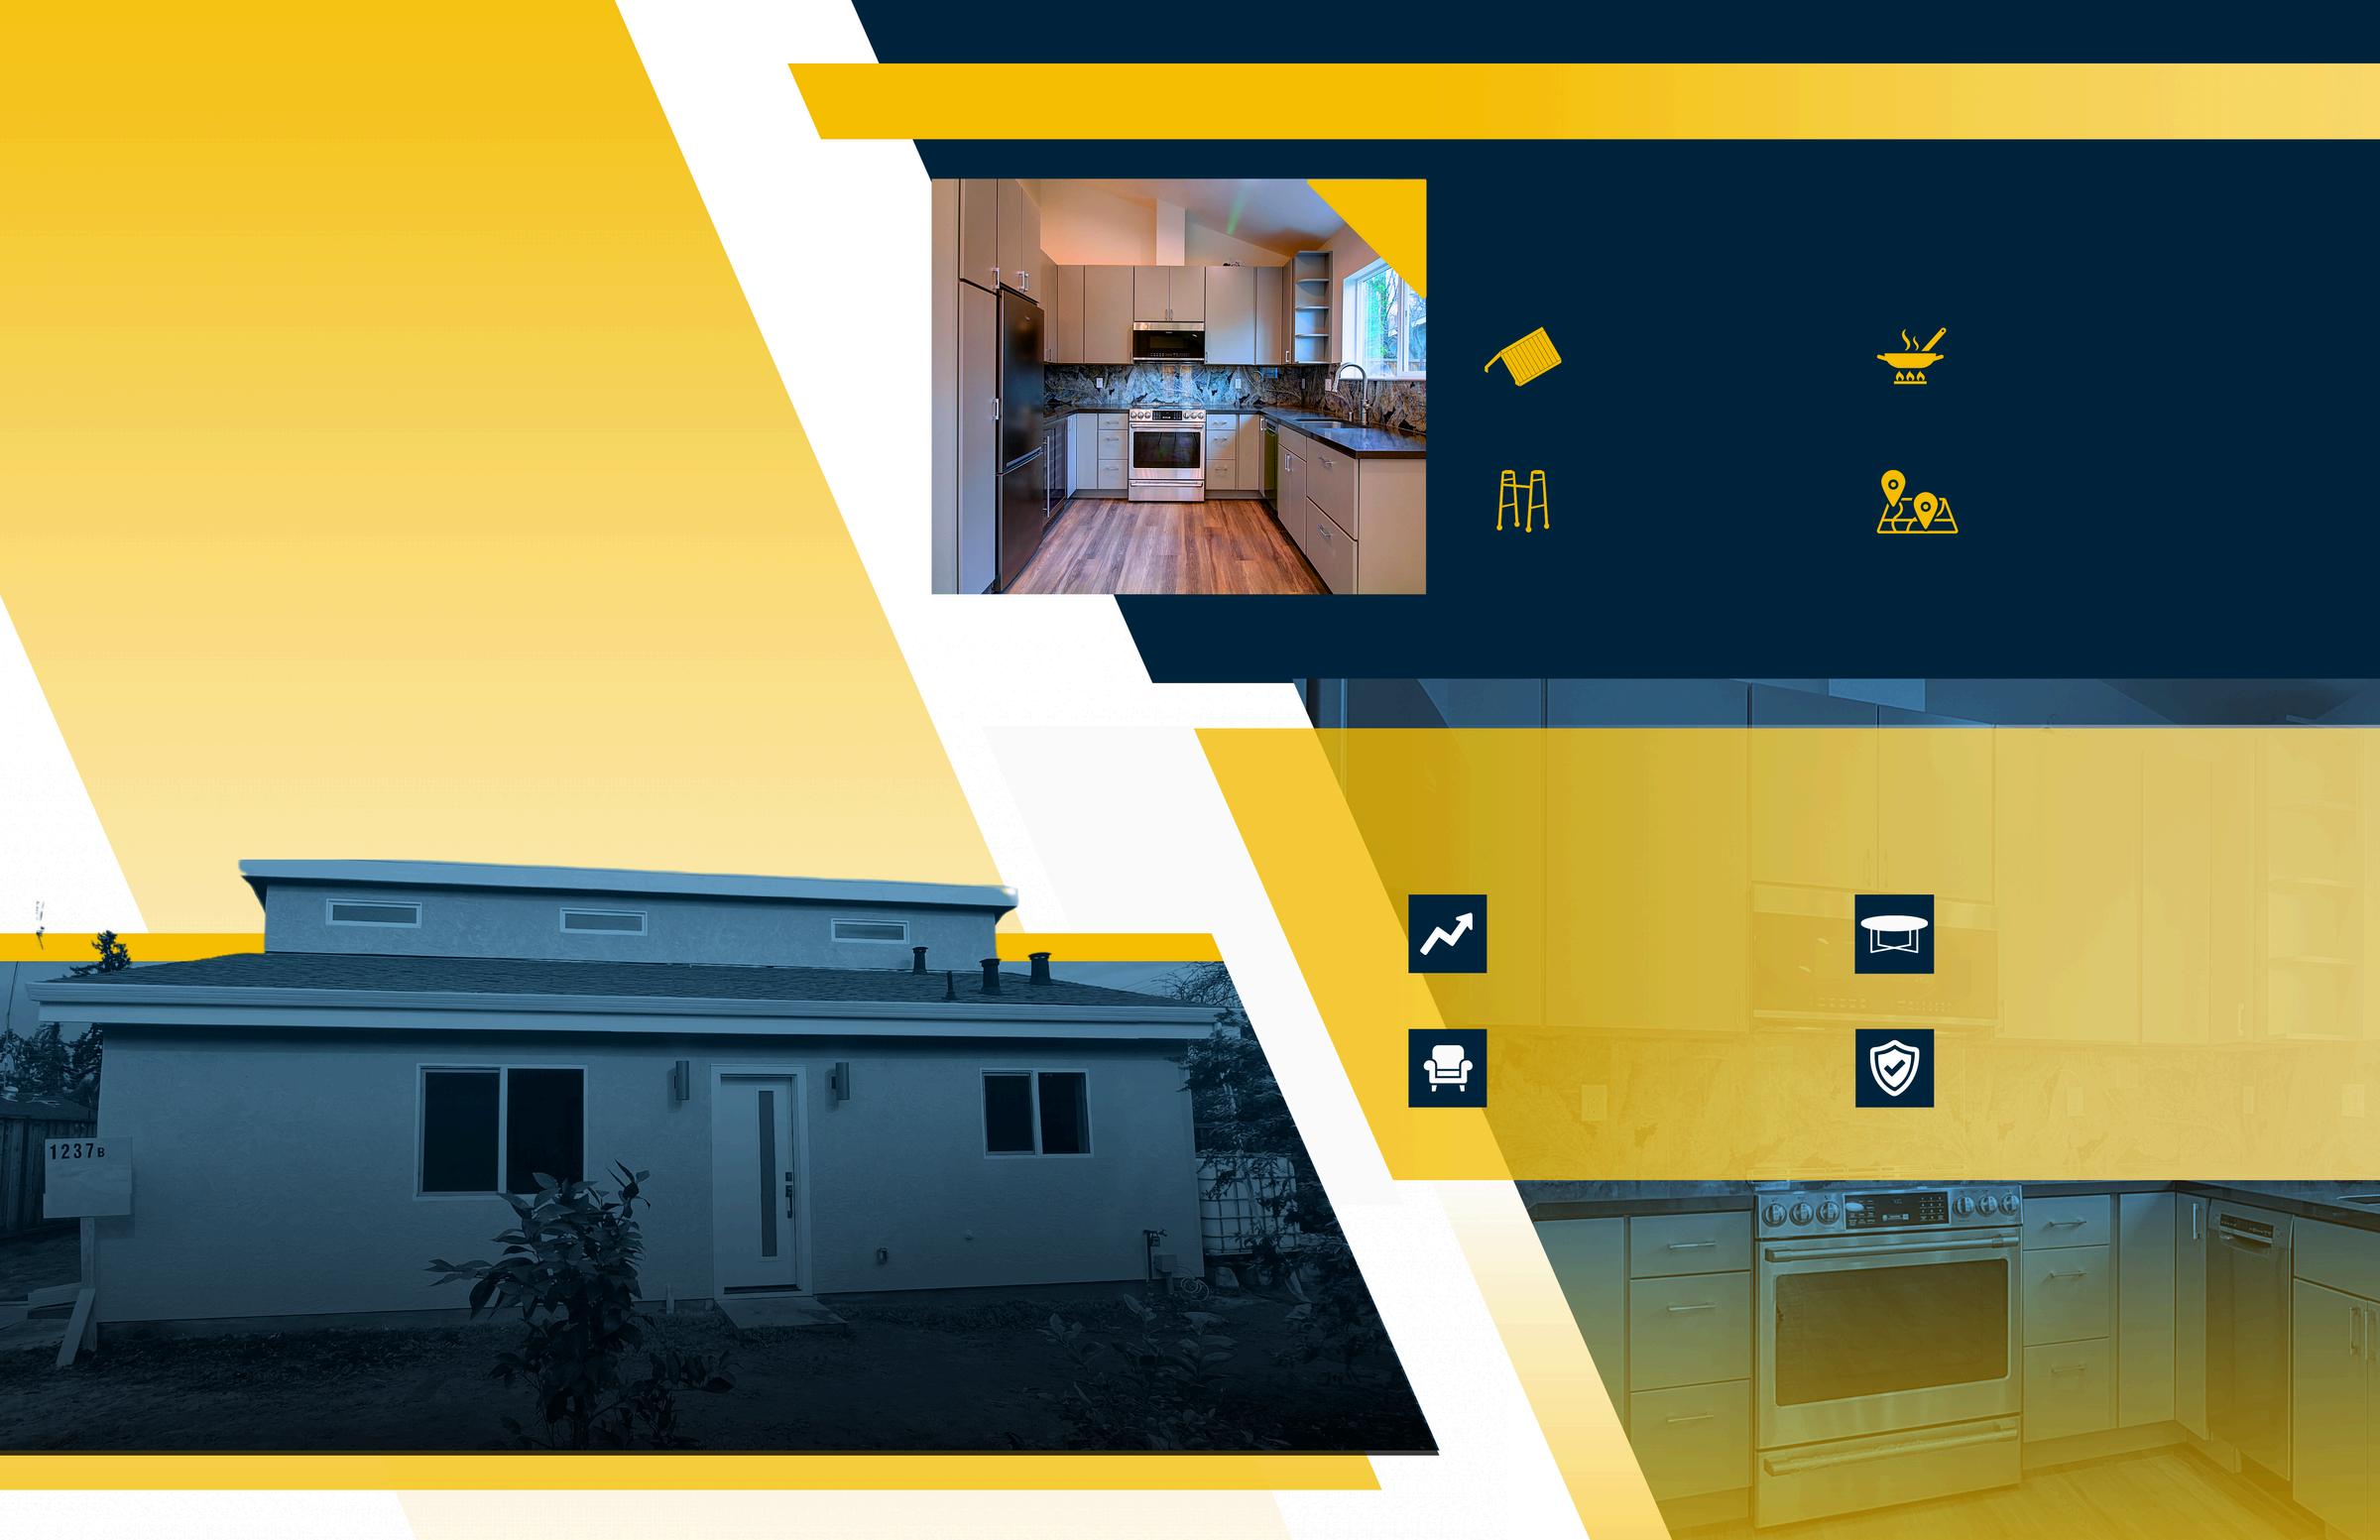

The Anenberg-Essert family in Campbell collaborated with Acton ADU to create a versatile, comfortable, and valuable addition to their property. This ADU project is a shining example of how a well-designed accessory dwelling unit can increase property value and serve a family’s unique needs.
The family envisioned an ADU that would function as an independent living space for family members, enhance their property’s worth, and provide seamless integration with the main home They wanted a space that balanced privacy with connectivity, feeling like a natural extension of their residence
Constructed at 747 square feet, this ADU was designed with modern, high-quality finishes to serve both aesthetic and practical needs. Key features include:
Creates a spacious, open atmosphere
Safe, independent space for elderly family members
Fully Equipped Kitchen
Modern amenities for everyday convenience
Open Living Area
Multipurpose area for relaxation and entertainment
The completion of the Anenberg-Essert ADU led to several valuable outcomes:
The ADU addition significantly boosted property value
A versatile space for family, guests, or as a rental
High-end finishes and amenities enhance both function and style.
The ADU enriches the AnenbergEssert family’s home with both privacy and connection


When it comes to home ownership, knowing who you can trust is crucial. That's why we've curated a select list of trusted vendors who are ready to help with your home goals.


Sea Cliff, Lake Street, Richmond (Inner, Central, Outer), Jordan Park/Laurel Heights, Lone Mountain
What's in the District 1Northwest data?
There were 13 single-family homes for sale, providing 0.8 months of inventory. There were 15 new listings, and 10 homes sold at a median price of $2.2m. The median overbid percentage was at 110 3%, with an average of 11 days on the market
There were 17 condo and townhome units for sale, providing 2.1 months of inventory. There were 13 new listings and 7 units sold at a median sale price of $1.5m. The median overbid percentage was at 100%, with an average of 62 days on the market.

15 New Listings
10 Sold Listings
0.8 Months of Inventory
$2.2M Median Sale Price
110.3%
Median Sale vs List
11 Avg Days on Market
The data, sourced from InfoSparks, includes all single-family homes, condos and townhomes in the California Area above from February 2024 to February 2025. This may include preliminary data, and may vary from the time the data was gathered. All data is deemed reliable but not guaranteed. DRE# 01995149. Copyright KW Advisors San Francisco | Napa Valley 2025. Each office is independently owned and operated.
FEBRUARY 2024 - FEBRUARY 2025
le-Family Homes
12 months, year-over-year.
dos & Townhomes 12 months, year-over-year
Single-Family Homes
The median sale price has increased from $1 5m last February 2024, to $2 2m as of February 2025
Condos & Townhomes
The median sale price has increased from $0 last February 2024, to $1 5m as of February 2025
The average time spent on the market went down from 19 days last February 2024, to 11 days as of February 2025
Condos & Townhomes
The average time spent on the market went up from 0 days in February 2024, to 62 days as of February 2025.
Single-Family Homes
The overbid percentage has increased from 109 1% last February 2024, to 110 3% a year later
Condos & Townhomes
The overbid percentage has increased from 0% last February 2024, to 100% a year later.

Sunset & Parkside (Inner, Central, Outer), Golden Gate Heights
What's in the District 2 - West data?
There were 25 single-family homes for sale, providing 0.7 months of inventory. There were 34 new listings, and 27 homes sold at a median price of $1.6m. The median overbid percentage was at 125.5%, with an average of 17 days on the market.
There were 6 condo and townhome units for sale, providing 2 months of inventory. There were 7 new listings and 1 unit sold at a median sale price of $1.1m. The median overbid percentage was at 97%, with an average of 79 days on the market.

34 New Listings
27 Sold Listings
0.7 Months of Inventory
$1.6M Median Sale Price
125.5%
Median Sale vs List
17 Avg Days on Market
The data, sourced from InfoSparks, includes all single-family homes, condos and townhomes in the California Area above from February 2024 to February 2025. This may include preliminary data, and may vary from the time the data was gathered. All data is deemed reliable but not guaranteed. DRE# 01995149. Copyright KW Advisors San Francisco | Napa Valley 2025. Each office is independently owned and operated.
7
New Listings
1 Sold Listing
2 Months of Inventory
$1.1M
Median Sale Price 97%
Median Sale vs List 79 Avg Days on Market

FEBRUARY 2024 - FEBRUARY 2025
, y r-year
The median sale price has increased from $1 3m last February 2024, to $1 6m as of February 2025
Condos & Townhomes
The median sale price has decreased from $1 6m last February 2024, to $1 1m as of February 2025
The average time spent on the market went down from 31 days last February 2024, to 17 days as of February 2025
Condos & Townhomes
The average time spent on the market went up from 13 days in February 2024, to 79 days as of February 2025.
Single-Family Homes
The overbid percentage has increased from 111% last February 2024, to 125 5% a year later
Condos & Townhomes
The overbid percentage has decreased from 113.4% last February 2024, to 97.2% a year later.

Lake Shore, Lakeside, Mer Merced Heights, Ingleside Heights, Oceanview
What's in the Distr Southwest data?
There were 18 single-family h providing 1.4 months of inve new listings, and 4 homes so of $1.4m. The median overbi 105%, with an average of 60
There were 4 condo and tow providing 2.1 months of inve new listings and 0 units sold price of $0. The median over at 0%, with an average of 0 d
17 New Listings
1.4 Months of Inventory
105% Median Sale vs List
4 Sold Listings
$1.4M Median Sale Price
60 Avg Days on Market
homes, condos and February 2025. This may was gathered. All data is Copyright KW Advisors San Francisco | Napa Valley 2025. Each office is independently owned and operated.
2
New Listings
0 Sold Listings
2.1
Months of Inventory
$0
Median Sale Price 0%
Median Sale vs List 0 Avg Days on Market

FEBRUARY 2024 - FEBRUARY 2025
Family Homes months, year-over-year.
& Townhomes months, year-over-year
The median sale price has increased from $1 1m last February 2024, to $1 4m as of February 2025
Condos & Townhomes
The median sale price has decreased from $1m last February 2024, to $0 as of February 2025
The average time spent on the market went up from 23 days last February 2024, to 60 days as of February 2025
Condos & Townhomes
The average time spent on the market went down from 13 days in February 2024, to 0 days as of February 2025.
Single-Family Homes
The overbid percentage has increased from 104% last February 2024, to 104 5% a year later
Condos & Townhomes
The overbid percentage has decreased from 100.1% last February 2024, to 0% a year later.

St. Francis Wood, Forest Hill, West Portal, Forest Knolls, Diamond Heights, Midtown Terrace, Miraloma Park, Sunnyside, Balboa Terrace, Ingleside Terrace, Mt Davidson Manor, Sherwood Forest, Monterey Heights, Westwood Highlands
What's in the District 4 - Central SW data?
There were 15 single-family homes for sale, providing 0.6 months of inventory. There were 28 new listings, and 17 homes sold at a median price of $1.9m. The median overbid percentage was at 112.3%, with an average of 24 days on the market.
There were 16 condo and townhome units for sale, providing 4.8 months of inventory. There were 8 new listings and 2 units sold at a median sale price of $942k. The median overbid percentage was at 98.3%, with an average of 20 days on the market.

28 New Listings
17 Sold Listings
0.6 Months of Inventory
$1.9M Median Sale Price
112.3%
Median Sale vs List
24 Avg Days on Market
The data, sourced from InfoSparks, includes all single-family homes, condos and townhomes in the California Area above from February 2024 to February 2025. This may include preliminary data, and may vary from the time the data was gathered. All data is deemed reliable but not guaranteed. DRE# 01995149. Copyright KW Advisors San Francisco | Napa Valley 2025. Each office is independently owned and operated.
8
New Listings
2 Sold Listings
4.8
Months of Inventory
$942K
Median Sale Price 98.3%
Median Sale vs List
20 Avg Days on Market

FEBRUARY 2024 - FEBRUARY 2025
Single-Family Homes
Last 12 months, year-over-year.
Condos & Townhomes
Last 12 months, year-over-year
Single-Family Homes
The median sale price has increased from $1 8m last February 2024, to $1 9m as of February 2025
Condos & Townhomes
The median sale price has increased from $919k last February 2024, to $942k as of February 2025
Single-Family Homes
The average time spent on the market went down from 37 days last February 2024, to 24 days as of February 2025
Condos & Townhomes
The average time spent on the market went up from 16 days in February 2024, to 20 days as of February 2025.
Single-Family Homes
The overbid percentage has increased from 107 8% last February 2024, to 112 3% a year later
Condos & Townhomes
The overbid percentage has decreased from 100.6% last February 2024, to 98.3% a year later.
Noe Valley, Eureka Valley/Dolores Heights (Castro, Liberty Hill), Cole Valley, Glen Park, Corona Heights, Clarendon Heights, Ashbury Heights, Buena Vista Park, Haight Ashbury, Duboce Triangle, Twin Peaks, Mission Dolores, Parnassus Heights
There were 30 single-family homes for sale, providing 1.2 months of inventory. There were 28 new listings, and 17 homes sold at a median price of $2m. The median overbid percentage was at 108.1%, with an average of 23 days on the market.
There were 36 condo and townhome units for sale, providing 1.6 months of inventory. There were 30 new listings and 15 units sold at a median sale price of $1.7m. The median overbid percentage was at 112.8%, with an average of 11 days on the market.
28 New Listings
17 Sold Listings
1.2 Months of Inventory
$2M Median Sale Price
108.1%
Median Sale vs List
23 Avg Days on Market
The data, sourced from InfoSparks, includes all single-family homes, condos and townhomes in the California Area above from February 2024 to February 2025. This may include preliminary data, and may vary from the time the data was gathered. All data is deemed reliable but not guaranteed. DRE# 01995149. Copyright KW Advisors San Francisco | Napa Valley 2025. Each office is independently owned and operated.
30 New Listings
15 Sold Listings
1.6
Months of Inventory
$1.7
Median Sale Price
112.8%
Median Sale vs List
11 Avg Days on Market

FEBRUARY 2024 - FEBRUARY 2025
Single-Family Homes
Last 12 months, year-over-year.
Condos & Townhomes
Last 12 months, year-over-year
Single-Family Homes
The median sale price has decreased from $2 3m last February 2024, to $2m as of February 2025
Condos & Townhomes
The median sale price has increased from $1 4m last February 2024, to $1 7m as of February 2025
Single-Family Homes
The average time spent on the market went down from 34 days last February 2024, to 23 days as of February 2025
Condos & Townhomes
The average time spent on the market went down from 18 days in February 2024, to 11 days as of February 2025.
Single-Family Homes
The overbid percentage has increased from 100 2% last February 2024, to 108 1% a year later
Condos & Townhomes
The overbid percentage has increased from 103.2% last February 2024, to 112.8% a year later.
Hayes Valley, North Alamo Square, Wes Vista, Lower Pacific
There were 4 single-fa providing 1.3 months new listings, and 3 ho of $2.9m. The median 110 4%, with an avera
There were 34 condo sale, providing 2.1 mo were 31 new listings a sale price of $1m. The was at 104.9%, with a market.
5 New Listings
3 Sold Listings
1.3 Months of Inventory
$2.9M Median Sale Price
110.4% Median Sale vs List
s single-family homes, condos and 2024 to February 2025. This may the data was gathered. All data is 01995149. Copyright KW Advisors San Francisco | Napa Valley 2025. Each office is independently owned and operated.
10 Avg Days on Market
31
New Listings
15 Sold Listings
2.1
Months of Inventory
$1M
Median Sale Price
104.9%
Median Sale vs List
40 Avg Days on Market

FEBRUARY 2024 - FEBRUARY 2025
Family Homes
2 months, year-over-year.
s & Townhomes
2 months, year-over-year
The median sale price has increased from $1 9m last February 2024, to $2 9m as of February 2025
Condos & Townhomes
The median sale price has increased from $880k last February 2024, to $1m as of February 2025
The average time spent on the market went down from 48 days last February 2024, to 10 days as of February 2025
Condos & Townhomes
The average time spent on the market went up from 17 days in February 2024, to 40 days as of February 2025.
Single-Family Homes
The overbid percentage has increased from 102 7% last February 2024, to 110 4% a year later
Condos & Townhomes
The overbid percentage has increased from 98.3% last February 2024, to 104.9% a year later.
Pacific Heights, Presidio Heights, Cow Hollow, Marina
What's in the District 7 - Nor data?
There were 22 single-family homes for sale, providing 2.3 months of inventory. There we new listings, and 3 homes sold at a median p of $7.3m. The median overbid percentage w 100%, with an average of 8 days on the mark
There were 45 condo and townhome units fo sale, providing 2 months of inventory. There 30 new listings and 12 units sold at a median price of $1.5m. The median overbid percenta was at 100%, with an average of 35 days on market.

11 New Listings
3 Sold Listings
2.3 Months of Inventory
$7.3M Median Sale Price
100% Median Sale vs List
8 Avg Days on Market
sourced from InfoSparks, includes all single-family homes, condos and the California Area above from February 2024 to February 2025. This may minary data, and may vary from the time the data was gathered. All data is reliable but not guaranteed. DRE# 01995149. Copyright KW Advisors San Francisco | Napa Valley 2025. Each office is independently owned and operated.
Condo & Town
30
New Listings
12 Sold Listings
2 Months of Inventory $1.5M
100.2%
Median Sale vs List
Median Sale Price
35 Avg Days on Market

FEBRUARY 2024 - FEBRUARY 2025
amily Homes months, year-over-year. & Townhomes months, year-over-year
The median sale price has increased from $4 1m last February 2024, to $7 3m as of February 2025
Condos & Townhomes
The median sale price has decreased from $1 7m last February 2024, to $1 5m as of February 2025
The average time spent on the market went down from 33 days last February 2024, to 8 days as of February 2025
Condos & Townhomes
The average time spent on the market went up from 19 days in February 2024, to 35 days as of February 2025.
Single-Family Homes
The overbid percentage has increased from 98 6% last February 2024, to 100% a year later
Condos & Townhomes
The overbid percentage has increased from 100% last February 2024, to 100.2% a year later.

Russian Hill, Beach, Finan
Downtown, V Tenderloin
There were 9 s providing 3.5 m new listings, a of $0. The med with an averag
There were 10 sale, providing were 50 new li sale price of $ percentage wa days on the m

3 New Listings
0 Sold Listings
3.5 Months of Inventory
$0 Median Sale Price
0% Median Sale vs List
0 Avg Days on Market
and may data is San
Condo & Town
50
New Listings
28 Sold Listings
3.3
Months of Inventory
$947K
Median Sale Price
100%
Median Sale vs List
45 Avg Days on Market
FEBRUARY 2024 - FEBRUARY 2025
amily Homes months, year-over-year. & Townhomes months, year-over-year
Single-Family Homes
The median sale price has decreased from $2 7m last February 2024, to $0 as of February 2025
Condos & Townhomes
The median sale price has decreased from $981k last February 2024, to $947k as of February 2025
The average time spent on the market went down from 15 days last February 2024, to 0 days as of February 2025
Condos & Townhomes
The average time spent on the market went down from 77 days in February 2024, to 45 days as of February 2025.
Single-Family Homes
The overbid percentage has decreased from 109 1% last February 2024, to 0% a year later
Condos & Townhomes
The overbid percentage has increased from 99.5% last February 2024, to 100% a year later.


23 New Listings
18 Sold Listings
1.8 Months of Inventory
$1.7M
Median Sale Price
110.9%
Median Sale vs List
23 Avg Days on Market
from InfoSparks, includes all single-family homes, condos and California Area above from February 2024 to February 2025. This may data, and may vary from the time the data was gathered. All data is but not guaranteed. DRE# 01995149. Copyright KW Advisors San Francisco | Napa Valley 2025. Each office is independently owned and operated.
129
New Listings
63 Sold Listings
4.6
Months of Inventory
$890K
Median Sale Price 98%
Median Sale vs List 77 Avg Days on Market

FEBRUARY 2024 - FEBRUARY 2025
Single-Family Homes
Last 12 months, year-over-year.
Condos & Townhomes
Last 12 months, year-over-year
The median sale price has increased from $1 5m last February 2024, to $1 7m as of February 2025
Condos & Townhomes
The median sale price has decreased from $1 2m last February 2024, to $890k as of February 2025
The average time spent on the market went down from 31 days last February 2024, to 23 days as of February 2025
Condos & Townhomes
The average time spent on the market went up from 65 days in February 2024, to 77 days as of February 2025.
Single-Family Homes
The overbid percentage has increased from 103% last February 2024, to 110 9% a year later
Condos & Townhomes
The overbid percentage has decreased from 100% last February 2024, to 98.2% a year later.

Bayview, Bayview Heights, Excelsior, Portola, Visitacion Valley, Silver Terrace, Mission Terrace, Crocker Amazon, Outer Mission
There were 49 single-family homes for sale, providing 1.3 months of inventory. There were 43 new listings, and 31 homes sold at a median price of $1m. The median overbid percentage was at 108 5%, with an average of 39 days on the market
There were 27 condo and townhome units for sale, providing 3.3 months of inventory. There were 14 new listings and 5 units sold at a median sale price of $595k. The median overbid percentage was at 97%, with an average of 79 days on the market.
43 New Listings
31 Sold Listings
1.3 Months of Inventory
$1M Median Sale Price
108.5%
Median Sale vs List
39 Avg Days on Market
The data, sourced from InfoSparks, includes all single-family homes, condos and townhomes in the California Area above from February 2024 to February 2025. This may include preliminary data, and may vary from the time the data was gathered. All data is deemed reliable but not guaranteed. DRE# 01995149. Copyright KW Advisors San Francisco | Napa Valley 2025. Each office is independently owned and operated.
14
New Listings
5
Sold Listings
3.3
Months of Inventory
$595K
Median Sale Price
97%
Median Sale vs List
79 Avg Days on Market

FEBRUARY 2024 - FEBRUARY 2025
Single-Family Homes
Last 12 months, year-over-year.
Condos & Townhomes
Last 12 months, year-over-year
The median sale price has decreased from $1 1m last February 2024, to $1m as of February 2025
Condos & Townhomes
The median sale price has decreased from $695k last February 2024, to $595k as of February 2025
The average time spent on the market went down from 55 days last February 2024, to 39 days as of February 2025
The average time spent on the market went up from 65 days in February 2024, to 79 days as of February 2025.
The overbid percentage has increased from 102 8% last February 2024, to 108 5% a year later
Condos & Townhomes
The overbid percentage has decreased from 99.1% last February 2024, to 97.1% a year later.