That's the question you should be asking yourself.
Our market is incredibly diverse and rapidly changing. Values vary not just by neighborhood but by street. Your home isn't necessarily worth what your neighbors' home is. It's the current market that sets the value of your home.
So, do you know what your home is worth in today's market?
Icanhelp...
Contact me for a confidential, no obligation assessment of your home's value.
TheTruthAboutDownPayments (It’sNotWhatYouThink)
Buying a home is exciting… until you start thinking about the down payment. That’s when the worry can set in.
“I’ll never save enough.”
“I need a small fortune just to get started.”
“I guess I’ll just rent forever.”
Sound familiar? You’re not alone. And you’re definitely not out of luck.
Here’s the thing: a lot of what you’ve heard about down payments just isn’t true. And once you know the facts, you might realize you’re a lot closer to owning a home than you think.
Let’s break it all down and bust some big down payment myths while we’re at it.
Smart Strategies for a Mortgage Application
Avoid paying off debts or collections without professional advice.
Don't have your credit report pulled too many times - this can hurt your credit score. 3 4 5 6 1 2
Always consult your mortgage professional before making large financial moves. Use verified funds for deposits to prevent closing delays.
HomeRenovationsThatCanMakea BIG IMPACT AccordingtoExperts
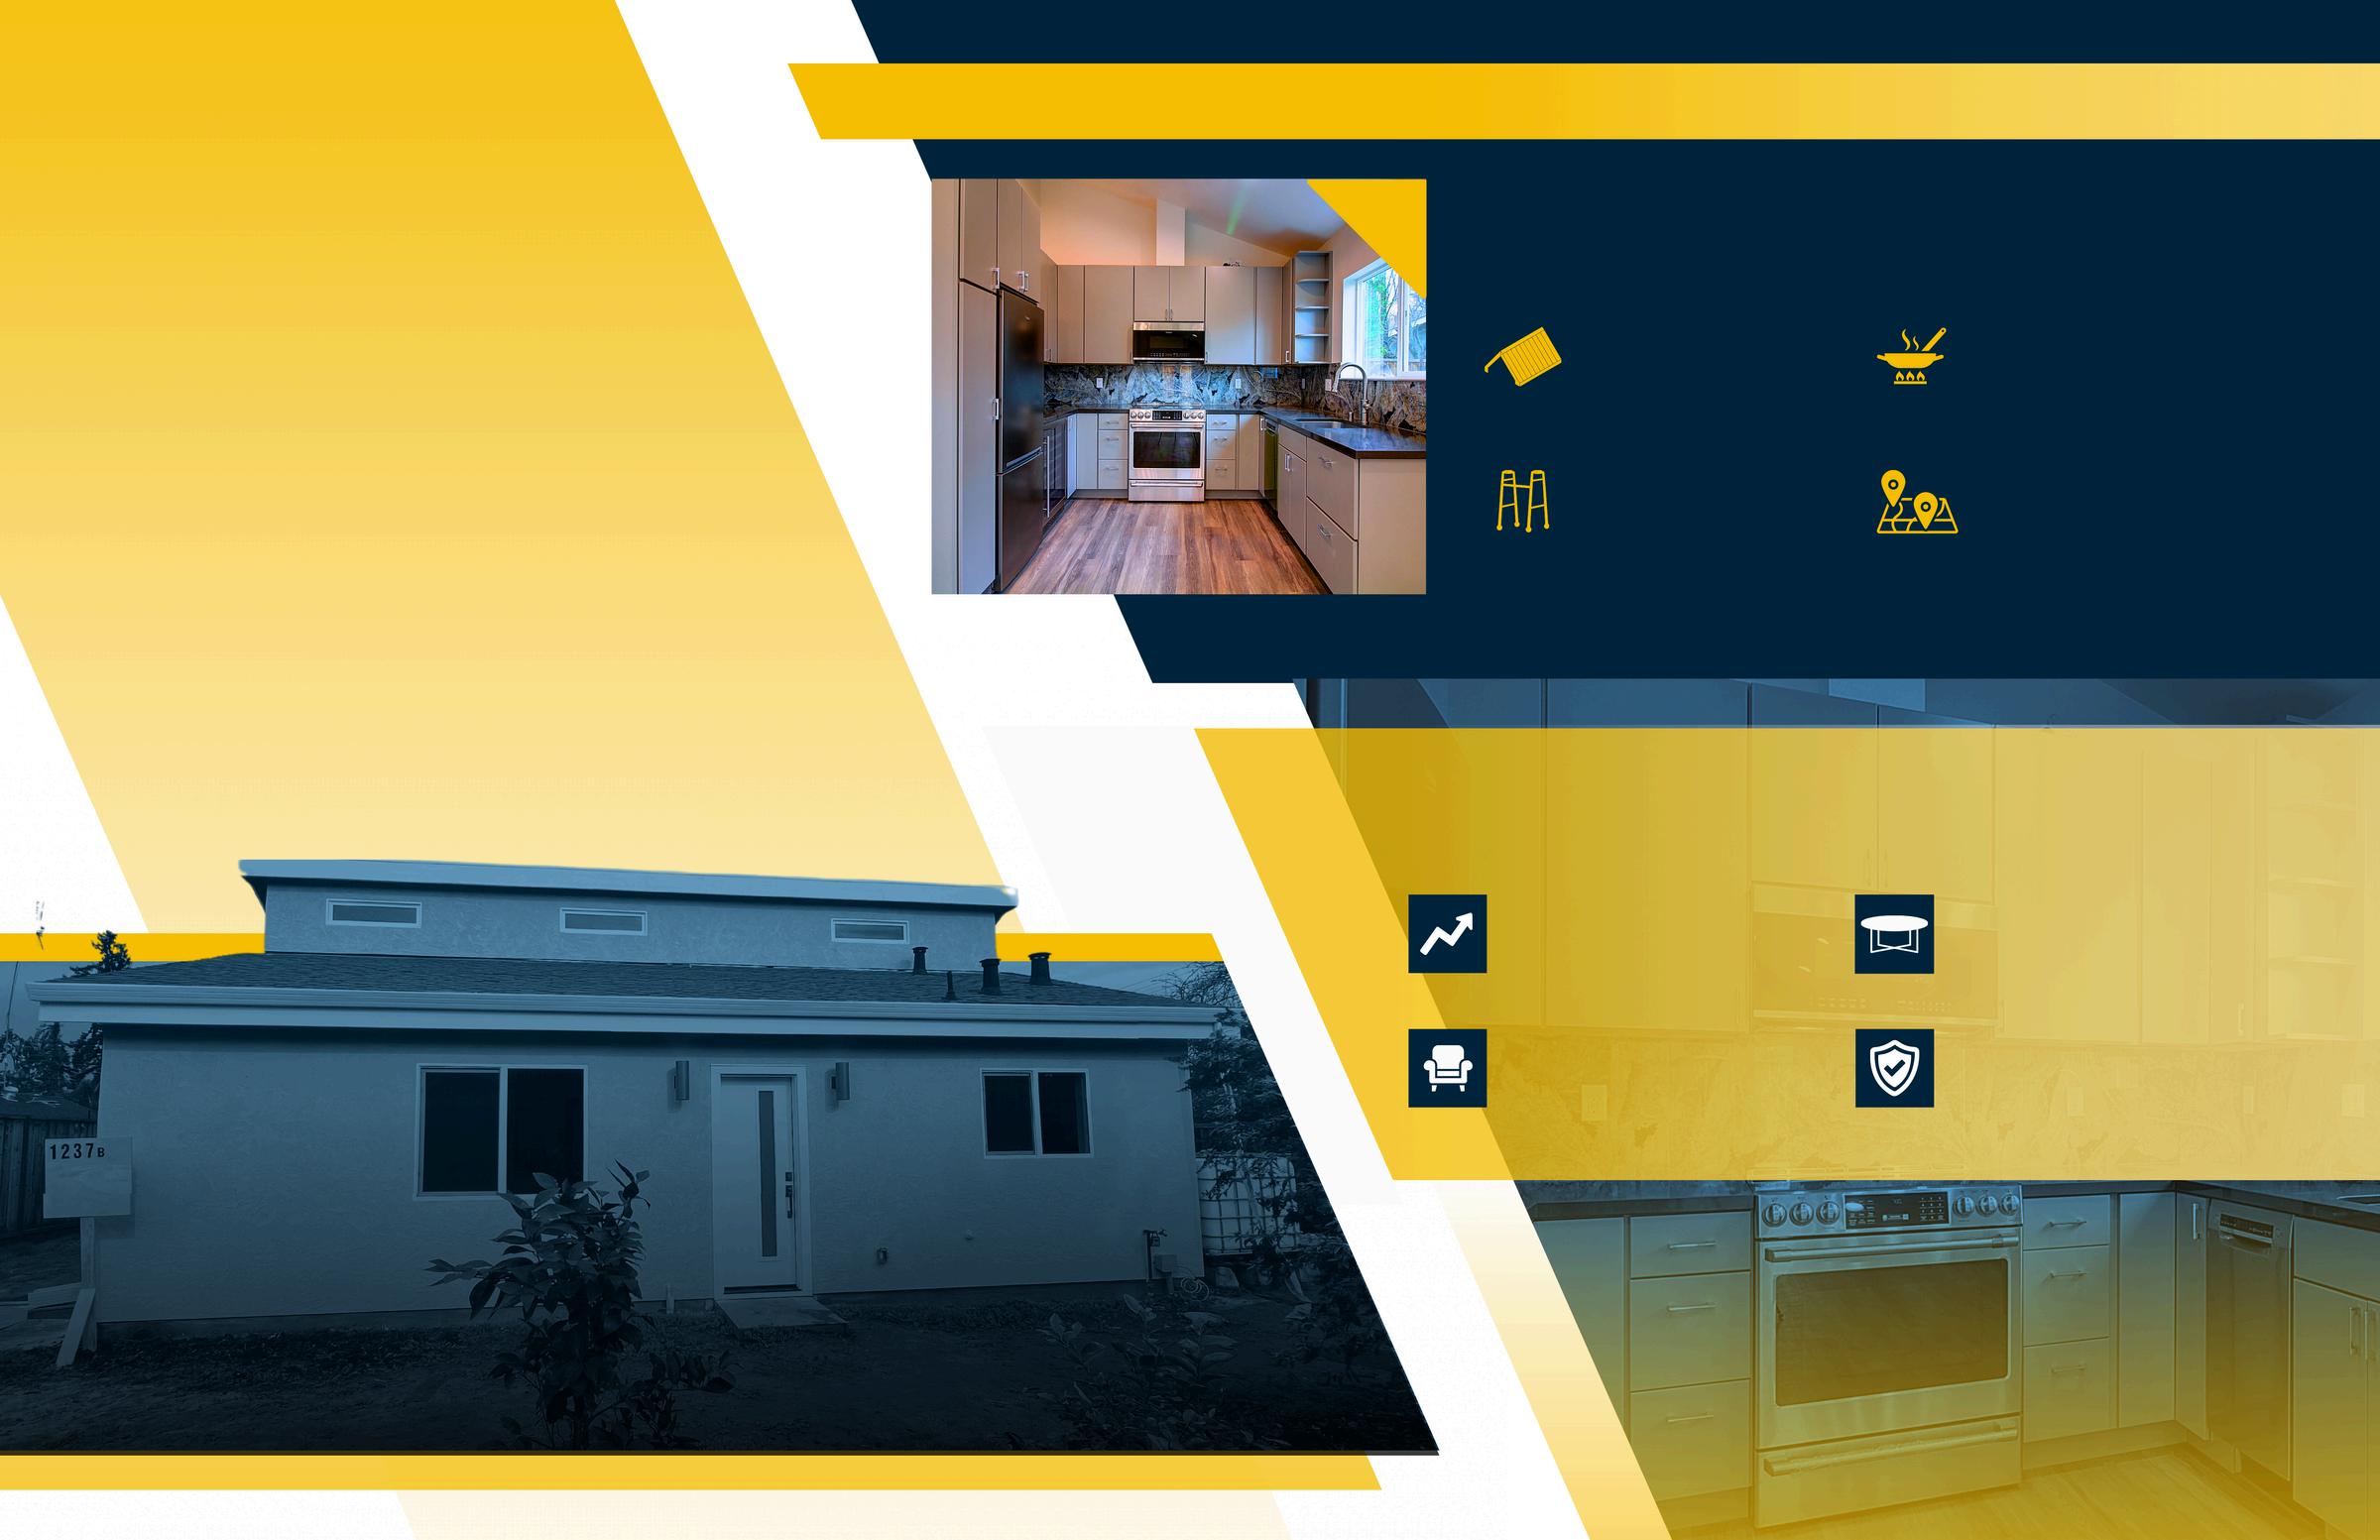
Enhancing Property Value and Family Living Space with an Acton ADU
The Anenberg-Essert family in Campbell collaborated with Acton ADU to create a versatile, comfortable, and valuable addition to their property. This ADU project is a shining example of how a well-designed accessory dwelling unit can increase property value and serve a family’s unique needs.
GoalsandVision
The family envisioned an ADU that would function as an independent living space for family members, enhance their property’s worth, and provide seamless integration with the main home They wanted a space that balanced privacy with connectivity, feeling like a natural extension of their residence
Design and Construction Details
Constructed at 747 square feet, this ADU was designed with modern, high-quality finishes to serve both aesthetic and practical needs. Key features include:
Vaulted Ceilings
Creates a spacious, open atmosphere
Senior-Friendly Living
Safe, independent space for elderly family members
Fully Equipped Kitchen
Modern amenities for everyday convenience
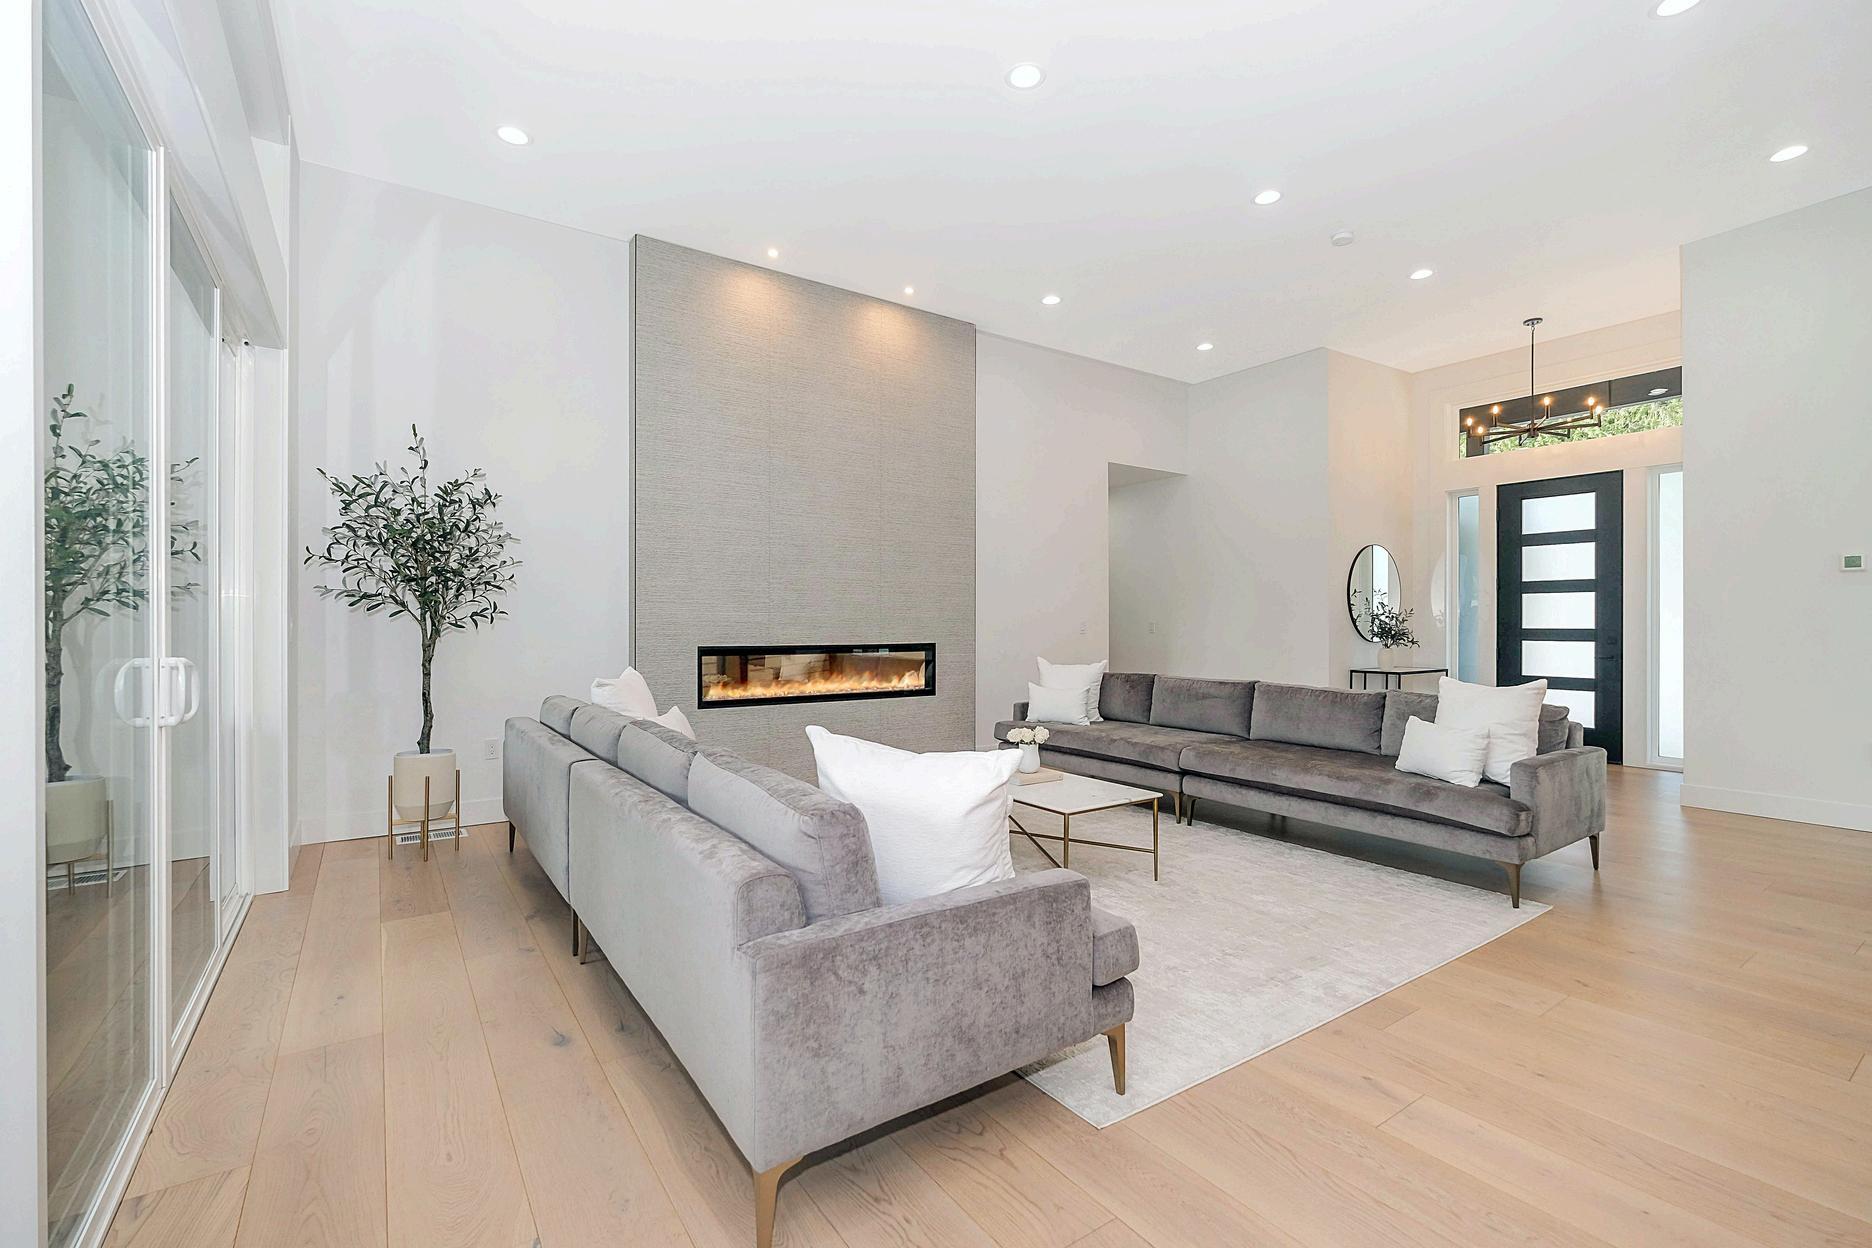
Open Living Area
Multipurpose area for relaxation and entertainment
Results and Impact
The completion of the Anenberg-Essert ADU led to several valuable outcomes:
Increased Property Value
The ADU addition significantly boosted property value
Flexible Living Space
A versatile space for family, guests, or as a rental
Modern Comforts
High-end finishes and amenities enhance both function and style.
Enhanced Family Living
The ADU enriches the AnenbergEssert family’s home with both privacy and connection
VENDOR DIRECTORY
When it comes to home ownership, knowing who you can trust is crucial. That's why we've curated a select list of trusted vendors who are ready to help with your home goals.
PaloAlto
What's in the Palo Alto data?
There were 69 single-family homes for sale, providing 2.9 months of inventory. There were 43 new listings, and 24 homes sold at a median price of $4.2m. The median overbid percentage was at 105%, with an average of 24 days on the market.
There were 34 condo and townhome units for sale, providing 4.3 months of inventory. There were 12 new listings and 8 units sold at a median sale price of $1.2m. The median overbid percentage was at 97.9%, with an average of 69 days on the market.
Single-Family Homes
43 New Listings
24 Sold Listings
2.9 Months of Inventory
$4.2M
Median Sale Price
105%
Median Sale vs List
24 Avg Days on Market
The data, sourced from Courted.io, includes all single-family homes, condos and townhomes in the California Area above from July 2024 to July 2025. This may include preliminary data, and may vary from the time the data was gathered. All data is deemed reliable but not guaranteed. DRE# 01511642. Copyright KW Advisors Palo Alto 2025. Each office is independently owned and operated.
New Listings 4.3
Months of Inventory
97.9%
Median Sale vs List
Median SalesPrice
Single-Family Homes
The median sale price has increased from $4m last July 2024, to $4 2m as of July 2025
Condos & Townhomes
The median sale price has increased from $1 1m last July 2024, to $1 2m as of July 2025
AVGDays OntheMarket
Single-Family Homes
The average time spent on the market went down from 32 days last July 2024, to 24 days as of July 2025
Condos & Townhomes
The average time spent on the market went up from 67 days in July 2024, to 69 days as of July 2025.
Overbids
Single-Family Homes
The overbid percentage has increased from 104% last July 2024, to 105% a year later
Condos & Townhomes
The overbid percentage has decreased from 102.1% last July 2024, to 97.9% a year later.
Redwood City
What's in the Redwood City data?
There were 64 single-family homes for sale, providing 1.9 months of inventory. There were 40 new listings, and 34 homes sold at a median price of $2.2m. The median overbid percentage was at 100%, with an average of 36 days on the market
There were 24 condo and townhome units for sale, providing 3.4 months of inventory. There were 12 new listings and 7 units sold at a median sale price of $1.1m. The median overbid percentage was at 105%, with an average of 42 days on the market.
Single-Family Homes
40 New Listings
34 Sold Listings
1.9 Months of Inventory
$2.2M
Median Sale Price
100%
Median Sale vs List
36 Avg Days on Market
The data, sourced from Courted.io, includes all single-family homes, condos and townhomes in the California Area above from July 2024 to July 2025. This may include preliminary data, and may vary from the time the data was gathered. All data is deemed reliable but not guaranteed. DRE# 01511642. Copyright KW Advisors Palo Alto 2025. Each office is independently owned and operated.
New Listings
Townhomes
7
Sold Listings
3.4
Months of Inventory
105%
Median Sale vs List
$1.1M
Median Sale Price
42
Avg Days on Market
RedwoodCity
JULY 2024 - JULY 2025 LISTINGS FOR SALE
Single-Family Homes
Last 12 months, year-over-year.
Condos & Townhomes
Last 12 months, year-over-year
Median SalesPrice
Single-Family Homes
The median sale price has increased from $2m last July 2024, to $2 2m as of July 2025
Condos & Townhomes
The median sale price has increased from $1 1m last July 2024, to $1 12m as of July 2025
AVGDays OntheMarket
Single-Family Homes
The average time spent on the market went up from 22 days last July 2024, to 36 days as of July 2025
Condos & Townhomes
The average time spent on the market went down from 58 days in July 2024, to 42 days as of July 2025.
Overbids
Single-Family Homes
The overbid percentage has decreased from 104 9% last July 2024, to 100% a year later
Condos & Townhomes
The overbid percentage has increased from 98.7% last July 2024, to 105% a year later.
Portola Valley
What's in the Porto data?
There were 25 single-family h providing 25 months of inven new listings, and 1 home sol $6m. The median overbid pe 104%, with an average of 10
There was no data for condo for this month.
single-family homes, condos and 2025. This may include gathered. All data is deemed Advisors Palo Alto 2025. Each
No data available for July 2025.
Median SalesPrice
Single-Family Homes
The median sale price has increased from $4 3m last July 2024, to $6m as of July 2025
Condos & Townhomes
No data for this month
AVGDays OntheMarket
Single-Family Homes
The average time spent on the market went down from 37 days last July 2024, to 10 days as of July 2025
Condos & Townhomes
No data for this month
Overbids
Single-Family Homes
The overbid percentage has increased from 100 5% last July 2024, to 104% a year later
Condos & Townhomes
No data for this month
Menlo
What's in the Menl
There were 38 single-family h providing 1.2 months of inve new listings, and 31 homes s of $3.6m. The median overbi 99.6%, with an average of 33
There were 21 condo and tow sale, providing 7 months of in 8 new listings and 3 units so price of $1.6m. The median o was at 98%, with an average market.
single-family homes, condos and 2025. This may include gathered. All data is deemed Advisors Palo Alto 2025. Each
8
New Listings
3 Sold Listings
7 Months of Inventory
$1.6M
Median Sale Price 98%
Median Sale vs List
31 Avg Days on Market
MenloPark
JULY 2024 - JULY 2025
TINGS FOR SALE SOLD LISTINGS
Family Homes
2 months, year-over-year.
s & Townhomes
2 months, year-over-year
Median SalesPrice
Single-Family Homes
The median sale price has increased from $2 9m last July 2024, to $3 6m as of July 2025
Condos & Townhomes
The median sale price has increased from $1 2m last July 2024, to $1 6m as of July 2025
AVGDays OntheMarket
Single-Family Homes
The average time spent on the market went up from 31 days last July 2024, to 33 days as of July 2025
Condos & Townhomes
The average time spent on the market went down from 70 days in July 2024, to 31 days as of July 2025.
Overbids
Single-Family Homes
The overbid percentage has decreased from 103 7% last July 2024, to 99 6% a year later
Condos & Townhomes
The overbid percentage has decreased from 99.1% last July 2024, to 98% a year later.
Atherton
What's in the Atherton data?
There were 11 single-family homes for sale, providing 3.7 months of inventory. There wer new listings, and 3 homes sold at a median p of $11.6m. The median overbid percentage w 100.2%, with an average of 31 days on the m
There was no data for condo and townhouse for this month.
CONDO
Condo & Townhomes
No data available for July 2025.
Atherton
JULY 2024 - JULY 2025
Single-Family Homes
Last 12 months, year-over-year.
No data for this month.
Condos & Townhomes
Last 12 months, year-over-year
Median SalesPrice
Single-Family Homes
The median sale price has increased from $6 1m last July 2024, to $11 6m as of July 2025
Condos & Townhomes
No data for this month
AVGDays OntheMarket
Single-Family Homes
The average time spent on the market went up from 28 days last July 2024, to 31 days as of July 2025
Condos & Townhomes
No data for this month
Overbids
Single-Family Homes
The overbid percentage has increased from 98 6% last July 2024, to 100 2% a year later
Condos & Townhomes
No data for this month
LosAltos
What's in the Los Altos data?
There were 31 single-family homes for sale, providing 2.4 months of inventory. There were 27 new listings, and 13 homes sold at a median price of $4.1m. The median overbid percentage was at 104.2%, with an average of 14 days on the market.
There were 14 condo and townhome units for sale, providing 4.7 months of inventory. There were 9 new listings and 3 units sold at a median sale price of $1.8m. The median overbid percentage was at 115.6%, with an average of 3 days on the market.
Single-Family Homes
27 ew Listings
13 Sold Listings
2.4 Months of Inventory
$4.1M Median Sale Price
104.2%
Median Sale vs List
14 Avg Days on Market
The data, sourced from Courted.io, includes all single-family homes, condos and townhomes in the California Area above from July 2024 to July 2025. This may include preliminary data, and may vary from the time the data was gathered. All data is deemed reliable but not guaranteed. DRE# 01511642. Copyright KW Advisors Palo Alto 2025. Each office is independently owned and operated.
9
New Listings
3 Sold Listings
4.7
Months of Inventory
$1.8M
Median Sale Price 115.6%
Median Sale vs List
3 Avg Days on Market
LosAltos
JULY 2024 - JULY 2025
LISTINGS FOR SALE
Single-Family Homes
Last 12 months, year-over-year.
Condos & Townhomes
Last 12 months, year-over-year
Median SalesPrice
Single-Family Homes
The median sale price has decreased from $4 6m last July 2024, to $4 1m as of July 2025
Condos & Townhomes
The median sale price has decreased from $2 9m last July 2024, to $1 8m as of July 2025
AVGDays OntheMarket
Single-Family Homes
The average time spent on the market went down from 19 days last July 2024, to 14 days as of July 2025
Condos & Townhomes
The average time spent on the market went down from 14 days in July 2024, to 3 days as of July 2025.
Overbids
Single-Family Homes
The overbid percentage has increased from 103 5% last July 2024, to 104 2% a year later
Condos & Townhomes
The overbid percentage has increased from 102.7% last July 2024, to 115.6% a year later.
SanJose
What's in the San Jose data?
There were 588 single-family homes for sale, providing 1.9 months of inventory. There were 403 new listings, and 303 homes sold at a median price of $1.7m. The median overbid percentage was at 102.9%, with an average of 24 days on the market.
There were 461 condo and townhome units for sale, providing 4 8 months of inventory There were 199 new listings and 97 units sold at a median sale price of $840k. The median overbid percentage was at 101%, with an average of 34 days on the market.
Single-Family Homes
403 New Listings
303 Sold Listings
1.9 Months of Inventory
$1.7M
Median Sale Price
102.9%
Median Sale vs List
24 Avg Days on Market
The data, sourced from Courted.io, includes all single-family homes, condos and townhomes in the California Area above from July 2024 to July 2025. This may include preliminary data, and may vary from the time the data was gathered. All data is deemed reliable but not guaranteed. DRE# 01511642. Copyright KW Advisors Palo Alto 2025. Each office is independently owned and operated.
199
New Listings
97
Sold Listings
4.8
Months of Inventory
$840K
Median Sale Price
101%
Median Sale vs List 34 Avg Days on Market
JULY 2024 - JULY 2025
Single-Family Homes
Last 12 months, year-over-year.
Condos & Townhomes
Last 12 months, year-over-year
Median SalesPrice
Single-Family Homes
The median sale price has increased from $1 6m last July 2024, to $1 7m as of July 2025
Condos & Townhomes
The median sale price has increased from $790k last July 2024, to $840k as of July 2025
AVGDays OntheMarket
Single-Family Homes
The average time spent on the market went down from 28 days last July 2024, to 24 days as of July 2025
Condos & Townhomes
The average time spent on the market went down from 42 days in July 2024, to 34 days as of July 2025.
Overbids
Single-Family Homes
The overbid percentage has decreased from 105% last July 2024, to 102 9% a year later
Condos & Townhomes
The overbid percentage has decreased from 102.5% last July 2024, to 101% a year later.
Mountain View
What's in the Mountain View data?
There were 19 single-family homes for sale, providing 1.3 months of inventory. There were 16 new listings, and 15 homes sold at a median price of $2.7m. The median overbid percentage was at 105%, with an average of 14 days on the market
There were 63 condo and townhome units for sale, providing 2.1 months of inventory. There were 32 new listings and 30 units sold at a median sale price of $1.2m. The median overbid percentage was at 101.9%, with an average of 32 days on the market.
Single-Family Homes
16 New Listings
15 Sold Listings
1.3 Months of Inventory
$2.7M Median Sale Price
105%
Median Sale vs List
14 Avg Days on Market
The data, sourced from Courted.io, includes all single-family homes, condos and townhomes in the California Area above from July 2024 to July 2025. This may include preliminary data, and may vary from the time the data was gathered. All data is deemed reliable but not guaranteed. DRE# 01511642. Copyright KW Advisors Palo Alto 2025. Each office is independently owned and operated.
32
New Listings
30 Sold Listings
2.1
Months of Inventory
$1.2M
Median Sale Price
101.9%
Median Sale vs List
32 Avg Days on Market
JULY 2024 - JULY 2025
TINGS FOR SALE SOLD LISTINGS
Family Homes
2 months, year-over-year.
s & Townhomes
2 months, year-over-year
Median SalesPrice
Single-Family Homes
The median sale price has increased from $2 3m last July 2024, to $2 7m as of July 2025
Condos & Townhomes
The median sale price has increased from $1 2m last July 2024, to $1 29m as of July 2025
AVGDays OntheMarket
Single-Family Homes
The average time spent on the market went down from 25 days last July 2024, to 14 days as of July 2025
Condos & Townhomes
The average time spent on the market went down from 39 days in July 2024, to 32 days as of July 2025.
Overbids
Single-Family Homes
The overbid percentage has increased from 102 9% last July 2024, to 105% a year later
Condos & Townhomes
The overbid percentage has decreased from 103.9% last July 2024, to 101.9% a year later.
SanMateo County
What's in the San Mateo County data?
There were 529 single-family homes for sale, providing 2 months of inventory. There were 320 new listings, and 262 homes sold at a median price of $2.1m. The median overbid percentage was at 102 1%, with an average of 28 days on the market.
There were 289 condo and townhome units for sale, providing 4.8 months of inventory. There were 112 new listings and 60 units sold at a median sale price of $970k. The median overbid percentage was at 100.2%, with an average of 38 days on the market
He-Family Homes
0 ings of Inventory
262 Sold Listings
$2.1M Median Sale Price
2.1% Sale vs List
28 Avg Days on Market
sourced from Courted.io, includes all single-family homes, condos and in the California Area above from July 2024 to July 2025. This may include data, and may vary from the time the data was gathered. All data is deemed not guaranteed. DRE# 01511642. Copyright KW Advisors Palo Alto 2025. Each office is independently owned and operated.
112
New Listings
60
Sold Listings
4.8
Months of Inventory
$970K
Median Sale Price
100.2%
Median Sale vs List
38 Avg Days on Market
SanMateoCounty
JULY 2024 - JULY 2025
LISTINGS FOR SALE SOLD LISTINGS
Single-Family Homes
Last 12 months, year-over-year.
Condos & Townhomes
Last 12 months, year-over-year
Median SalesPrice
Single-Family Homes
The median sale price has remained the same from $2 1m last July 2024, to $2 1m as of July 2025
Condos & Townhomes
The median sale price has decreased from $1 1m last July 2024, to $970k as of July 2025
AVGDays OntheMarket
Single-Family Homes
The average time spent on the market went down from 36 days last July 2024, to 28 days as of July 2025
Condos & Townhomes
The average time spent on the market went down from 46 days in July 2024, to 38 days as of July 2025.
Overbids
Single-Family Homes
The overbid percentage has decreased from 105 1% last July 2024, to 102 1% a year later
Condos & Townhomes
The overbid percentage has decreased from 101.8% last July 2024, to 100.2% a year later.
Sant Cou
What's in t
County da
There were 1,21 providing 2.1 mo new listings, and price of $1.9m. T was at 103 1%, w market.
There were 852 sale, providing 3 were 385 new lis median sale pric percentage was days on the mar
and include deemed Each
Ne Months of 100. Median S
Median SalesPrice
Single-Family Homes
The median sale price has increased from $1 8m last July 2024, to $1 9m as of July 2025
Condos & Townhomes
The median sale price has increased from $980k last July 2024, to $1m as of July 2025
AVGDays OntheMarket
Single-Family Homes
The average time spent on the market went down from 27 days last July 2024, to 25 days as of July 2025
Condos & Townhomes
The average time spent on the market went down from 40 days in July 2024, to 39 days as of July 2025.
Overbids
Single-Family Homes
The overbid percentage has decreased from 104 9% last July 2024, to 103 1% a year later
Condos & Townhomes
The overbid percentage has decreased from 103% last July 2024, to 100.6% a year later.
Monter County
What's in the Mon data?
There were 505 single-family providing 4.1 months of inve new listings, and 123 homes price of $1m. The median ov at 98 4%, with an average of market.
There were 84 condo and tow sale, providing 6 months of in 29 new listings and 14 units price of $910k. The median o was at 97%, with an average market
single-family homes, condos and 2025. This may include gathered. All data is deemed Advisors Palo Alto 2025. Each
Months of Inventory
Median Sale vs List
Median SalesPrice
Single-Family Homes
The median sale price has increased from $949k last July 2024, to $1m as of July 2025
Condos & Townhomes
The median sale price has increased from $735k last July 2024, to $910k as of July 2025
AVGDays OntheMarket
Single-Family Homes
The average time spent on the market went down from 74 days last July 2024, to 47 days as of July 2025
Condos & Townhomes
The average time spent on the market went up from 79 days in July 2024, to 93 days as of July 2025.
Overbids
Single-Family Homes
The overbid percentage has decreased from 98 7% last July 2024, to 98 4% a year later
Condos & Townhomes
The overbid percentage has decreased from 97.9% last July 2024, to 97% a year later.
SantaC County
What's in the Sant County data?
There were 493 single-family providing 4.1 months of inve new listings, and 120 homes price of $1.3m. The median o was at 98.9%, with an averag market
There were 143 condo and to sale, providing 6.5 months of were 50 new listings and 22 sale price of $810k. The med percentage was at 99%, with days on the market.
single-family homes, condos and 2025. This may include gathered. All data is deemed Advisors Palo Alto 2025. Each
New Listings
Months of Inventory 99%
Median Sale vs List
Median SalesPrice
Single-Family Homes
The median sale price has increased from $1 35m last July 2024, to $1 37m as of July 2025
Condos & Townhomes
The median sale price has increased from $730k last July 2024, to $810k as of July 2025
AVGDays OntheMarket
Single-Family Homes
The average time spent on the market went down from 52 days last July 2024, to 37 days as of July 2025
Condos & Townhomes
The average time spent on the market went down from 56 days in July 2024, to 49 days as of July 2025.
Overbids
Single-Family Homes
The overbid percentage has decreased from 99 7% last July 2024, to 98 9% a year later
Condos & Townhomes
The overbid percentage has decreased from 99.9% last July 2024, to 99% a year later.
East PaloAlto
What's in the East Palo Alto data?
There were 11 single-family homes for sale, providing 3.7 months of inventory. There were 4 new listings, and 3 homes sold at a median price of $975k. The median overbid percentage was at 107 6%, with an average of 23 days on the market
There was 1 condo and townhome unit for sale, providing 1 month of inventory. There was 1 new listing and 1 unit sold at a median sale price of $775k. The median overbid percentage was at 100%, with an average of 4 days on the market.
Listing 1 Month of Inventory 100%
Median Sale vs List
Median SalesPrice
Single-Family Homes
The median sale price has decreased from $1 1m last July 2024, to $975k as of July 2025
Condos & Townhomes
The median sale price has increased from $0 last July 2024, to $775k as of July 2025
AVGDays OntheMarket
Single-Family Homes
The average time spent on the market went down from 55 days last July 2024, to 23 days as of July 2025
Condos & Townhomes
The average time spent on the market went up from 0 days in July 2024, to 4 days as of July 2025.
Overbids
Single-Family Homes
The overbid percentage has increased from 104 6% last July 2024, to 107 6% a year later
Condos & Townhomes
The overbid percentage has increased from 0% last July 2024, to 100% a year later.
Sunnyvale
What's in the Sunnyvale data?
There were 49 single-family homes for sale, providing 1 month of inventory. There were 38 new listings, and 49 homes sold at a median price of $2.5m. The median overbid percentage was at 107.4%, with an average of 17 days on the market.
There were 62 condo and townhome units for sale, providing 3.6 months of inventory. There were 28 new listings and 17 units sold at a median sale price of $1.3m. The median overbid percentage was at 100.1%, with an average of 28 days on the market.
Single-Family Homes
38 New Listings
49 Sold Listings
1 Month of Inventory
$2.5M
Median Sale Price
107.4%
Median Sale vs List
17 Avg Days on Market
The data, sourced from Courted.io, includes all single-family homes, condos and townhomes in the California Area above from July 2024 to July 2025. This may include preliminary data, and may vary from the time the data was gathered. All data is deemed reliable but not guaranteed. DRE# 01511642. Copyright KW Advisors Palo Alto 2025. Each office is independently owned and operated.
28
New Listings
17
Sold Listings
3.6
Months of Inventory
$1.3M
Median Sale Price
100.1%
Median Sale vs List
28 Avg Days on Market
Sunnyvale
JULY 2024 - JULY 2025
Single-Family Homes
Last 12 months, year-over-year.
Condos & Townhomes
Last 12 months, year-over-year
Median SalesPrice
Single-Family Homes
The median sale price has decreased from $2 55m last July 2024, to $2 54m as of July 2025
Condos & Townhomes
The median sale price has decreased from $1 35m last July 2024, to $1 31m as of July 2025
AVGDays OntheMarket
Single-Family Homes
The average time spent on the market went up from 15 days last July 2024, to 17 days as of July 2025
Condos & Townhomes
The average time spent on the market went down from 37 days in July 2024, to 28 days as of July 2025.
Overbids
Single-Family Homes
The overbid percentage has decreased from 111 3% last July 2024, to 107 4% a year later
Condos & Townhomes
The overbid percentage has decreased from 105.5% last July 2024, to 100.1% a year later.
SantaClara City
What's in the Santa Clara City data?
There were 28 single-family homes for sale, providing 0.8 months of inventory. There were 34 new listings, and 35 homes sold at a median price of $1.8m. The median overbid percentage was at 106 3%, with an average of 20 days on the market
There were 67 condo and townhome units for sale, providing 5.2 months of inventory. There were 25 new listings and 13 units sold at a median sale price of $960k. The median overbid percentage was at 98.3%, with an average of 47 days on the market.
Single-Family Homes
34 New Listings
35 Sold Listings
0.8 Months of Inventory
$1.8M
Median Sale Price
106.3%
Median Sale vs List
20 Avg Days on Market
The data, sourced from Courted.io, includes all single-family homes, condos and townhomes in the California Area above from July 2024 to July 2025. This may include preliminary data, and may vary from the time the data was gathered. All data is deemed reliable but not guaranteed. DRE# 01511642. Copyright KW Advisors Palo Alto 2025. Each office is independently owned and operated.
25
New Listings
13
Sold Listings
5.2
Months of Inventory
$960K
Median Sale Price 98.3%
Median Sale vs List 47
Avg Days on Market
SantaClaraCity
JULY
2024 - JULY 2025
LISTINGS FOR SALE SOLD LISTINGS
ngle-Family Homes
st 12 months, year-over-year.
ondos & Townhomes
st 12 months, year-over-year
Median SalesPrice
Single-Family Homes
The median sale price has decreased from $1 9m last July 2024, to $1 8m as of July 2025
Condos & Townhomes
The median sale price has increased from $855k last July 2024, to $960k as of July 2025
AVGDays OntheMarket
Single-Family Homes
The average time spent on the market went down from 27 days last July 2024, to 20 days as of July 2025
Condos & Townhomes
The average time spent on the market went up from 45 days in July 2024, to 47 days as of July 2025.
Overbids
Single-Family Homes
The overbid percentage has decreased from 107 2% last July 2024, to 106 3% a year later
Condos & Townhomes
The overbid percentage has decreased from 100.7% last July 2024, to 98.3% a year later.
Saratoga
What's in the Saratoga data
There were 29 single-family homes for sal providing 2.2 months of inventory. There w new listings, and 13 homes sold at a medi of $4m. The median overbid percentage w 103.1%, with an average of 12 days on the
There were 16 condo and townhome units sale, providing 16 months of inventory. Th 6 new listings and 1 unit sold at a median price of $735k. The median overbid percen was at 97%, with an average of 147 days o market.
13 Sold Listings
$4M Median Sale Price
12 Avg Days on Market
includes all single-family homes, condos and from July 2024 to July 2025. This may include time the data was gathered. All data is deemed 01511642. Copyright KW Advisors Palo Alto 2025. Each office is independently owned and operated.
New Listings
1 Sold Listing
16
Months of Inventory $735K
Median Sale Price 97%
Median Sale vs List 147 Avg Days on Market
JULY 2024 - JULY 2025
y Homes ths, year-over-year.
ownhomes ths, year-over-year
Median SalesPrice
Single-Family Homes
The median sale price has decreased from $4 1m last July 2024, to $4m as of July 2025
Condos & Townhomes
The median sale price has decreased from $1 2m last July 2024, to $735k as of July 2025
AVGDays OntheMarket
Single-Family Homes
The average time spent on the market went down from 23 days last July 2024, to 12 days as of July 2025
Condos & Townhomes
The average time spent on the market went up from 26 days in July 2024, to 147 days as of July 2025.
Overbids
Single-Family Homes
The overbid percentage has decreased from 106 9% last July 2024, to 103 1% a year later
Condos & Townhomes
The overbid percentage has decreased from 109.2% last July 2024, to 97% a year later.