That's the question you should be asking yourself.
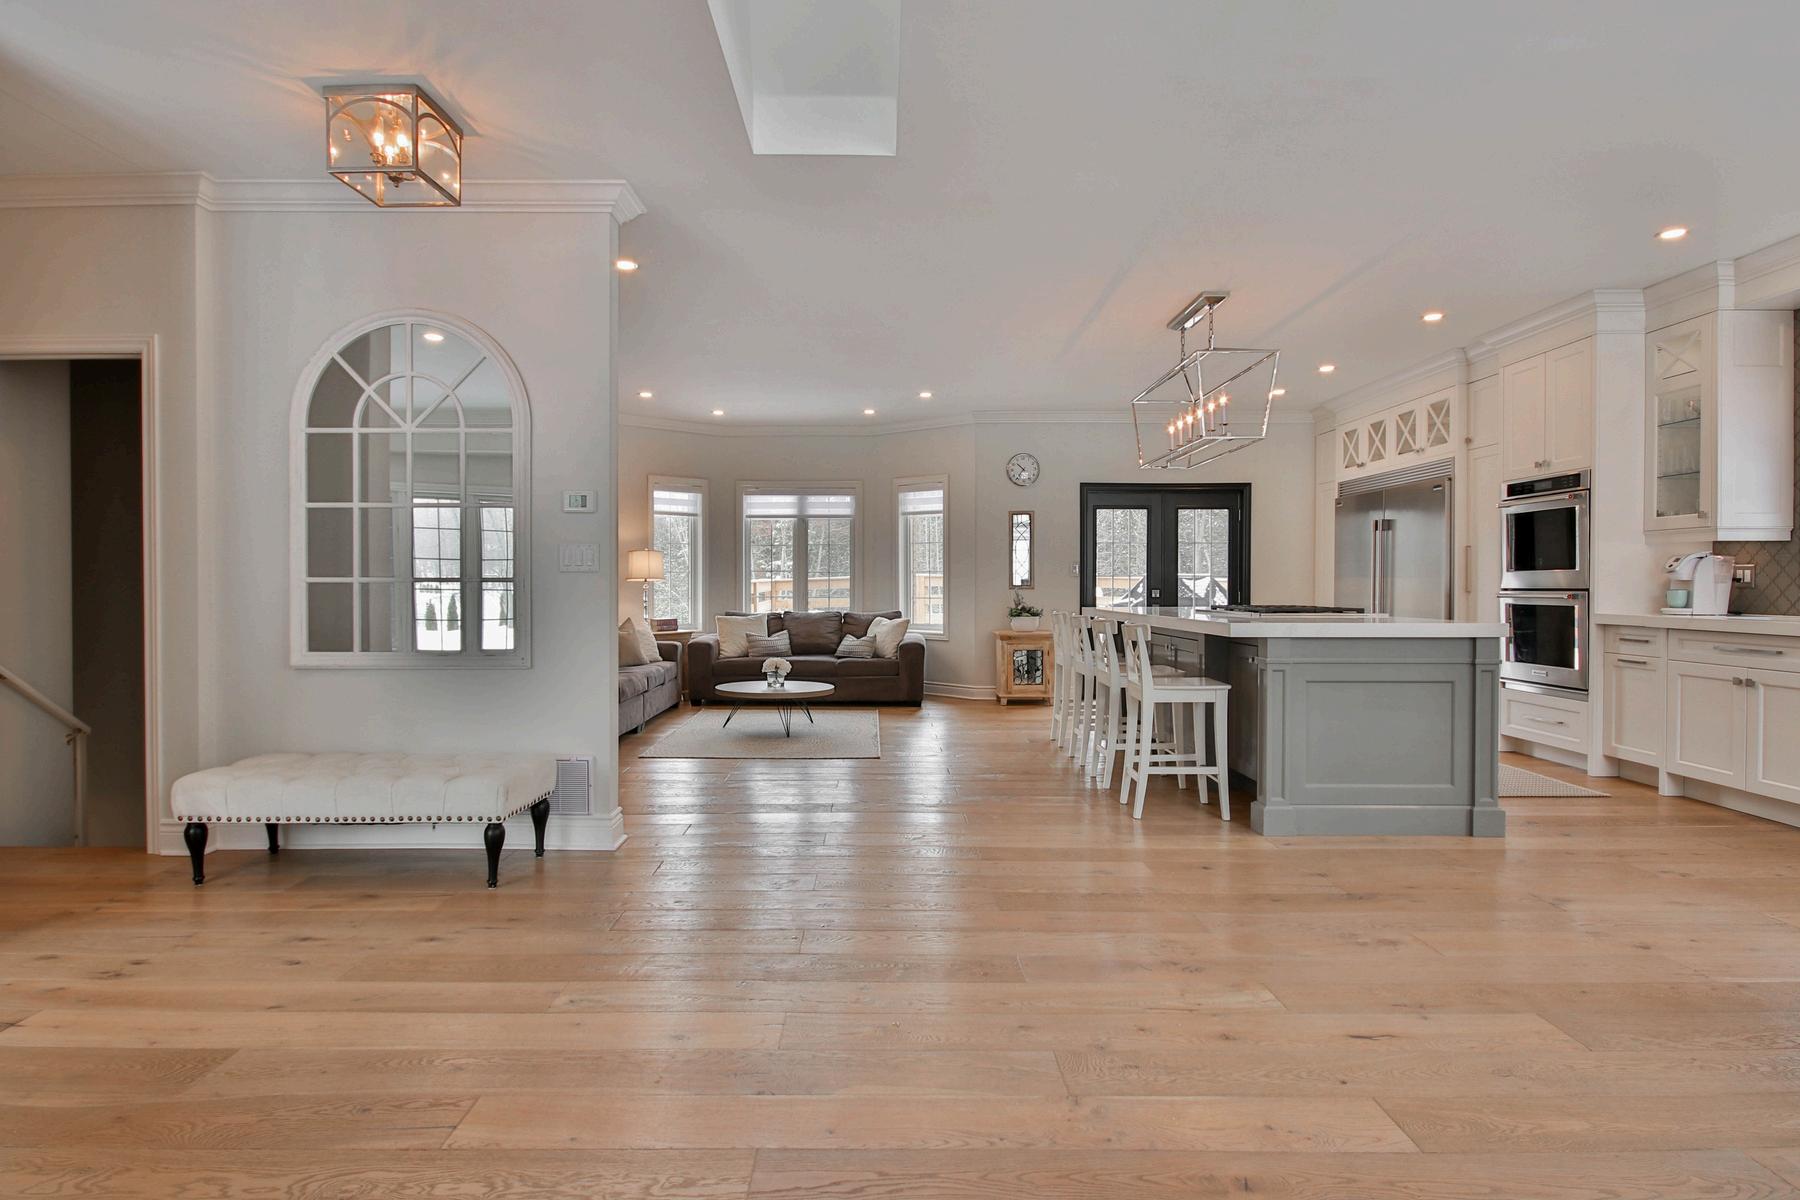
Our market is incredibly diverse and rapidly changing. Values vary not just by neighborhood but by street. Your home isn't necessarily worth what your neighbors' home is. It's the current market that sets the value of your home.
So, do you know what your home is worth in today's market?
Icanhelp...
Contact me for a confidential, no obligation assessment of your home's value.
TheTruthAboutDownPayments (It’sNotWhatYouThink)
Buying a home is exciting… until you start thinking about the down payment. That’s when the worry can set in.
“I’ll never save enough.”
“I need a small fortune just to get started.”
“I guess I’ll just rent forever.”
Sound familiar? You’re not alone. And you’re definitely not out of luck.
Here’s the thing: a lot of what you’ve heard about down payments just isn’t true. And once you know the facts, you might realize you’re a lot closer to owning a home than you think.
Let’s break it all down and bust some big down payment myths while we’re at it.
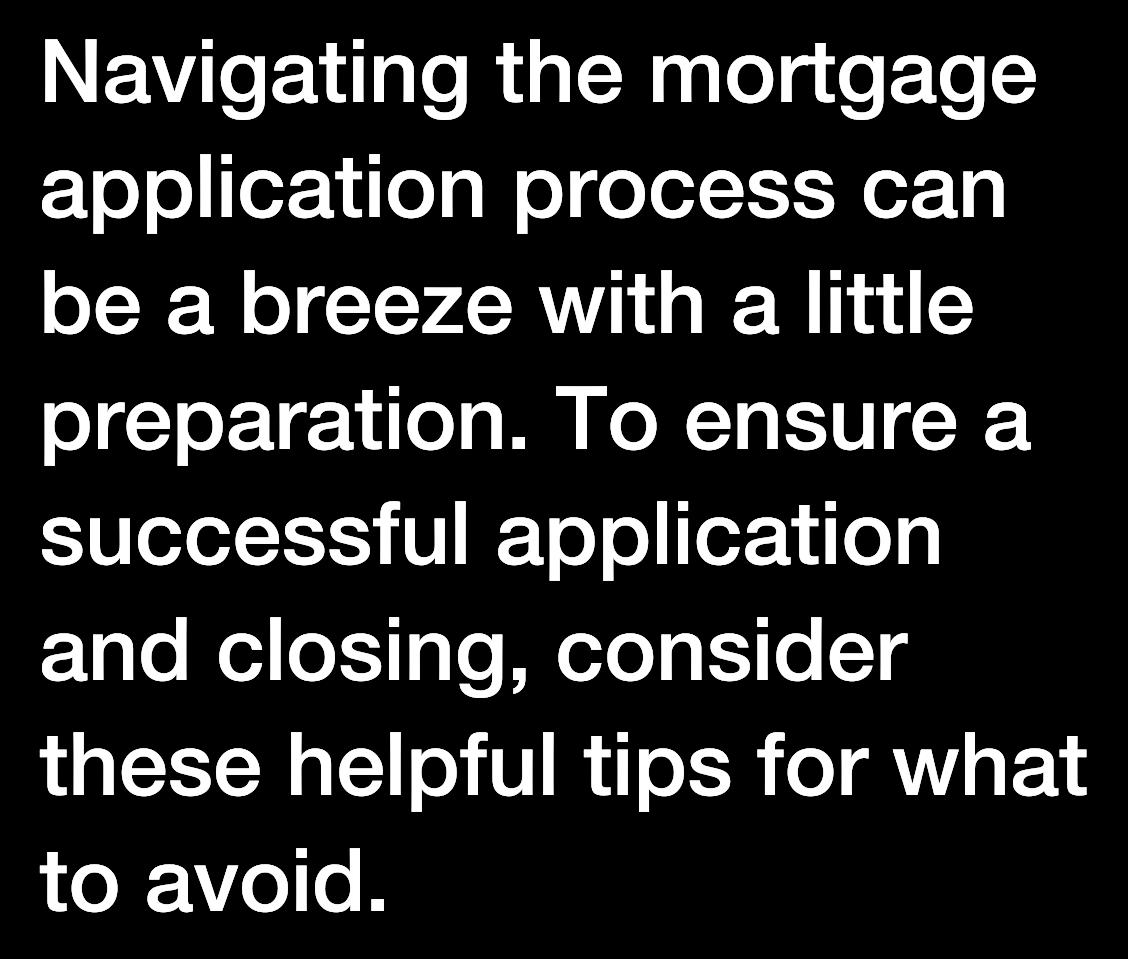
Smart Strategies for a Mortgage Application
Avoid paying off debts or collections without professional advice.
Don't have your credit report pulled too many times - this can hurt your credit score. 3 4 5 6 1 2
Always consult your mortgage professional before making large financial moves. Use verified funds for deposits to prevent closing delays.
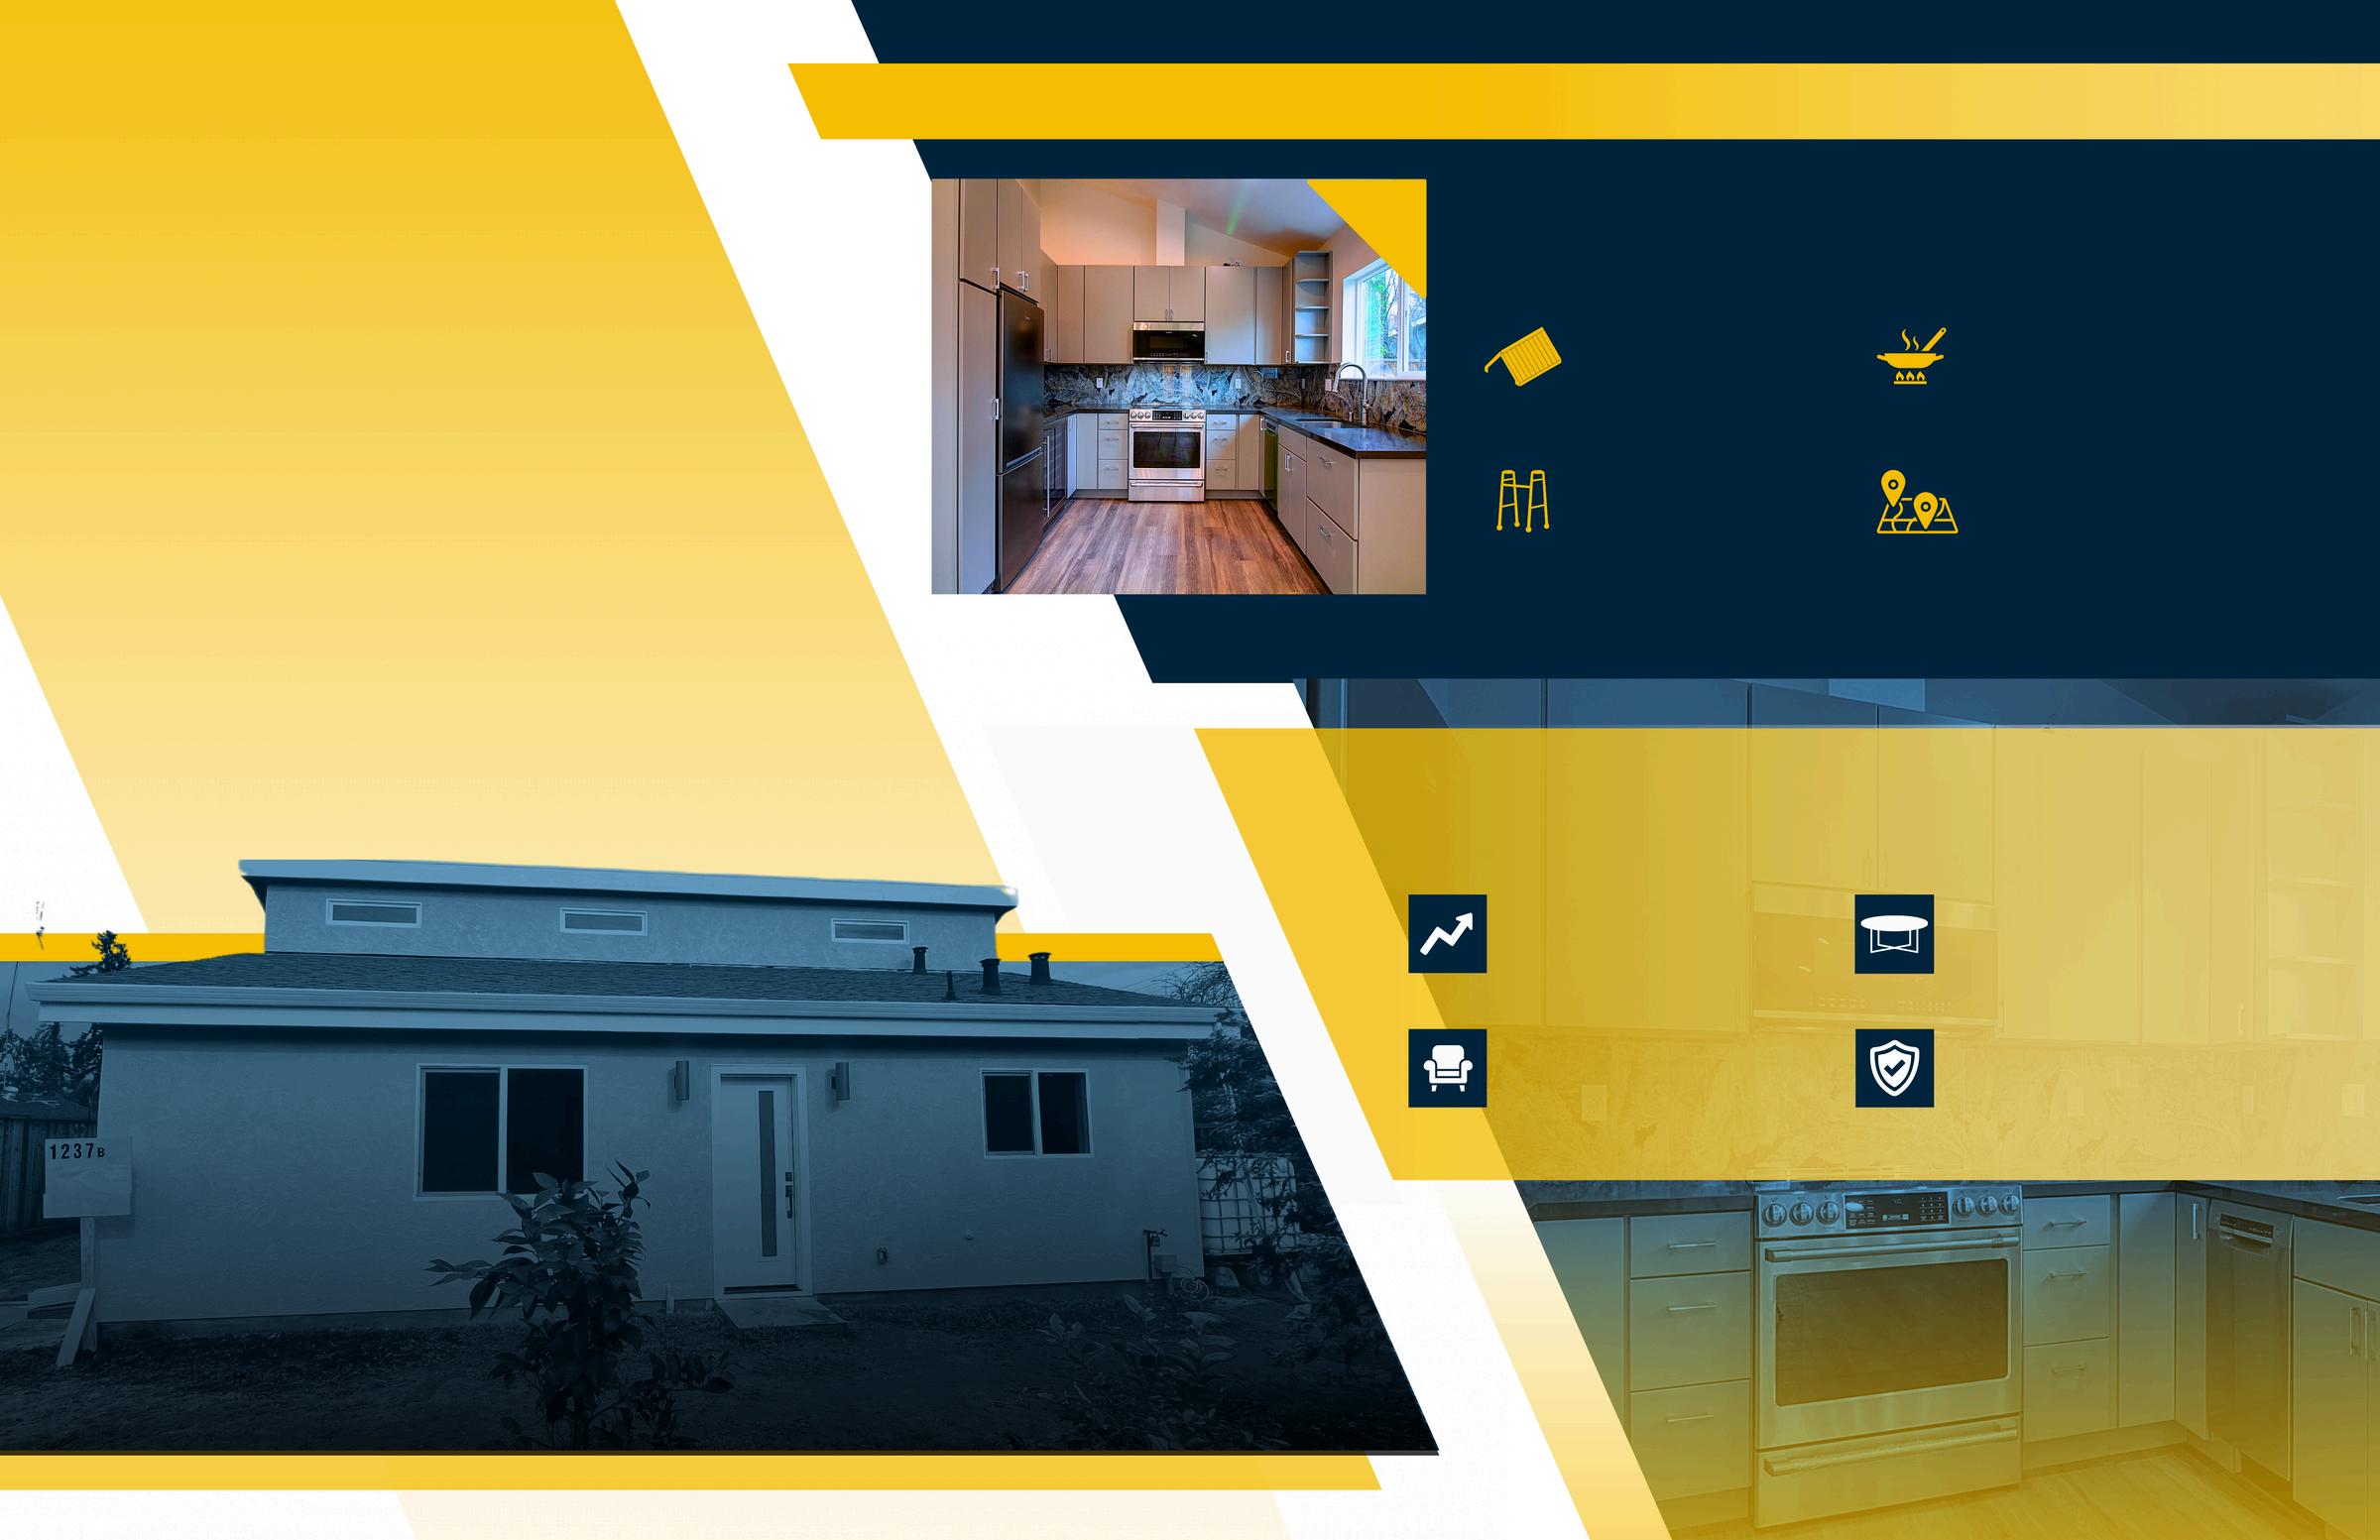
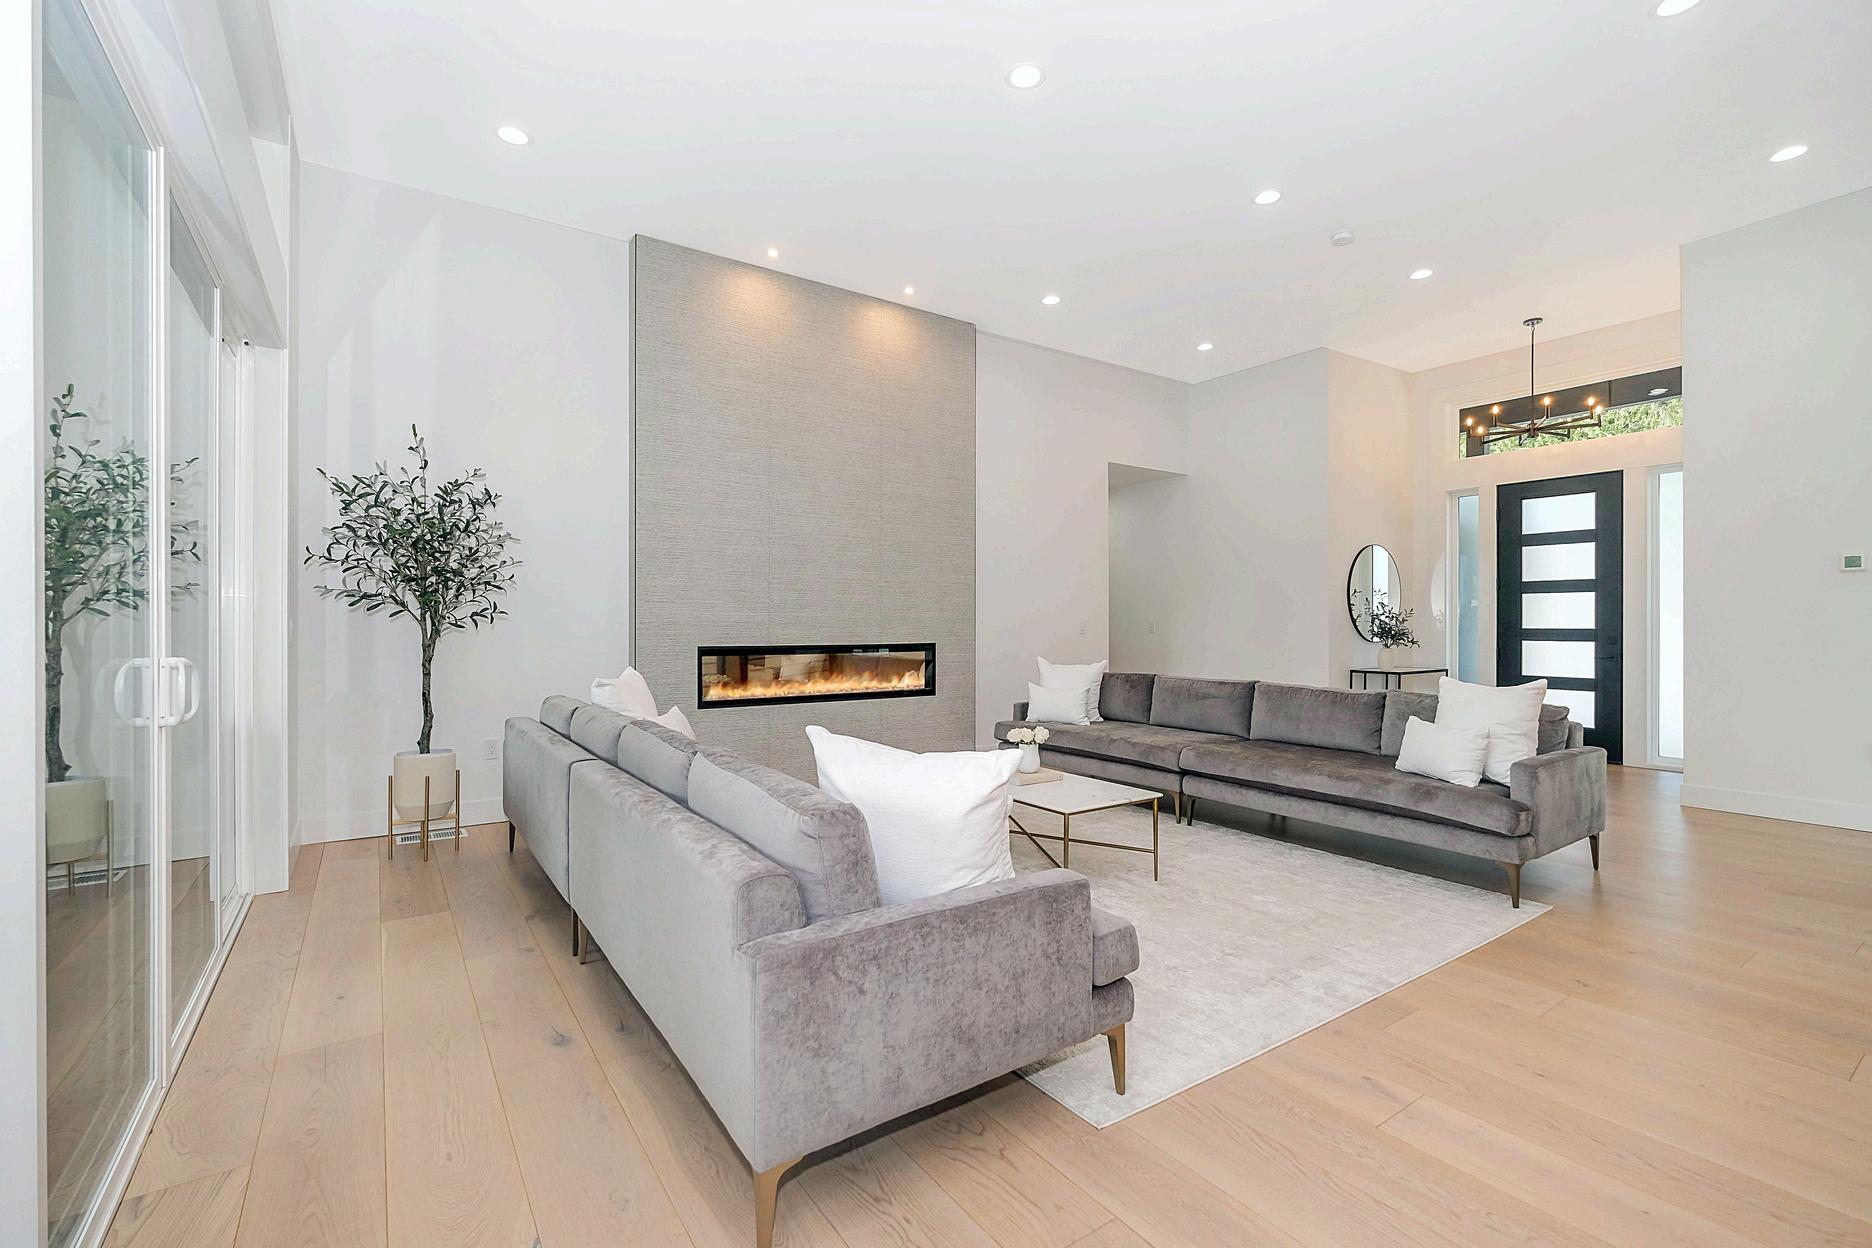
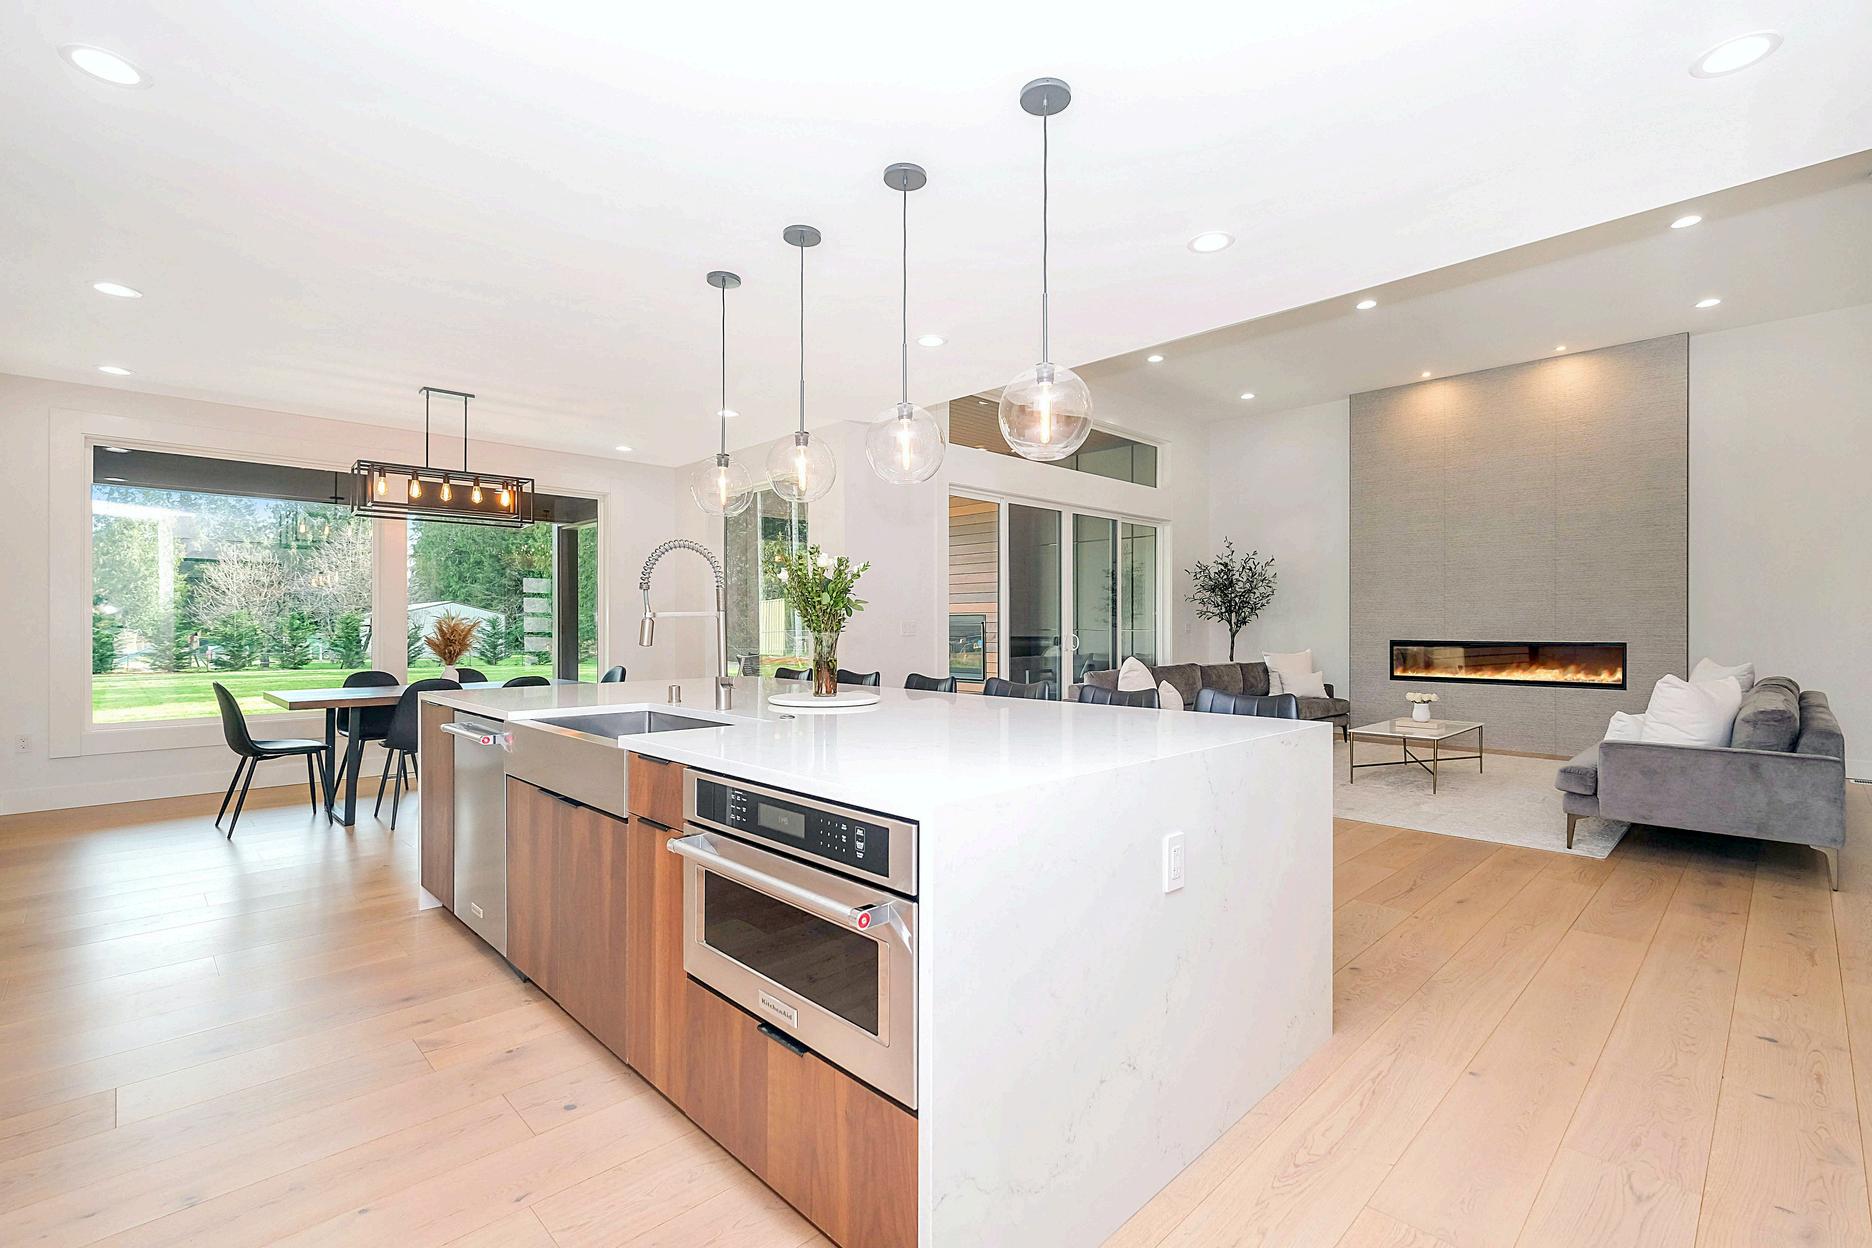
HomeRenovationsThatCanMakea BIG IMPACT AccordingtoExperts
Enhancing Property Value and Family Living Space with an Acton ADU
The Anenberg-Essert family in Campbell collaborated with Acton ADU to create a versatile, comfortable, and valuable addition to their property. This ADU project is a shining example of how a well-designed accessory dwelling unit can increase property value and serve a family’s unique needs.
GoalsandVision
The family envisioned an ADU that would function as an independent living space for family members, enhance their property’s worth, and provide seamless integration with the main home They wanted a space that balanced privacy with connectivity, feeling like a natural extension of their residence
Design and Construction Details
Constructed at 747 square feet, this ADU was designed with modern, high-quality finishes to serve both aesthetic and practical needs. Key features include:
Vaulted Ceilings
Creates a spacious, open atmosphere
Senior-Friendly Living
Safe, independent space for elderly family members
Fully Equipped Kitchen
Modern amenities for everyday convenience
Open Living Area
Multipurpose area for relaxation and entertainment
Results and Impact
The completion of the Anenberg-Essert ADU led to several valuable outcomes:
Increased Property Value
The ADU addition significantly boosted property value
Flexible Living Space
A versatile space for family, guests, or as a rental
Modern Comforts
High-end finishes and amenities enhance both function and style.
Enhanced Family Living
The ADU enriches the AnenbergEssert family’s home with both privacy and connection
VENDOR DIRECTORY
When it comes to home ownership, knowing who you can trust is crucial. That's why we've curated a select list of trusted vendors who are ready to help with your home goals.
Milpitas
What's in the Milpitas data?
There were 7 single-family homes for sale, providing 1.8 months of inventory. There were 5 new listings, and 4 homes sold at a median price of $1 6m The median overbid percentage was at 97.4%, with an average of 31 days on the market.
There were 9 condo and townhome units for sale, providing 9 months of inventory. There were 3 new listings and 1 unit sold at a median sale price of $860k. The median overbid percentage was at 101.3%, with an average of 9 days on the market.
SFH
Single-Family Homes
5 New Listings
4 Sold Listings
1.8 Months of Inventory
$1.6M
Median Sale Price
97.4%
Median Sale vs List
31 Avg Days on Market
The data, sourced from Courted.io, includes all single-family homes, condos and townhomes in the California Area from July 2024 to July 2025. This may include preliminary data, and may vary from the time the data was gathered. All data is deemed reliable but not guaranteed. DRE# 01345026. Copyright KW Advisors Fremont 2025. Each office is independently owned and operated.
New Listings
9 Months of Inventory
101.3%
Median Sale vs List
Median SalesPrice
Single-Family Homes
The median sale price has decreased from $2 6m last July 2024, to $1 6m as of July 2025
Condos & Townhomes
The median sale price has decreased from $1 2m last July 2024, to $860k as of July 2025
AVGDays OntheMarket
Single-Family Homes
The average time spent on the market went up from 22 days last July 2024, to 31 days as of July 2025
Condos & Townhomes
The average time spent on the market went down from 27 days in July 2024, to 9 days as of July 2025.
Overbids
Single-Family Homes
The overbid percentage has decreased from 98 1% last July 2024, to 97 4% a year later
Condos & Townhomes
The overbid percentage has increased from 100.1% last July 2024, to 101.3% a year later.
Fremont
What's in the Fremont data?
There were 123 single-family homes for sale, providing 2.4 months of inventory. There were 97 new listings, and 52 homes sold at a median price of $1.8m. The median overbid percentage was at 102.6%, with an average of 18 days on the market.
There were 100 condo and townhome units for sale, providing 5.3 months of inventory. There were 41 new listings and 19 units sold at a median sale price of $895k. The median overbid percentage was at 97.8%, with an average of 37 days on the market.
SFH
Single-Family Homes
97 New Listings
52 Sold Listings
2.4 Months of Inventory
$1.8M
Median Sale Price
102.6%
Median Sale vs List
18 Avg Days on Market
The data, sourced from Courted.io, includes all single-family homes, condos and townhomes in the California Area from July 2024 to July 2025. This may include preliminary data, and may vary from the time the data was gathered. All data is deemed reliable but not guaranteed. DRE# 01345026. Copyright KW Advisors Fremont 2025. Each office is independently owned and operated.
41
New Listings
19 Sold Listings
5.3
Months of Inventory
$895K
Median Sale Price
97.8%
Median Sale vs List
37 Avg Days on Market
JULY 2024 - JULY 2025
Single-Family Homes
Last 12 months, year-over-year.
Condos & Townhomes
Last 12 months, year-over-year
Median SalesPrice
Single-Family Homes
The median sale price has increased from $1 7m last July 2024, to $1 8m as of July 2025
Condos & Townhomes
The median sale price has decreased from $955k last July 2024, to $895k as of July 2025
AVGDays OntheMarket
Single-Family Homes
The average time spent on the market went up from 13 days last July 2024, to 18 days as of July 2025
Condos & Townhomes
The average time spent on the market went up from 19 days in July 2024, to 37 days as of July 2025.
Overbids
Single-Family Homes
The overbid percentage has decreased from 106 7% last July 2024, to 102 6% a year later
Condos & Townhomes
The overbid percentage has decreased from 101.3% last July 2024, to 97.8% a year later.
Newark
What's in the New
There were 39 single-family h providing 2.4 months of inve new listings, and 16 homes s of $1.4m. The median overbi 99.3%, with an average of 33
There were 15 condo and tow sale, providing 3 months of in 6 new listings and 5 units so price of $655k. The median o was at 99.1%, with an averag market.
homes, condos and 2025. This may include gathered. All data is deemed Advisors Fremont 2025.
Median SalesPrice
Single-Family Homes
The median sale price has increased from $1 3m last July 2024, to $1 4m as of July 2025
Condos & Townhomes
The median sale price has decreased from $1 2m last July 2024, to $655k as of July 2025
AVGDays OntheMarket
Single-Family Homes
The average time spent on the market went up from 12 days last July 2024, to 33 days as of July 2025
Condos & Townhomes
The average time spent on the market went up from 15 days in July 2024, to 58 days as of July 2025.
Overbids
Single-Family Homes
The overbid percentage has decreased from 104 2% last July 2024, to 99 3% a year later
Condos & Townhomes
The overbid percentage has decreased from 103.2% last July 2024, to 99.1% a year later.
Union
What's in the Unio
There were 30 single-family h providing 2 months of invent new listings, and 15 homes s of $1.3m. The median overbi 101.1%, with an average of 1
There were 27 condo and tow sale, providing 4.5 months of were 10 new listings and 6 u sale price of $675k. The med percentage was at 97.3%, wi days on the market.
homes, condos and 2025. This may include gathered. All data is deemed Advisors Fremont 2025.
New Listings
4.5
Months of Inventory
$675K
Median Sale Price 97.3%
Median Sale vs List 35 Avg Days on Market 6 Sold Listings
nionCity
JULY 2024 - JULY 2025
TINGS FOR SALE SOLD LISTINGS
Family Homes
2 months, year-over-year.
s & Townhomes
2 months, year-over-year
Median SalesPrice
Single-Family Homes
The median sale price has decreased from $1 5m last July 2024, to $1 3m as of July 2025
Condos & Townhomes
The median sale price has increased from $610k last July 2024, to $675k as of July 2025
AVGDays OntheMarket
Single-Family Homes
The average time spent on the market went up from 11 days last July 2024, to 18 days as of July 2025
Condos & Townhomes
The average time spent on the market went up from 25 days in July 2024, to 35 days as of July 2025.
Overbids
Single-Family Homes
The overbid percentage has decreased from 108% last July 2024, to 101 1% a year later
Condos & Townhomes
The overbid percentage has decreased from 102.1% last July 2024, to 97.3% a year later.
Hayward
What's in the Hayward data?
There were 106 single-family homes for sale, providing 2.4 months of inventory. There wer new listings, and 44 homes sold at a median of $900k. The median overbid percentage wa 103.6%, with an average of 22 days on the m
There were 68 condo and townhome units fo sale, providing 8.5 months of inventory. Ther were 22 new listings and 8 units sold at a me sale price of $600k. The median overbid percentage was at 98.9%, with an average of days on the market.
New Listings
8 Sold Listings
8.5
Months of Inventory $600K Median Sale Price 98.9%
Median Sale vs List 46 Avg Days on Market
JULY 2024 - JULY 2025
Single-Family Homes
Last 12 months, year-over-year.
Condos & Townhomes
Last 12 months, year-over-year
Median SalesPrice
Single-Family Homes
The median sale price has decreased from $995k last July 2024, to $900k as of July 2025
Condos & Townhomes
The median sale price has decreased from $680k last July 2024, to $600k as of July 2025
AVGDays OntheMarket
Single-Family Homes
The average time spent on the market went up from 14 days last July 2024, to 22 days as of July 2025
Condos & Townhomes
The average time spent on the market went up from 25 days in July 2024, to 46 days as of July 2025.
Overbids
Single-Family Homes
The overbid percentage has decreased from 106 9% last July 2024, to 103 6% a year later
Condos & Townhomes
The overbid percentage has decreased from 101.8% last July 2024, to 98.9% a year later.
Castro Valley
What's in the Castro Valley data?
There were 60 single-family homes for sale, providing 1.3 months of inventory. There were 38 new listings, and 47 homes sold at a median price of $1.1m. The median overbid percentage was at 99 3%, with an average of 22 days on the market
There were 12 condo and townhome units for sale, providing 3 months of inventory. There were 6 new listings and 4 units sold at a median sale price of $1.1m. The median overbid percentage was at 98.6%, with an average of 38 days on the market.
SFH
Single-Family Homes
38 New Listings
47 Sold Listings
1.3 Months of Inventory
$1.1M Median Sale Price
99.3%
Median Sale vs List
22 Avg Days on Market
The data, sourced from Courted.io, includes all single-family homes, condos and townhomes in the California Area from July 2024 to July 2025. This may include preliminary data, and may vary from the time the data was gathered. All data is deemed reliable but not guaranteed. DRE# 01345026. Copyright KW Advisors Fremont 2025. Each office is independently owned and operated.
6
New Listings
4 Sold Listings
3 Months of Inventory
$1.1M
Median Sale Price 98.6%
Median Sale vs List
38 Avg Days on Market
CastroValley
JULY 2024 - JULY 2025
SALE
Single-Family Homes
Last 12 months, year-over-year.
Condos & Townhomes
Last 12 months, year-over-year
Median SalesPrice
Single-Family Homes
The median sale price has increased from $1 1m last July 2024, to $1 17m as of July 2025
Condos & Townhomes
The median sale price has increased from $538k last July 2024, to $1 1m as of July 2025
AVGDays OntheMarket
Single-Family Homes
The average time spent on the market went down from 23 days last July 2024, to 22 days as of July 2025
Condos & Townhomes
The average time spent on the market went down from 52 days in July 2024, to 38 days as of July 2025.
Overbids
Single-Family Homes
The overbid percentage has decreased from 101 4% last July 2024, to 99 3% a year later
Condos & Townhomes
The overbid percentage has increased from 98.2% last July 2024, to 98.6% a year later.
San Leandro
What's in the San Leandro data?
There were 50 single-family homes for sale, providing 1.7 months of inventory. There were 42 new listings, and 30 homes sold at a median price of $875k. The median overbid percentage was at 103 8%, with an average of 24 days on the market
There were 32 condo and townhome units for sale, providing 5.3 months of inventory. There were 9 new listings and 6 units sold at a median sale price of $710k. The median overbid percentage was at 99.9%, with an average of 39 days on the market.
SFH
Single-Family Homes
42 New Listings
30 Sold Listings
1.7 Months of Inventory
$875K Median Sale Price
103.8%
Median Sale vs List
24 Avg Days on Market
The data, sourced from Courted.io, includes all single-family homes, condos and townhomes in the California Area from July 2024 to July 2025. This may include preliminary data, and may vary from the time the data was gathered. All data is deemed reliable but not guaranteed. DRE# 01345026. Copyright KW Advisors Fremont 2025. Each office is independently owned and operated.
New Listings
5.3
Months of Inventory $710K
Median Sale Price 99.9%
Median Sale vs List
39 Avg Days on Market 6 Sold Listings
SanLeandro
JULY 2024 - JULY 2025
Single-Family Homes
Last 12 months, year-over-year.
Condos & Townhomes
Last 12 months, year-over-year
Median SalesPrice
Single-Family Homes
The median sale price has decreased from $910k last July 2024, to $875k as of July 2025
Condos & Townhomes
The median sale price has increased from $518k last July 2024, to $710k as of July 2025
AVGDays OntheMarket
Single-Family Homes
The average time spent on the market went up from 19 days last July 2024, to 24 days as of July 2025
Condos & Townhomes
The average time spent on the market went down from 41 days in July 2024, to 39 days as of July 2025.
Overbids
Single-Family Homes
The overbid percentage has decreased from 106 1% last July 2024, to 103 8% a year later
Condos & Townhomes
The overbid percentage has increased from 99.4% last July 2024, to 99.9% a year later.
Tri-Cities
What's in the Tri-Cities data?
There were 192 single-family homes for sale, providing 2 3 months of inventory There were 140 new listings, and 84 homes sold at a median price of $1.6m. The median overbid percentage was at 101.7%, with an average of 20 days on the market.
There were 142 condo and townhome units for sale, providing 4.7 months of inventory. There were 57 new listings and 30 units sold at a median sale price of $800k The median overbid percentage was at 98%, with an average of 40 days on the market.
SFH
Single-Family Homes
140 New Listings
84 Sold Listings
2.3 Months of Inventory
$1.6M
Median Sale Price
101.7%
Median Sale vs List
20 Avg Days on Market
The data, sourced from Courted.io, includes all single-family homes, condos and townhomes in the California Area from July 2024 to July 2025. This may include preliminary data, and may vary from the time the data was gathered. All data is deemed reliable but not guaranteed. DRE# 01345026. Copyright KW Advisors Fremont 2025. Each office is independently owned and operated.
57 New Listings 4.7 Months of Inventory $800K Median Sale Price
Median Sale vs List 40 Avg Days on Market 30 Sold Listings
JULY 2024 - JULY 2025
TINGS FOR SALE SOLD LISTINGS
Family Homes
2 months, year-over-year.
s & Townhomes
2 months, year-over-year
Median SalesPrice
Single-Family Homes
The median sale price has increased from $1 6m last July 2024, to $1 64m as of July 2025
Condos & Townhomes
The median sale price has decreased from $885k last July 2024, to $800k as of July 2025
AVGDays OntheMarket
Single-Family Homes
The average time spent on the market went up from 12 days last July 2024, to 20 days as of July 2025
Condos & Townhomes
The average time spent on the market went up from 20 days in July 2024, to 40 days as of July 2025.
Overbids
Single-Family Homes
The overbid percentage has decreased from 106 5% last July 2024, to 101 7% a year later
Condos & Townhomes
The overbid percentage has decreased from 101.6% last July 2024, to 98% a year later.
Pleasan
What's in the Plea
There were 113 single-family providing 2.2 months of inve new listings, and 51 homes s of $1.7m. The median overbi 97.9%, with an average of 28
There were 36 condo and tow sale, providing 4.5 months of were 23 new listings and 8 u sale price of $750k. The med percentage was at 98.8%, wi days on the market.
homes, condos and 2025. This may include gathered. All data is deemed Advisors Fremont 2025.
New Listings
4.5
Months of Inventory 98.8%
Median Sale vs List
Median SalesPrice
Single-Family Homes
The median sale price has decreased from $1 8m last July 2024, to $1 7m as of July 2025
Condos & Townhomes
The median sale price has increased from $705k last July 2024, to $750k as of July 2025
AVGDays OntheMarket
Single-Family Homes
The average time spent on the market went up from 15 days last July 2024, to 28 days as of July 2025
Condos & Townhomes
The average time spent on the market went up from 12 days in July 2024, to 34 days as of July 2025.
Overbids
Single-Family Homes
The overbid percentage has decreased from 100 9% last July 2024, to 97 9% a year later
Condos & Townhomes
The overbid percentage has decreased from 101.3% last July 2024, to 98.8% a year later.
SanRamon
What's in the San Ramon data?
There were 94 single-family homes for sale, providing 2.8 months of inventory. There were 53 new listings, and 34 homes sold at a median price of $1.8m. The median overbid percentage was at 99.1%, with an average of 22 days on the market.
There were 84 condo and townhome units for sale, providing 4.9 months of inventory. There were 32 new listings and 17 units sold at a median sale price of $843k. The median overbid percentage was at 97.5%, with an average of 44 days on the market.
SFH
Single-Family Homes
53 New Listings
34 Sold Listings
2.8 Months of Inventory
$1.8M Median Sale Price
99.1%
Median Sale vs List
22 Avg Days on Market
The data, sourced from Courted.io, includes all single-family homes, condos and townhomes in the California Area from July 2024 to July 2025. This may include preliminary data, and may vary from the time the data was gathered. All data is deemed reliable but not guaranteed. DRE# 01345026. Copyright KW Advisors Fremont 2025. Each office is independently owned and operated.
Jul2025
Jul2025
Median SalesPrice
Single-Family Homes
The median sale price has decreased from $2m last July 2024, to $1 8m as of July 2025
Condos & Townhomes
The median sale price has decreased from $1 1m last July 2024, to $843k as of July 2025
AVGDays OntheMarket
Single-Family Homes
The average time spent on the market went up from 15 days last July 2024, to 22 days as of July 2025
Condos & Townhomes
The average time spent on the market went up from 17 days in July 2024, to 44 days as of July 2025.
Overbids
Single-Family Homes
The overbid percentage has decreased from 102% last July 2024, to 99 1% a year later
Condos & Townhomes
The overbid percentage has decreased from 100.5% last July 2024, to 97.5% a year later.
Liverm
What's in the Liver
There were 132 single-family providing 2.2 months of inve new listings, and 60 homes s of $1.2m. The median overbi 98.9%, with an average of 21
There were 48 condo and tow sale, providing 4 months of in 17 new listings and 12 units price of $779k. The median o was at 98.1%, with an averag market.
homes, condos and 2025. This may include gathered. All data is deemed Advisors Fremont 2025.
JULY 2024 - JULY 2025 OR SALE SOLD LISTINGS
omes
year-over-year.
homes
year-over-year
Median SalesPrice
Single-Family Homes
The median sale price has decreased from $1 3m last July 2024, to $1 2m as of July 2025
Condos & Townhomes
The median sale price has decreased from $818k last July 2024, to $779k as of July 2025
AVGDays OntheMarket
Single-Family Homes
The average time spent on the market went up from 18 days last July 2024, to 21 days as of July 2025
Condos & Townhomes
The average time spent on the market went up from 25 days in July 2024, to 38 days as of July 2025.
Overbids
Single-Family Homes
The overbid percentage has decreased from 102 4% last July 2024, to 98 9% a year later
Condos & Townhomes
The overbid percentage has decreased from 100.3% last July 2024, to 98.1% a year later.
Cupert
What's in the Cupe
There were 30 single-family h providing 2 months of invent new listings, and 15 homes s of $3.4m. The median overbi 105.1%, with an average of 2
There were 14 condo and tow sale, providing 2.8 months of were 9 new listings and 5 un sale price of $1.4m. The med percentage was at 101.6%, w days on the market.
homes, condos and 2025. This may include gathered. All data is deemed Advisors Fremont 2025.
New Listings
2.8
Months of Inventory
101.6%
Median Sale vs List
Median SalesPrice
Single-Family Homes
The median sale price has decreased from $3 5m last July 2024, to $3 4m as of July 2025
Condos & Townhomes
The median sale price has increased from $1 3m last July 2024, to $1 4m as of July 2025
AVGDays OntheMarket
Single-Family Homes
The average time spent on the market went down from 32 days last July 2024, to 22 days as of July 2025
Condos & Townhomes
The average time spent on the market went down from 26 days in July 2024, to 22 days as of July 2025.
Overbids
Single-Family Homes
The overbid percentage has decreased from 105 3% last July 2024, to 105 1% a year later
Condos & Townhomes
The overbid percentage has decreased from 101.9% last July 2024, to 101.6% a year later.
Oakland
What's in the Oakland data?
There were 455 single-family homes for sale, providing 3 months of inventory. There were 187 new listings, and 150 homes sold at a median price of $875k. The median overbid percentage was at 109.2%, with an average of 38 days on the market.
There were 239 condo and townhome units for sale, providing 6 months of inventory There were 56 new listings and 40 units sold at a median sale price of $498k. The median overbid percentage was at 99.9%, with an average of 59 days on the market.
Months of Inventory 99.9%
Median Sale vs List
Median SalesPrice
Single-Family Homes
The median sale price has decreased from $995k last July 2024, to $875k as of July 2025
Condos & Townhomes
The median sale price has decreased from $544k last July 2024, to $498k as of July 2025
AVGDays OntheMarket
Single-Family Homes
The average time spent on the market went up from 29 days last July 2024, to 38 days as of July 2025
Condos & Townhomes
The average time spent on the market went up from 34 days in July 2024, to 59 days as of July 2025.
Overbids
Single-Family Homes
The overbid percentage has decreased from 110% last July 2024, to 109 2% a year later
Condos & Townhomes
The overbid percentage has decreased from 101.4% last July 2024, to 99.9% a year later.