Rising Waters
Savannah Cheung | Katie Mueller | Izzy Wilson
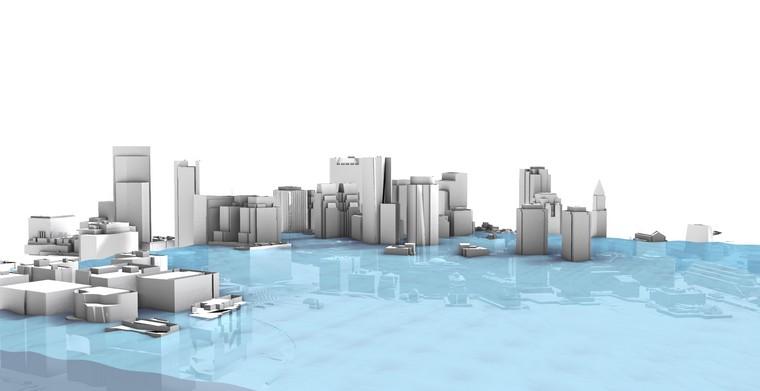
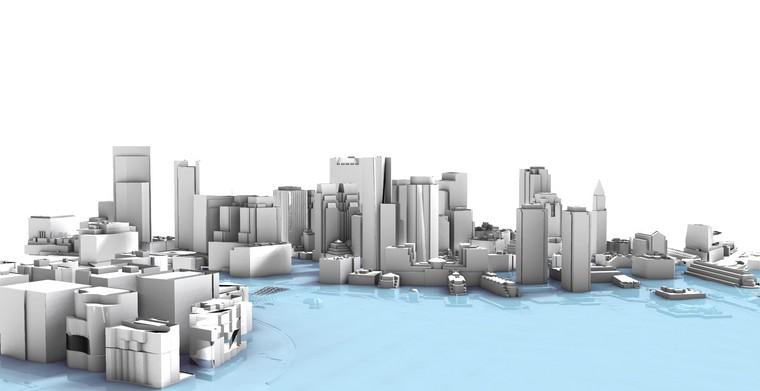
The sea level surrounding Boston has risen by 8 inches since 1950. The acceleration of its rise has increased over the past 10 years and is now growing at a rate of one inch every 8 years. While the state is planning to donate in support of sea level rise solutions, the natural barriers that protect communities and wildlife from flooding are still currently at risk of getting destroyed. Sea level rising in Massachusetts is largely due to changes in ocean circulation and ice melting (such as receding glaciers), and the city of Boston is at high vulnerability considering its predominantly coastal location. With increased flooding and reclining marshes, Boston is at the hands of the current climate change crisis. As we will explain further, the concept of increasing sea levels at the border of this large city was particularly interesting when considering how time interacts with and impacts this multidimensional space over the course of many years.

This topic to relates both to the concept of time and volume for this project and personal interests of landscape, urbanism, architecture, and climate change. The 2d set of dimensions is transformed into a 3.5 rendered area with the passage of time.
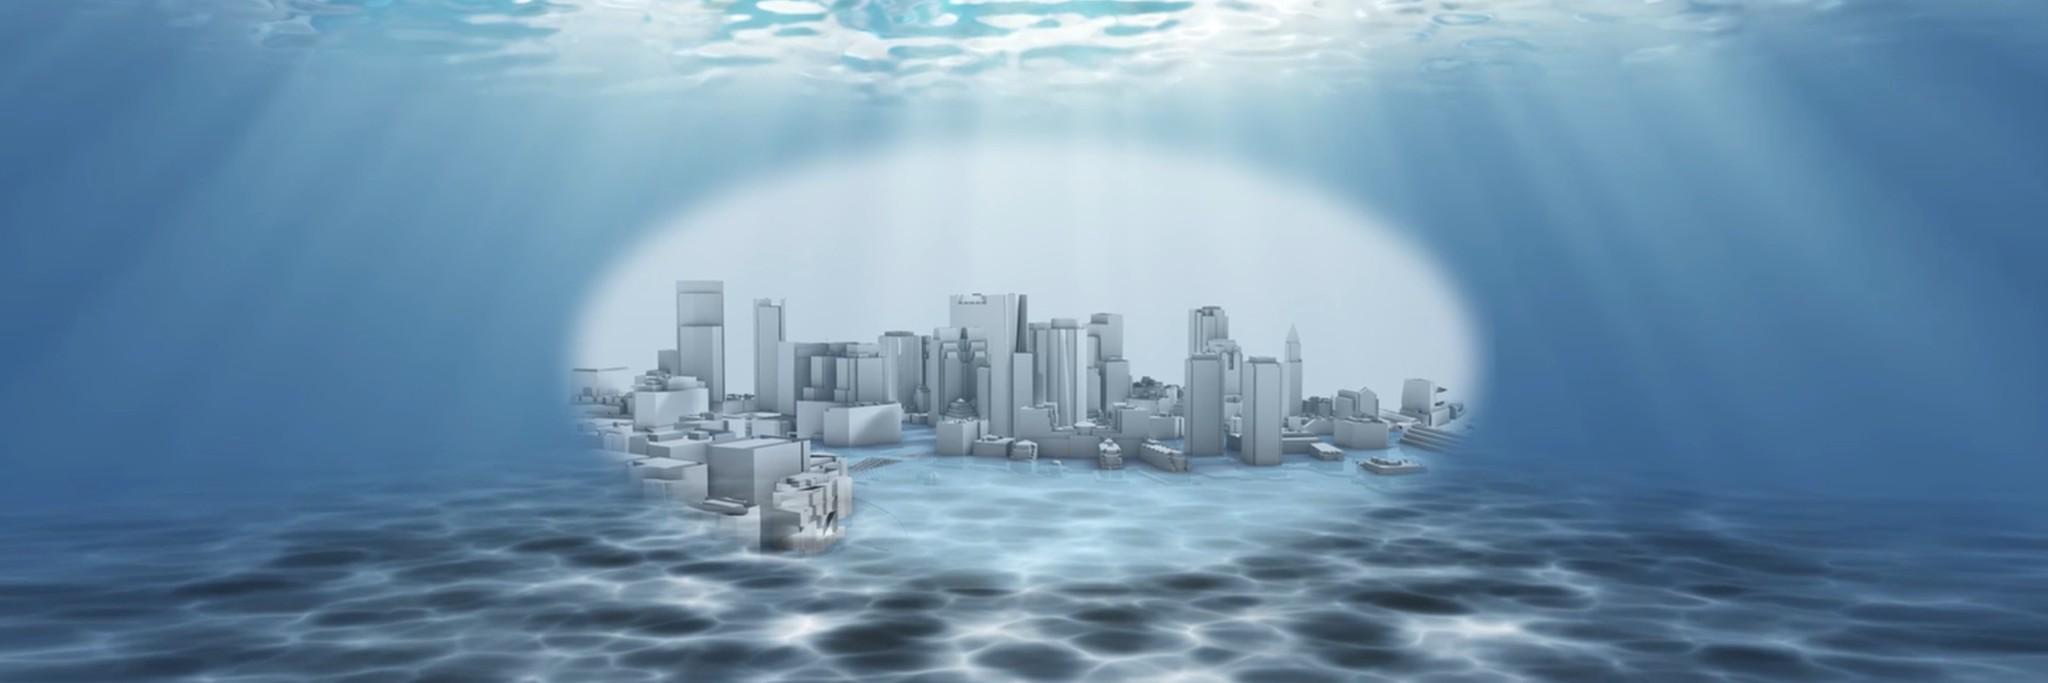
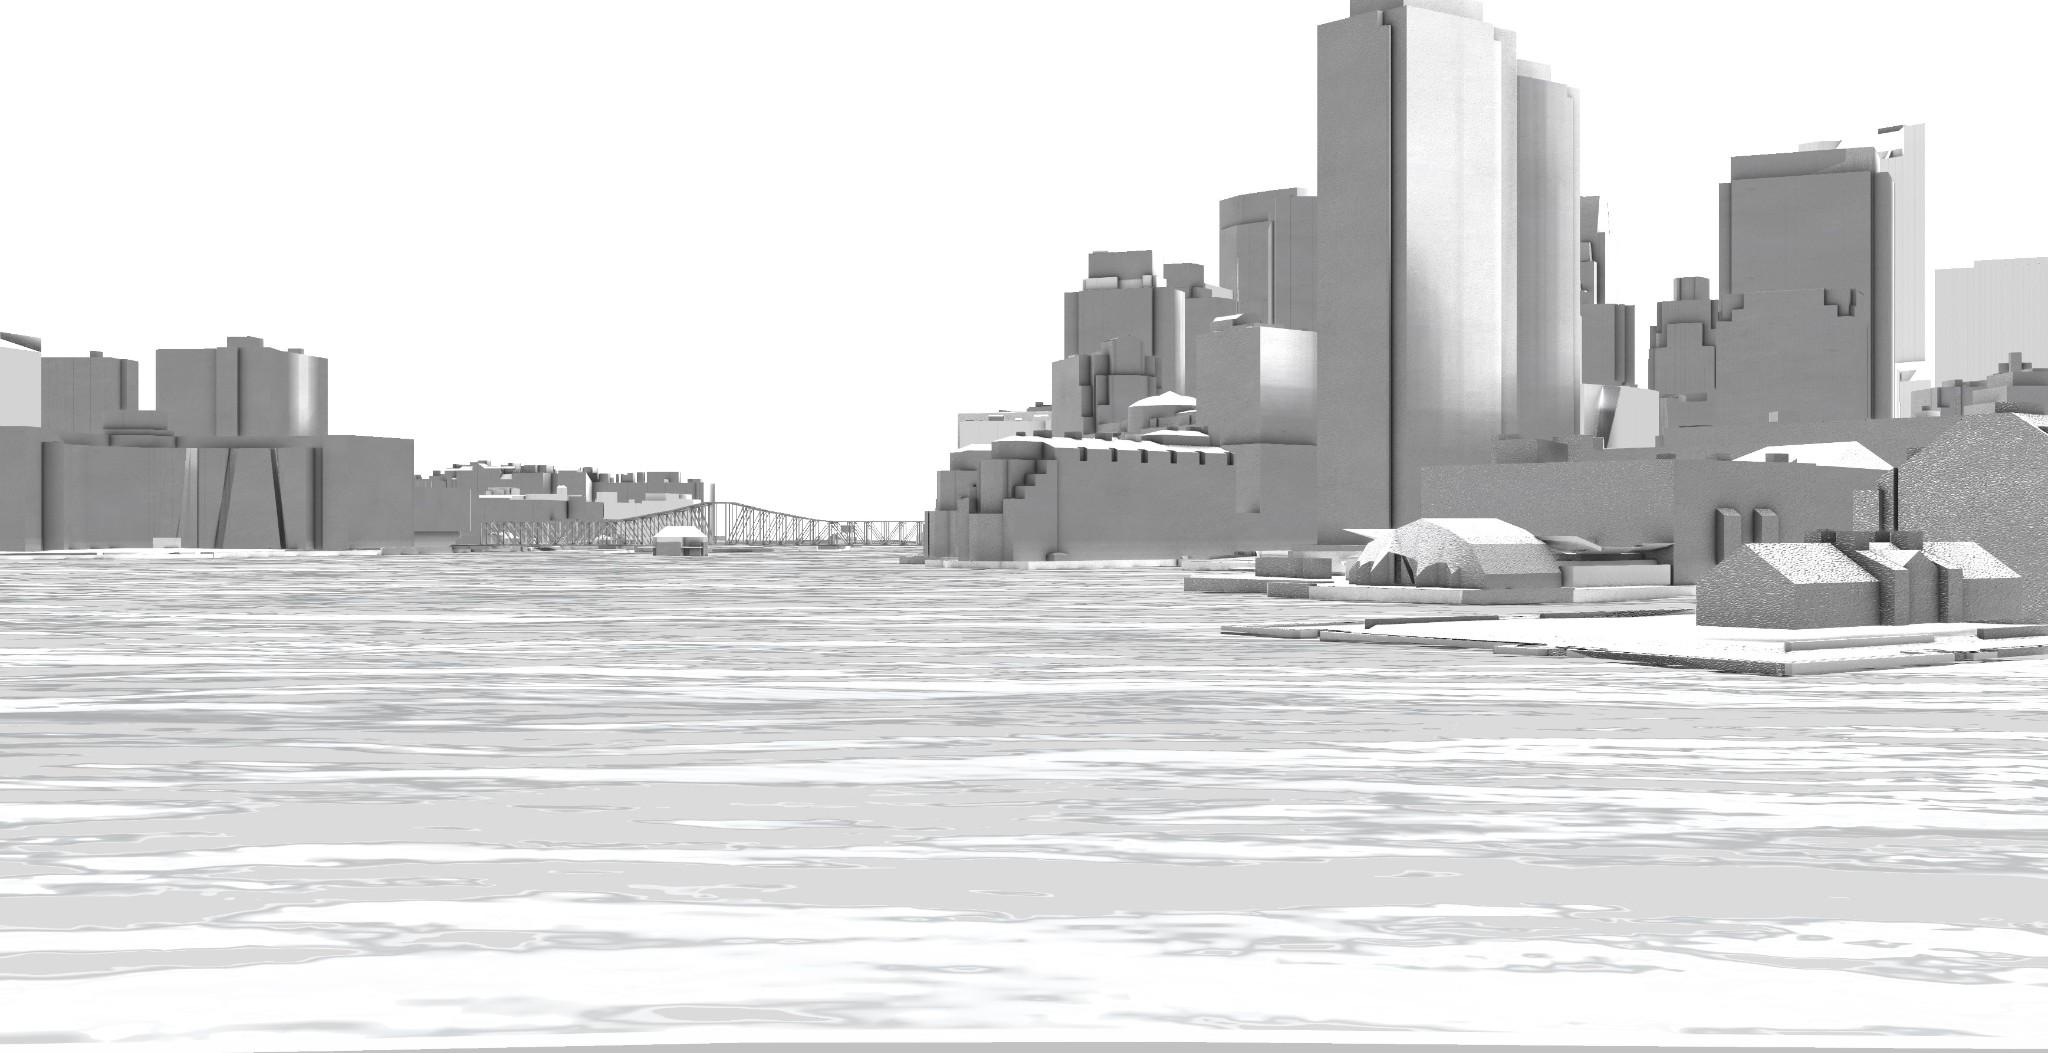
Nature is particularly interesting to work with because it is both uncontrollable and yet has set patterns and equations that allow us to predict its movement. The buildings have an individual relationship with the water which carries its relationship over the entirety of the land, shifting the way in which it is perceived.
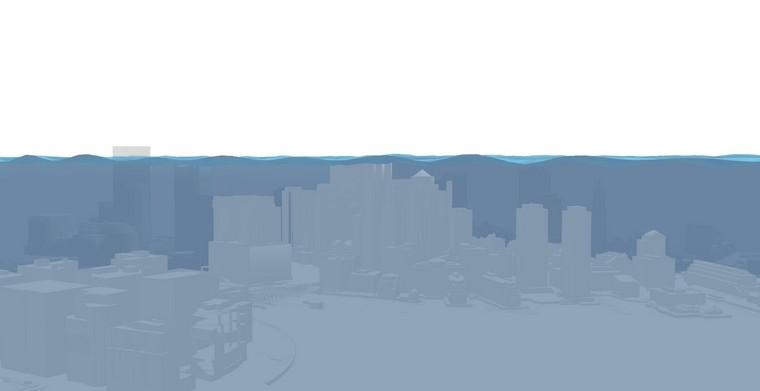
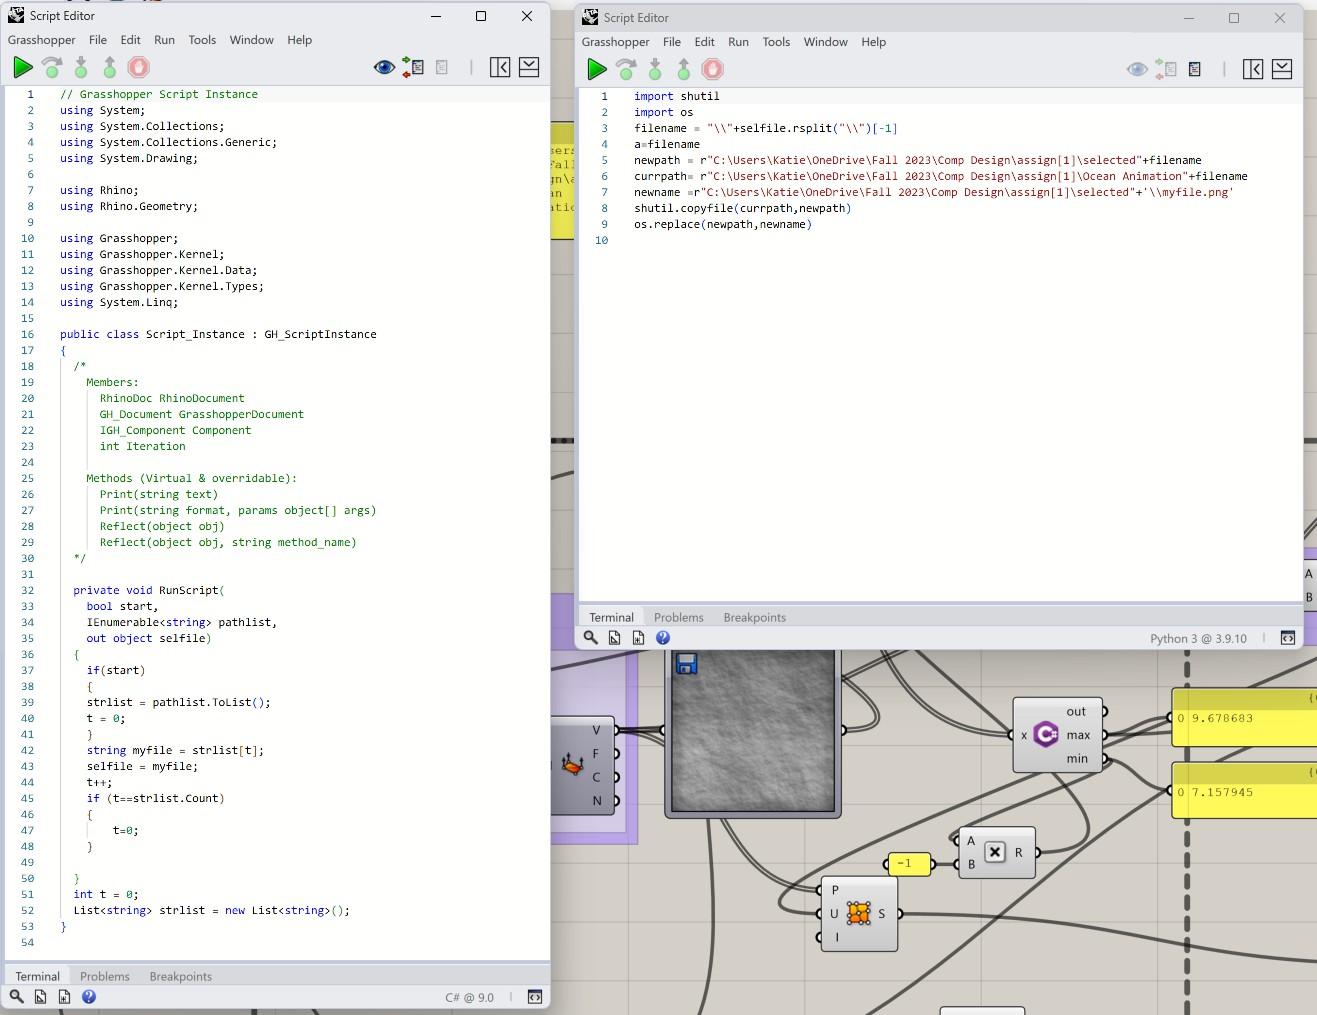
Used python script and C# script to cycle through a series of 120 texture map of ocean images from the internet for use with the image sampler to create a progression of wave forms over time
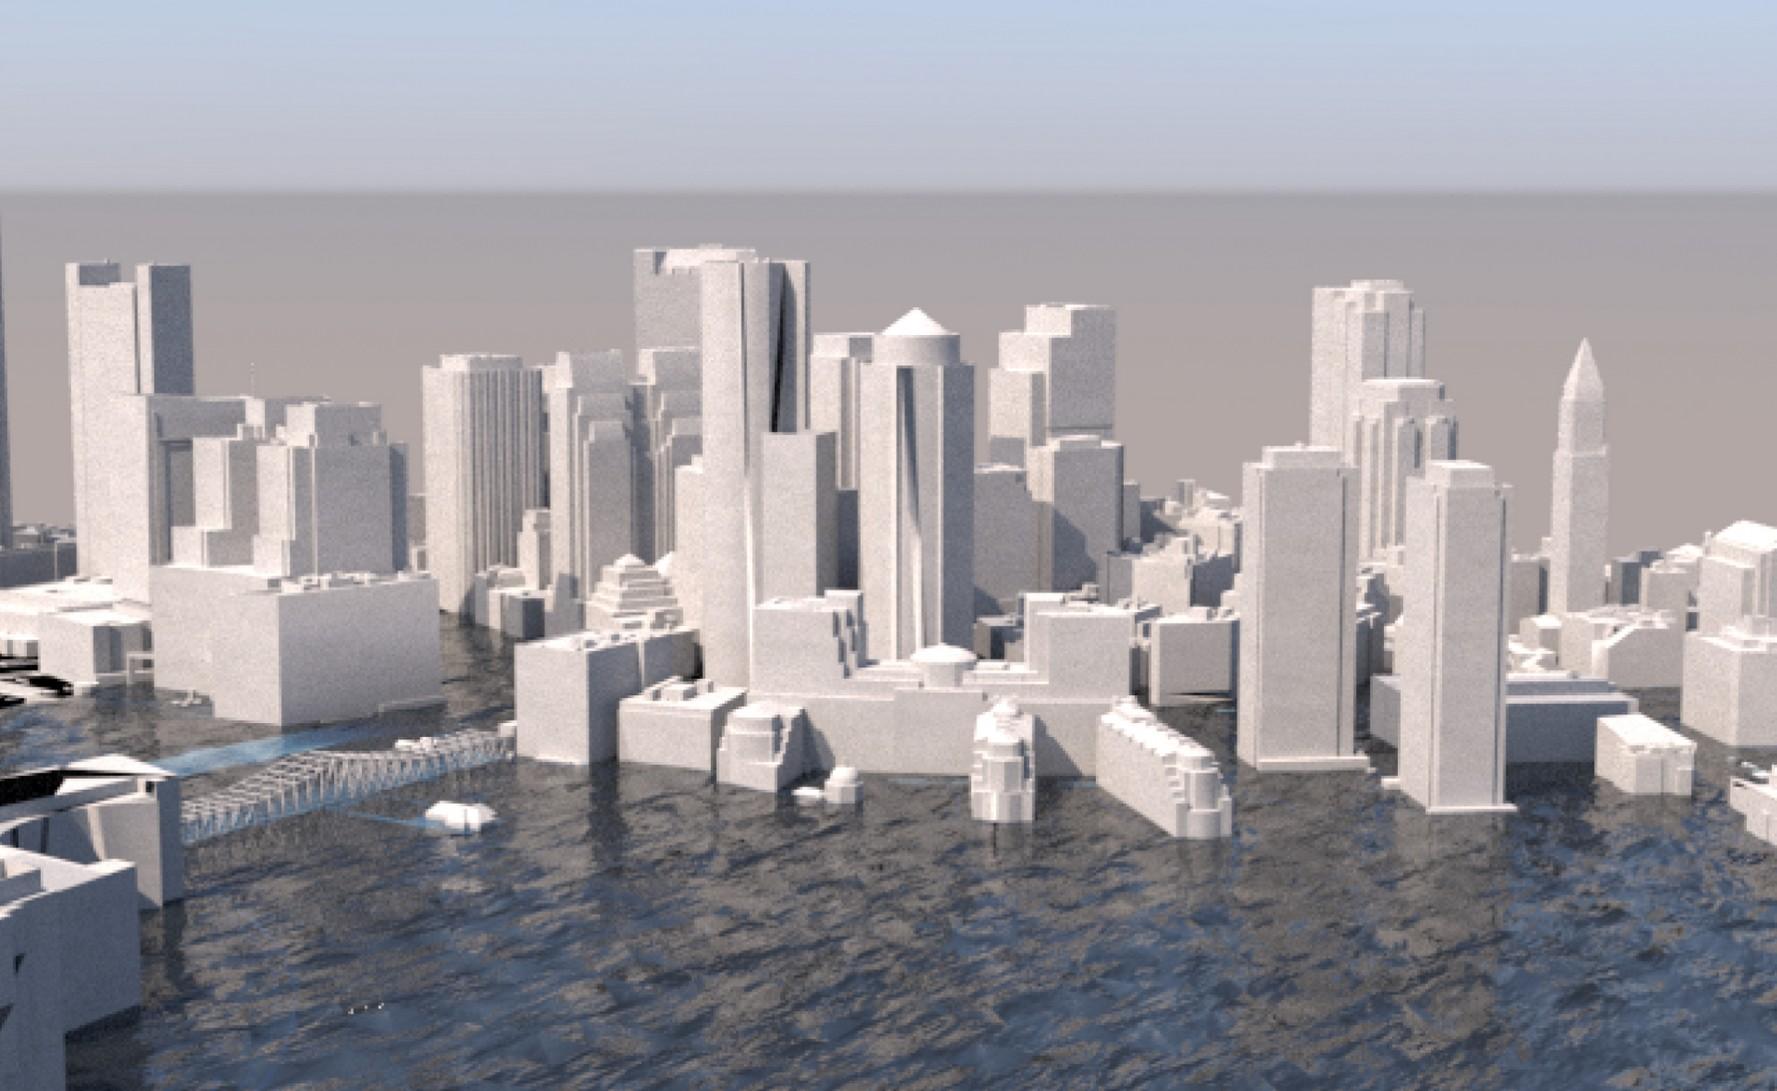
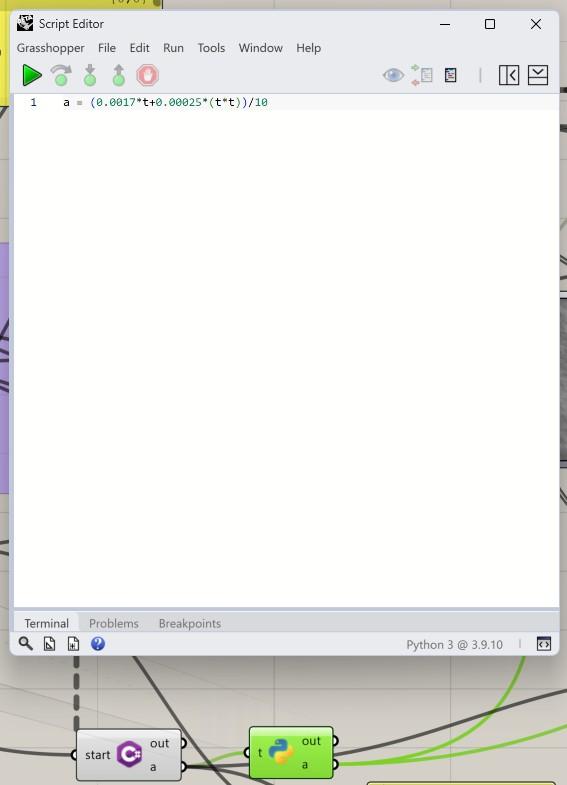
To forecast sea level change, we used a model developed by the US Army Corps of Engineers. This forecast used the following equation: Y(t) = 0.0017t+.0025t^2, which we then implemented to alter the wave height through the use of python script.
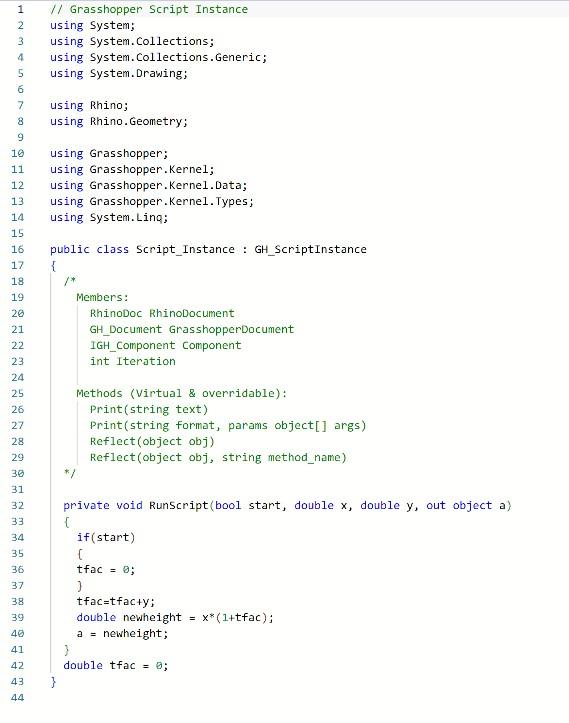
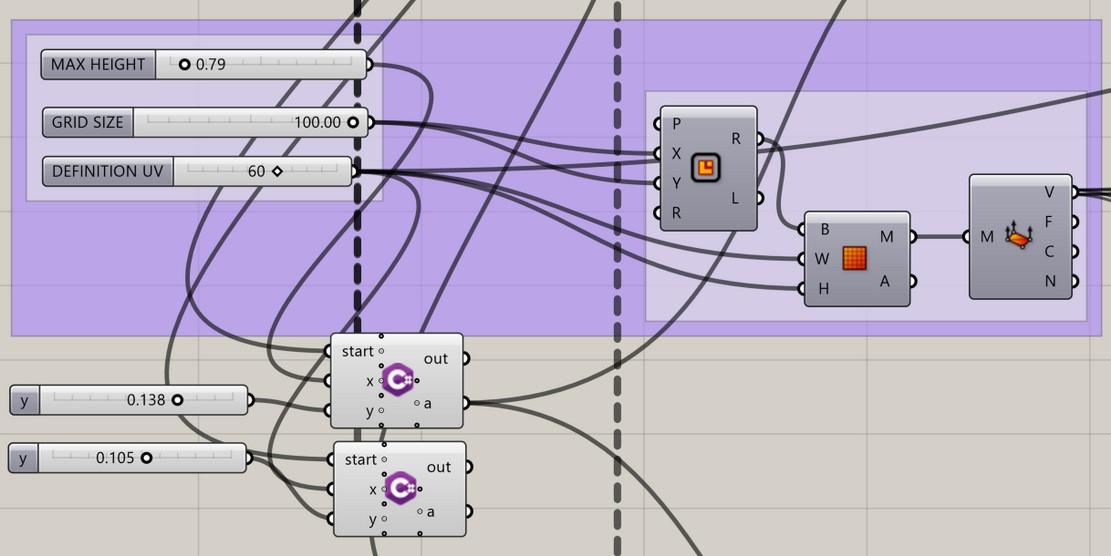
We created factors (x and y) based on time that increase the maximum height and frequency of the waves over time by manipulating the points in the image sample.
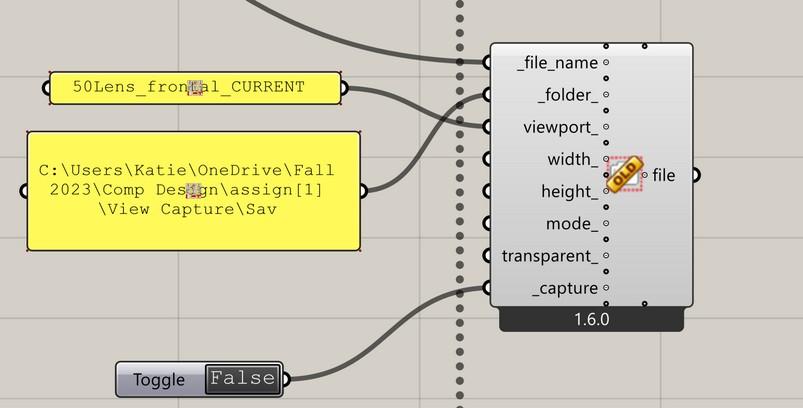
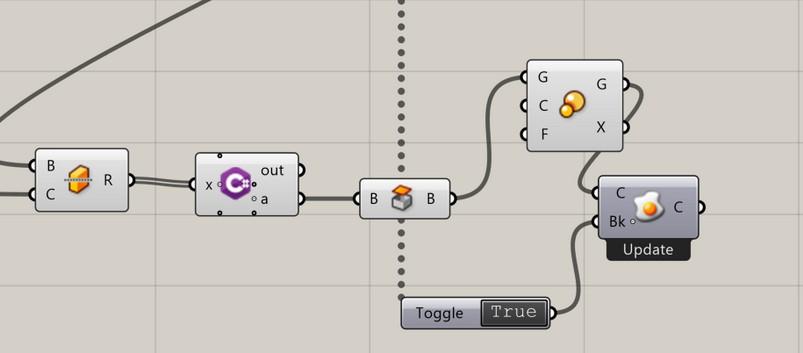
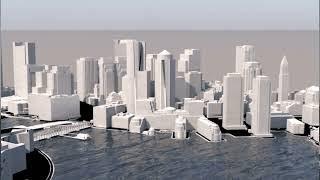
We used Rhino 8 Beta and live bake to transform the geometry in in Rhino using a trigger. We also used a LadyBug ViewCapturetoFile component to animate our GIFs.