


For brands and sellers, understanding category dynamics is key to navigating Amazon’s vast marketplace.
This report offers an analysis of the “best” and “worst” Amazon categories for sellers based on market competition, consumer demand, sales trends, and other factors. It also explores categories that fall outside of these classifications, where seller saturation and shopping trends diverge – and the challenges and opportunities that lie therein.
Five of the most popular Amazon categories among brands, sellers, and shoppers. Market share leaders; search, sales, and pricing trends; and factors that play into category popularity. Plus, expert tips for selling in these highly saturated markets.
Five of the least-shopped, least-sold-in categories on Amazon. Explore market intelligence that aims to answer the question: What opportunities exist for brands and sellers in low-demand markets, and how can you seize them?
A look inside five categories that are popular with sellers but not shoppers, or vice versa. Market insights and expert advice on how to enter and navigate Amazon’s less predictable categories.

Click to skip to chapter
Amazon Category Trends / 4
• Category saturation on Amazon
• Shoppers vs. sellers
Best Amazon Categories / 7
• Home & Kitchen
• Beauty & Personal Care
• Clothing, Shoes & Jewelry
• Health & Household
• Baby Products
• Market analysis: Top Amazon categories
Worst Amazon Categories / 16
• Computers & Accessories
• Industrial & Scientific
• Video Games
• Electronics
• CDs & Vinyl
• Market analysis: Bottom Amazon categories
Where Sellers and Shoppers Diverge / 25
• Luggage & Travel Gear
• Arts, Crafts & Sewing
• Pet Supplies
• Automotive
• Toys & Games
• Navigating challenges and seizing opportunities
Tips and Resources / 33
• Ask the experts
• Further recommended research
About the Report / 37
• Methodology
• Using the data
• About Jungle Scout

Using data from Jungle Scout Cobalt’s market intelligence tools, and insights from our consumer and ecommerce seller surveys, this chapter provides an overview of the competitive landscape in different Amazon categories, including the most and least popular categories to sell in and to shop.
A comparison of data from Jungle Scout’s 2024 State of the Amazon Seller Report and Jungle Scout Data Cloud data highlights where market competition and consumer demand align – and where sellers and shoppers appear to diverge.
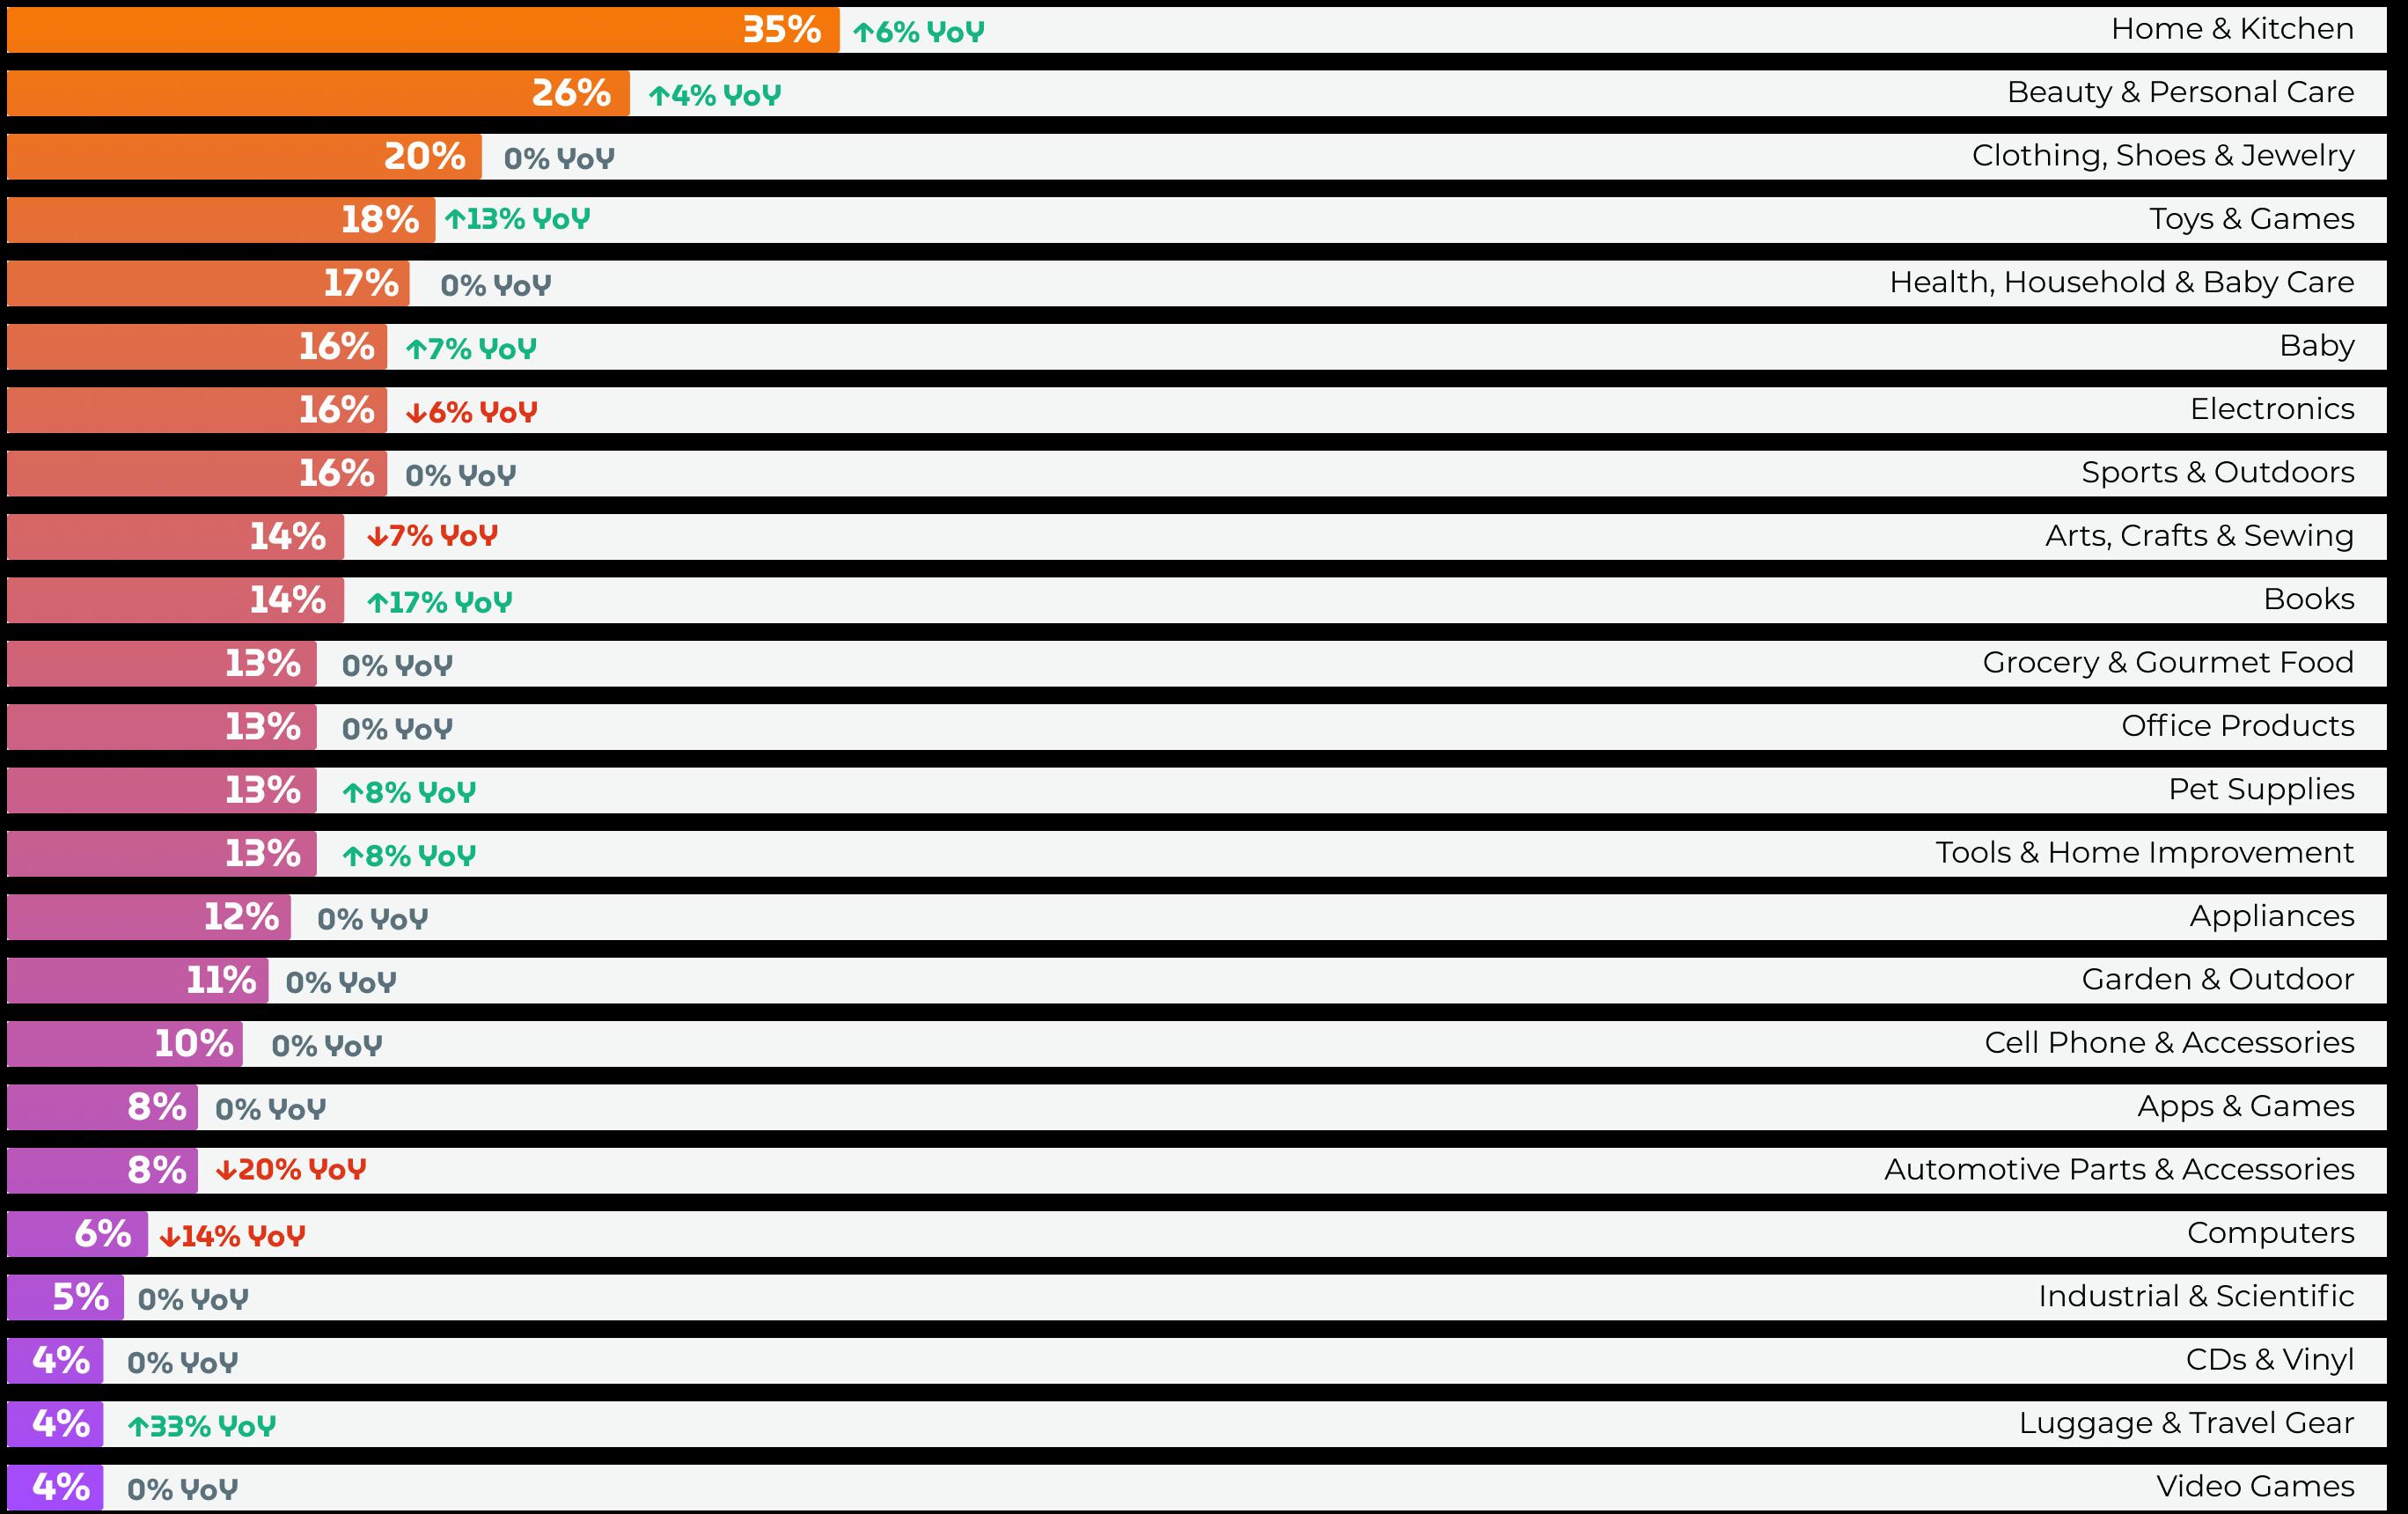
Most Popular Amazon Categories to Sell in on Amazon
Ranked by the percentage of brands and sellers who offer products in each category
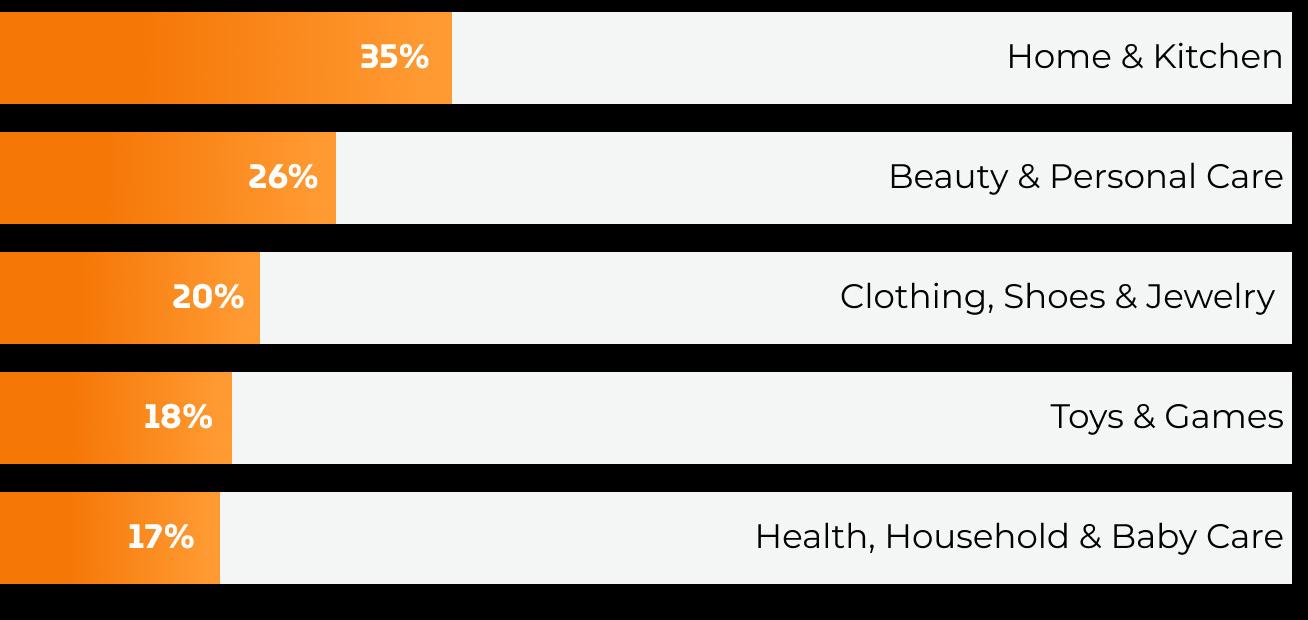
Ranked by the percentage of brands and sellers who offer products in each category
Most Shopped Categories on Amazon
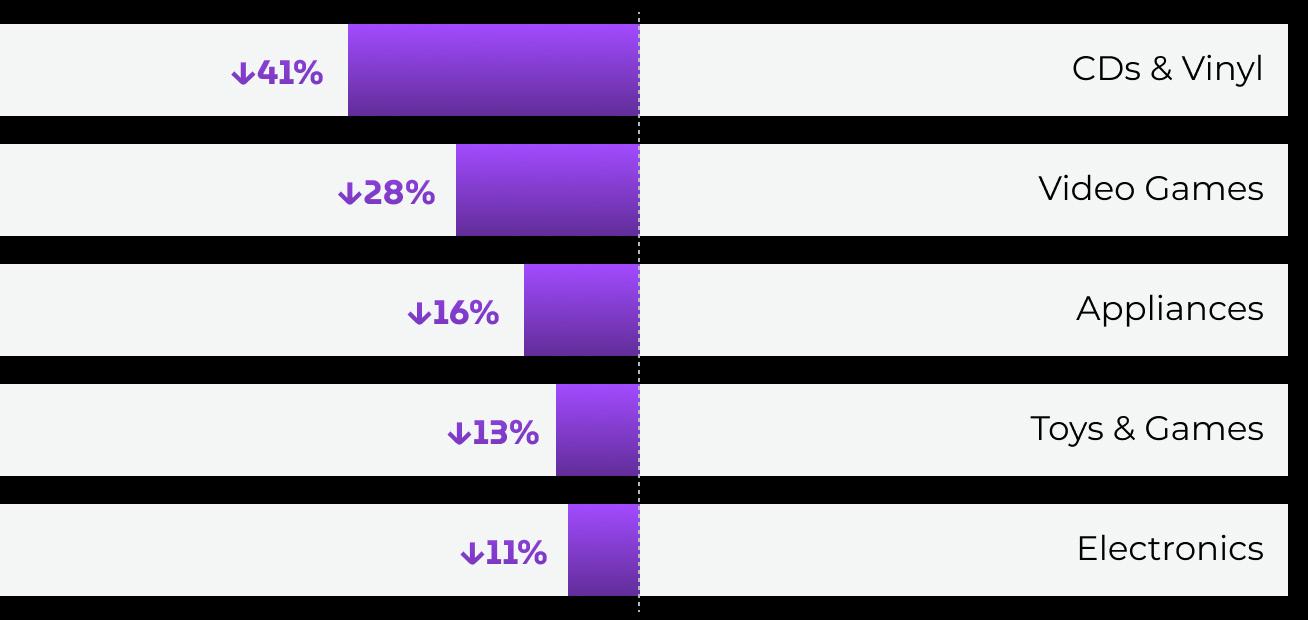
Ranked by year-over-year sales growth
Ranked by year-over-year sales growth
This chapter explores sales, revenue, pricing, search, and other market trends in popular Amazon categories for brands and consumers alike: Home & Kitchen / Beauty & Personal Care / Clothing, Shoes & Jewelry / Health & Household / Baby Products
It also includes tips for selling in high-demand, highly competitive product categories.
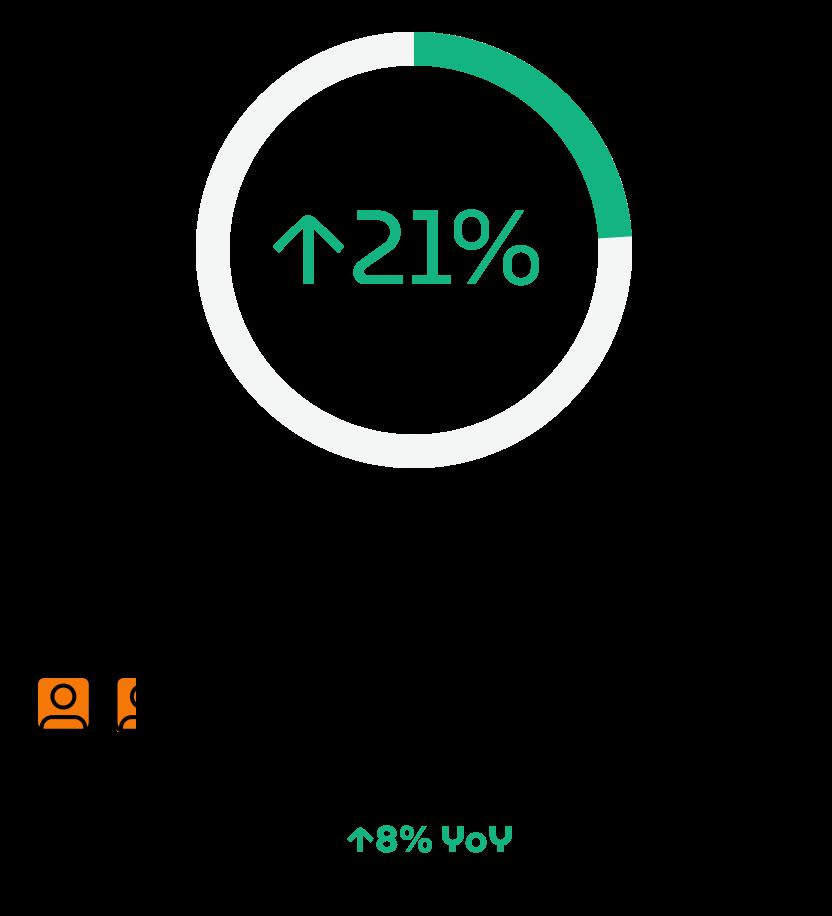
Out of 24 Amazon categories, Home & Kitchen is the most popular to sell in.
More than a third of brands on Amazon currently offer products in this category. Jungle Scout data also shows a nearly 20% jump in sales of Home & Kitchen products over the past year — a likely factor behind the 6% increase in competitors in this market.

Year-over-year market trends
190k+
3.8M+ competing brands
products offered
Market share leaders


Market

Beauty & Personal Care also makes the top 5 list for both sellers and shoppers on Amazon. It is the second most popular category to sell in and saw the fourth highest year-over-year sales increase among 24 Amazon categories.
More than a quarter of Amazon brands and sellers offer Beauty & Personal Care products, up 4% year-over-year.
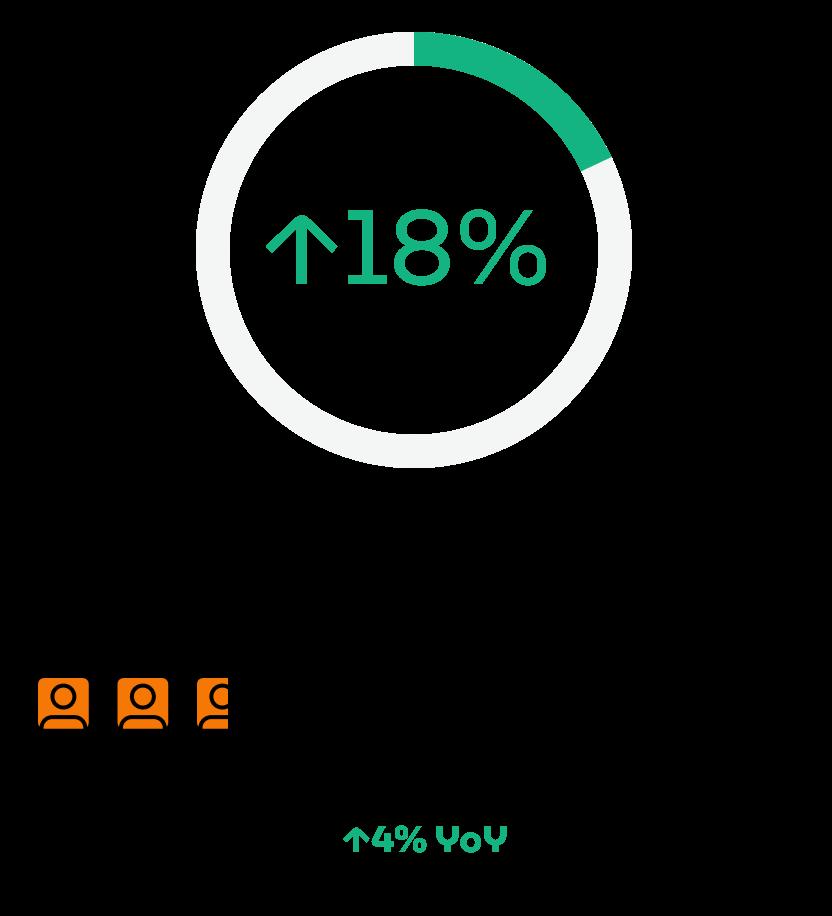


120k+
1.8M+
CATEGORY TRENDS
One in five brands sells in Amazon’s Clothing, Shoes & Jewelry category, cumulatively offering more than 10 million products for purchase.
Spanning everything from essentials to luxury items, the category is also heavily shopped, with an almost 20% year-over-year sales increase. Category popularity:
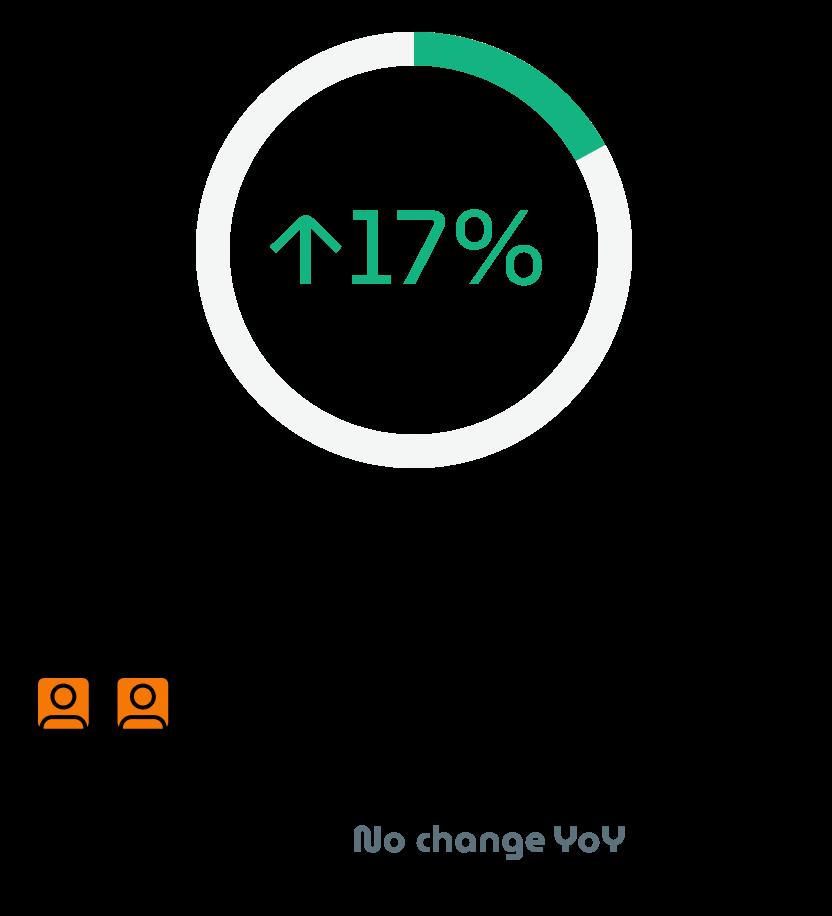


190k+
10.3M+
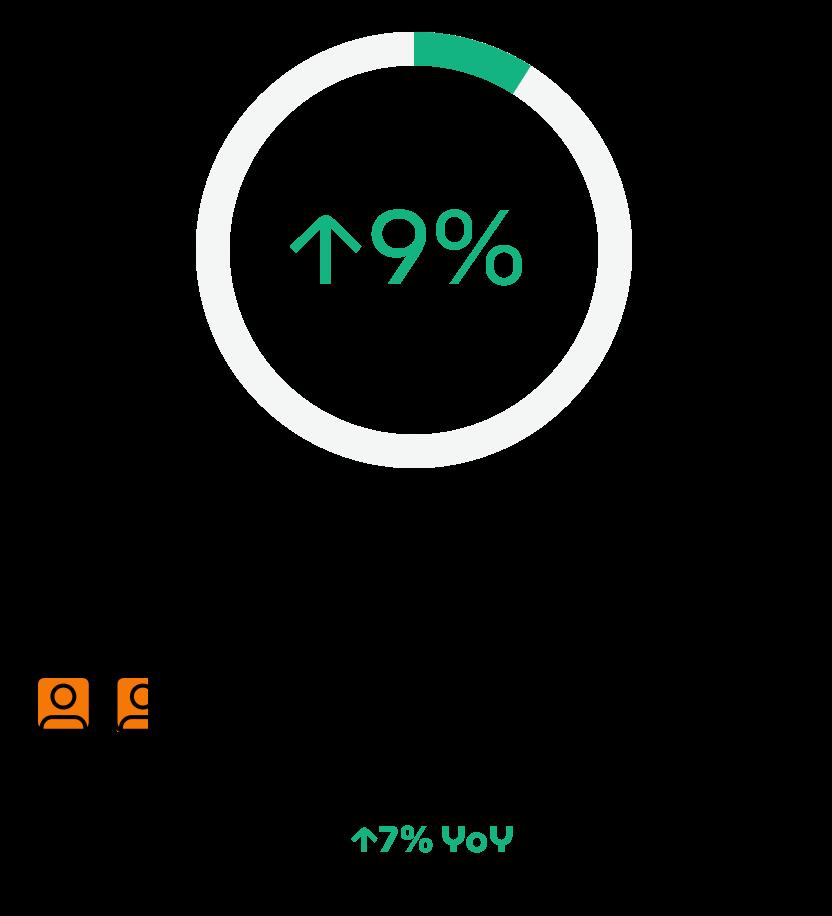
Led by well-established brands like Graco and Pampers, Amazon’s Baby Products category is growing both in sales and in competition, with nearly 10% more sellers entering this market in the past year.
Shoppers are purchasing more in this category, with sales increasing almost 10% year-over-year as well.

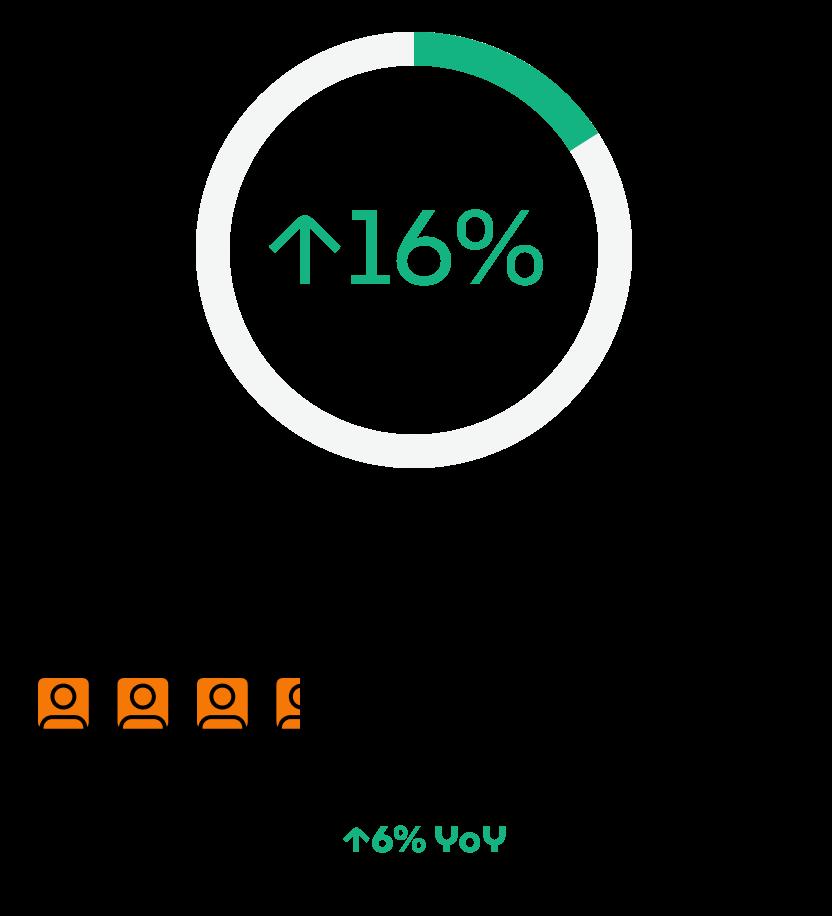
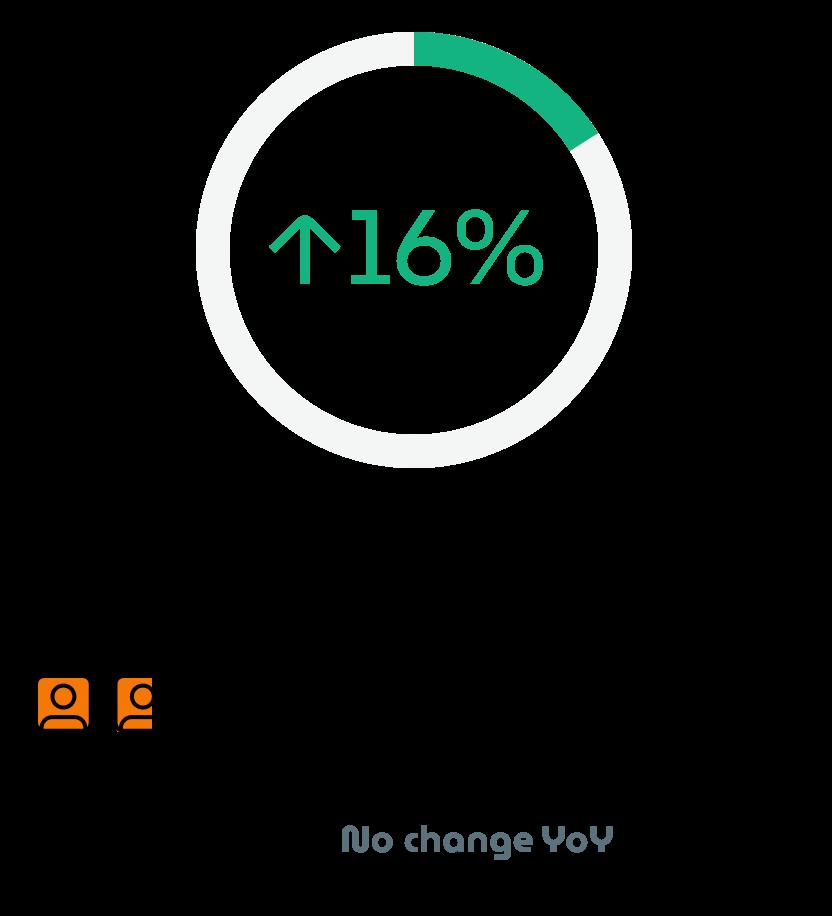
The market share landscape in Amazon’s Health & Household category underscores its competitiveness, with all 5 leading brands holding approximately 1% of the market.
The nearly 20% of brands that sell in this category have enjoyed market growth over the past year, with a sales increase of 16% compared to the previous year.


140k+
1.4M+ competing brands
Based on market trends data for Amazon’s most popular categories, this section explores what makes a “winning” category on Amazon and how brands or sellers can find success in highly competitive markets.
Stable markets attract brands and sellers seeking growth opportunities on Amazon.
Categories like Home & Kitchen, Beauty & Personal Care, Clothing, Shoes & Jewelry, Baby Products, and Health & Household encompass a wide range of essential products:

Over-the-counter medication

Cleaning products
Household supplies

Clothing
Personal care items
Baby care necessities
This makes them less vulnerable to seasonality and economic factors like inflation, which is affecting 79% of consumers’ spending habits in 2024.
High-demand, high-competition markets offer the allure of high sales potential, but also present unique risks.
Pros and cons of high-demand, high-competition categories
Pros
Large volume of shoppers
Higher sales potential
Continuous market trends to leverage as consumer preferences evolve
Ample opportunities to capture market share and increase revenue
Increased visibility and credibility with consumers
Cons
Intense competition
Rising advertising costs
Price competition can lead to downward pressure on profit margins
Higher potential for counterfeits/ copycats
Success requires significant investment (marketing, storage, product development, etc.)
1. Conduct a market gap analysis
• Find underserved segments within your category by analyzing consumer behavior and emerging trends
• Capitalize on untapped market demand by developing or promoting products based on current consumer priorities, such as eco-friendliness


2. Focus on key competitors of consumers say Climate Pledge Friendly badges are important to their purchase decisions on Amazon
• Identify and track the brands closest to yours in market share ownership for your category
MasterPieces grew its market share on Amazon by 10% with Cobalt. Learn more → 61%
Source: Jungle Scout Q3 2023 Consumer Trends Report
Small business strategy:
Use your agility and flexibility as a competitive advantage, allowing you to innovate more rapidly than larger competitors
Enterprise-level approach:
Leverage big data to identify market trends and whitespace opportunities in your category
• Tailor your strategies to exploit the weaknesses of those competitors (product quality issues, customer service shortcomings, price disparities, gaps in product assortment, etc.)
Small business strategy:
Focus on competitors that you can realistically overtake, who have similar resources as your brand
Enterprise-level approach:
Focus on competitors who are enough of a threat to be worth your investment in research, targeted campaigns, and other efforts
3. Invest in differentiation
• Offer bundles or discounts to differentiate your pricing from competitors
• Use influencer partnerships, AR, and video content to enhance the shopping experience and offer a superior view of your products
1 in 3
4. Use your primary categories as a springboard shoppers who’ve used Amazon’s View in Your Room AR feature say it led them to make a purchase they would otherwise only make in person.
Source: Jungle Scout’s Q1 2024 Consumer Trends Report
Small business strategy:
Leverage Amazon’s Small Business badge and invest in brand building to differentiate yourself from larger brands in your niche
• Leverage your brand’s success in categories with high visibility to unlock new revenue streams in adjacent markets or with complementary products
• Build remarketing campaigns to increase awareness of your additional products and categories among existing customers
Small business strategy:
Collaborate with complementary SMBs, cross-promoting joint product bundles to reach new audiences and related categories
55%
of SMB sellers will focus on new marketing tactics in 2024. 64%
Source: Jungle Scout’s 2024 State of the Amazon Seller Report
Enterprise-level approach:
Expand your market presence through strategic acquisitions or partnerships that open up new markets and leverage other brands’ reputations, distribution channels, and customer bases of consumers say Small Business badges are important to their purchase decisions on Amazon
Source: Jungle Scout Q3 2023 Consumer Trends Report
Enterprise-level approach:
Launch multi-channel marketing campaigns designed to differentiate your products from competitors based on key features
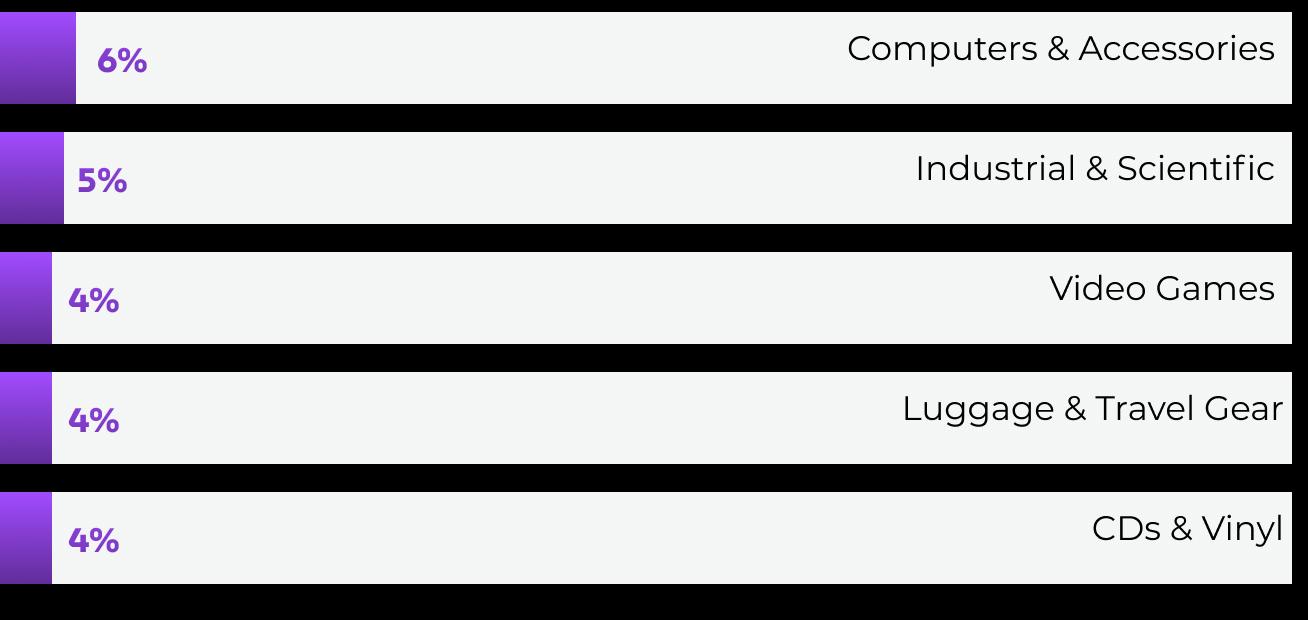
This chapter explores sales, revenue, pricing, search, and other market trends for categories that are least popular among both brands and consumers:
Computers & Accessories / Industrial & Scientific / Video Games / Electronics / CDs & Vinyl
It also includes tips and insights for brands and sellers offering products in low-demand, low-competition, and/or niche categories.
Sales have declined year-over-year in Amazon’s Computers category, as have the number of competing brands. Apple currently owns more than one-third of the category’s market share. This, combined with the fact that consumers are highly likely to purchase directly from Apple (online or in-store), could be behind declining sales (and sellers) on Amazon.
Despite a 10% average price increase that facilitated modest revenue growth, 14% fewer sellers are offering products in this market in the past year.


7k+
100k+ competing brands products offered
Of 24 Amazon categories, Industrial & Scientific had the highest yearover-year average price increase, at 63%. While this led to a 50%+ revenue increase, this trend is unlikely to hold.
The category also has a dominating market share leader, with Genabio holding almost 50% ownership — making it harder for other competitors to gain much control over the market.


75k+
840k+ competing brands products offered
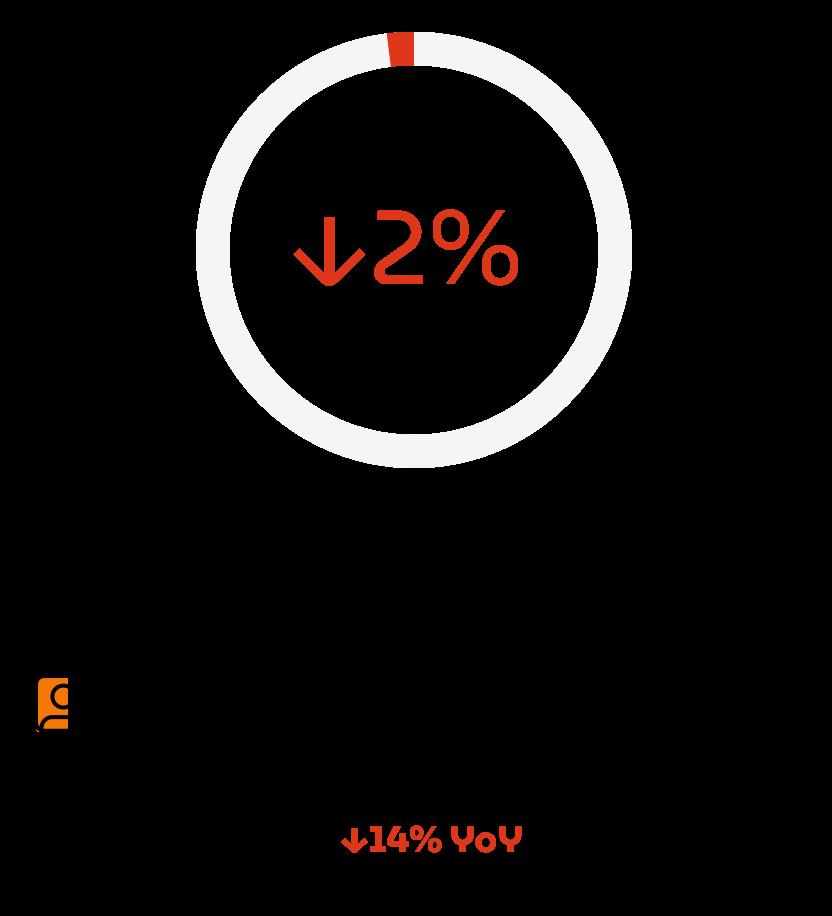
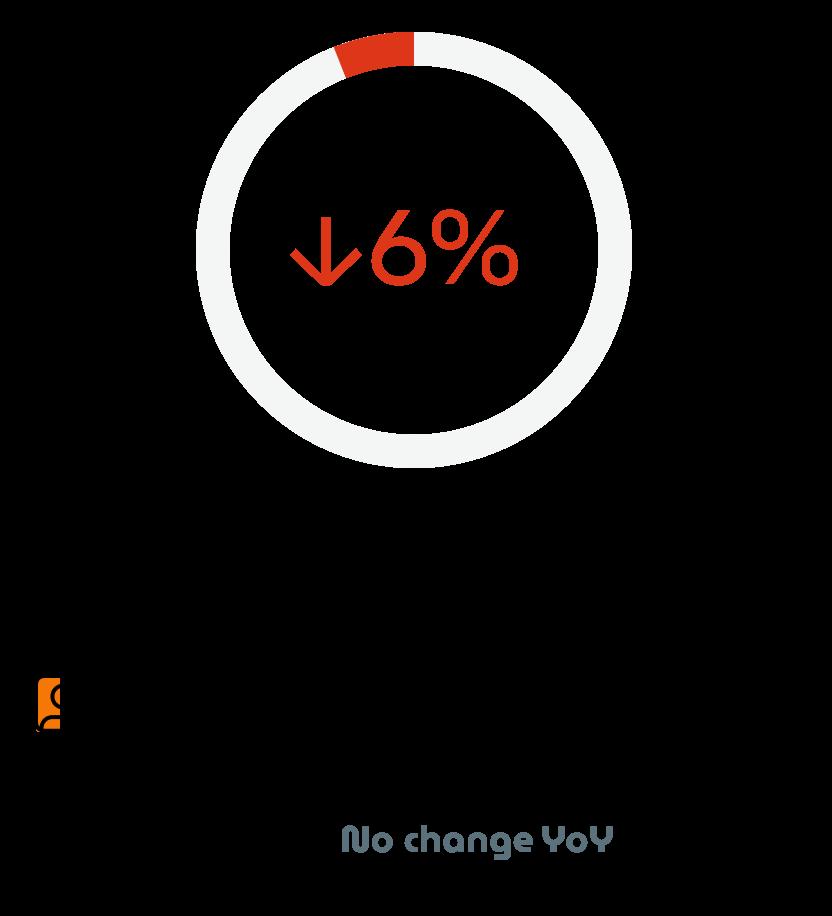
Composed largely of legacy systems and eGift cards, Amazon’s Video Games category consistently falls at the bottom of the popularity list for sellers.
Although long-time industry icons like Nintendo and Playstation still lead the market, sales continue to drop as consumers increasingly move toward digital content — and a 2% year-over-year price increase hasn’t helped.
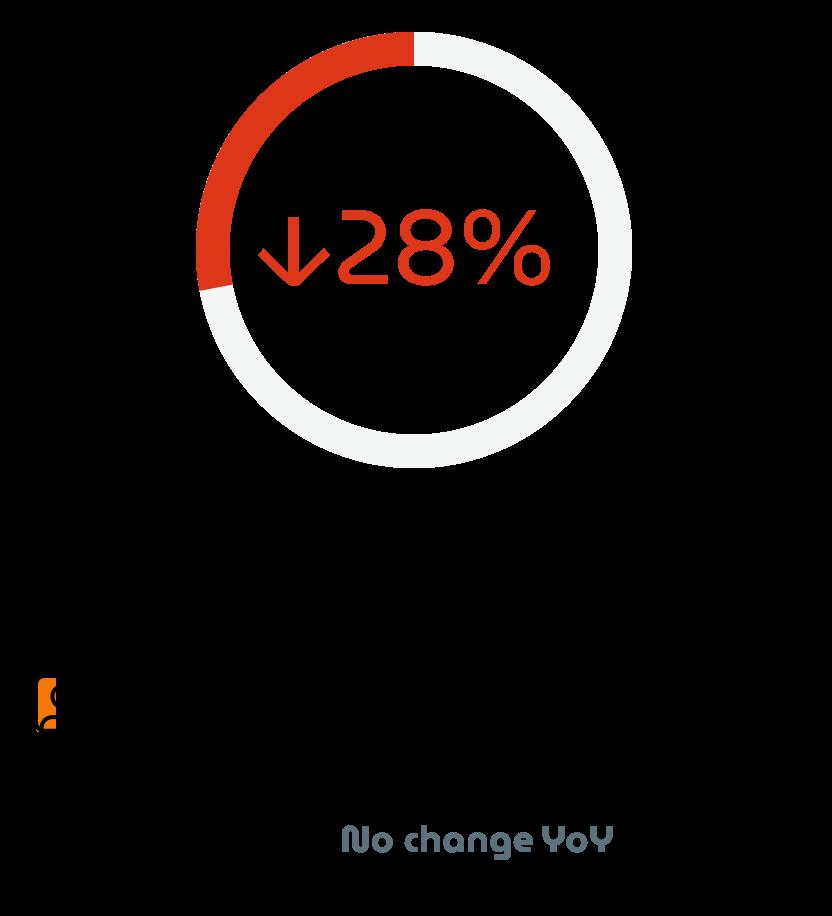
Keyword trends
12k+
115k+ competing brands products offered
Keyword
Nintendo Switch games
Nintendo Switch
Xbox controller
PS5 controller
PS5 games
Year-over-year market trends
Market share leaders

Market share percentages are estimates based on a sampling of 1M+ products from this category.
Amazon’s Electronics category encompasses everything from cameras to cell phones to televisions and projectors. Despite this wide variety of products, however, sales are down, the number of sellers has dropped, and one brand owns nearly one-third of the market share.
With a market leader like Apple, this category is increasingly difficult to compete in for brands that lack the resources to go up against behemoths of the industry.

45k+
400k+ competing brands products offered
CDs & Vinyl had the biggest yearover-year sales drop (over 40%) of all categories covered in this report.
Although the number of brands and sellers in this category has doubled since 2020, it still sits at just 4%. Low competition is not surprising for such a niche market, but shoppers are turning elsewhere, as sales have dropped more than 40% year-over-year on Amazon.
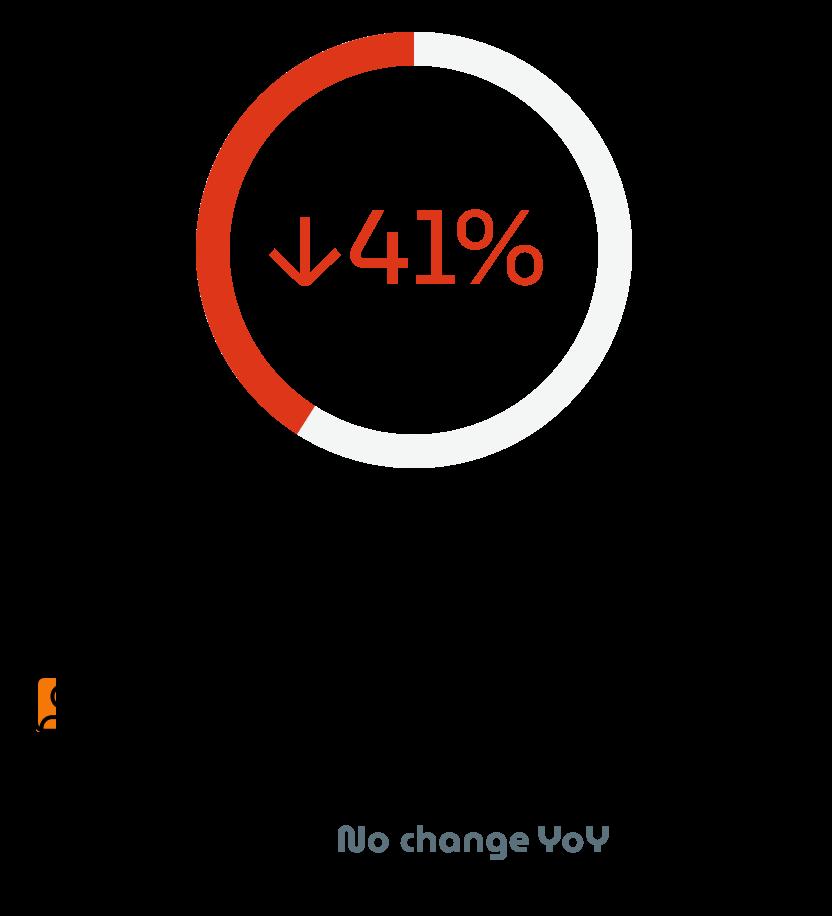

450k+
1M+ competing brands products offered
Keyword trends Keyword
Swift cd
Shifting consumer preferences, technological advancements, and changes in lifestyle trends influence the relevance and appeal of certain categories:

The popularity of the Video Games category has declined as consumers have moved to purchasing digital content
Bigger-ticket purchases, like computers, are more susceptible to cutbacks when consumers are tightening budgets
Based on market trends data for Amazon’s least popular categories, this section explores what makes a “losing” Amazon category and whether brands or sellers can find success in low-demand markets.
Categories that appeal largely to B2B customers, like Industrial & Scientific, struggle to generate demand on Amazon’s B2C marketplace
Low-demand, low-competition categories on Amazon may lack the mass appeal of mainstream products, but they can also harbor untapped potential for differentiation and expansion.
Pros and cons of low-demand, low-competition categories
Pros
Lower competition
More opportunities for innovation
Lower advertising expenses
More control over pricing can lead to higher profit margins
Easier to become a market leader and the “go-to” source for specialized products
Cons
Higher risk of failure
Limited customer base
Slow sales velocity and inventory turnover
Difficult to scale with limited demand
Potential for increased market volatility/unpredictability
1. Implement targeted positioning
• Use keyword-targeted Sponsored Products or Sponsored Brands ads to reach customers actively searching in your niche, allocating budget to campaigns that drive traffic to listings
• Identify complementary products in your catalog and create crossselling/upselling opportunities on product pages, increasing average order value and revenue per customer
2. Invest in social media and influencer marketing of consumers say they are influenced by products that are recommended to them on Amazon. of consumers start their searches on a social media platform when shopping for a product online. 52% 42%
Source: Jungle Scout Q3 2023 Consumer Trends Report
Small business strategy:
Use responsiveness and personal touch to provide exceptional customer service that sets you apart from larger competitors
Enterprise-level approach:
Expand targeted campaigns across multiple channels — both digital and traditional — to drive awareness of your products
• Run awareness campaigns both on and off Amazon to increase interest in your products, using Amazon market data and data from social platforms to identify niche audiences
Source: Jungle Scout’s Q1 2024 Consumer Trends Report
• Establish brand-owned communities where customers can interact with your brand and one another
Small business strategy:
Collaborate with micro-influencers in niche communities relevant to your category to build awareness and drive traffic to listings
Enterprise-level approach:
Invest in comprehensive campaigns featuring influencers with significant reach, leveraging multiple channels to maximize exposure
Highlight unique selling propositions
• Showcase multiple applications for your products, illustrating how they can be used in various contexts and positioning them as multifunctional solutions
• Focus efforts on conversion optimization, emphasizing the product features and factors that have the most influence over consumers’ purchase decisions
• Integrate your Amazon presence with other sales channels, offering Amazon Pay and linking ads to listings
• Research the other categories that your key competitors sell in and analyze whether you can expand to those markets as well
Among SMB sellers on Amazon, just 17% also sell in brick-and-mortar stores, compared to 65% among Enterprise sellers. 52%
of consumers prioritize the most impressive product features when shopping on Amazon
Source: Jungle Scout Q1 2024 Consumer Trends Report
Small business strategy:
Leverage lower overhead costs and operational flexibility to offer competitive pricing
Source: Jungle Scout’s 2024 State of the Amazon Seller Report
Small business strategy: Enterprise-level approach:
Customize your products by offering exclusive designs that appeal to specific audiences, or packaging that is more eco-friendly or accessible
Forge partnerships with brick-and-mortar retailers that appeal to the audience for your niche, and include “find us on Amazon” messaging on product packaging
Enterprise-level approach:
Explore opportunities to sell your products to other businesses through Amazon’s B2B platform, and target enterprise customers and wholesale buyers

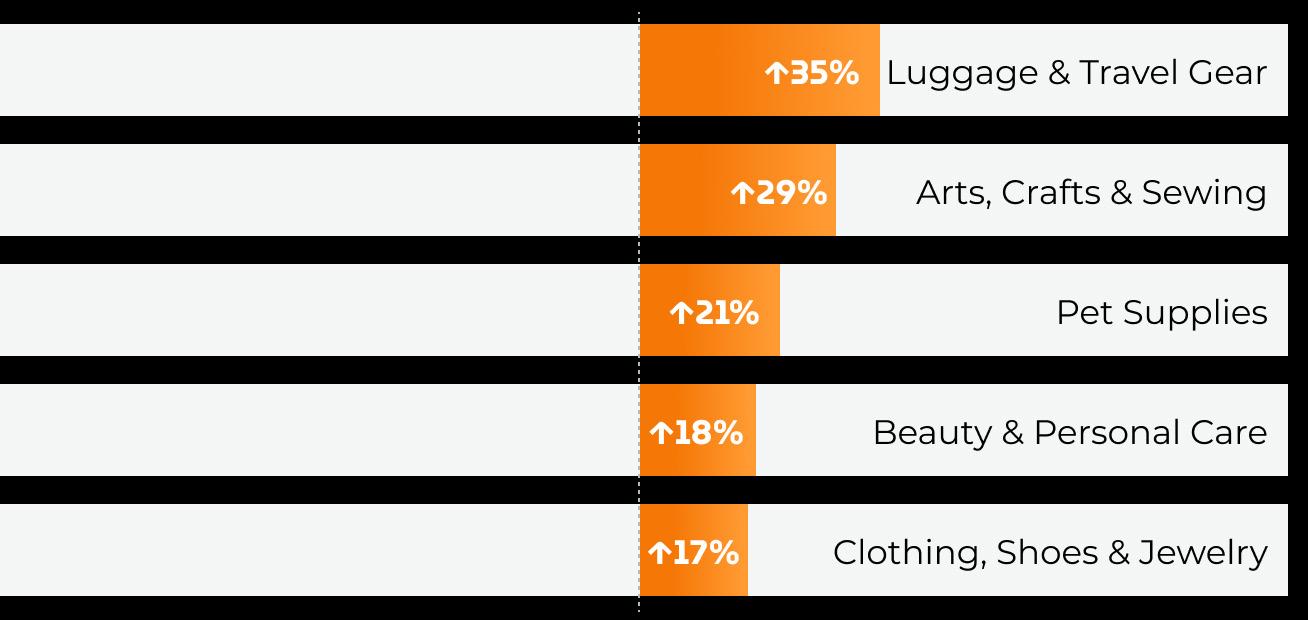
In some cases, popularity among sellers does not align with current consumer demand. This chapter explores category outliers where popularity among shoppers and sellers appears to diverge:
Luggage & Travel Gear / Arts, Crafts & Sewing / Pet Supplies / Automotive / Toys & Games
It also includes insight into the opportunities and obstacles that this divergence can create, with actionable tips for brands and sellers.
Out of 24 Amazon categories, Luggage & Travel Gear experienced the highest year-over-year sales growth, a clear indicator of rising consumer demand.
While brands are picking up on this (with 33% more entering the market in the past year), just 4% total are currently selling in this category. This shows a clear trend of the market trailing behind demand, leaving room for competitors to grow and new leaders to emerge.
Keyword trends
60k+
800k+ competing brands products offered
Keyword Packing cubes
Luggage sets
Suitcases with wheels
Suitcase Carry on luggage 22x14x9 airline approved


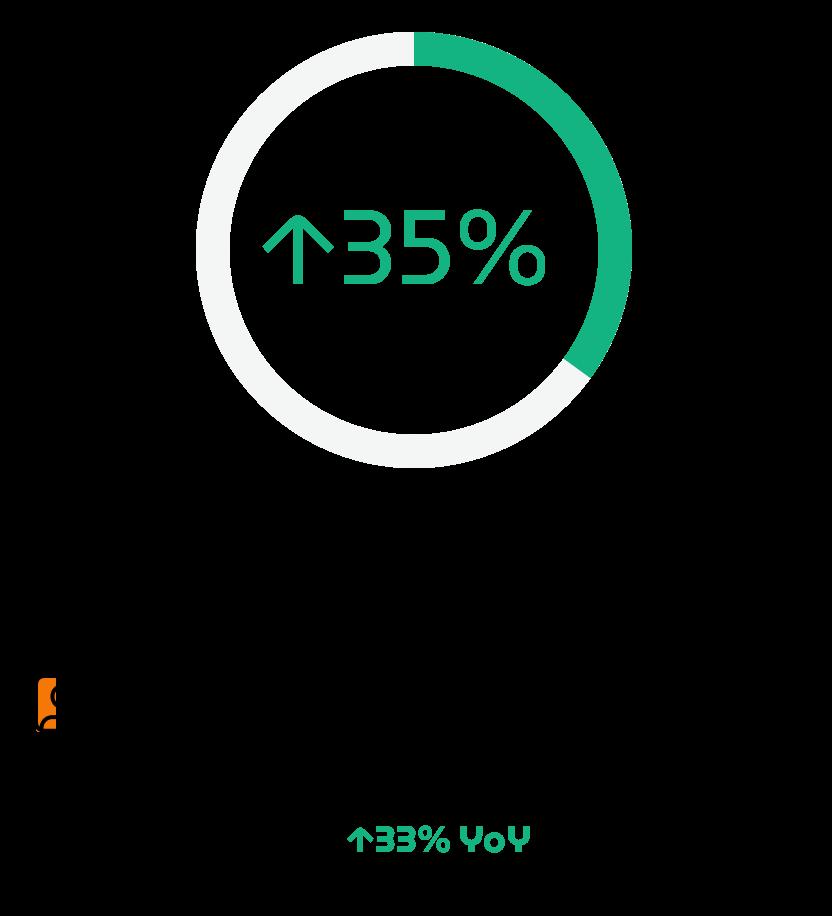
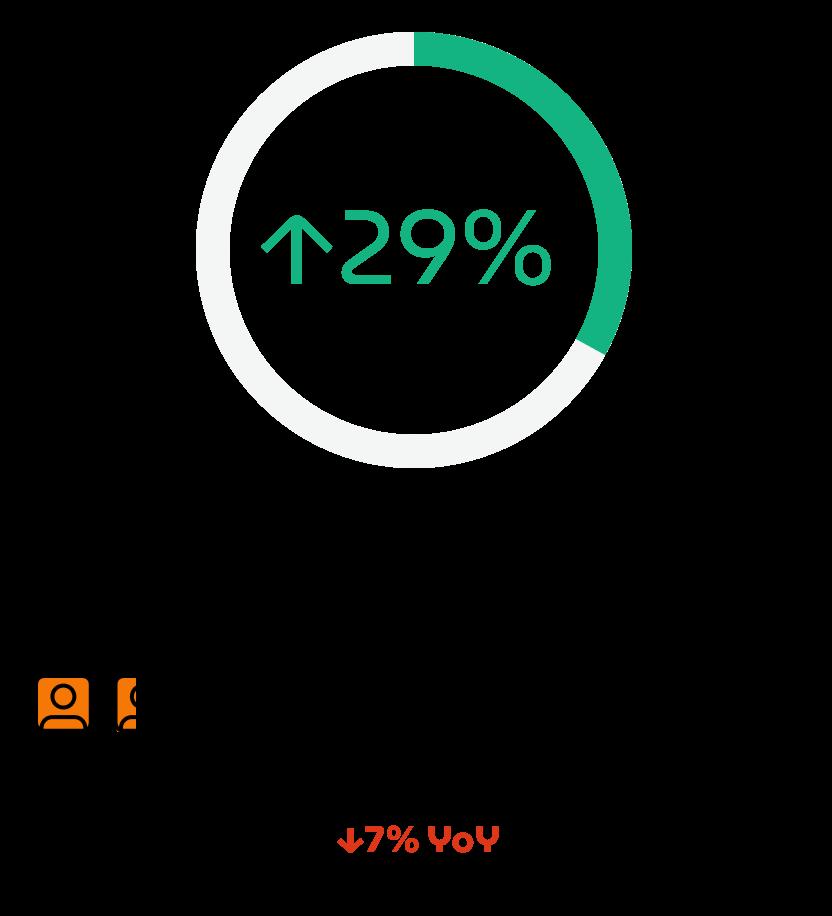
Amazon’s Arts, Crafts & Sewing category has seen 29% year-overyear growth in sales. Yet only 14% of brands and sellers offer products in this category, and that number has dropped nearly 10% over the past year.
Consumers identify Amazon as one of the top places to buy arts, crafts, and sewing supplies. Parents and teachers may also be purchasing from this category more after extended at-home schooling during the pandemic, causing demand to outpace seller growth.


45k+
700k+ competing brands products offered
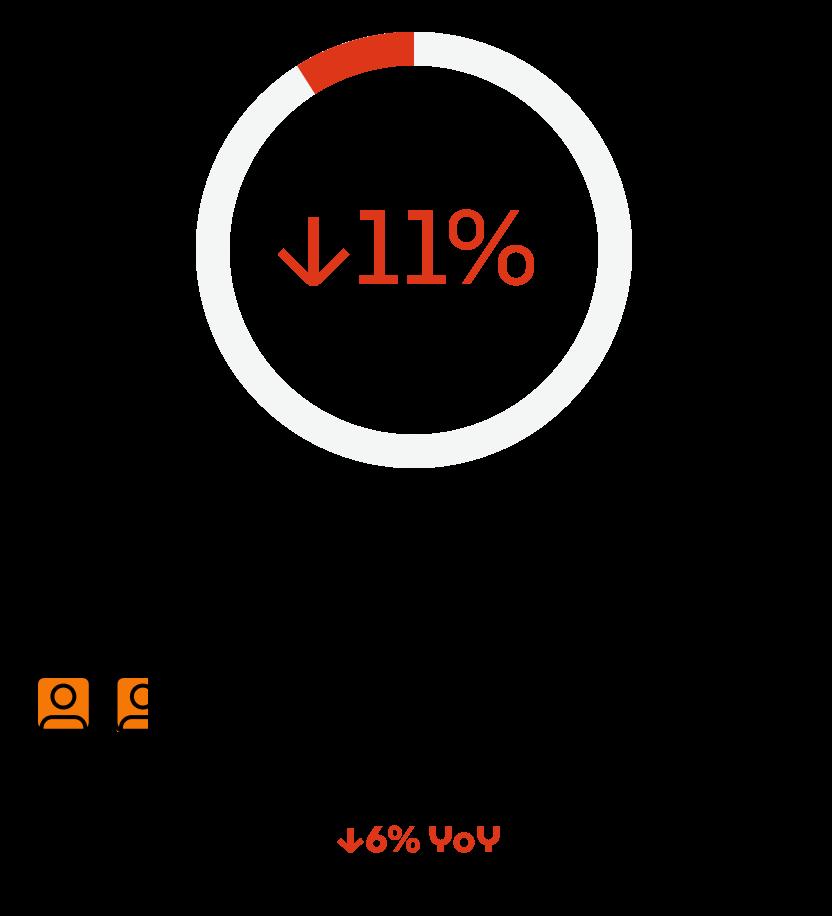
Pet Supplies ranks in the top 10 for both shoppers and sellers, but for shoppers it cracks the top 5 and for sellers it barely makes the list. Out of 24 Amazon categories, Pet Supplies had the third-highest sales growth, yet just over 10% of sellers offer products in this category.
The market is shifting: 8% more brands and sellers have entered this category in the past year. With the jump in demand, though, there’s still room for brands to make headway — especially if they focus on consumer priorities like eco-friendliness, safe formulas, and healthier nutrition options.


60k+
800k+ competing brands products offered
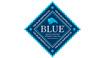
While generally stable, the Toys & Games category on Amazon isn’t immune to demand fluctuations. Despite its popularity, it’s not essential and can be affected by spending cutbacks during tight financial times.
Almost 20% of brands sell Toys & Games on Amazon, a 13% increase over the past year. During the same period, however, sales in this category dipped more than 10% — even as the average price decreased.


85k+
950k+ competing brands products offered
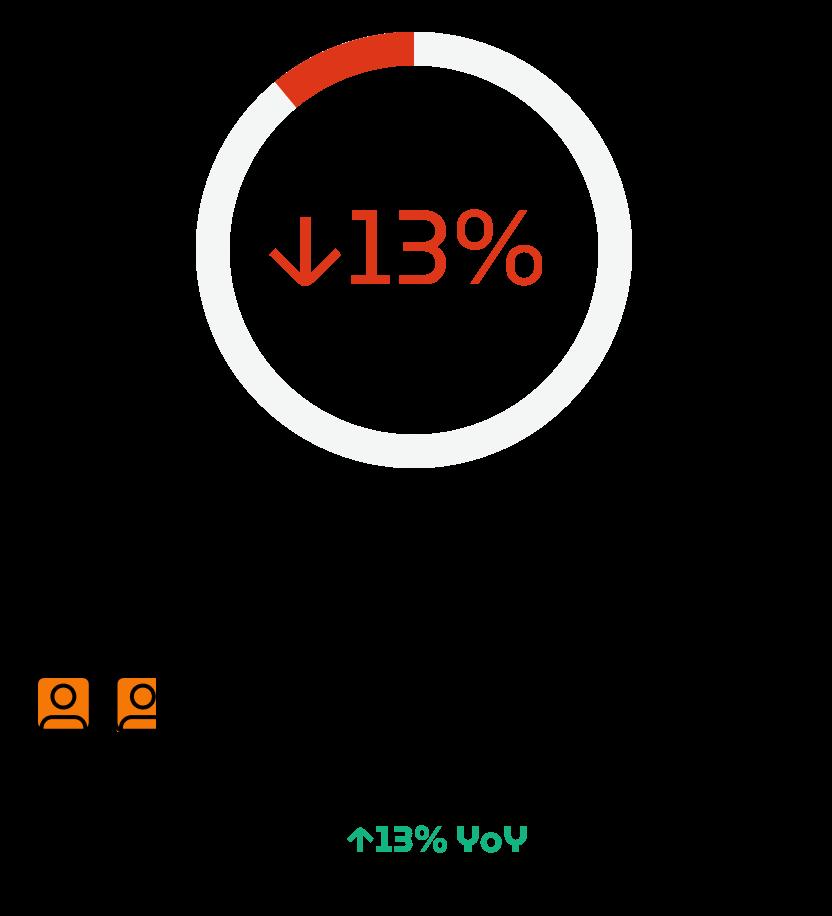
In the past year, the number of brands in Amazon’s Automotive category decreased by 20%, while sales surged by nearly 20%. Despite its increasing popularity with shoppers, only 8% of brands and sellers are currently in this market. The growing demand may be in part due to a 4% year-over-year price dip, giving Amazon an edge over other retailers for budgetconscious consumers.


trends
60k+
1.3M+ competing brands products offered
Category outliers have a huge range of implications for sellers. They pose some of the biggest risks to selling on Amazon, but can also create some of the biggest opportunities for growth and market share domination.
1. Ability to influence trends
In categories that are popular with sellers but have low or declining demand, brands can shape trends by developing innovative products that capture consumer attention and directly drive demand.
Proactively research emerging consumer trends and develop innovative products that anticipate future demand. Use market insights, consumer feedback, and trend analysis to stay ahead of the curve.
3. Rapid growth
If a category is increasing in popularity with consumers but seller saturation is lagging, new market entrants can experience incredibly fast growth.
Seize the opportunity to establish your brand as a market leader by swiftly entering emerging categories. Focus on building awareness, expanding product offerings, and capturing market share before competitors catch up, leveraging advertising and strategic partnerships to accelerate growth.
2. Easier product adoption
Shoppers are more willing to explore new brands and products in categories where there are few competitors.
Target influencers, early adopters, and trendsetters within your niche by offering exclusive promotions, limited-edition releases, or early access to new products.
4. More potential for brand recognition
In categories with fewer competitors, there is a higher probability of fostering brand loyalty and repeat purchases.
Prioritize brand-building initiatives and invest in delivering exceptional customer experiences that foster advocacy, encourage social chatter, and drive repeat purchases and referrals.
1. Forecasting challenges
Markets with divergent trends can be harder to predict and plan for, increasing the risk of misjudged market potential and wasted investments.
Leverage advanced data analytics and predictive modeling to analyze market trends and identify strategic opportunities. Invest in robust tools and research to make informed business decisions and mitigate forecasting risks.
3. Market oversaturation
An overabundance of sellers in a category that lacks demand makes it harder to gain visibility and establish a foothold in the market.
Focus on niche positioning by emphasizing premium quality and distinct brand identity. Target niche customer segments with tailored product offerings and personalized marketing messages to stand out in a crowded marketplace.
2. Increased educational investments
In categories with lower demand, brands may need to invest more in educating consumers about their products in order to drive sales.
Implement targeted education and awareness campaigns to inform consumers about your products. Take a multi-channel approach, with detailed product listings, instructional videos, blog posts, and social media content.
4. Inventory issues
Higher consumer demand and lower seller saturation may result in inventory shortages and stock-outs for brands in those markets.
Implement advanced inventory management strategies, balancing safety stock with just-in-time practices to reduce carrying costs and maintain product availability. Use inventory forecasting tools and demand planning algorithms to help optimize inventory turnover.

Navigating Amazon’s many categories requires a vigilant eye on consumer trends, market dynamics, and more. This chapter includes tips from ecommerce sellers, consultants, and experts, as well as recommended resources for further research.
How can brands differentiate themselves within highly competitive categories?
“To stand out in a competitive category, you must create a better offer. For example: Offer a free extended warranty, improve your product images, and use comparative images and videos in your advertising to show exactly why your product is better.”

Amazon seller, expert, and instructor
How can brands manage fluctuations in demand throughout the year?
“A lot of it will come from understanding the market and niche behaviors. Study the data before making decisions.
Fluctuations are dangerous because they can kill profitability. On the inventory management side, sellers should build operations that allow flexibility. That comes down to having great relationships and terms with suppliers and 3PLs. Amazon Warehousing and Distribution (AWD) is a great option with built-in flexibility to send or remove products from FBA faster.”

Cofounder, SellerAssist by Carbon6, and Community Ambassador
What is your advice for finding niche markets with untapped growth potential?
“Go all in for long-tail niches! Here’s a tip using Jungle Scout:
1. In Keyword Scout, search for a seed keyword, and it will return all relevant keywords in the database
2. Start filtering: Select a category, limit your search to keywords that are easier to rank for, set a minimum search volume, etc.
3. Use Product Database to get at the numbers: Add a monthly revenue threshold, filter by seller type/level of competition, and include all of the keywords you found through Keyword Scout in the “include keywords” filter
This will help you find products to launch or listings to update to fill the white space you’ve identified.”

Amazon seller and consultant
How can brands use non-Amazon channels to gain visibility in low-demand markets?
“I recommend working with micro-influencers (those with a smaller following) to create search-based content on YouTube:
1. Do in-depth keyword research to find all the “how-to” videos in your niche
2. Contact YouTube micro-influencers in your niche
3. Give them your products for free and ask them to create “how-to” videos based on keywords you provide
4. Ask them to showcase your product in action, with a few calls to action throughout the video
“How-to” videos tend to perform very well on YouTube, and they can stay relevant for years. This is a great strategy for getting Amazon sales with traffic from outside of Amazon, and you’ll get better organic rankings on Amazon as well.”
Amazon seller, expert, and instructor
What strategies would you suggest for brands selling in categories that are experiencing declining sales?
“Sellers should answer the question: Is the decline in sales primarily driven by broader economic trends (inflation, consumer spending patterns, unemployment rates, or disposable income levels), or does it indicate a diminishing demand specific to our product or niche (people not looking for iPhone 13 phone cases in 2024)?
If the answer comes down to broader economic trends, think about the quote from Bruce Barton: ‘In good times, people want to advertise; In bad times, they have to.’
This is the prime time to invest in advertising and brand building. Find your customers where they are and create irresistible offers. Think about bundles, add-ons, freebies, and exclusive discounts.
If the answer is that your product is dying and customers are not looking for it anymore, it’s time for some innovation. This could involve introducing new features, focusing on niche markets, or improving product quality. Consider expanding to new markets, like the Hispanic market in the US—which can be targeted by leveraging the Spanish translation of your listing.”
Cofounder, SellerAssist by Carbon6, and Community Ambassador
See how brands, sellers, and shoppers are approaching Amazon and other online and brick-and-mortar retail channels in 2024.
Explore sales trends, consumer demand, market share leaders, and other data for different products and categories on Amazon. 2024 State of the Amazon Seller

The data included in this report was gathered using Jungle Scout’s industry-leading market intelligence, product insights, and advertising analytics tools, which are powered by trillions of Amazon data points. Data was collected using Jungle Scout Data Cloud.
Note: This data represents the U.S. marketplace for specified date ranges and filter parameters. Percentages have been rounded to the nearest whole number. Year-over-year data reflects the period of March 14, 2023 - March 14, 2024 compared to March 14, 2022 - March 13, 2023.
We encourage you to explore Jungle Scout’s Best and Worst Amazon Categories Report report and to share, reference, and publish the findings with attribution to “Jungle Scout” and a link to this page.
For more information, specific data requests or media assets, or to reach the report’s authors, please contact us at press@junglescout.com
Over the past decade, Jungle Scout has gathered a wealth of data points through continuous monitoring and analysis of Amazon. The tools used to build this report are the same ones that 1 million+ sellers, enterprise brands, retailers, and agencies use each day to make confident decisions and develop effective strategies on Amazon. See how our tools can help your business grow by signing up or requesting a demo.
Jungle Scout is the leading platform for Amazon sellers, supporting more than $50 billion in annual Amazon revenue.
Founded in 2015 as the first Amazon product research tool, Jungle Scout today features a full suite of best-in-class business management and market intelligence solutions to help sellers:
• Find and track winning products
• Discover high-value keywords
• Source suppliers for products
• Create and optimize product listings
• Jumpstart their business with exclusive tutorials
Jungle Scout Cobalt empowers brands and retailers with a powerful suite of ecommerce tools designed to drive growth on Amazon. Comprehensive data analytics, built-in advertising automation, and intuitive visualizations turn insights into action. Cobalt is trusted by brands and retailers worldwide to:
• Track and grow market share
• Analyze performance data
• Gauge market trends and competitor performance
• Optimize ad campaigns
• Gauge share of voice and discover keyword trends
Jungle Scout Data Cloud offers scalability and flexibility by providing retailers a way to get Jungle Scout’s industry-leading data, with the ability to analyze and visualize that data using the tools of their choice. It provides a comprehensive view of Amazon market dynamics by allowing retailers to:
• Access millions of data points
• Extract insights using tools like Snowflake, Azure, and others
• Create custom visualizations with PowerBI, Tableau, and similar tools
• Analyze trends in consumer demand
• Investigate third-party sellers
Sign up today Book a demo Try Data Cloud with Snowflake