
Key takeaways

“Social shopping” is rapidly changing the way people browse and shop online. The number of consumers likely to buy a product directly from a social channel increased nearly 30% compared to Q1. Shoppers rank social media advertising as the second-most influential type of online ad content.

Inflation and the economy are affecting Millennials more than any other generation of shoppers. Nearly 90% say their spending has been impacted by rising costs; three out of four are worried about their finances; and more than half have unstable income.


Homeownership greatly influences shopping and spending. This quarter, 20% more renters than homeowners are worried about their finances, and 13% more renters have cut back online spending compared to homeowners.

Jungle Scout’s Consumer Trends Report is a quarterly study of 1,000 U.S. consumers that explores how and where people are shopping. This report covers trends in the second quarter of 2024, including generational differences in spending.
After this edition, Jungle Scout’s Consumer Trends Reports will transition from a quarterly release schedule to a comprehensive annual publication. This strategic shift is designed to deliver more valuable insights and in-depth analysis, capturing a full year’s worth of consumer behavior and trends.

Consumer Pulse Report
Trending Spending
Consumer spending shifts over time as shoppers respond to broader trends and navigate changes to their work, lifestyles, and families. Beginning with a historical view of these shifts — tracked by Jungle Scout on a quarterly basis since 2020 — this chapter provides an overview of how much consumers are spending, what they’re buying, and where they’re shopping.

Quarterly changes in overall spending
Consumers who say their overall spending …


Spending was less stable this quarter than last. 31% more consumers say their spending increased in Q2 compared to Q1, while 9% more say they cut back.
Overall and online spending in Q2
The data in this section reflects how consumers described changes to their overall and online spending in the second quarter of 2024 compared to the first quarter.
See consumer spending data for the first quarter of 2024 here.
How did consumer spending change in Q2?


INSIGHTS
Quarterly spending changes are generally consistent between overall and online spending. One-third of consumers say their spending has decreased, while approximately one-quarter say it has increased.
Quarterly changes in spending by generation

INSIGHTS
Overall, more consumers decreased their spending this quarter than increased it.
Spending among Gen Z shoppers increased more than any other generation, both online and overall.
Gen X shoppers are most likely to have spent less overall, while Millennials were most likely to spend less online.
Across all generations except Baby Boomers, online spending increased more than overall spending.
Baby Boomers are the least likely generation to have altered their spending in Q2 compared to Q1.
Popular products: What consumers are buying
Out of 19 Amazon categories, 13 experienced sales increases from Q1 to Q2, with growth ranging from 2% to well above 50%.
With Q2 ushering in the warmer months of the year, the Patio, Lawn & Garden category experienced the biggest increase, exceeding 80%. Shoppers also bought more products in categories such as Automotive, Electronics, Grocery, and Health & Household.
Quarter-over-quarter sales trends by category


Where people shop: The most popular stores & online retail sites
Which of the biggest retail stores did consumers shop from (in-store or online) in Q2*?
In-store Online


Note: Respondents could select multiple options.


INSIGHTS
With cost-conscious consumers flocking to sites like Temu (26% more shopped there in Q2 compared to Q1), Amazon is beginning to feel the heat of competition. In June, the ecommerce giant announced plans for a budget storefront for Chinese sellers that would compete directly with platforms like Temu and SHEIN.
In-store and online shopping at Home Depot increased 24% and 54%, respectively, since last quarter as consumers purchased supplies for summertime projects.
Where
consumers shop for different product types
Consumers’ preferred retailers vary depending on the products they are shopping for. Amazon remains a top choice for buying arts and crafts products, books, electronics, exercise equipment and accessories, office supplies, and toys and games.

Where consumers shop for different product types (cont.)

Where consumers shop for different product types (cont.)

CHAPTER 2
Q2 Insights
Inflation, Interest, and Homeownership
Although the Federal Reserve recently decided against another increase, interest rates have experienced more than 10 hikes since March 2022. This continues to have a profound impact on the U.S. housing market and the economy at large. Combined with ongoing inflation effects and rejuvenated worry about a recession, consumers are in a continued state of uncertainty about their financial future — which, in turn, is impacting spending behavior across the market.
Top economic & financial concerns
Inflation’s stronghold on spending remains. From Q1 to Q2, the percentage of consumers who say inflation has impacted their spending habits increased, as did the percentage who say they are worried about their finances. A generational breakdown of this data reveals that three-quarters or more of every generation says that inflation has altered their spending.


Rising inflation has affected spending
Worried about finances
Household income is unstable
Inflation’s impacts on consumer spending over time

INSIGHTS
Compared to Q1 2024, nearly 10% more consumers now say inflation has impacted their spending, and they are concerned about their family’s finances.
Economic and financial concerns by generation INSIGHTS
Millennials and Gen X are the most concerned about their family/personal finances.
Nearly 90% of Millennials say their spending has been affected by inflation, and more than half say their household income is unstable. In both cases, this is higher than any other generation.
Employment trends
The number of surveyed consumers who report being unemployed has steadily increased over the past year; however, this figure (61%) is nearly unchanged from Q1 2024 (60%).
Quarterly changes in employment status over time

*Includes full and part-time employment **Includes retired, disabled/unable to work, homemakers, and students (full and part-time).
Household income trends
For a majority of consumers (61%), household income did not change from Q1 to Q2. This trend is consistent with what consumers reported in the first quarter of this year compared to Q4 2023. Just under 40% of consumers report quarter-over-quarter changes in their household income, with a majority of those experiencing an increase.
Quarterly changes in household income over time

Changes in consumers’ household income in Q2

Housing trends: Homeowners vs renters
With interest rates high and home prices trending up, 76% of consumers now believe it’s a bad time to buy a house. For those working towards homeownership, nearly three-quarters say affordability is their biggest hurdle. In Q2 2024, 52% of consumers own one or more homes, 38% rent, and 8% live with a partner, family, or friends and aren’t paying for housing.
Consumer housing snapshot

Among survey respondents, 50% of Baby Boomers and 27% of Gen X shoppers are homeowners, compared to just 11% and 7% of Millennials and Gen Z shoppers, respectively.
Our survey revealed that renters are more worried about their financial wellbeing than homeowners, though neither group reports feeling particularly secure. Rising inflation continues to impact spending among both groups.

Throughout this section, “homeowners” refers to consumers who own one or more homes, and “renters” includes those who rent their home or live with others who they pay rent to.
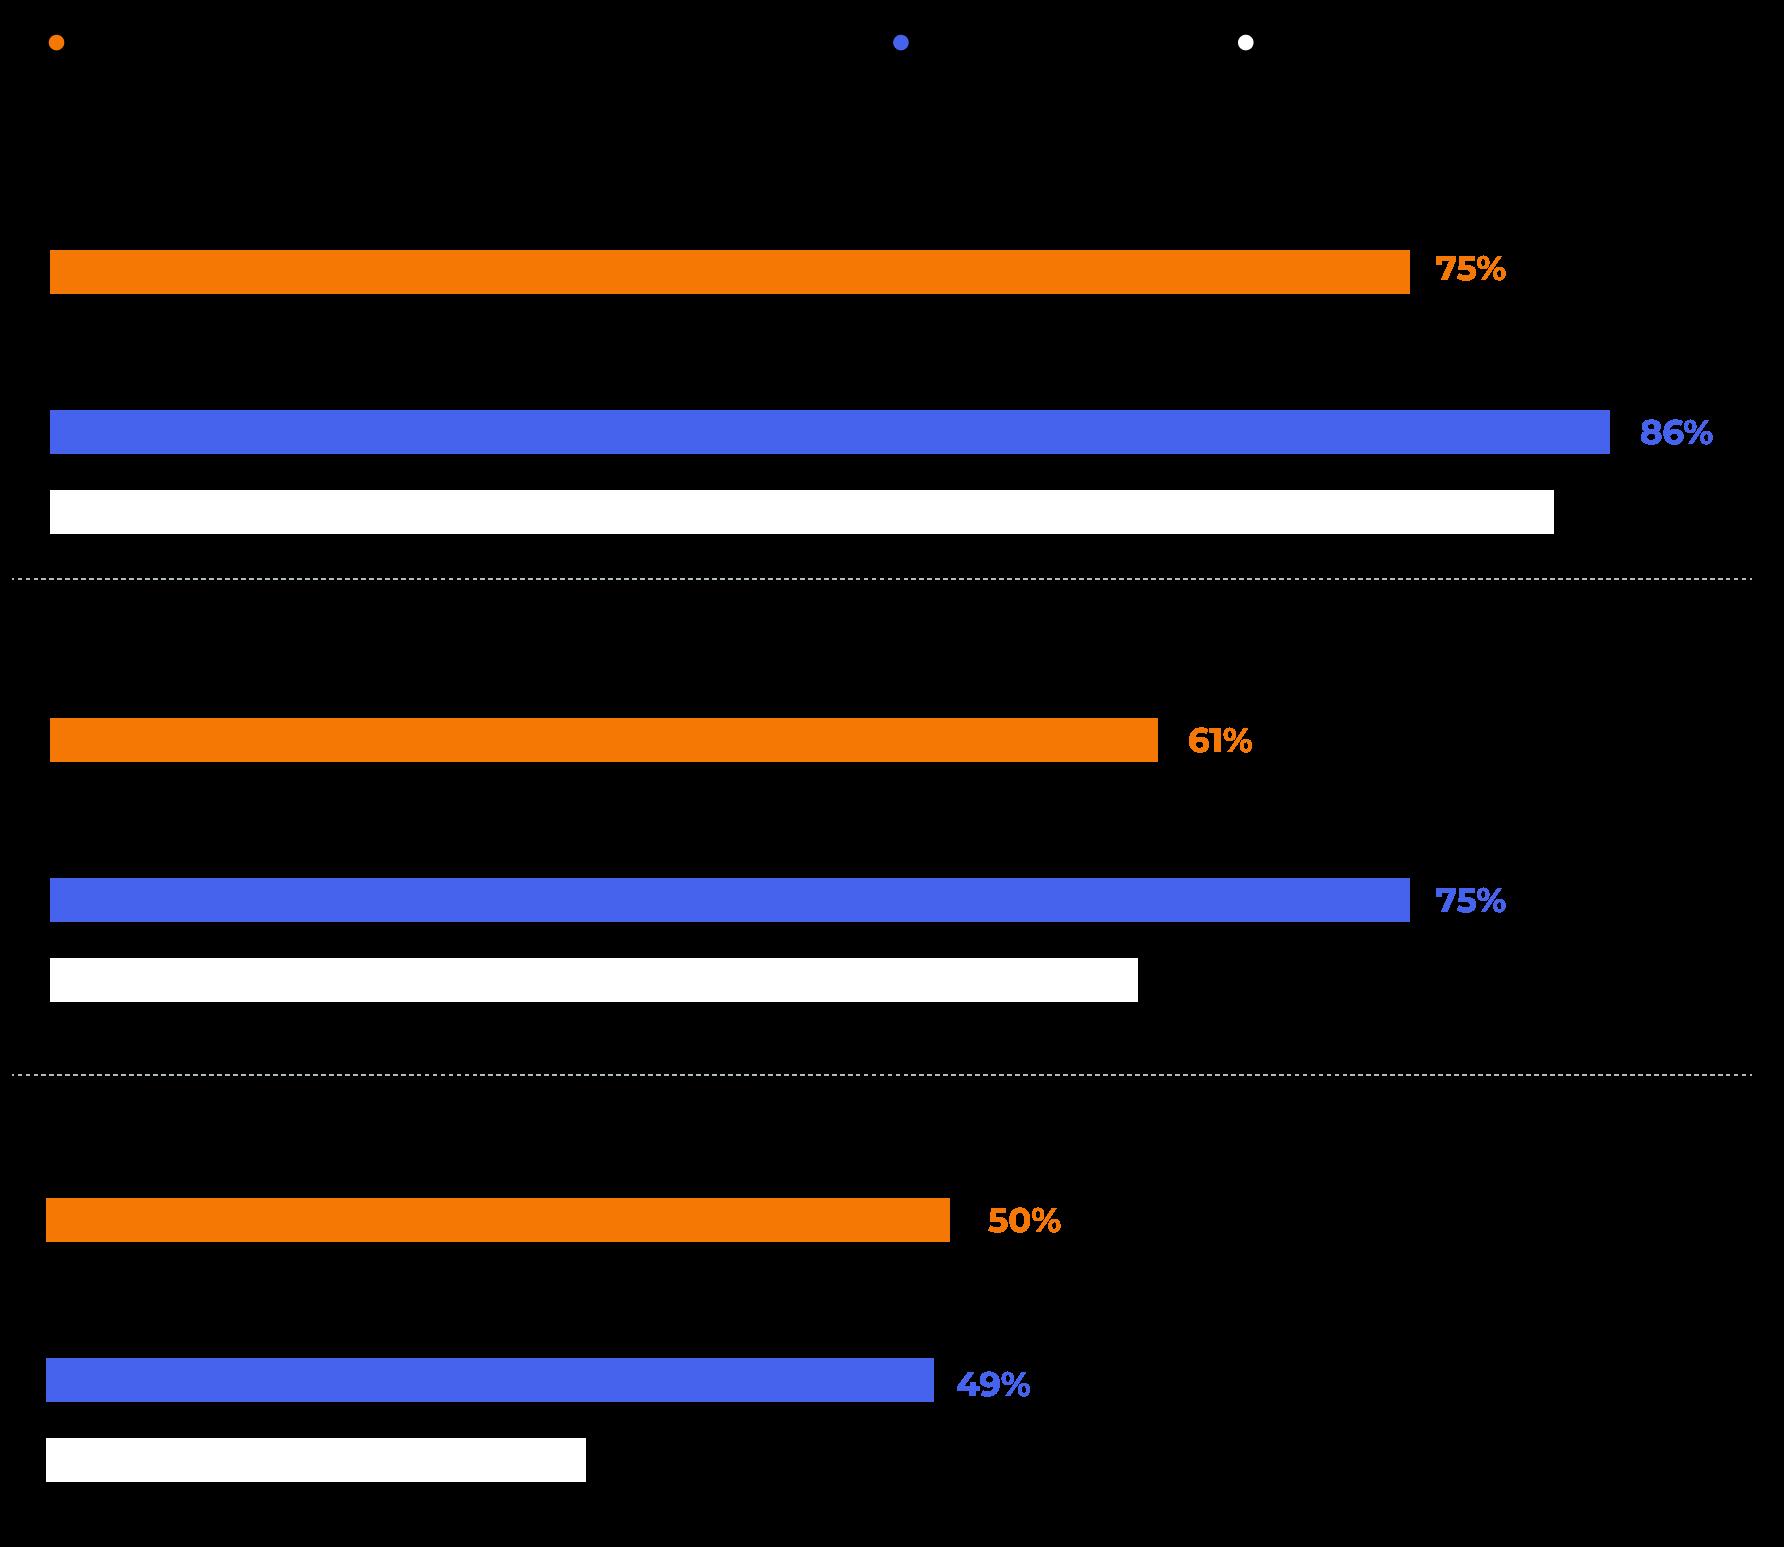
Economic concerns

INSIGHTS
The percentage of renters with unstable household incomes is 11% higher than the percentage of homeowners with unstable incomes
20% more renters than homeowners are worried about their finances
Quarter-over-quarter household income trends

Employment trends

INSIGHTS
Many would-be homeowners are in a holding pattern, renting and pinching pennies until homeownership becomes attainable. Our survey found that consumers’ housing status has a notable impact on where and how they shop.
*Includes full and part-time employment
**Includes retired, disabled/unable to work, homemakers, and students (full and part-time).
Where homeowners and renters start online product searches

INSIGHTS
Homeowners are more likely than renters to start product searches on Amazon, while renters are more likely than homeowners to turn to Walmart.com.
More than half of renters (56%) start online product searches on social media, while just a third of homeowners do the same.
For both homeowners and renters, YouTube is the top choice when starting a product search on social media.
How often homeowners and renters shop online

How often homeowners and renters shop on Amazon

INSIGHTS
While the majority of homeowners and renters shop online at least once a month, homeowners are generally more frequently doing so; 42% of homeowners shop online more than once a week, compared to 36% of renters.
Where people shop: Homeowners vs renters
In-store Online
INSIGHTS
Overall, homeowners shop more (both online and in-store) than renters.
Renters are more likely than homeowners to shop at Walmart.com; for both groups, Walmart is the most frequently shopped brick-and-mortar retailer.
Renters are shopping from websites like SHEIN and Temu — platforms widely known for low prices — notably more often than homeowners
Overall quarterly spending changes

Online quarterly spending changes

INSIGHTS
For both homeowners and renters, a higher number of consumers spent less in Q2 than spent more.
36% of renters spent less online in Q2, compared to 32% of homeowners.
Approximately 22% of homeowners spent more online in Q2, compared to 20% of renters.
Your competitive edge for selling on Amazon.
Powered by trillions of data points, Jungle Scout Cobalt is a leading Amazon market intelligence and advertising solution designed specifically for enterprise brands, retailers, and ecommerce agencies.
Cobalt features a powerful suite of tools for driving growth and profitability on Amazon:
Retail Insights brings together data from multiple Seller Central and Vendor Central accounts in unified dashboards that make it easier to track performance and make strategic decisions.
Market Intelligence places your own Amazon business data – like pricing, inventory, and ad spend – within broader market context, like market share and sales trends, so you can analyze the market and your competitors.
Ad Accelerator provides automation features that save time and resources while delivering valuable insights and recommendations for optimizing campaigns and maximizing ROI.
Digital Shelf Analytics delivers insights on share of voice, providing a detailed picture of how your products and competitors are ranking in Amazon search results.
See how Cobalt can make Amazon market research, reporting, and ad management easier for your team.

Related industry reports
2024 Amazon Product Pricing Report

This report explores Amazon pricing trends at a macro and micro level, revealing key factors that drive price changes over time.
Q1
2024 Consumer Trends Report

Explore data on consumer spending behavior at the start of 2024, including insights on the influence of AI and augmented reality in ecommerce.
2024 State of the Amazon Seller

Jungle Scout surveyed nearly 2,000 brands and businesses about their strategies for selling on Amazon in 2024. Insights on profitability, advertising investments, growth plans, and more.
CHAPTER 3
Go-to sites when searching for products
Amazon remains the most popular place for consumers to start their online product searches. It’s worth noting, however, that this number has declined over the past two years – likely due to the emergence and continued growth of other players in the ecommerce space, including social media channels as well as major retailers like Walmart.
Ecommerce Report
This chapter offers an overview of the evolving influences and preferences shaping consumer purchase behavior, both on Amazon and across other online and brick-and-mortar retailers.
When consumers shop for a product online, where do they start their search?*

*Totals do not equal 100%, as respondents could select more than one option.
Consumers who begin online product searches on Amazon
Two-year trends

Online shopping frequency

INSIGHTS
The number of consumers who begin their online product searches on Amazon is 15% lower than in Q2 2022.
INSIGHTS
More than one-third of consumers (34%) shop on Amazon once a week or more
10% of consumers shop online multiple times per day
What influences purchase decisions on Amazon?
A wide range of factors influence purchase decisions. Most consumers prioritize the lowest prices when shopping on Amazon. However, the influence of other factors is shifting. Compared to last quarter, more consumers are now prioritizing Prime shipping, subscription services, and flexible payment options.
Learn more about consumer price sensitivity and pricing trends on Amazon in Chapter 2.
When shopping on Amazon…

*Data reflects the percentage of survey respondents who said they “agree” or “strongly agree” with each statement
INSIGHTS
Compared to Q1 2024…
16%
more consumers now say they prefer to use flexible payment options when shopping on Amazon 14% more consumers say that the Subscribe & Save option influences their purchase decisions on Amazon 10%
fewer consumers are prioritizing pre-owned products when shopping 6%
more consumers are looking for products with Prime shipping
Prime membership spotlight
Prime membership trends correlate with the increased importance that consumers are placing on Prime Shipping when choosing what to buy on Amazon. Almost two-thirds of consumers have a Prime membership, a 14% increase over the past two years.
Percentage of consumers with an Amazon Prime membership


Do you currently have an Amazon Prime account?

3% of respondents aren’t sure if they have a Prime account INSIGHTS
64% of consumers have access to an Amazon Prime account
54% of Gen Z consumers have access to a Prime account
64% of Millennials have access to a Prime account
73% of Gen X consumers have access to a Prime account
63% of Baby Boomers have access to a Prime account
Social media trends
Social media’s impact on ecommerce continues to grow. Most consumers now rank social media advertising as more influential than advertising on ecommerce marketplaces like Amazon, and almost half of shoppers start their online product searches on a social media platform.

Consumers rank social media advertising as the second-most influential type of online advertising content
Percentage of consumers likely to purchase a product directly from social media
Quarterly trends

INSIGHTS
The popularity of social media shopping is rising rapidly: Compared to Q1 2024, over 20% more consumers say they are likely to buy directly from most of these social channels
Ecommerce trends by generation
Among the countless factors that determine how and where shoppers spend their dollars, generational differences are some of the most significant. From where they research products to which ads are most likely to grab their attention, there are wide variances from Gen Z to Boomers and the generations in between.
Where consumers start online product searches
By generation

INSIGHTS
Aside from Facebook, Gen Z is the most likely generation to start an online product search on a social media channel.
Of all generations, Millennials are the most likely to start an online product search on Facebook.
Baby Boomers start online product searches on a search engine like Google the most, while Gen X is most likely to start on Amazon or Walmart.com.
When starting a product search on social media, Gen Z is most likely to turn to TikTok; Millennials are most likely to turn to YouTube; and both Gen X and Baby Boomers are most likely to turn to Facebook.
Gen Z is the least likely generation to start online product searches on Amazon.
Percentage of consumers likely to purchase a product directly from social media
By generation

INSIGHTS
Gen Z is the most comfortable buying from TikTok, with twothirds saying they would buy from the platform.
For Baby Boomers, Facebook is by far the platform of choice for social shopping, with 44% more saying they would buy from Facebook than the next most popular platform (YouTube).
Facebook also takes the top spot for Millennials and Gen Xers, though YouTube is a close second for both generations.
More than half of Gen Z and Millennials would buy from any of these social media channels.
Gen Z and Millennials are least likely to make a purchase on LinkedIn; Gen X is least likely to buy something on Twitter; and nearly no Baby Boomers would shop on TikTok.
Some of the starkest generational contrasts can be seen in consumers’ readiness to buy products on social media. Each generation has its preferred platform and comfort level with social shopping.
Advertising preferences
One of the biggest ecommerce investments most brands make is advertising. Both on and off of Amazon, digital advertising can sway consumers’ purchase decisions. But how much sway different ad investments have varies, particularly by generation.

Most influential online advertising types
1. Search engine advertisements (e.g., Google ads, Bing ads, etc.)
2. Social media advertisements (e.g., Facebook/Instagram ads, etc.)
3. Video advertisements (e.g., YouTube ads, social media videos, etc.)
4. Sponsored Product listings (on Amazon or other ecommerce sites)
5. Email marketing (e.g., promotional emails, newsletters, etc.)
Most influential online advertising types
INSIGHTS
Search engine ads — like Google ads — are the most influential type of digital advertising for all generations. Sponsored Products listings on Amazon and other ecommerce marketplaces have more influence on Baby Boomers’ purchase decisions than any other generation.
Promotional emails have more influence on Gen Z shoppers than any other generation. Gen Z and Millennials are more responsive to email marketing than other generations.
Baby Boomers are the most receptive to online advertising of any generation.

Explore more data on advertising on Amazon and other digital channels in our 2024 Advertising Report.
Market spotlight:

Founded just one year after Amazon, eBay is another ecommerce platform that continues to stand the test of time. 53% of today’s consumers shop on eBay. More than 10% shopped on eBay in Q2 2024, making it the quarter’s fourth most popular online retail site (behind Amazon, Walmart.com, and Temu).
According to our survey, the most popular products to shop for on eBay are automotive parts, toys, and games.
4% of Gen Z shopped on eBay in Q2 2024 9% of Millennials shopped on eBay in Q2 2024
18% of Gen X shopped on eBay in Q2 2024 15% of Boomers shopped on eBay in Q2 2024
How often do consumers shop on eBay? By generation

INSIGHTS
Gen Z shops eBay most frequently, with one-third of those who shop the channel doing so at least once a week.
Baby Boomers are the least likely generation to shop on eBay.
Gen X is doing the most shopping on eBay in Q2 2024.
CHAPTER 4
Methodology
Jungle Scout conducted an anonymous survey between May 31, 2024, and June 2, 2024, among 1,000 U.S. consumers about their buying preferences and behaviors. Respondents represented 50 U.S. states, all genders, and ages 18 to 75+, as well as various employment types and income levels.
Some of the analysis in the report compares responses from this survey to previous consumer trends surveys conducted by Jungle Scout, where data has been collected on a quarterly basis since June 2020. While Gen Z typically refers to people born between 1997 and 2012, report data references a subset aged 18+.
About the Report
Using the data
We invite you to explore Jungle Scout’s Q2 2024 Consumer Trends Report, and to share, reference, and publish the findings with attribution to “Jungle Scout” and a link to this page
For more information, specific data requests or media assets, or to reach the report’s authors, please contact us at press@junglescout.com
Jungle Scout: Leading Amazon Market Intelligence Tools
Over the past decade, Jungle Scout has gathered a wealth of data points through continuous monitoring and analysis of Amazon. The tools used to build this report are the same ones that 1 million+ sellers, enterprise brands, retailers, and agencies use each day to make confident decisions and develop effective strategies on Amazon. See how our tools can help your business grow by signing up or requesting a demo.
FOR FIRST-TIME AND ESTABLISHED SELLERS
Jungle Scout
Jungle Scout is the leading platform for Amazon sellers, supporting more than $50 billion in annual Amazon revenue.
Founded in 2015 as the first Amazon product research tool, Jungle Scout today features a full suite of best-in-class business management and market intelligence solutions to help sellers:
• Find and track winning products
• Discover high-value keywords
• Source suppliers for products
• Create and optimize product listings
• Jumpstart their business with exclusive tutorials
Jungle Scout Cobalt
Jungle Scout Cobalt empowers brands and retailers with a powerful suite of ecommerce tools designed to drive growth on Amazon. Comprehensive data analytics, built-in advertising automation, and intuitive visualizations turn insights into action. Cobalt is trusted by brands and retailers worldwide to:
• Track and grow market share
• Analyze performance data
• Gauge market trends and competitor performance
• Optimize ad campaigns
• Gauge share of voice and discover keyword trends
Jungle Scout Data Cloud
Jungle Scout Data Cloud offers scalability and flexibility by providing retailers a way to get Jungle Scout’s industry-leading data, with the ability to analyze and visualize that data using the tools of their choice. It provides a comprehensive view of Amazon market dynamics by allowing retailers to:
• Access millions of data points
• Extract insights using tools like Snowflake, Azure, and others
• Create custom visualizations with PowerBI, Tableau, and similar tools
• Analyze trends in consumer demand
• Investigate third-party sellers
Sign up today Book a demo Try Data Cloud with Snowflake
FOR BRANDS, RETAILERS, AND AGENCIES
FOR BIG BOX RETAILERS AND INVESTORS
Demographic data
Non-binary
Other/prefer not to say
18-26 (Gen Z,* born 2004-2012)
27-42 (Millennials, born 1981-1996)
43-58 (Gen X, born 1965-1980)
59-77 (Baby Boomers, norn 1955-1964)
78+
*While Gen Z typically refers to people born between 1997 and 2012, report data references a subset aged 18+ were included in this survey.
Housing
Homeowners (total)
I own my own home
I own more than one home
Renters (total)
I rent my home
I live with family/friends and do not pay rent
I live with family/friends and pay rent
Employment status
Employed (total)
Employed (full-time or part-time) and leaving my home for work
Employed (full-time or part-time) and currently working at home
Unemployed (total)
Unemployed (looking for work)
Unemployed (not looking for work)
Household income
Less than $25,000
$25,000 to $34,999
$35,000 to $49,999
$50,000 to $74,999
$75,000 to $99,999
$100,000 to $124,999 $125,000