


Prime Day discounts came earlier this year.
Across 13 Amazon categories, just 5 experienced their lowest average sale prices during Prime Day, while a majority saw the lowest prices in the days leading up to the event. This differs greatly from last year’s Prime Day, where all 13 categories had their lowest prices on the last day of the sale.
When Amazon expands sales events, pricing trends shift accordingly.
In 2023, the biggest deals of its weeklong Black Friday and Cyber Monday event generally occurred on the day before each retail holiday, with discounts averaging 13% off on the day before Black Friday and on the day before Cyber Monday, compared to 5% and 3% on the actual holidays, respectively.

Discounts are growing for Amazon’s fall Prime event.
In 2023, the Big Deal Days event experienced bigger discounts – in some cases, doubling from the previous year. The Appliances category saw an average price drop of 20%, up from 10% in 2022, while Beauty & Personal Care saw a 15% reduction, up from 7% the previous year.

Retail sales events — Amazon’s Prime Days, Black Friday, and Cyber Monday, more than all others — are periods that can shape the overall annual performance of thousands of brands, retailers, and sellers on Amazon. With the number of paid Prime members estimated to be nearing 200 million in 2024, these periods offer tremendous opportunities for brands, sellers, and retailers that navigate them successfully.
When brands run deals during major sales events, Amazon pushes those products onto deal pages filled with new and bargain-hungry customers, setting the stage for exponentially increased sales.
The knock-on effects of those sales can be especially lucrative: As a product’s visibility increases, its Best Sellers Rank also trends upward, resulting in improved brand awareness and organic keyword rankings. What’s more, traffic and sales on Amazon are typically higher than average in the days before and after each of these events.
The pricing strategies implemented by successful brands during these events — and the resultant sales spikes — demonstrate proven tactics that others can deploy for future Amazon sales events, including Prime Day, the fall deals event, and the holiday shopping season.
Based on an analysis of millions of data points collected from Jungle Scout Cobalt, this report provides an overview of trends and insights from these periods that can inform winning strategies and serve as an essential tool for Amazon brands and sellers looking to seize these opportunities to drive and sustain growth.

CHAPTER 1
Prime Day 2024 was shattering records even before it began. According to Amazon, a recordbreaking number of people signed up for Prime in the weeks before the event. The company called this year’s sale “biggest Prime Day shopping event ever, with record sales and more items sold during the two-day event than any previous Prime Day event,” though it has yet to release exact sales figures.
By the end of Prime Day, shoppers had scooped up more than 200 million items and saved billions of dollars in discounts. Deals spanned more than 35 categories, from exercise equipment to toys to beauty products.
This chapter explores the magnitude of the 2024 event and provides insights into some of the most successful brands and best-selling products.
Amazon’s first Prime Day was held July 15, 2015. Created to celebrate Amazon’s 20th anniversary, the initial one-day event offered exclusive deals to Amazon Prime members. It has since become an annual event, growing in scale and significance each year.

Amazon hosts its first-ever Prime Day event
Amazon expands the event to 36 hours; SMBs exceed $1.5B in sales
Prime Day runs for 48 hours for the first time
COVID-19 spreads globally, creating a surge in online shopping and a particularly successful, but delayed Amazon Prime Day event, and thirdparty sellers exceed $3.5B in sales
The first day of Prime Day — July 11 — generates the single-largest sales day in Amazon’s history
Amazon introduces a fall Prime Day event for the first time
Prime Day again exceeds the previous year, with millions more shopping the event than in 2023
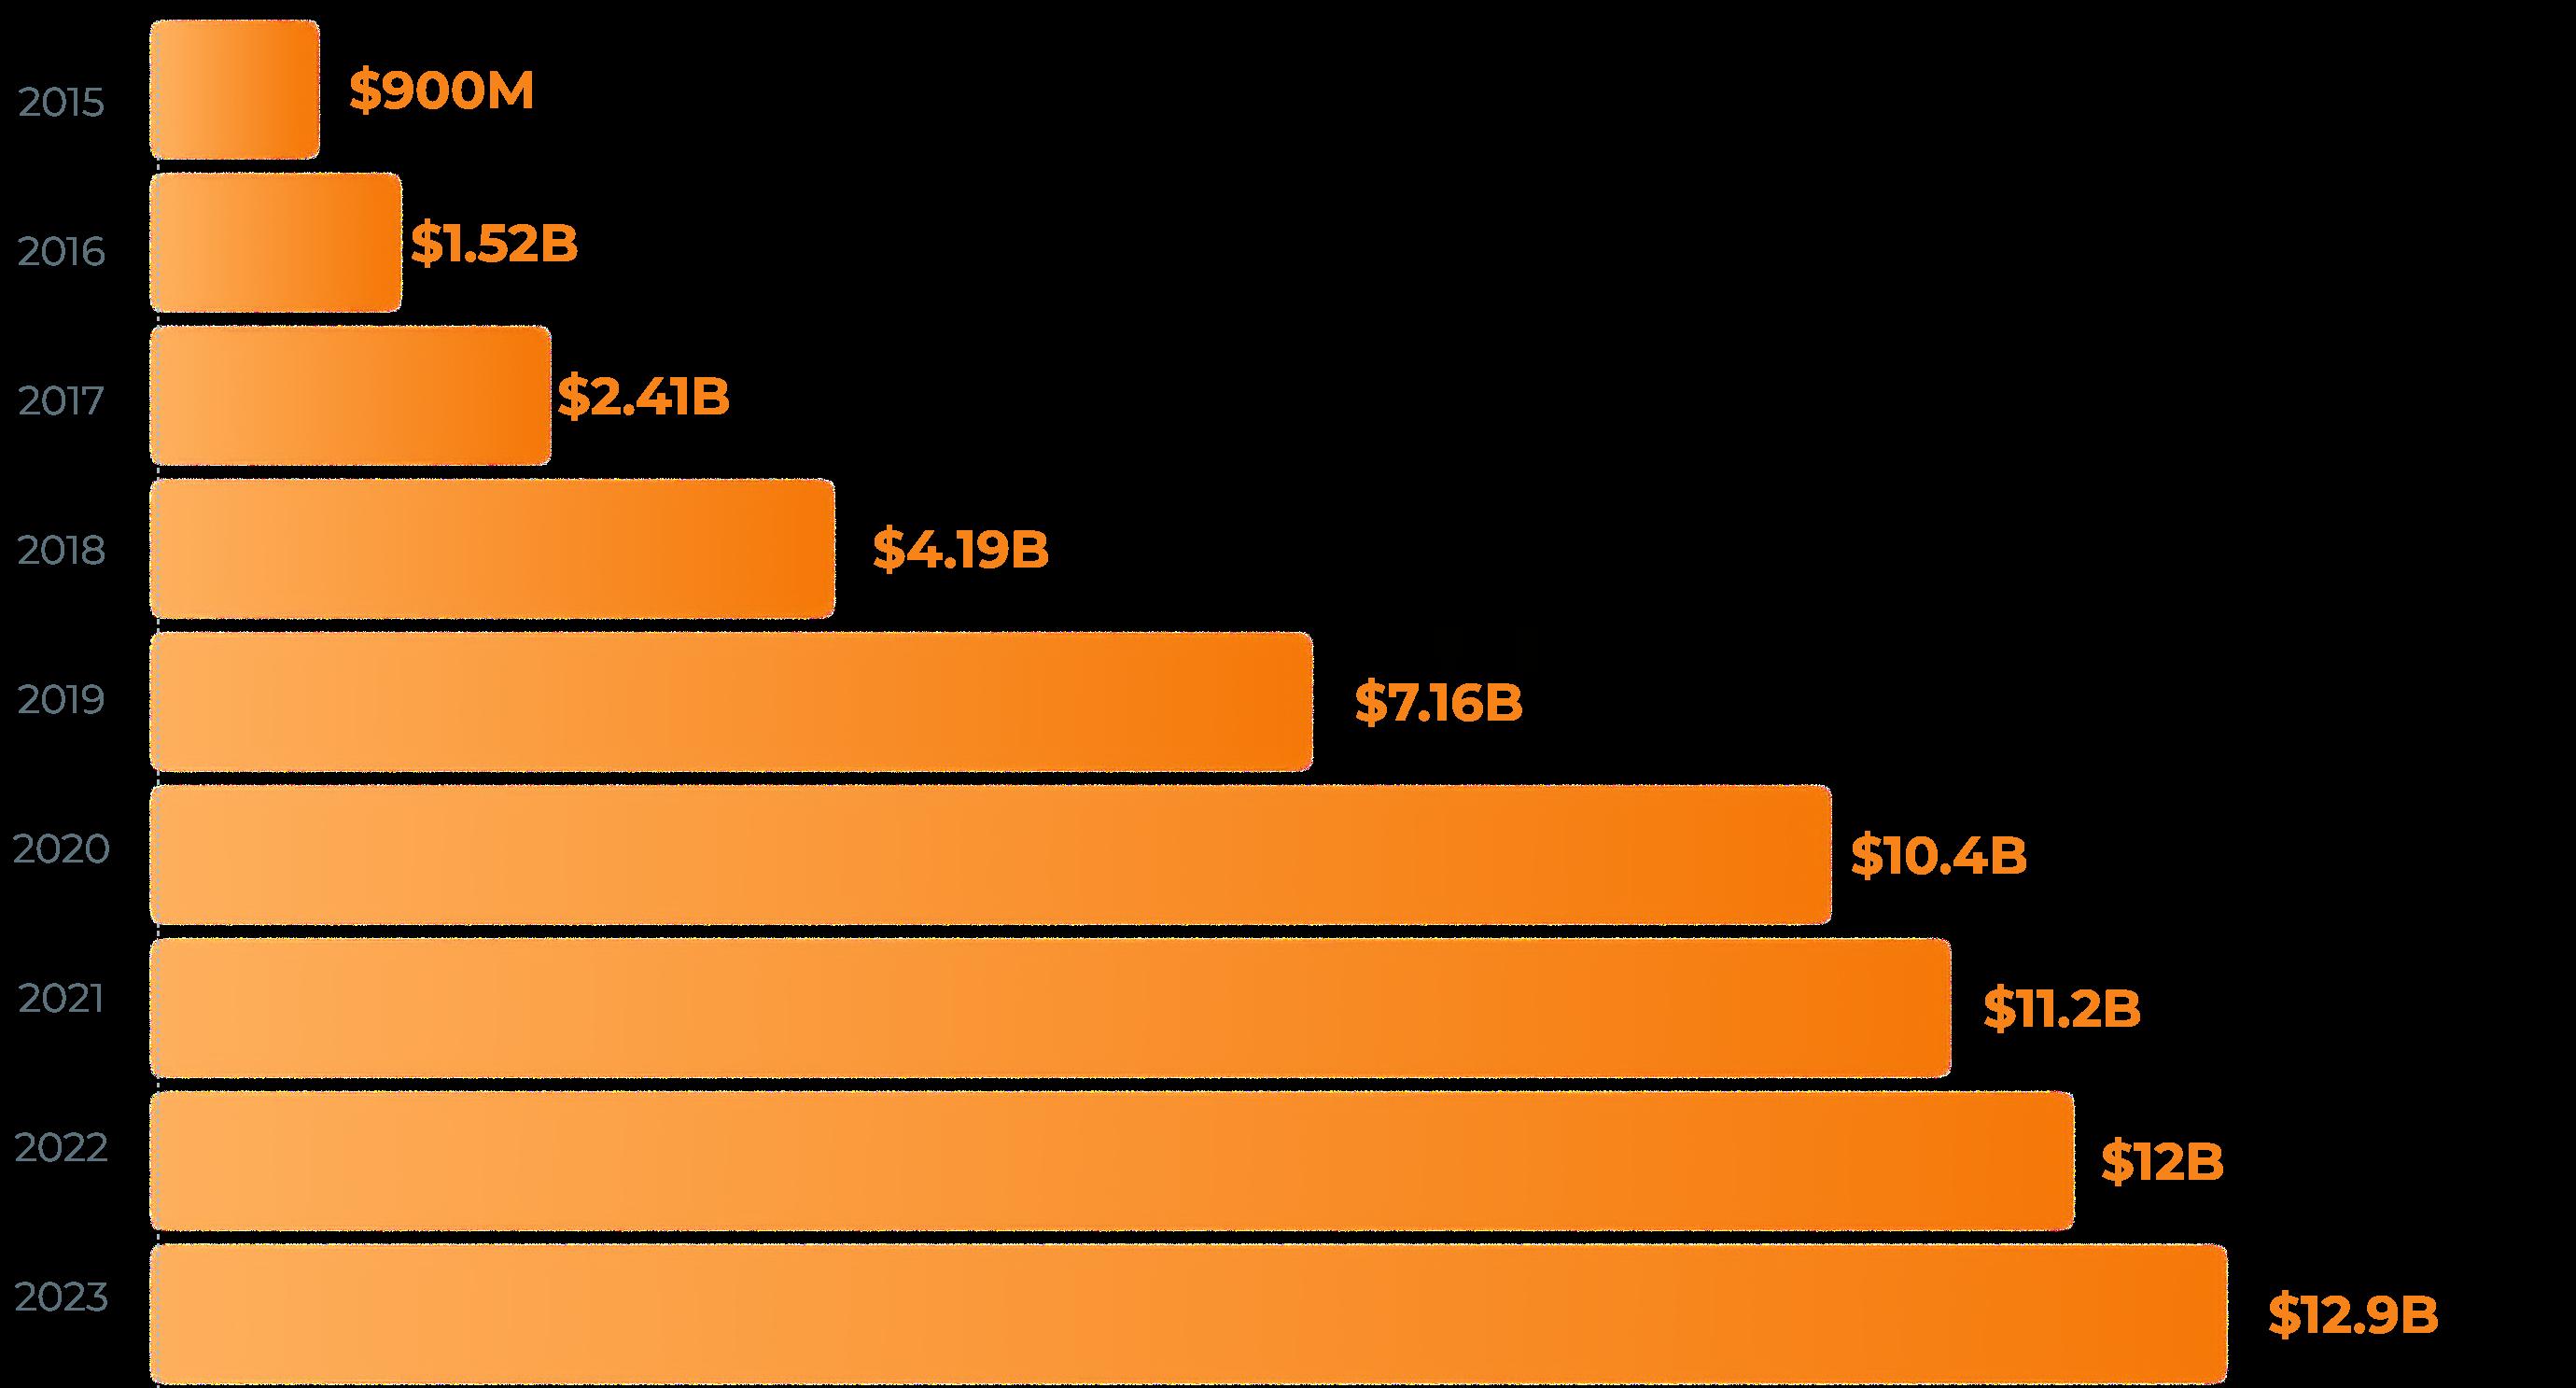
Source: Statisca.com
→ According to Amazon, Prime Day 2024 generated record sales, though the company has not released exact figures. While Amazon-specific sales remain unknown, Adobe Analytics reported that U.S. online sales across a range of online retailers reached a record $14.2 billion during the event.
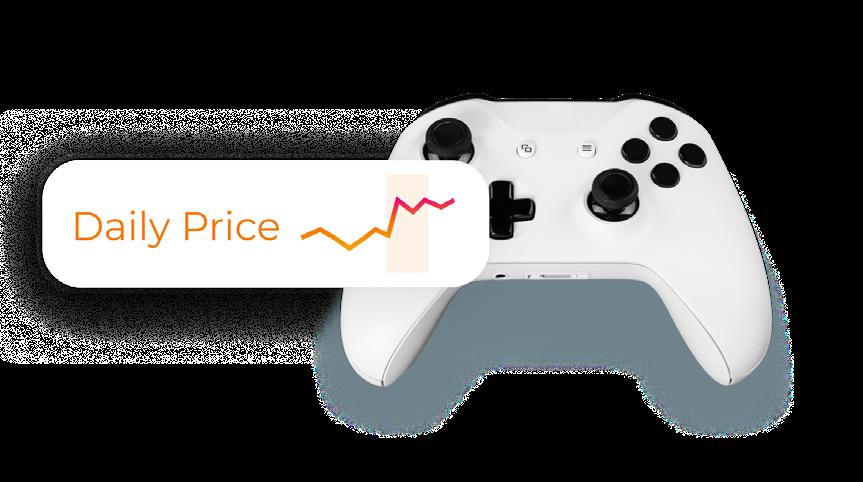
Price trends varied greatly by category during Prime Day 2024. Some categories had their lowest prices during the event, while others reached their lowest prices days before. This is no doubt due in part to Amazon’s early influencer deals. In the week leading up to Prime Day, influencers like Millie Bobby Brown, Jared McCain, and others promoted exclusive deals across social media and other channels. Among the most popular categories for these early deals were beauty, apparel, and sports – which all hit their lowest prices before the event started on July 16.

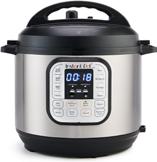
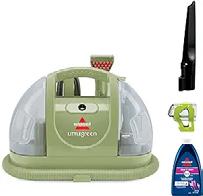
Popular kitchen brand Instant improved upon their 2023 Prime Day performance during this year’s sale. Over the two-day Prime Day event, sales grew 25% more than last year, with some of the biggest spikes coming from products discounted between 10% and 15%.
Prime Day
2023 vs 2024

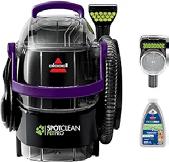
Sales jumped more than 150% on Prime Day, surpassing the brand’s 2023 performance by approximately 60%. Top-selling products saw two-day sales increases of over 200%, with price drops between 10% - 20% fueling the most growth.
Prime Day
2023 vs 2024

Sunday Riley’s Prime Day 2024 sales increase was lower than in 2023, possibly due to steeper 2023 discounts. For example, Luna Sleeping Oil had a 10% discount in 2023 but saw a 2% price rise in 2024. Sales of this product were nearly 120% higher last year.
Prime Day
2023 vs 2024


CHAPTER 2
This chapter provides a historical overview of past Prime Days, Black Friday, and Cyber Monday -- alongside category and product-level insights -- to reveal trends and pricing strategies across 13 popular Amazon categories.
Analysis of the average price in each category over the periods surrounding key selling events identifies trends that can help inform future pricing strategies. The most overarching takeaway from our analysis is that these trends vary by category and event. For example, over the seven-day period surrounding Prime Day in 2023, nearly every category in our analysis experienced its lowest
average price on July 11 or July 12 (the dates of the event itself); this was not the case in the year prior when the average product price was lower in the days preceding Prime Day for more than half of those same categories.
Product-level pricing data around these events support that variance with additional insight. In 2023, an analysis of Jungle Scout pricing data for 150 best-selling Amazon products over the three-year period between September 2021 and September 2023 found that prices for products in the Electronics and Toys & Games categories were generally at their lowest during Amazon’s summer Prime Day sale compared to other sales events. For Beauty & Personal Care products, the lowest prices typically occurred around Black Friday.
As a snapshot of the type of insights that can be gleaned from exploring this data at a product level, this chapter examines the daily prices of a selection of five of this year’s best-selling products on Amazon across five different categories.
Crocs Unisex-Adult Classic Clogs
Category: Clothing, Shoes & Jewelry
Best Sellers Rank: #1 in Clothing, Shoes & Jewelry
Mueller Pro-Series 10-in-1, Vegetable Slicer
Category: Kitchen & Dining
Best Sellers Rank: #39 in Kitchen & Dining, #1 in Egg Slicers
Best Seller rankings as of July 10, 2024

Purina Fancy Feast Wet Cat Food Variety Pack
Category: Pet Supplies
Best Sellers Rank: #74 in Pet Supplies, #6 in Canned Cat Food

Redtwo 5100 Clay Beads Bracelet Making Kit
Category: Arts, Crafts & Sewing
Best Sellers Rank: #36 Best Seller in Arts, Crafts & Sewing, #2 Best Seller in Beads & Bead Assortments
Banana Boat Sport Ultra Sunscreen Stick
Category: Beauty & Personal Care
Best Sellers Rank: #3,936 in Beauty & Personal Care, #107 in Sunscreens


Each of Amazon’s summer Prime Day events typically surpasses prior years in terms of scale, and 2023 was no exception. Prior to the 2024 sale, 2023’s event was Amazon’s most successful Prime Day, leading to the highest sales for any single day up to that point in the company’s history. More than 375 million items were sold worldwide during the two-day event.
Pricing data for the period surrounding Amazon’s 2023 Prime Day shows the average product price in every category of our analysis was the lowest of the period on the second day of the event, July 12. On the first day, average prices were still consistently lower compared to the rest of the period.
Arts, Crafts & Sewing Automotive
Baby Products
Beauty & Personal Care
Clothing, Shoes & Jewelry
Electronics
Grocery & Gourmet Food
Health & Household
Sports & Outdoors
Tools & Home Improvement
Toys & Games
Games
→
In 2023, the Appliances category saw the biggest decrease — 35% — in average product price (compared to the highest average product price in the period) during the Prime Day event. The average decrease across the 12 other categories on July 12 was $2.56, or 5%.
The days on which these same categories experienced their lowest average product prices around Amazon’s 2022 Prime Day event were considerably less concentrated. In six categories, the lowest average product price occurred days before the July 12 through July 13 event.
Daily average product prices by category, 2022
Clothing, Shoes & Jewelry
Electronics
→ During the 2022 Prime Day event, average product prices for these 13 categories averaged about 3% lower than the highest of the period. Products in the Beauty & Personal Care, Clothing, Shoes & Jewelry and Electronics experienced the biggest discounts, with their average product prices 13%, 6%, and 5% lower on July 13 compared to the rest of the week-long period.
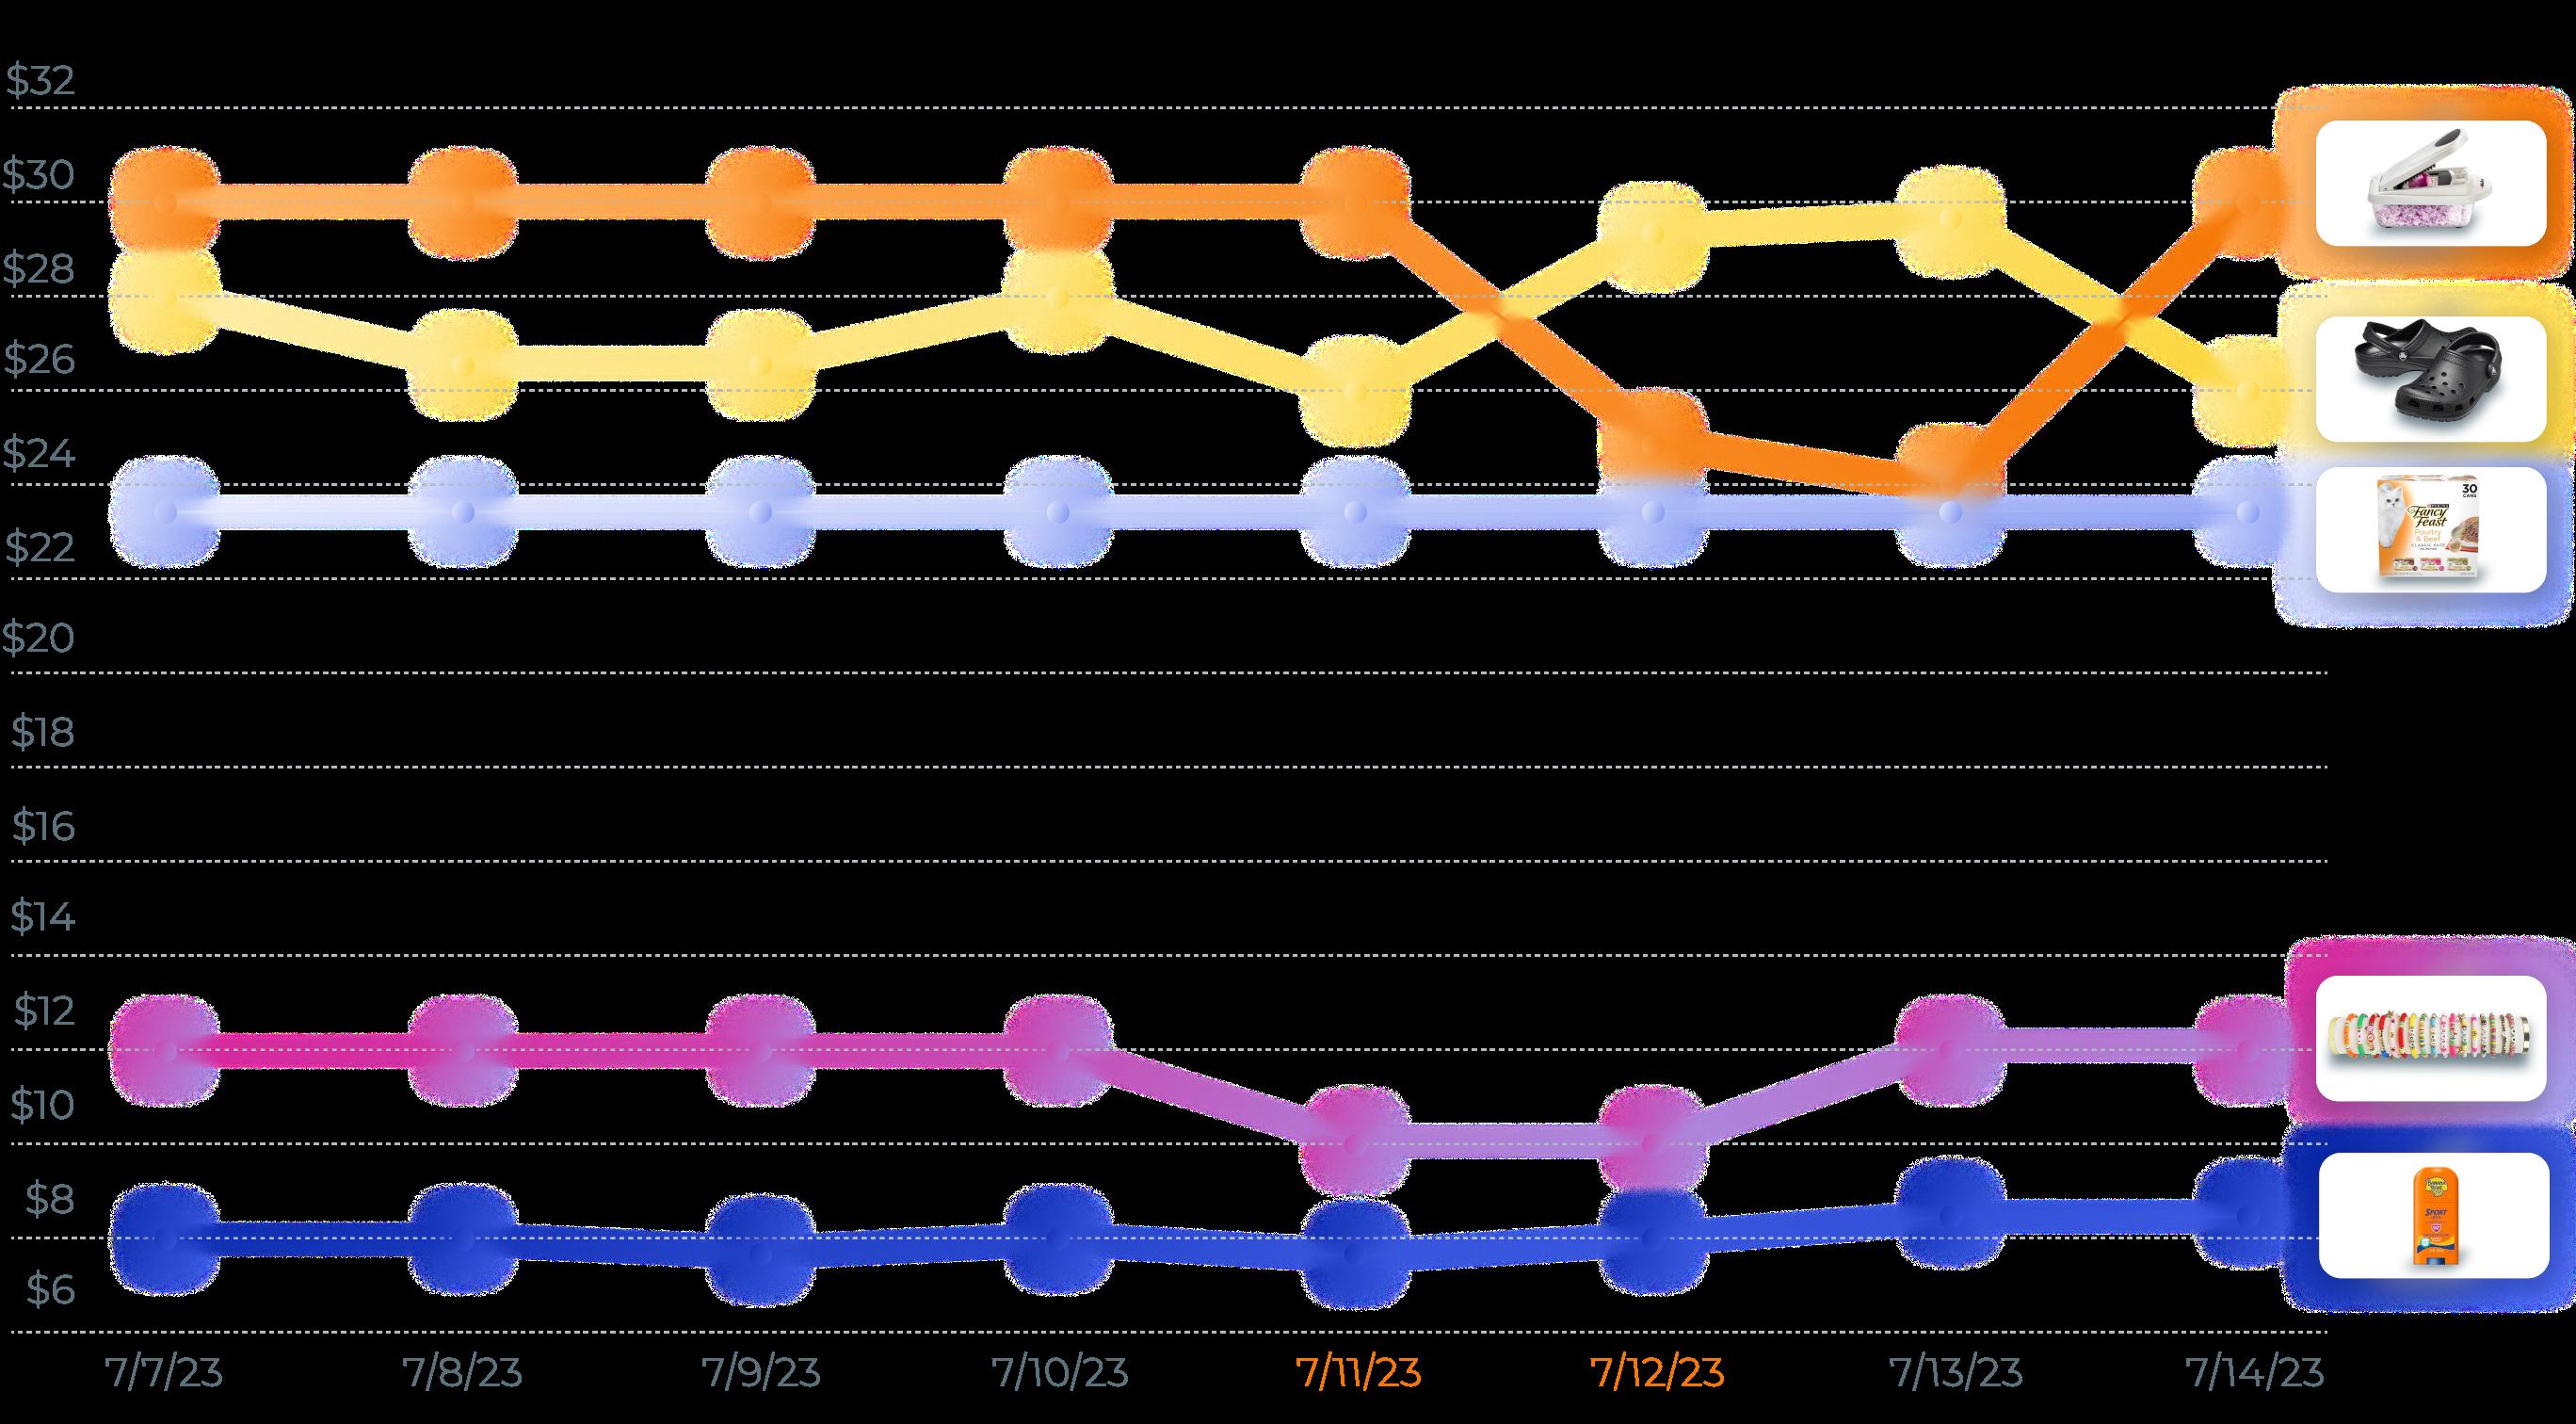
Pricing data from the seven-day period surrounding Prime Day in 2023 shows that among these five best-selling products, all but Purina’s cat food offered some sort of deal on at least one day of the two-day event.

Data from Jungle Scout Cobalt shows how a successful sales event one year can set the stage for even more success the following year. For skincare and cosmetics brand Laneige, sales were 177% higher during Prime Day 2023 compared to 2022.

Bioderma had sales growth during both Prime Day 2022 and Prime Day 2023, with sales growing nearly 40% more in 2023. In both years, the average sale price across Bioderma’s catalog fell 10% during the twoday event, with some individual products experiencing price drops as high as 30%.

Cookware brand Caraway was one of Prime Day 2023’s most successful small businesses, boosting sales by as much as 200% for some products. Compared to 2022, Caraway’s sales were more than 500% higher during the event.

During Amazon’s most recent fall Prime Day event — named “Big Deal Days” in 2023 — best-selling categories included apparel, beauty, home, and toys. The company reported the Oct. 10 through Oct. 11 event as its largest fall sales event ever, surpassing the success of the October 2022 “Early Access” sale. The average order size for this event was lower compared to Amazon’s summer Prime Day event but higher compared to the 2022 fall sale event.*
*Source: Numerator.com
Average order size: Summer vs. fall sales
2023 fall sales events
$53
$50 in 2022
2023 summer sales events (Prime Day)
$59
$61 in 2022
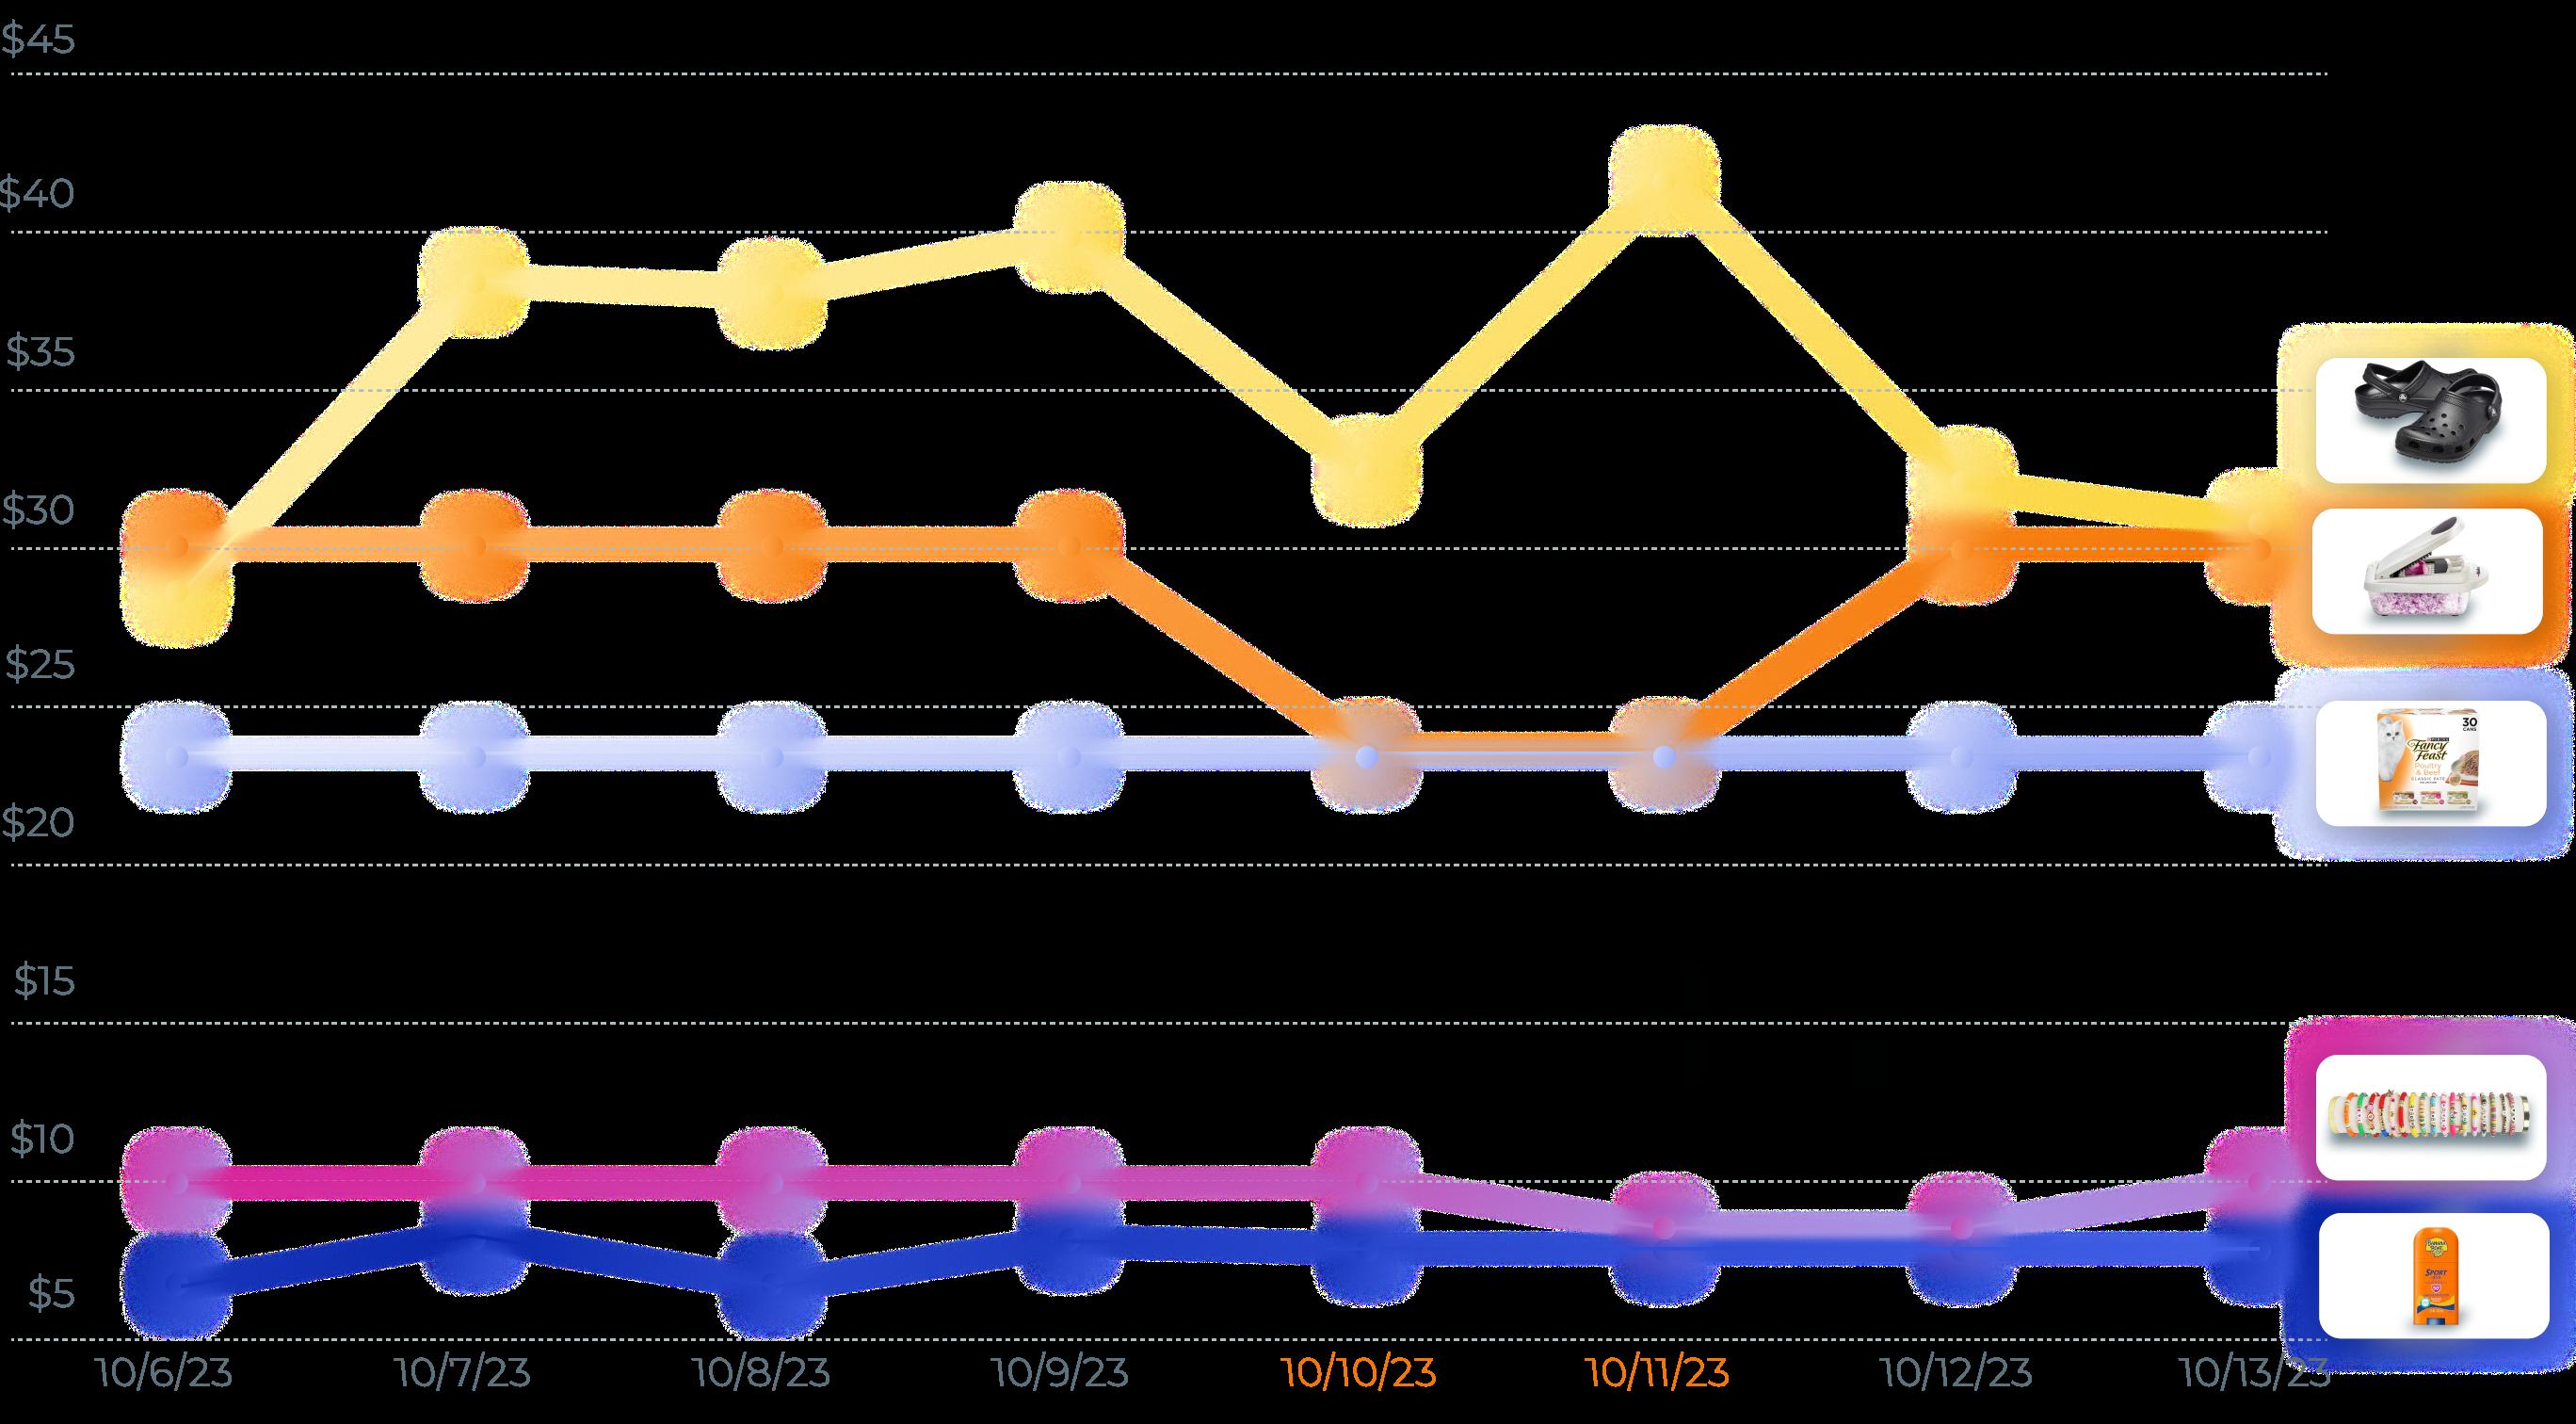
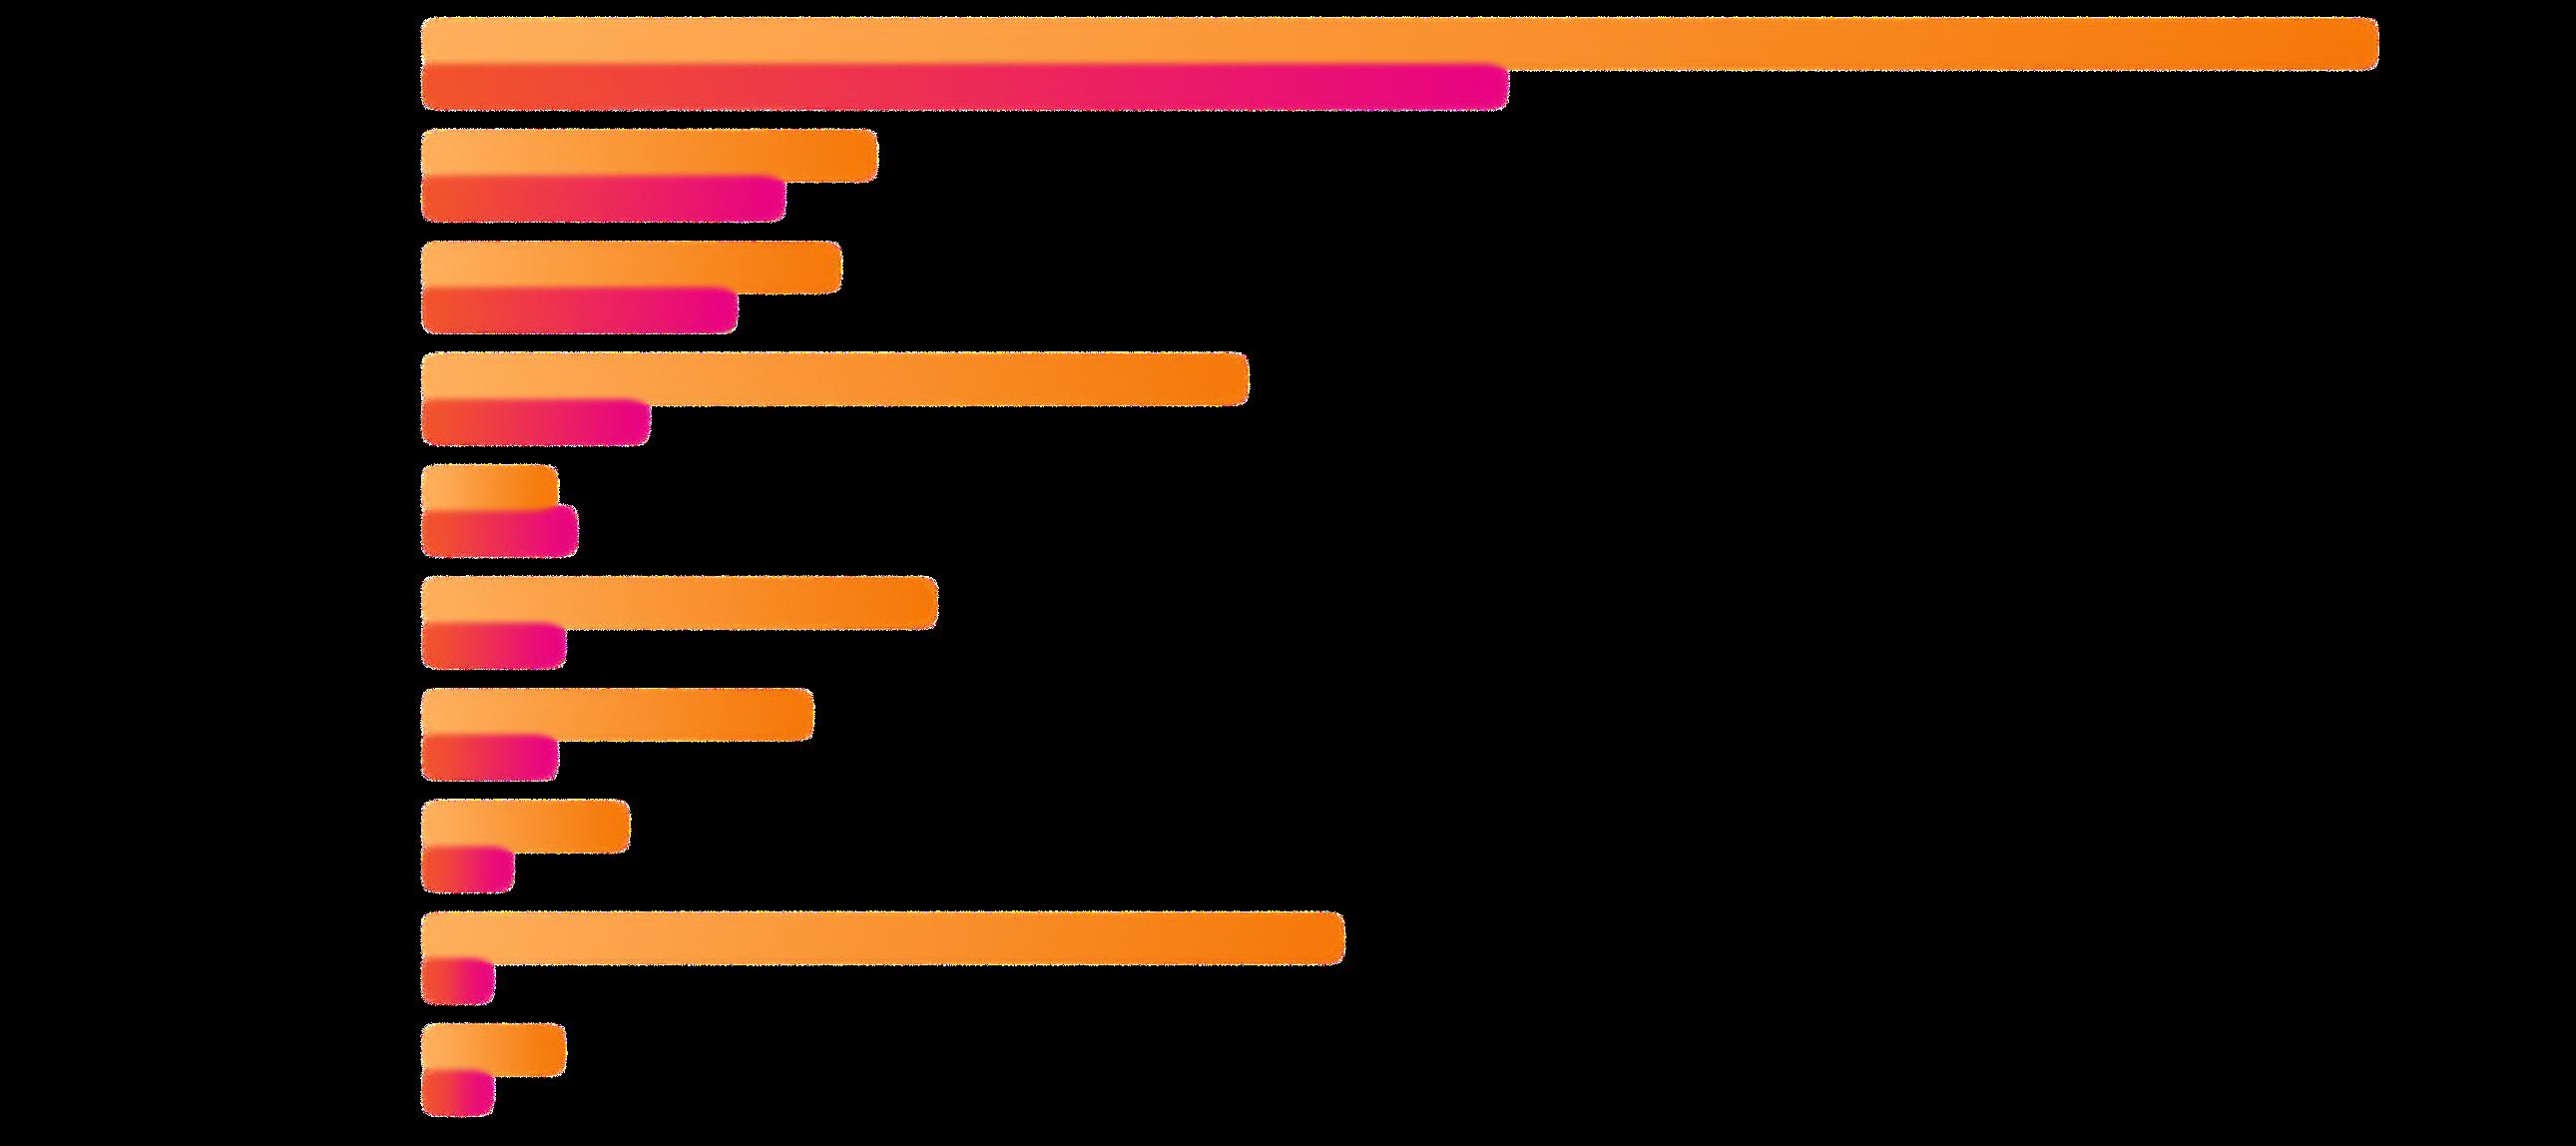
During the seven-day period surrounding Amazon’s Big Deal Days in 2023, each of the categories in our analysis experienced the lowest average product price during the event itself. The second day, Oct. 11, saw the lowest average prices of the two-day event. The Appliances category appears to have experienced the biggest discounts, with the average product price falling to $445.15 on Oct. 10, compared to $655.56 two days after the event.
In 2022, more categories experienced lower average product prices on the second day of Amazon’s Early Access sales event compared to the first. Throughout the weeklong period surrounding the event, some categories had lower average product prices in the days before and on the day after, but nearly all of them rebounded higher by Oct. 14, two days after the event.
Several of these products experienced price drops on at least one of the two days in Amazon’s Big Deal Days event in 2023. The price of the Crocs was lowest on Oct. 10, the Redtwo bracelet-making kit on Oct. 11, and Mueller’s vegetable slicer was more than $5 lower than its typical price on both days. The Purina Fancy Feast Wet Cat Food was the most consistently priced throughout the week, showing no impact from the event.

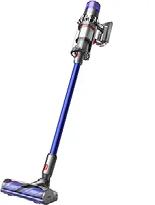
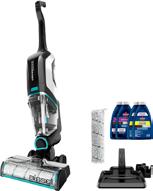
During the 2022 fall Prime event, the price of several Dyson products rose, leading to stalled sales as shoppers hunted for deals. In 2023, discounts of 10%+ helped to fuel overall sales growth of almost 40% over the course of the two-day Big Deal Days event.
Performance: 2022 vs 2023

Although an average price increase generated revenue growth for Bissell during the 2022 fall Prime event, sales grew just 1%. In 2023, however, sales were up almost 40% as the price of several products dropped more than 20%.
Performance: 2022 vs 2023

In 2023, KitchenAid generated sales boosts with a range of discounts. One of the most remarkable is the Mini Plus Tilt-Head Stand Mixer, for which a 20% discount fueled a four-figure sales jump during the event.
Prime
Performance: 2022 vs 2023


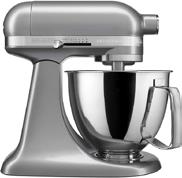
Data reflects the two-day fall Prime deals event compared to the previous two days. The 2022 event took place October 11-12. The 2023 event took place October 10-11.
In 2023, Amazon extended its Black Friday and Cyber Monday deals event to run from Nov. 17 through Nov. 27. The company said the event was its “biggest ever” when compared to the same 11-day period ending on Cyber Monday in previous years. Black Friday sales on Amazon totaled $9.3 billion, and more than 500 million items were sold.
Black Friday, Cyber Monday U.S. ecommerce revenue, 2020-2023
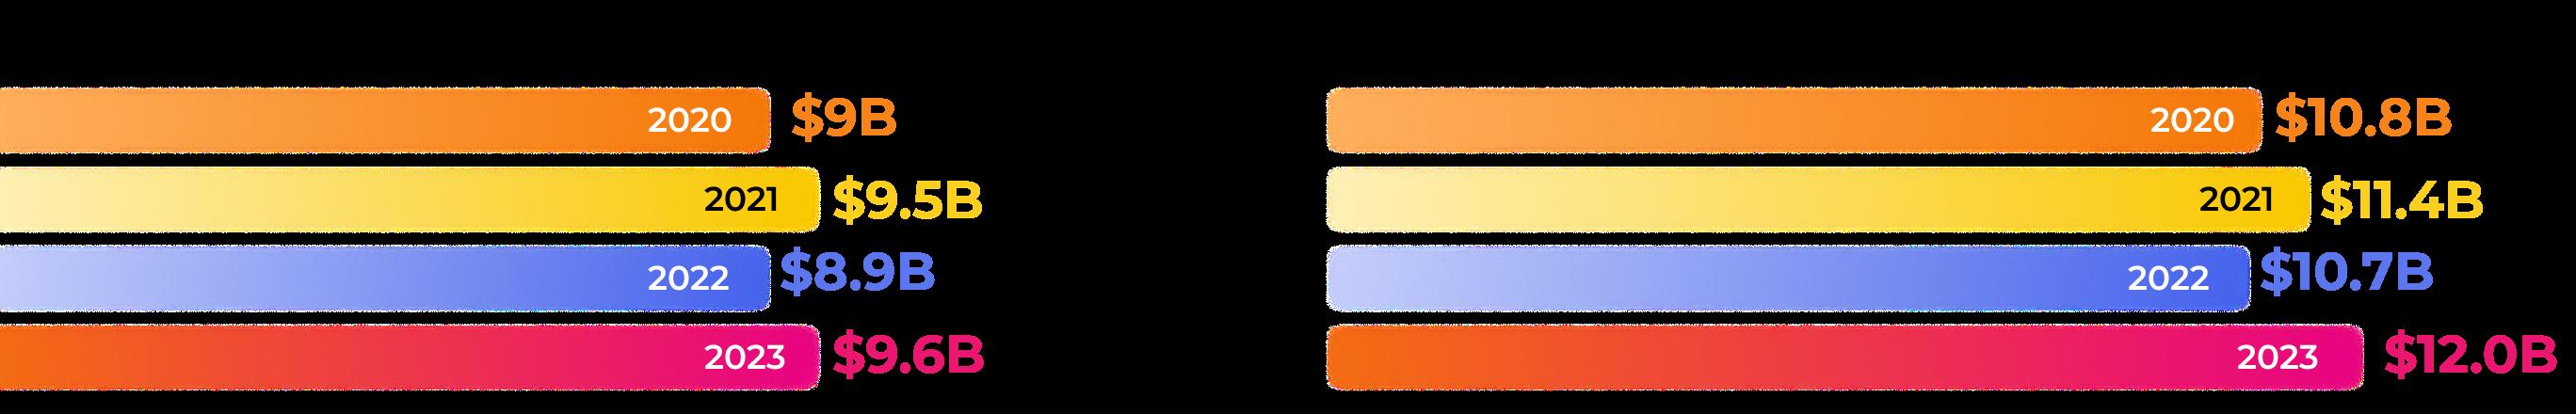
Source: Statista.com
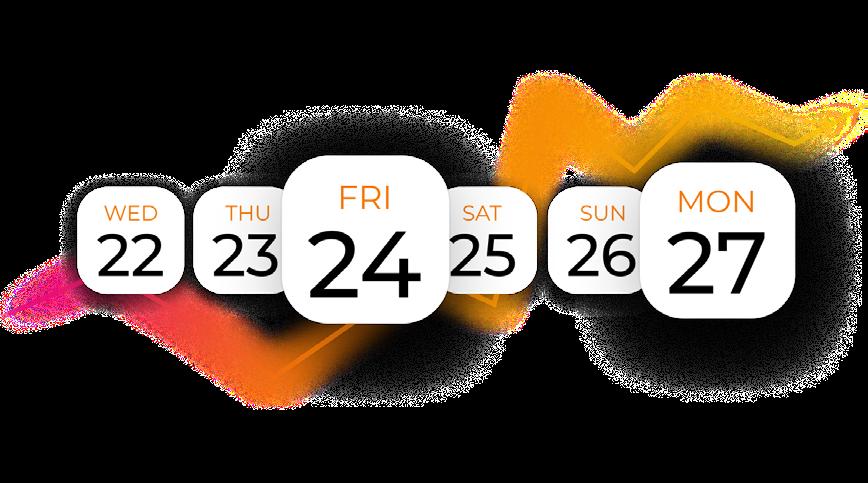
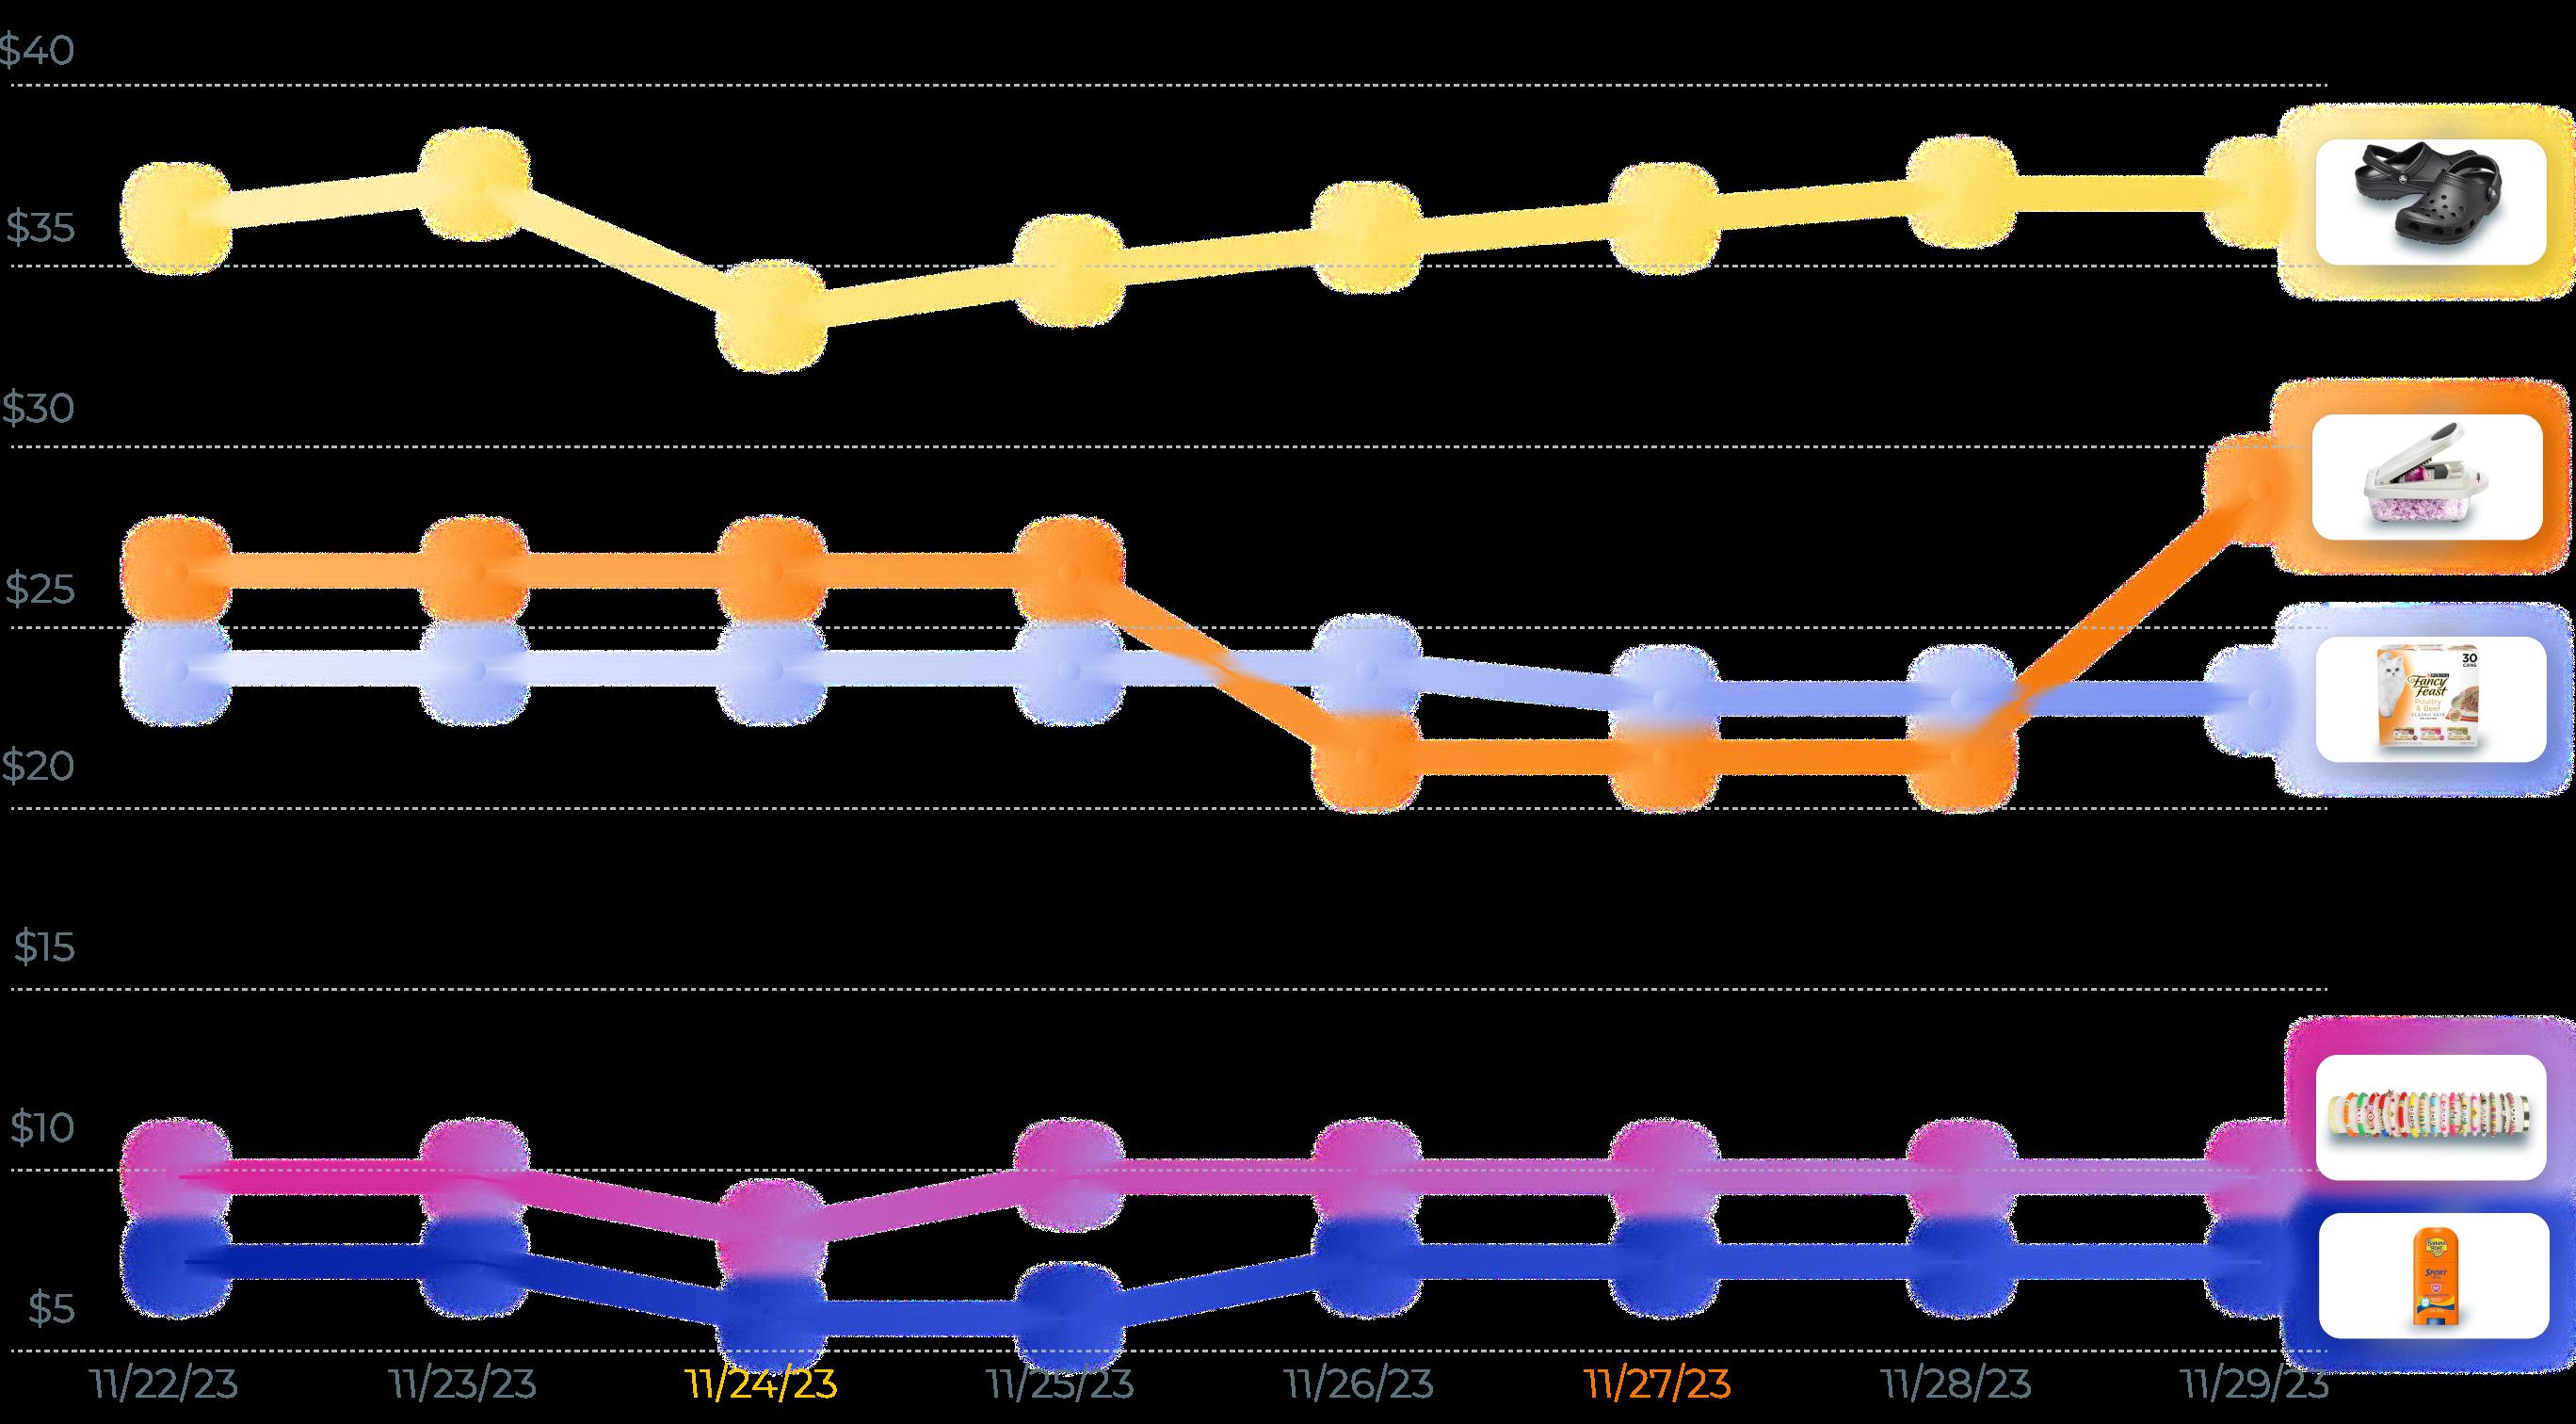
In 2023, the lowest average prices occurred one day before Black Friday and Cyber Monday themselves (on Thanksgiving, Nov. 24, and Sunday, Nov. 26), marking a deviation from the trends seen in 2022, when Black Friday appeared to have the greatest impact on lowering prices over the same one-week period. This shift is likely attributable to Amazon’s extended timeframe for the 2023 sales event, which ran deals from Nov. 17 through Nov. 29.
In 2022, the lowest average product price of the period occurred on Black Friday for seven categories: Automotive, Baby Products, Beauty & Personal Care, Electronics, Health & Household, Toys & Games, and Video Games. Among the categories in our analysis, Appliances saw the most significant price fluctuations, indicating heavy discounting during the period.
Arts, Crafts & Sewing
Automotive Baby Products
In 2023, Black Friday saw more of the products in our snapshot with their lowest prices of the period compared to Cyber Monday, with the Crocs and Banana Boat’s stick sunscreen offering the most significant discounts. The price of Purina’s cat food, which remained unchanged during both the summer and fall Prime Day events, dropped by $1.30 on Cyber Monday.
Daily product prices

YETI saw sales increase nearly 90% during the 2023 Black Friday - Cyber Monday event (compared to just 34% the previous year). Multiple of the brand’s Rambler drinkware products saw sales skyrocket by triple-digits.

During the 2022 Black Friday - Cyber Monday event, the average sale price across Lancôme’s catalog actually increased, and sales grew less than 10%. In 2023, by contrast, Lancôme’s average sale priced dropped 15% and sales grew almost 50%.

During Black Friday - Cyber Monday 2022, Tuft & Needle’s average sales price was up 2% compared to the days before the event. In 2023, however, average sale price dropped 12%, generating a near-80% sales increase.
Black Fri. - Cyber Mon.
Performance: 2022 vs 2023
Black Fri. - Cyber Mon.
Performance: 2022 vs 2023
Black Fri. - Cyber Mon.
2023 Product Trends Black Fri. - Cyber Mon.
Black Fri. - Cyber Mon.
Performance: 2022 vs 2023
2023 Product Trends Black Fri. - Cyber Mon.
2023 Product Trends


A look at the post-event performance of brands who had successful sales growth during these key 2023 selling dates shows how the right approach can carry the momentum of events like Prime Day into the days and weeks following.
An analysis of 10 brands that experienced positive sales trends during Prime Day 2023 (compared to the previous two-day period) found that all experienced increased sales in the 30 days after Prime Day (compared to the 30-day period leading up to the event). With a few exceptions, the level of Prime Day success closely correlated with the level of sales increase post-event, with Laneige experiencing the highest sales growth both during and after Prime Day.


* Compared to the two-day period prior to the event **Compared to the 30-day period prior to the event

Your competitive edge for selling on Amazon. Related industry reports
Powered by trillions of data points, Jungle Scout Cobalt is a leading Amazon market intelligence and advertising solution designed specifically for enterprise brands, retailers, and ecommerce agencies.
Cobalt features a powerful suite of tools for driving growth and profitability on Amazon:
Retail Insights brings together data from multiple Seller Central and Vendor Central accounts in unified dashboards that make it easier to track performance and make strategic decisions.
Market Intelligence places your own Amazon business data – like pricing, inventory, and ad spend – within broader market context, like market share and sales trends, so you can analyze the market and your competitors.
Ad Accelerator provides automation features that save time and resources while delivering valuable insights and recommendations for optimizing campaigns and maximizing ROI.
Digital Shelf Analytics delivers insights on share of voice, providing a detailed picture of how your products and competitors are ranking in Amazon search results.
See how Cobalt can make Amazon market research, reporting, and ad management easier for your team.
This report explores Amazon pricing trends at a macro and micro level, revealing key factors that drive price changes over time.
Explore the latest spending and shopping trends in this quarterly study of consumer priorities and the factors influencing purchase decisions online and in brick-andmortar stores.
Jungle Scout surveyed nearly 2,000 brands and businesses about their strategies for selling on Amazon in 2024. Insights on profitability, advertising investments, growth plans, and more.
CHAPTER 3
The data analyzed in this report highlights the scale of opportunities surrounding major sales events such as Prime Day, Black Friday, and Cyber Monday. To harness the full potential of these events, brands need to go beyond basic preparation and adopt strategies that both drive immediate sales and foster long-term customer loyalty.
Strategize early discounts.
Starting discounts a day or two before major events can help boost your visibility and jump-start sales by capturing early shoppers.
Some of the lowest prices during key 2023 sales were seen in the days before events. Pre-event is also often when outside search interest spikes: In 2023, “Amazon Prime Day” was the top trending Google search in the United States on the day before the event started.

Offer significant but sustainable discounts.
Balance discounts that are high enough to attract bargain-hunting buyers but still profitable and sustainable throughout the event.
Our analysis shows that discounts in the range of 10% - 20% were particularly effective, with brands like KitchenAid, YETI, and Tuft & Needle generating three- and even fourfigure sales increases by targeting this range during sales events.
Focus discounts on popular products.
Prioritize discounts on top-selling or flagship products to drive overall sales volume.
Dyson’s Ball Animal Pro Upright Vacuum and YETI’s Rambler mug – products that were among each brand’s top 10 best-selling products in 2023 prior to any major sales events – experienced 200%+ and 700%+ sales growth, respectively, during events like Prime Big Deal Days and Black Friday when offered at a discount.

Combine discounts with Subscribe & Save offers.
Nearly half of consumers seek out subscription options when shopping on Amazon.
Increase Customer Lifetime Value (CLV) by offering event or holiday deals on consumable products with the option to Subscribe & Save. For shoppers who don’t initially opt-in, use post-event emails to highlight the benefits of subscribing.

Monitor and adjust pricing during extended events.
Take advantage of extended sales periods, like Amazon’s 10-day 2023 Black Friday - Cyber Monday sale, to adjust pricing dynamically based on sales performance.
Longer sales periods allow for more strategic discounting over multiple days, leading to higher overall sales. For brands like YETI, Lancome, and Tuft & Needle, sales growth during Amazon’s 2023 extended event was more than double that during the 2022 event.


Bolster your advertising with off-Amazon campaigns.
Launch ad campaigns that direct traffic from other channels to Amazon to take advantage of increased search traffic and social chatter around sales events.
In addition to increasing the visibility of your deals and discounts, this can also help draw in new customers – 72% of all conversions generated by Google campaigns that direct to Amazon, for example, are new-to-brand customers.
Boost reviews ahead of the event.
Two-thirds of shoppers say reviews are integral to their purchase decisions on Amazon.
In the lead-up to sales events, ensure a good base of reviews and higher visibility for your discounted products through product inserts encouraging customer feedback, tools like Jungle Scout’s Review Automation, and Amazon Vine for newly launched products.
Use Augmented Reality (AR) for product visualization.
Amazon’s View in Your Room enhances the shopping experience by letting consumers see how products like furniture and decor look in their homes, making them both more likely to buy and less likely to return a product.
One-third of shoppers who have used View in Your Room say it has led them to buy something from Amazon that they would otherwise only buy in person.


Optimize product listings for voice search.
Nearly half of U.S. consumers report using voice search on their smartphones.*
To improve discoverability through voice search, make sure product listings are optimized for voice search by incorporating natural language, long-tail keywords and common phrases.
*DataReportal 2024 Global Statshot Report
Run post-event retargeting campaigns.
Build retargeting campaigns to keep the momentum going after sales events, aiming to reach customers who viewed but didn’t purchase during the event.
Using Amazon DSP, retarget these shoppers with personalized ads showcasing the products they browsed or related items.
Over the past decade, Jungle Scout has gathered a wealth of data points through continuous monitoring and analysis of Amazon. The tools used to build this report are the same ones that 1 million+ sellers, enterprise brands, retailers, and agencies use each day to make confident decisions and develop effective strategies on Amazon. See how our tools can help your business grow by signing up or requesting a demo.
Jungle Scout is the leading platform for Amazon sellers, supporting more than $50 billion in annual Amazon revenue.
Founded in 2015 as the first Amazon product research tool, Jungle Scout today features a full suite of best-in-class business management and market intelligence solutions to help sellers:
• Find and track winning products
• Discover high-value keywords
• Source suppliers for products
• Create and optimize product listings
• Jumpstart their business with exclusive tutorials
Jungle Scout Cobalt empowers brands and retailers with a powerful suite of ecommerce tools designed to drive growth on Amazon. Comprehensive data analytics, built-in advertising automation, and intuitive visualizations turn insights into action. Cobalt is trusted by brands and retailers worldwide to:
• Track and grow market share
• Analyze performance data
• Gauge market trends and competitor performance
• Optimize ad campaigns
• Gauge share of voice and discover keyword trends
Jungle Scout Data Cloud offers scalability and flexibility by providing retailers a way to get Jungle Scout’s industry-leading data, with the ability to analyze and visualize that data using the tools of their choice. It provides a comprehensive view of Amazon market dynamics by allowing retailers to:
• Access millions of data points
• Extract insights using tools like Snowflake, Azure, and others
• Create custom visualizations with PowerBI, Tableau, and similar tools
• Analyze trends in consumer demand
• Investigate third-party sellers
Sign up today Book a demo Try Data Cloud with Snowflake
Findings in this report are based on analysis of Jungle Scout data collected at the category level for a two-year time frame from July 2021 through March 2024, and at a product level from March 2023 through March 2024 in the U.S. marketplace. At the category level, it includes analysis of daily and monthly average product prices from 19 of Amazon’s product categories. At the product level, findings are based on analysis of daily pricing data for 100 best-selling products on Amazon across five popular categories: Arts, Crafts & Sewing; Pet Supplies; Beauty & Personal Care; Kitchen & Dining; and Clothing, Shoes & Jewelry
Data on best-selling brands and products was sourced from Jungle Scout Cobalt, and reflects the specified date ranges for each sales event.
We invite you to explore Jungle Scout’s Biggest Amazon Sales Events report and to share, reference, and publish the findings with attribution to “Jungle Scout” and a link to this page.
For more information, specific data requests or media assets, or to reach the report’s authors, please contact us at press@junglescout.com.