

The six rules driving success in 2025 and setting the stage for 2026.
Category-level shifts in assortment, pricing, ASPs, and seller performance.
Top brands by Innovation Score, with deep dives on La Roche-Posay, OtterBox, and Momcozy.
Chapter 4: Innovation by Region
Outbound expansion (U.S. brands going global) and inbound disruptors (international brands breaking into the U.S.).
How brands use Amazon’s ad ecosystem as an engine for validation, discovery, and iteration.
MaryRuth’s and other real-world examples of innovation in motion.
Forward-looking strategies and levers brands need to adopt for future-proof growth.
Innovation on Amazon has graduated from buzzword to operating system. The marketplace is maturing—fewer duplicate listings, tighter seller control, and faster feedback loops. Brands that treat Amazon as a realtime lab—listening to search signals, launching quickly, validating with ads, and enforcing governance—are scaling faster and more profitably than those waiting for certainty.
This report surfaces the brands that outperformed, the strategies that worked, and the market shifts reshaping how innovation is defined. We analyzed assortment dynamics, pricing strategy, ad performance, Buy Box control, 3P competition, and cross-border expansion to identify the traits that
separate category leaders from brands at risk of falling behind. First, we establish where innovation is happening at the root-category level; then we spotlight three top-performing innovators on our brand leaderboard—operators that turned signals into shelf, and shelf into share.
We also introduce The Innovation Framework—a practical way to time launches by tracking when keyword demand breaks out and how long leaders have before the copycat shakeout compresses margins. The playbook is simple: detect demand early, launch with test SKUs, validate with ads, scale winners to hero SKUs, and protect price and placement with strong channel governance.
“On Amazon, demand moves first. The brand with the shortest signal-to-shelf time wins—everyone else donates market share.”
Jay Lovelace, CEO of Jungle Scout
• Innovation is intentional, not incremental. Winners tier catalogs into core / hero / test SKUs and keep revenue per ASIN high—fewer products, bigger outcomes.
• Pricing power separates leaders from followers. Strong brands defend ASPs even as competition rises; laggards chase with discounts.
• Advertising is market validation. PPC/DSP are used to test positioning and scale only what converts—ads aren’t just growth, they’re product R&D.
• Governance is growth. Brands that protect the Buy Box and limit unauthorized sellers reap higher margins.

• Speed wins the window. When search demand spikes (e.g., ingredient or format trends), leaders convert signals into shelf within weeks, capturing outsized share before the shakeout.
• Global & data-driven expansion wins. Leaders localize pricing, content, and fulfillment and use 3P to test new regions before committing—then scale what works.
• 3P dynamics define the battleground. China-based and niche 3P entrants compress price; leaders hold share by pairing speed with governance (gating, MAP, and Buy Box stability).
Monitor theme-level keyword momentum to spot emerging demand.
Route signals into test SKUs with prebuilt packaging, content, and creative.
Use ads to confirm demand, audience fit, and price thresholds.
Promote winners to hero SKUs and localize into new marketplaces; replicate in adjacent subcategories/regions.
Enforce reseller rules, stabilize the Buy Box, and protect pricing power.
Kill fast when Revenue/ASIN underperforms; reinvest in the next signal.
• Start at the category baseline to see where shopper demand and pricing power are shifting.
• Jump to the brand leaderboard to study the three top innovators turning signals into share.
• Apply the Innovation Framework to your roadmap: measure time from search spike → first availability → unit inflection; act before the shakeout window closes.
• Adopt the rules: assortment tiering, pricing resilience, ad-led validation, operational speed, regional agility, and brand governance.
The brands winning on Amazon don’t just launch more—they learn faster, scale what works, and maintain control. Shorten your signal-to-shelf time and protect the Buy Box, and you won’t have to outspend competitors—you’ll outrun them.
The definition of innovation has evolved alongside Amazon itself. The game is sharper, faster, and more unforgiving. While social media drives demand and fuels moments of virality, true innovation happens behind the scenes—where brands continuously analyze competitors, refresh their assortments, and optimize for profitability and relevance.
A core driver of this evolution is assortment innovation and tiering. Leading brands now structure their catalogs into core, hero, and test SKUs—using Amazon as a lowrisk proving ground for niche, trend-driven products. This disciplined approach allows them to double down on winners while quickly phasing out underperformers, ensuring resources are directed toward high-conversion opportunities.
In 2025, innovation requires more than launching new products. It demands continuous iteration, data-led decision-making, and a strategic approach to assortment, pricing, and advertising. For top performers, Amazon is no longer just a sales channel—it’s a proving ground for testing ideas, capturing market signals, and driving profitable growth at speed and scale.
The six rules that follow form the nonnegotiable foundation for marketplace success today—and they set the stage for the next phase of competitive advantage.
In Chapter 7, we’ll show how each rule evolves into a forward-looking lever for 2026, layering in hybrid channel strategies, AI-driven execution, and real-time decision-making to future-proof growth in an even faster, more competitive Amazon landscape.
CHAPTER 1: THE NEW RULES OF INNOVATION
Structure your catalog into core, hero, and test SKUs.
• Use Amazon as a low-risk proving ground for niche, trend-driven products.
• Double down on winners and quickly phase out underperformers.
Capture and analyze keyword demand trends to guide new variants, seasonal SKUs, and bundles—feeding a constant pipeline of datavalidated product ideas.
Benchmark against competitors—especially China-based sellers.
• Enforce MAP and adapt to CPC swings, tariffs, and inflation.
Maintain margins by balancing competitive pricing with perceived value.
Accelerate launch-to-learn cycles through modular packaging and prebuilt creative assets.
• Build nimble supply chains.
• Stay first-to-market and pivot quickly when consumer signals shift.
Localize pricing, listings, and fulfillment for new regions.
• Use 3P channels to test-market.
• Monitor weekly for category shifts, NTB growth, and encroachment to proactively defend and expand share.
Leverage PPC, DSP, and AMC data to test demand, positioning, and audience overlap before scaling.
• Treat ad spend as a strategic engine for insight, not just acquisition.
• Use search term and ad performance data to validate demand signals surfaced in your assortment planning (Rule 1).
Enforce strict reseller agreements.
• Use Brand Gating and IP protections.
• Monitor for unauthorized sellers and pricing violations.
Innovation on Amazon is execution-first.
Success depends on pricing control, channel compliance, and the ability to quickly test and scale products—not just ideation.

Advertising drives product validation. Control creates competitive edge.
Leading brands use ad data to surface demand signals, guide assortment decisions, and accelerate speed-to-market.
Brands that align content, pricing, and fulfillment outperform those disrupted by unauthorized sellers or fragmented strategy.
This report will explore innovation strategies and case studies that demonstrate how brands are reclaiming market share on Amazon by:
• Using product launches as agile test-and-learn cycles to validate demand, refine pricing, and scale only what converts.
• Rebalancing their assortment mix with a datadriven blend of core, hero, and test products designed to capture both volume and emerging niche demand.
• Turning advertising into a diagnostic tool—not just a growth lever—by analyzing NTB rates, repeat purchase trends, and ad efficiency to guide innovation.
• Regaining control of the digital shelf by aligning content, fulfillment, and pricing strategy to win the Buy Box and suppress disruptive 3P interference.
• Adapting faster than the competition by closely monitoring market signals, consumer trends, and competitive gaps to fuel real-time innovation and rapid iteration.
Innovation doesn’t happen in a vacuum—it plays out differently across every category on Amazon. In this chapter, we break down how brands are adapting their strategies based on the unique dynamics of each vertical.
From consumer electronics to household goods, we analyzed shifts in assortment mix, pricing strategy and revenue trends. This section surfaces which categories are showing strong innovation signals.

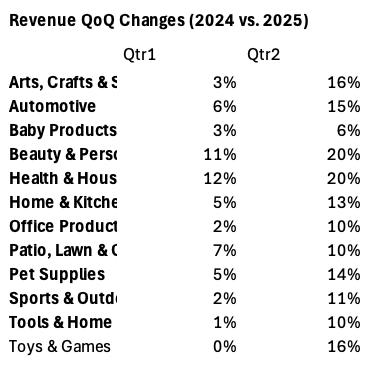

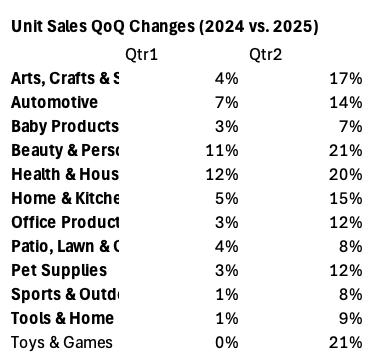
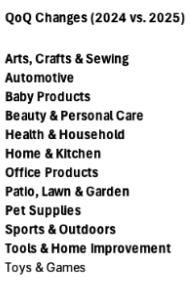
Strongest Revenue Growth Categories (Q2 2025)
• Beauty & Personal Care → +20% revenue, +21% units. Growth across both dollars and units, indicating shoppers are trading up without ASP compression.
• Health & Household → +20% revenue, +20% units. Balanced growth, highlighting category resilience.
• Home & Kitchen → +13% revenue, +15% units. A large, steady-growth category with consistent expansion.
• Arts, Crafts & Sewing → +16% revenue, +17% units. Solid mid-tier growth across dollars and units.
• Pet Supplies → +14% revenue, +12% units. Healthy gains, with consistent growth in both volume and dollars.
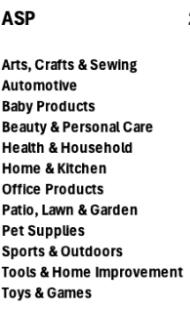


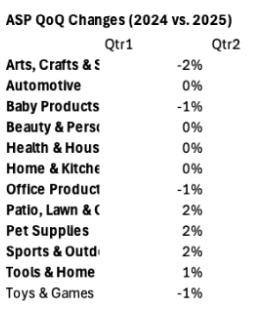
ASP Movement (Pricing Power)
• Premium resilience: Pricing strength is concentrated in categories like Patio, Lawn & Garden (+2 % QoQ) and Sports & Outdoors (+3%), which are expanding ASPs even as discretionary segments like Toys & Games (-4%) face compression. This signals that premium, durable-goods categories are driving Amazon’s pricing power, while more competitive, trend-driven categories are absorbing margin pressure.
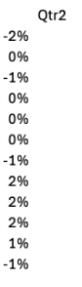
1P vs 3P Seller Dynamics (Margin Pressure vs Flexibility)
Office Products: 3P revenue share surged to ~70%+ in 2025 while ASPs held at affordable levels ($20–22), showing that marketplace sellers are winning share by competing on accessibility and value, not just discounting.
• Tools & Home Improvement: The 3P share rose to ~77–79% as ASPs remained steady around $31, indicating that sellers are using price flexibility—not just low prices—to capture revenue share. This adaptability is becoming a key innovation lever in mid-ticket, competitive categories.
• Home & Kitchen: ASPs are essentially flat (~$30) with only +5% unit growth in Q2. With 3P share at 76%, competition is intensifying, pointing to tightening margins and price-based battles.
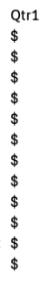
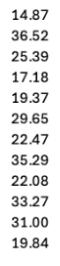
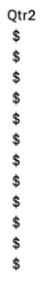
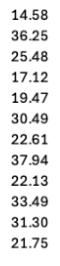
• Beauty & Personal Care: ASPs remain steady at ~$17, with 3P sellers still commanding the majority of category revenue (mid-60s%). However, their share has slipped as 1P brands regain ground through premium pricing, brand equity, and disciplined product launches. The result is a crowded, margin-compressed space where 3P sellers must innovate quickly (e.g., K-Beauty, niche entrants) to sustain growth while 1P players claw back share.
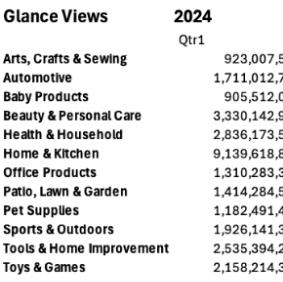
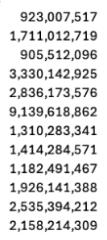
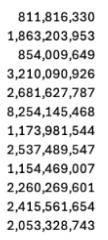


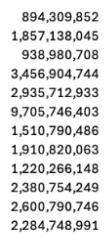


• Home & Kitchen is the traffic powerhouse. Averaging ~9B views per quarter, it draws 2–3x more shopper impressions than any other category, reinforcing its position as Amazon’s central shopping hub.
• Beauty & Personal Care (~$3.7B in Q1) and Health & Household (~3B) also remain traffic giants, both delivering double-digit glance view growth (Q1 & Q2 2025).
• Growth is broad but uneven: smaller categories like Arts, Crafts & Sewing (+13% QoQ in Q2) can surge when innovation resonates, but they remain niche compared to the scale of Home & Kitchen.
Innovation on Amazon is reshaping categories in two distinct ways: scale leaders like Home & Kitchen, Beauty & Personal Care, and Health & Household are pairing steady revenue and traffic growth with pricing resilience, while 3P-driven categories like Office Products and Tools & Home Improvement are using affordability and price flexibility to gain share. At the same time, niche segments (Arts, Crafts & Sewing) prove that shopper attention still follows novelty, even in a crowded, margin-pressured marketplace.
State of the Amazon Seller (2025)
Goals, challenges, and strategies for selling on Amazon in 2025.
The Battle for Brand Control
See how 3P disruptors are undercutting brands on Amazon.
MaryRuth Organics Case Study
Case Study: How MaryRuth’s Drives Innovation with Amazon Intelligence
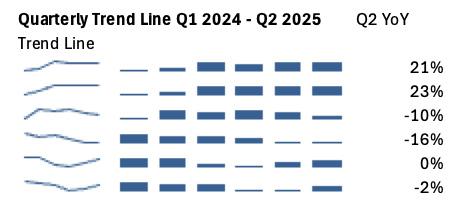
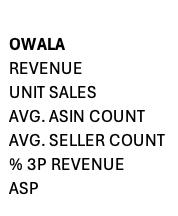
Innovation on Amazon leaves signals that are measurable at scale. Revenue shifts, ASP trends, seller fragmentation, and assortment changes all point to where the marketplace is moving fastest. But innovation doesn’t stop at the category level—it’s the brands inside those categories that define how the playbook is rewritten.
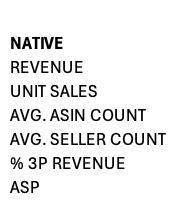
Distribution
3P Sellers (N)
3P Sales Share
Seller Rating
Assortment & Innovation
New Products Launched
Assortment Breadth
Product Quality Rating
Pricing
Price Power
Discount Frequency
Price Stability
Total unique sellers
Brand rev share of above 3P sellers
% of positive seller reviews
ASINs with >$O rev in scorecard timeframe and $O rev 12 mo. prior to scorecard timeframe
Avg. variants per parent brand 1-5 weighted by revenue
(Brand Rev Growth/Category Avg.) / (Brand Price/Category Avg)
Avg. discounts/month (N)
ASP standard deviation

This leaderboard doesn’t just reflect who launched new products. It reflects who executed smarter, scaled faster, and adapted better—the brands that turned Amazon into a real-time innovation lab and left competitors scrambling to catch up.
CHAPTER 3: THE INNOVATION LEADERBOARD

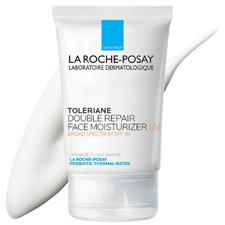
La Roche-Posay, a French dermatological skincare brand under L’Oréal, rose to prominence with sciencebacked formulas and cult-favorite sunscreens. On Amazon, it has translated that dermatologist credibility into marketplace dominance, becoming one of the top premium skincare brands by revenue and share growth.
Brand Snapshot
CHAPTER 3: THE INNOVATION LEADERBOARD
Assortment Innovation & Tiering
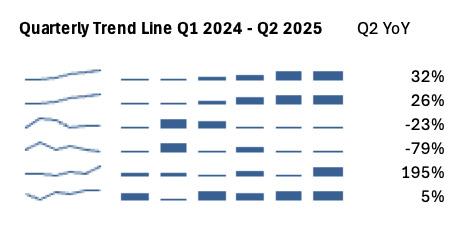
Streamlined assortment (ASINs ↓23% YoY) while scaling core SKUs, demonstrating discipline in doubling down on winners.
Category Outperformance
La Roche-Posay exceeded Facial Treatments & Masks benchmarks in Seller Rating, Product Ranking, Product Quality, and Pricing Power, while keeping discount frequency below category averages.
Growth Catalyst
Revenue began climbing in Q3 2024, driven by flagship products (Toleriane Hydrating Gentle Cleanser and Toleriane Purifying Foaming Wash), capturing rising demand for the search terms “face wash” and “hyaluronic acid.”
Pricing & Margin Resilience
Maintained stable ASP (+5% YoY) alongside 32% revenue growth, signaling margin protection while expanding.
New Product Launches in 2025
La Roche-Posay has leaned into ingredient-driven innovation, introducing products around trending actives like Vitamin C and Salicylic Acid, while expanding into blemish patches to capture rising demand in targeted skincare.
Search Dynamics
Despite declining branded search frequency in 2025, La Roche-Posay sustained revenue growth by capturing unbranded demand around high-volume skincare keywords.

Takeaway
La Roche-Posay drove profitable growth by streamlining its assortment, holding price discipline, and capturing unbranded demand—outperforming category benchmarks in the process.

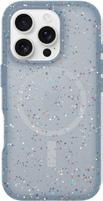
OtterBox, the U.S. brand synonymous with rugged device protection, has stayed relevant on Amazon and beyond through constant product innovation—launching new case lines for the latest Samsung, Google, and Apple devices—while layering in sustainability with cactus leather, seasonal collections, high-profile collaborations, and brand recognition such as being named to Newsweek’s America’s Most Loved Brands 2025.
CHAPTER 3: THE INNOVATION LEADERBOARD
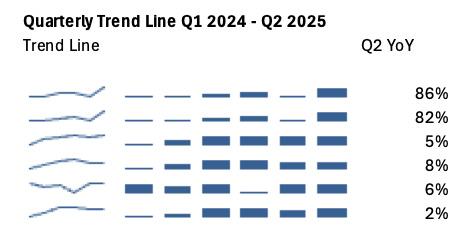
Maintained broad catalog (~2,800 ASINs; breadth of assortment 2.24 vs. category 8.71), but growth came from optimized core SKUs rather than runaway SKU expansion. Despite a narrower assortment breadth, OtterBox outperformed benchmarks in product rating (4.46 vs. 4.25) and product quality (4.55 vs. 4.34).
While seller rating lagged the benchmark (84 vs. 89.07), OtterBox exceeded in key profitability drivers: average product rating, quality, and pricing power. Its unusually high 3P sales share (50.7% vs. category 0.98%) underscores both reach and governance challenges.
ASP remained stable at ~$30 (+2% YoY), allowing OtterBox to grow revenue +86% without eroding margins. The brand delivered exceptional pricing power (788.55 vs. 14.72) and stability (28.57 vs. 1.98), while maintaining a lower-than-category discount frequency (0.10 vs. 0.24).
Strong unit sales growth (+82% YoY) supported by an unusually high pace of new product launches (1,279 vs. category 306), showing advertising effectively validated demand and drove scale across new products.
OtterBox rolled out new designs tied to major device cycles, including the Google Pixel 10 Series (Symmetry Series, Defender Series Pro XT, Thin Flex Series — all compatible with Pixelsnap wireless charging) and the iPhone 16 lineup, alongside refreshed styles for legacy models (iPhone 13–15). Frequent release cadence ensures OtterBox stays top-of-mind during device upgrade cycles.
OtterBox holds strong branded presence in highvolume device queries, ranking prominently for “iPhone 16 Pro Max case” (66.2K weekly searches) and “iPhone 16 Pro case”, reinforcing its dominance during peak upgrade cycles.

OtterBox demonstrates how balanced assortment and ad-led demand testing can fuel outsized growth while preserving price integrity. Despite weaker seller ratings and heavy reliance on 3P channels, the brand’s strong quality, pricing resilience, and innovation cadence have enabled it to outperform category benchmarks on growth and profitability levers.

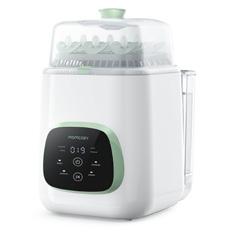
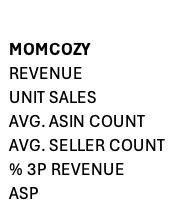
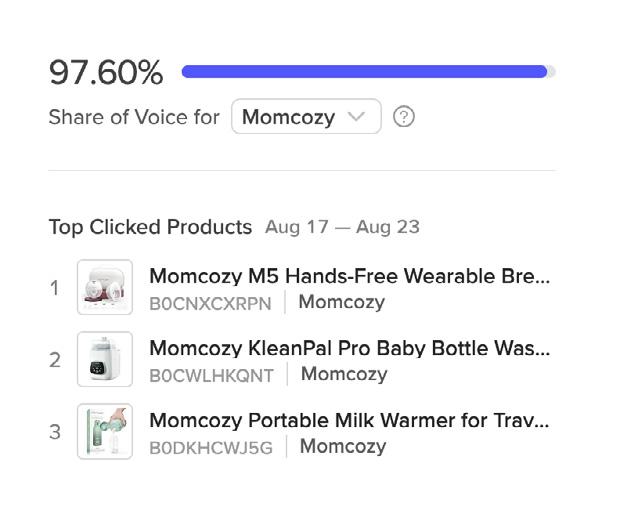
Momcozy, a China-based brand specializing in maternity and baby care products, gained global traction with its wearable breast pumps and practical, parent-first designs. On Amazon, it has rapidly scaled through an expansive assortment and aggressive distribution, emerging as one of the fastest-growing players in the mom-and-baby category.
CHAPTER 3: THE INNOVATION LEADERBOARD
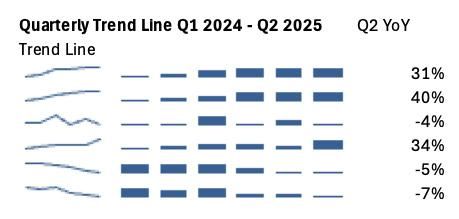
Broad assortment (~230–269 ASINs; breadth of assortment 2.59 vs. category 2.78) supports constant testing, but limited SKU rationalization weakened efficiency. New product launches (75 vs. category 15) far outpaced the benchmark, fueling rapid expansion.
Momcozy matched or slightly trailed benchmarks on average product rating (4.28 vs. 4.30) and product quality (4.32 vs. 4.30), but aggressive pricing and discounting strategies drove share gains rather than premium positioning.
Reliance on 3P partnerships is evident in its high 3P sales share (96.8% vs. category 87.6%). Seller count (26 vs. category 31) remained competitive, but seller ratings lagged benchmarks (75.6 vs. 91.2), signaling uneven channel quality.
Growth was volume-led but margin-dilutive: price power fell sharply (-333.6 vs. -1.8) as ASP dropped (-7% YoY) while units climbed +40%. Price stability (8.64 vs. 5.05) remained stronger than category peers, but discount reliance was higher (0.72 vs. 0.23).
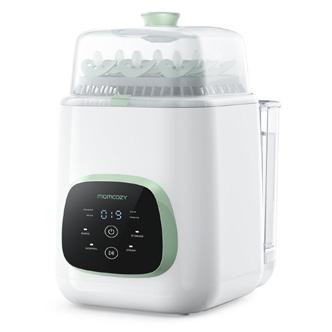
Momcozy introduced the Air 1 Ultra-Slim Breast Pump, the thinnest wearable breast pump on the market, combining ultra-slim design with top-of-the-line features. The brand also launched the Ergowrap Postpartum Belly Band, complementing its Ergonest Maternity Belly Band to deliver a comprehensive abdomen support solution for mothers.
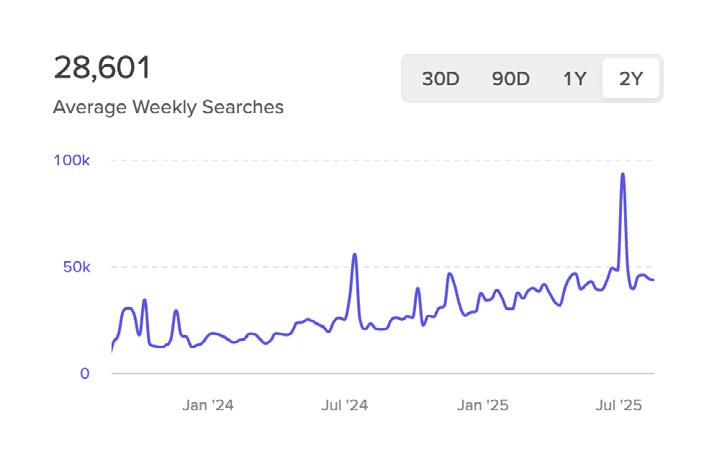
With 97% Share of Voice on its brand name and strong Prime Day promotions, Momcozy has not only captured branded demand but also expanded into high-volume unbranded terms like “baby essentials,” “breast pump,” and “postpartum essentials,” reinforcing its leadership in the mom-and-baby category.

Momcozy scaled rapidly through wide distribution, heavy new product launches, and promotional activity, emerging as the category’s volume leader. However, ASP erosion and weak price power highlight the risks of growth through price compression and reliance on 3P channels
CHAPTER 3: THE INNOVATION LEADERBOARD
Use product launches as agile test-and-learn cycles
Rebalance your assortment mix using performance data
Source data from: Amazon Seller Central → Business Reports, Ad Console, and Sales Dashboards
Frequency: Track weekly during first 6–12 weeks post-launch
ASIN level: Analyze NTB % and conversion rates at the child ASIN level
Source data from: Product-level sales reports, customer reviews, ad efficiency metrics
Frequency: Monthly audit of core, hero, and test product performance
Category level: Benchmark against competitors and category averages
Helps identify early signs of product-market fit, guiding decisions on whether to scale, reposition, or sunset a product.
Ensures inventory is aligned to demand signals, reduces dead weight SKUs, and improves overall margin health.
Turn advertising into a diagnostic tool
Monitor Buy Box and seller activity to protect channel control Accelerate response to market shifts through competitive benchmarking
Source data from: Amazon Ad Console, Search Term Reports, NTB metrics
Frequency: Ongoing, but focus during pre-launch, launch, and scale phases
Keyword level: Assess spend vs. return for new ASINs or feature launches
Source data from: Buy Box Reports, Brand Registry, unauthorized seller tracking tools
Frequency: Weekly for high-volume ASINs, monthly for long-tail ASINs
Keyword level: Track Buy Box win rate, seller count, pricing volatility
Source data from: Category bestseller lists, competitor ad creative, pricing trackers
Frequency: Biweekly for dynamic categories, monthly for stable categories
Brand and keyword level: Compare pricing, review velocity, and ad visibility
To lead in an increasingly competitive and fast-moving marketplace, brands must embrace innovation as a continuous discipline—not a one-time initiative. The most successful Amazon brands in 2025 are those that treat the platform as a live testing ground: rapidly launching, validating, and scaling new products while maintaining strategic control over pricing, content, and fulfillment. Innovation today means using real-time data
Surfaces demand trends early, identifies effective positioning, and informs whether a product or campaign should be scaled or reworked.
Protects margins and customer experience by ensuring authorized sellers are aligned and 3P disruption is minimized.
Keeps your brand responsive and ahead of trends—turning market observation into fast, data-backed action.
to iterate faster than the competition, optimizing your assortment based on NTB and repeat behavior, and transforming ad spend into an engine for insight.
Those wwho fail to adapt will be outpaced— not by legacy competitors, but by the agile brands redefining the rules of category leadership.

For over a decade, Jungle Scout has tracked and analyzed Amazon’s vast marketplace, equipping enterprise brands, retailers, and agencies with the insights needed to stay ahead. The same powerful tools that have guided over 1 million sellers now fuel this report—helping you protect your brand and drive growth with data-driven strategies.
Unlock the power of market intelligence.
Book a Cobalt demo today.
Brands that successfully scaled into international Amazon marketplaces did more than translate listings—they localized pricing, adapted packaging, optimized for regional fulfillment, and responded to local search and category dynamics.
Launched curated assortment mixes tailored to regional demand
Example Brands
Leveraged Brand Registry and hybrid 1P/3P strategies to control pricing and availability abroad
Used ad spend to test product-market fit in new geographies

Expanded into the UK and Canada with adjusted scent profiles and bundling format
Scaled insulated drinkware to EU markets, leading with sustainability messaging
CHAPTER 4: INOVATION BY REGION
Some of the most impactful product innovation in the U.S. didn’t come from domestic brands. It came from global players who introduced new formats, ingredients, and pricing models—often gaining traction through Amazon before traditional retailers caught up.
Brought differentiated product designs or features not widely available in the U.S.
Used Amazon as a launchpad to build NTB audiences and validate demand
Leaned into social proof via review generation, UGC, and creator partnerships

Example Brands
Brought science-backed skincare formats to U.S. consumers at accessible price points
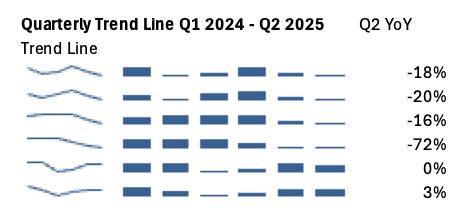
Anker
Created international SKUs with region-specific voltage/power specs and packaging
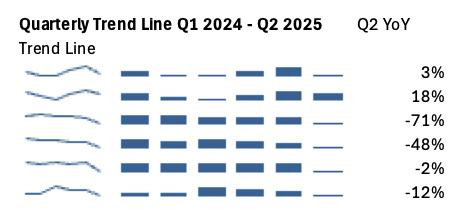
Expanded inclusive makeup-skincare hybrids—like its viral Mask Fit Red Cushion with 40 shades—and built direct U.S. visibility via Amazon while leaning into viral marketing and beauty-TikTok inclusivity trends.

CHAPTER 4: INOVATION BY REGION
Innovation is borderless—and brands must adapt accordingly
The most successful brands in 2025 aren’t just winning at home—they’re scaling globally by adapting their assortment, messaging, and pricing to local market conditions. Regional agility is now a strategic necessity.

Brand control must extend across marketplaces
With global expansion comes global complexity. Enforcing brand protection—via MAP, IP registration, and Amazon’s Brand Registry—must extend across all Amazon marketplaces to prevent channel erosion and counterfeit risk.
Data-led expansion reduces risk and accelerates scale
Market success depends on visibility—brands need real-time insights into category dynamics, regional trends, and competitor activity to launch effectively, localize accurately, and respond to shifts with speed.
1P/3P hybrid strategies enable global scale
Brands that balance Vendor Central for key accounts with 3P for speed and control are better positioned to adapt globally. Hybrid fulfillment models also support rapid entry into new regions without compromising brand standards.
Inbound disruptors are reshaping U.S. categories
Global challengers—particularly China-based and APAC brands—are entering the U.S. with product formats, price points, and innovation cycles that move faster than legacy brands. U.S. companies must respond with faster iteration, better fulfillment, and stronger value positioning.
CHAPTER 4: INOVATION BY REGION
To drive innovation across regions and protect their market position, brands must combine strategic foresight with real-time intelligence. Cross-border commerce adds complexity, but also unlocks opportunity for those prepared to adapt fast. The following strategies are designed to help brands audit their regional performance, identify gaps, and scale strategically in both outbound and inbound innovation scenarios:
Audit regional marketplace performance
Adapt assortment and pricing for regional fit
Localize fulfillment and hybrid sales strategy
Monitor regional competitors and inbound disruptors
Source: Global sales dashboards, keyword trends, pricing comparisons across marketplaces
Frequency: Quarterly by region
Level: Parent ASIN by country
Source: Local keyword trends, customer reviews, competitor pricing data
Frequency: Monthly category review per region
Level: Child ASIN
Source: Amazon global logistics reports, Seller Central and Vendor Central activity logs
Frequency: Monthly per region
Level: Parent ASIN
Source: Jungle Scout Cobalt, competitive seller tracking, ad share trends by region
Frequency: Weekly or biweekly by region
Level: Brand and keyword
Extend brand protection globally
Source: Brand Registry enforcement reports, IP registration databases, unauthorized seller monitoring tools
Frequency: Quarterly reviews
Level: Global ASIN scope
Assess where your products are over- or under-performing globally, which categories are saturated, and where localization may unlock untapped demand.
Tailor SKUs to local preferences—whether it’s ingredient variations, packaging formats, or pricing tiers—to improve conversion and reduce friction in new markets.
Optimize inventory availability and cost structure by choosing 1P for stability in core markets, and 3P for agility in emerging ones.
Track the entrance of international brands into your core markets. Identify fastscaling SKUs, pricing strategies, and advertising tactics used by new disruptors
Ensure trademarks, MAP enforcement, and counterfeit protections are active across all countries where your brand is live to prevent brand dilution or unauthorized 3P resellers.
In the global battle for ecommerce growth, data is your first mover advantage. Brands expanding internationally or defending home turf from global disruptors can no longer rely on fragmented tools or lagging insights. Success depends on visibility into category shifts, ad efficiency, competitive entrants, and regional market signals.
Jungle Scout Cobalt provides a holistic view of Amazon performance across regions— helping brands proactively adapt their pricing, product strategy, fulfillment, and advertising across borders. Whether scaling into the UK, responding to APAC competitors, or optimizing U.S. performance, Cobalt equips teams with the data needed to lead.
Tackle your biggest ecommerce challenges with the industry’s most time-tested Amazon market data.
Over the past decade, Jungle Scout has gathered trillions of data points through continuous monitoring and analysis of Amazon. Over 1 million brands, retailers, and agencies have used Jungle Scout tools to make confident decisions and develop effective strategies on Amazon. See how our tools can help your business grow by signing up or requesting a demo.
See Cobalt in action. Book a Cobalt demo today.
On Amazon, advertising is no longer just a lever for growth—it’s a tool for discovery, validation, and rapid iteration. In 2025, leading brands are treating their ad strategy as an innovation engine: using campaign data to test demand, refine positioning, and inform product development.
This chapter explores how brands are using PPC and DSP not only to drive visibility, but to guide smarter launches, capture NTB audiences, and scale high-performing SKUs with precision.
Amazon Marketing Cloud (AMC)
Why it Matters in 2026
Central to closed-loop measurement; brands use AMC to analyze NTB journeys, creative impact, and path-topurchase signals across ad types.
Sponsored TV & Streaming Ads
Why it Matters in 2026
Amazon is expanding its retail media network into Prime Video, Fire TV, and Freevee—creating new upper-funnel discovery opportunities.
Off-Amazon DSP Expansion
Why it Matters in 2026
Amazon DSP is powering more off-site ad placements—on Twitch, IMDb, and third-party inventory—with better retargeting tools.
Sponsored Brand Video & Store Spotlight
Why it Matters in 2026
Video-first ads are now a default for high-performing ASINs, while Store Spotlight campaigns promote multi-ASIN experiences.
Creator-Linked Ads (in beta)
Why it Matters in 2026
Amazon is testing performance-based creator integrations where influencer content directly feeds into Sponsored ad units.
Brand Tailored Audiences (BTA)
Why it Matters in 2026
Brands can now segment and retarget audiences (e.g., lapsed customers, high-LTV buyers) with custom offers and messaging.
AI-Driven Keyword Discovery Tools
Why it Matters in 2026
Emerging tools within Ad Console are surfacing keyword clusters, product pairing insights, and campaign automation suggestions.
CHAPTER 5: ADVERTISING AS INNOVATION

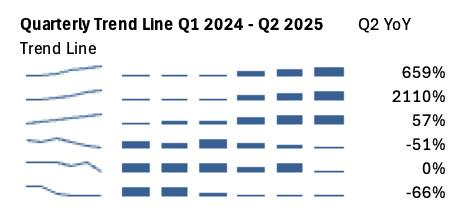
MEDICUBE splashed onto Amazon with its popular skincare and skin-med devices, quickly gaining traction with both influencers and U.S. households. The brand’s innovation extended beyond products into advertising—leveraging major creators like Jeffree Star and Alix Earle on TikTok while fueling demand with Amazon Sponsored Ads.
With strong creative across Sponsored Brands, Sponsored Brand Video, and a curated, customer-focused Amazon Brand Store, MEDICUBE built a powerful engine for awareness and conversion.
CHAPTER 5: ADVERTISING AS INNOVATION
Assortment Innovation & Tiering
Maintained a narrow assortment (breadth 1.09 vs. category 1.43) but still launched significantly more products (47 vs. category 9), reflecting a focused yet aggressive innovation cadence.
Medicube exemplifies how advertising drives demand validation. Sponsored Ads, creator partnerships, and Brand Store curation amplified visibility and helped convert new entrants into category leaders.
Pricing & Margin Resilience
Achieved extraordinary price power (1057.1 vs. 29.8), signaling brand equity and premium positioning. Price stability (2.06 vs. 4.86) remained weaker than peers, but lower discount frequency (0.17 vs. 0.55) showed discipline in margin protection.
Outperformed benchmarks in product rating (4.36 vs. 4.31) and product quality (4.41 vs. 4.34). While seller rating lagged slightly (83.9 vs. 87.5), the brand’s ability to hold premium pricing despite full reliance on 3P (100% vs. 80.7%) underlines strong consumer pull.
Medicube expanded its innovation pipeline with the debut of the Booster Pro multifunctional skincare device (CES 2025), offering six therapies including microcurrent, LED, and sonic vibration for enhanced absorption and contouring. The brand also launched a new PDRN line—featuring the Pink Peptide Serum, Pink Collagen Jelly Gel Mask, and Pink Peptide Eye Serum—and expanded its Milky Glow makeup range, while growing U.S. retail presence through Ulta Beauty.
Medicube capitalized on rising interest in high-value skincare keywords, building visibility around unbranded demand such as “stem cell serum for face” and “Korean skin care,” reinforcing its positioning as a premium K-beauty innovator.

Medicube demonstrates how ad-led innovation and premium pricing power can fuel outsized growth on Amazon. By combining heavy influencer partnerships, disciplined pricing, and a high newproduct pace, Medicube has outperformed category benchmarks and set the standard for how beauty brands can turn Amazon into both a launchpad and growth engine.
Innovation is best understood in motion. This chapter highlights case studies from brands that embraced Amazon’s complexity and turned it into a competitive advantage. From scrappy newcomers disrupting CPG giants to global brands localizing for new markets, these real-world examples reveal the tactics, pivots, and strategies that set innovators apart—and what others can learn from their success.
A health and wellness brand based in Los Angeles, California, has quickly emerged as one of the fastestgrowing supplement companies on Amazon. Known for its high-quality, vegan, non-GMO, and gluten-free vitamins and supplements, the brand spans all life stages—from infant formulations to adult wellness lines. Its catalog includes liquid multivitamins, probiotics, herbal blends, and gummies designed to support immunity, energy, gut health, beauty, and sleep.


As Amazon became an increasingly influential channel for product discovery and consumer trends, their leadership recognized a critical need: to systematize its innovation pipeline. Previously, internal decisionmaking relied too heavily on anecdotal insights, siloed data, and instinct. This approach made it difficult to evaluate new product opportunities, understand pricing dynamics, or forecast confidently.
Key challenges included:
• Improving speed and accuracy of category assessments
• Deprioritizing weak signals early to focus the innovation pipeline
• Making smarter pricing decisions that improved launch profitability
• Gaining confidence in resource allocation and go-to-market strategy
To address these challenges, this brand partnered with Jungle Scout to build a data-led innovation framework, integrating marketplace intelligence into every stage of its decision-making.
Leveraged Category and Search Insights to spot rising keyword demand, whitespace in assortment, and fastgrowing competitors. Tools like Brand Tracker, SKU Tracker, and Share of Voice provided benchmarking on pricing, depth, Buy Box performance, and branded search visibility, enabling agile course correction.
Assortment Innovation & Tiering
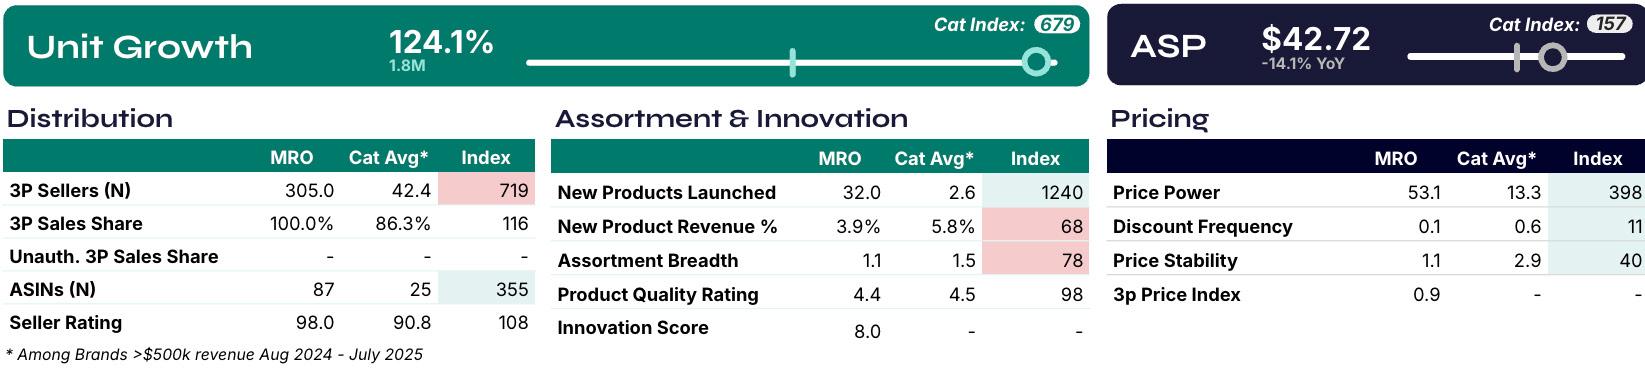
This brand launched 32 new products in the past 12 months (vs. 2.6 category average), 12x the pace of peers. While new product revenue under-indexed (3.9% vs. 5.8%), the focused assortment breadth (1.1 vs. 1.5) kept the portfolio disciplined.
Distribution & Governance
With 305 3P sellers (7x category average), distribution scale created Buy Box pressure but also room to capture unauthorized seller revenue. Strong seller ratings (98 vs. 91 benchmark) helped offset governance challenges.
Despite ASP declines (-14% YoY), revenue growth (+92.5% YoY) was nearly 4x the category, highlighting unit-led growth. Strong price power (53.1 vs. 13.3), limited discounting (0.1 vs. 0.6), and relative stability (1.1 vs. 2.9) protected margins.
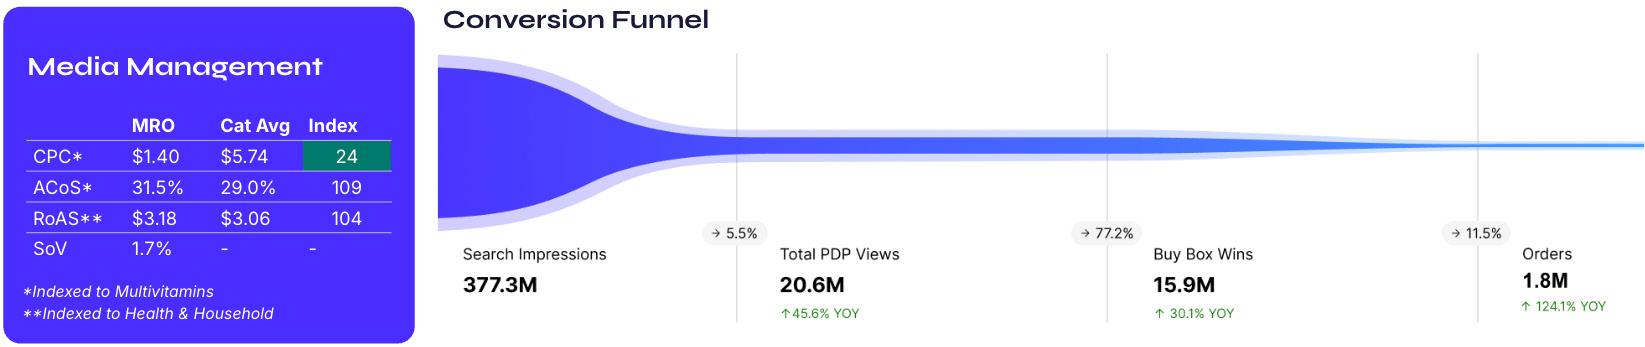
Media Management
Efficient CPC ($1.40 vs. $5.74) and solid RoAS ($3.18 vs. $3.06) made media spend effective across the funnel. Though Buy Box Win Rate (77%) faced disruption from seller fragmentation, order growth (+124% YoY) and PDP view growth (+46%) validated media-driven demand capture.
This brand’s revenue growth outpaced the category nearly 4x, driven by consumer demand for “sciencebacked” and “clean label” themes that delivered 400%+ growth—reinforcing alignment between innovation strategy and search dynamics.
$24,885,824 $46,619,737
$14,221,294

In just one year with Jungle Scout Cobalt, this brand has transformed its Amazon strategy into a repeatable innovation engine:
• 27% total revenue growth, outpacing category growth of 16%
• Increased profitability from launch through smarter pricing decisions
• A more disciplined innovation pipeline that prioritized high-potential ideas
• Greater confidence in resource allocation, enabling stronger brand and campaign execution
This case study illustrates how even fast-growing consumer brands can benefit from moving beyond instinct. By grounding innovation in data and creating a structured framework for decision-making, the brand has built an engine for sustainable growth on Amazon.
Amazon’s pace isn’t slowing—and neither can your innovation strategy. This forward-looking chapter outlines the foundational tactics, team behaviors, and data disciplines required to stay competitive in 2026 and beyond. Whether you’re optimizing assortment, experimenting with AI, or protecting against channel disruption, this playbook distills the most critical moves brands should be making now to future-proof growth.
Rule 1: Assortment Innovation & Tiering
Rule 2: Pricing & Margin Resilience
Rule 3: Advertising as Market Validation
Rule 4: Speed to Market & Agile Operations
Rule 5: Global & DataDriven Expansion
Rule 6: Brand Protection
The levers of innovation in 2026 are not new ideas—they are evolved applications of the rules you’ve already seen in Chapter 1. They take those fundamentals and push them into a sharper, faster, more automated Amazon environment. Where Chapter 1 outlined the what, this playbook focuses on the how for the year ahead.
Assortment Strategy — Tier products into core, hero, and test SKUs; rotate in trend-driven innovations; capture and analyze keyword demand to inform new variants and seasonal launches.
Pricing Strategy — Benchmark against China-based sellers, enforce MAP, adapt to CPC swings.
Advertising as Validation — Use PPC, DSP, and AMC to test demand, positioning, and audience overlap.
Speed to Market — Use modular packaging, prebuilt creative, and agile supply chains.
Regional Expansion — Localize for new markets; use 3P to test-market; monitor category shifts weekly.
Buy Box & Channel Control — Enforce reseller agreements, brand gating, and IP protection.
Enables rapid testing, fail-fast cycles, and faster scaling of proven winners without bloating the catalog—while ensuring new product development is grounded in real shopper demand signals.
Maintains profitability while staying competitive during inflation, tariff shifts, and retail price wars.
Turns ad spend into a data engine for innovation, not just a sales channel.
Secures first-mover advantage and quick pivots when market signals shift.
Opens new revenue streams while minimizing risk.
Secures first-mover advantage and quick pivots when market signals shift.
CHAPTER 7: INNOVATION PLAYBOOK FOR 2026
1P/3P Hybrid Strategy
— Balance retailer scale (1P) with agility and control (3P).
Why It Matters in 2026:
Reduces channel risk, stabilizes inventory, and manages pricing volatility.

Data & Competitive
Monitoring — Weekly tracking of CPC trends, NTB growth, and seller encroachment.
Why It Matters in 2026:
Keeps brands proactive instead of reactive.
AI & Automation
Readiness — Pilot AI for pricing, creative, and ops alerts.
Why It Matters in 2026:
Increases efficiency, accelerates signal-to-action speed.
AI-Driven Assortment Planning
By 2026, leading brands will rely on predictive AI to simulate demand shifts, flag product cannibalization risks, and autogenerate bundle/test SKUs based on real-time keyword and basket data. Innovation pipelines will be less about instinct, more about algorithmic forecasting—shortening signal-to-shelf cycles from months to weeks.
Retail Media Convergence
Amazon’s ad ecosystem is expanding beyond the marketplace into Prime Video, Fire TV, Twitch, and DSP-linked inventory. In 2026, retail media won’t be siloed—it will converge with search and social. CEOs must prepare for a future where the same campaign data informs both product innovation and media buying, with Amazon Ads shaping category strategies as much as shelf placement.
Global Tax & Tariff Shifts
With ongoing U.S.–China trade tensions and evolving VAT/digital tax frameworks, brands will need Amazon-specific tariff intelligence. In 2026, innovation isn’t just about product—it’s about supply chain agility. Leaders will pivot sourcing, adjust pricing in real time, and reconfigure 1P/3P strategies to protect margins in response to sudden tariff changes.
CHAPTER 7: INNOVATION PLAYBOOK FOR 2026
According to AI Business, advertising research has long relied on surveys and recall-based measures, but Mars recognized their limits. To better predict sales outcomes, the company developed Agile Creative Expertise (ACE), an AI-powered ad-testing tool that integrates behavioral science with emotional response data.
CHAPTER 7: INNOVATION PLAYBOOK FOR 2026
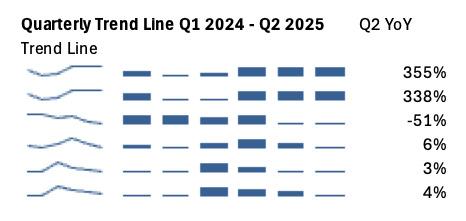
Maintained a narrow Amazon assortment (breadth 1.13 vs. category 1.41) and only 2 new launches in the past year (vs. 20 category average), signaling reliance on evergreen core SKUs rather than rapid SKU expansion. Despite slower innovation, product quality (4.49 vs. 4.08 benchmark) and product ratings (4.42 vs. 4.08) remain strong.
Mars navigates 604 3P sellers (2.5x the category average) with 3P sales share of 36.7% (vs. <1% benchmark). Seller ratings (74.3 vs. 81.1) highlight governance challenges and consumer friction tied to fragmented seller management.
Price power underperformed sharply (-40.5 vs. +2.6 category), reflecting ASP pressure in a highly commoditized category. Limited discounting (0.04 vs. 0.15 category) and stable ASP (3.5 vs. 3.6) suggest Mars is protecting core price points but struggling to command premium value online.
To improve creative performance, Mars developed Agile Creative Expertise (ACE), an AI-powered ad-testing tool combining behavioral science and emotional response data. ACE improved ad success rates from ~40% pre-launch to >70%, validated across 4,000 ads and deployed in 1,000+ projects over 25 countries, including Amazon. This delivered an incremental $30M in sales while enabling faster, predictive decision-making on creative.
Despite pricing headwinds, Mars’ strong brand equity and AI-led ad validation reinforced its leadership, with product quality and creative effectiveness outpacing category peers even as distribution complexity weighed on seller experience.

Mars demonstrates how global incumbents can harness AI and behavioral science to modernize ad testing, moving beyond survey-driven recall to predictive sales signals. While its Amazon pricing power lags peers, its ACE model gives the brand a measurable innovation edge—turning consumer reactions into scalable sales outcomes across TikTok, YouTube, and Amazon.
This report explores how innovation is reshaping the competitive landscape on Amazon in 2025. Through deep category analysis, regional trends, advertising insights, and brand case studies, the Innovation Index highlights the strategies used by top-performing brands to test, adapt, and scale faster than the competition. Rather than viewing innovation as a one-time launch, this report positions it as an ongoing discipline—driven by data, powered by agility, and essential for long-term brand success on Amazon.
This report is based on proprietary market intelligence gathered through Jungle Scout’s Cloud, covering data from January 1, 2023, to June 30, 2025. The analysis examines key trends in the Amazon marketplace, including third-party seller activity, pricing fluctuations, fulfillment strategies, and competitive market dynamics. By leveraging comprehensive ecommerce data, this report provides insights into the evolving challenges brands face and the strategic actions needed to maintain control and profitability on Amazon.
We encourage you to explore Jungle Scout’s Amazon Innovation Report, and to share, reference, and publish the findings with attribution to “Jungle Scout” and a link to this page
For more information, specific data requests, or media assets, or to reach the report’s authors, please contact us at press@junglescout.com