

Table of Contents CHAPTER 1 3 The Amazon Advertising Landscape CHAPTER 2 14 Amazon Advertising Spend CHAPTER 3 20 Return on Ad Spend (RoAS) CHAPTER 4 26 Category Leaderboard (U.S.) CHAPTER 5 29 Google Advertising for Amazon Brands CHAPTER 6 35 Challenges & Predictions CHAPTER 7 39 About the Report CHAPTER 8 41 Digital Advertising Glossary
CHAPTER 1
The Amazon Advertising Landscape
2023 was a game-changing year for ecommerce, ushering in the age of AI and a new era of social media commerce. The convergence of new technologies and selling platforms is transforming the selling and shopping experience and putting new players — from TikTok to Temu — in competition with Amazon.
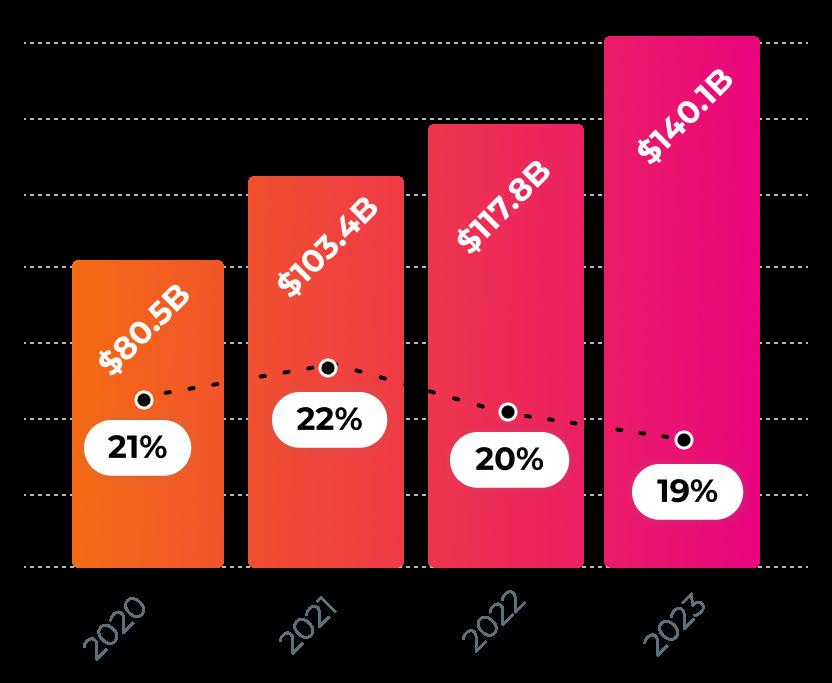
But Amazon’s history and popularity mean the industry goliath’s dominance is hardly shaken. It remains the go-to ecommerce platform for brands and shoppers alike. A big part of Amazon’s stickiness with sellers is its advertising capabilities, which have unique benefits over other channels. For brands, these benefits are clearly worth the investment: In 2023, Amazon’s advertising revenue grew 24% compared to the previous year. Since 2019, it has grown a hefty 272%.
“Worldwide advertising grew year-over-year [...] primarily driven by Sponsored Products as our teams work hard to increase the relevancy of the ads we show customers by leveraging machine learning. Advertising only works if the ads are helpful to customers, and there’s a lot of value in tailoring Sponsored Products so they are relevant to what a customer is actually searching for. We’re also continually focused on improving our measurement capabilities, which allow brands to see the payback of their advertising spend.” Amazon annual advertising services* revenue
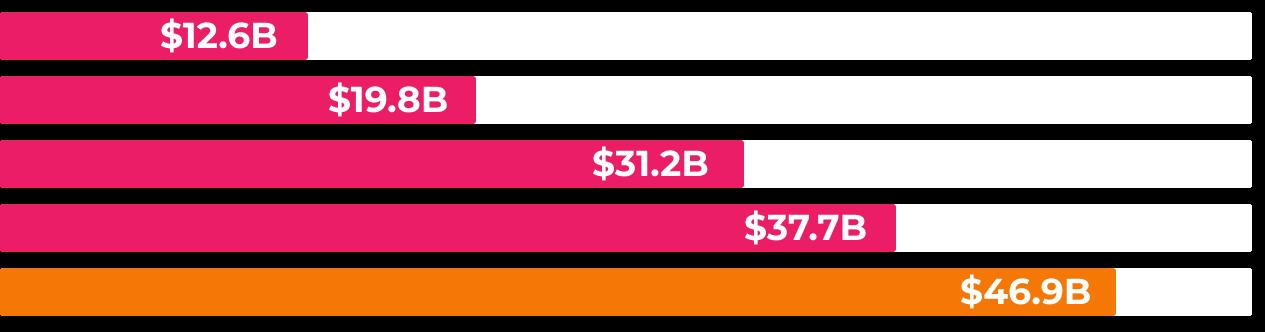
*Includes sales of advertising services to sellers, vendors, publishers, authors, and others, through programs such as sponsored ads, display, and video advertising.

Amazon.com Inc. CFO Brian Olsavsky, speaking on the company’s fourth-quarter 2023 earnings call
The Future of Advertising: Amazon vs. Other Channels
In 2024, 60% of Amazon sellers, brands, and businesses sell on at least one other channel, with many planning to expand even further in the coming months. As their ecommerce strategies stretch across more channels, their advertising investments are doing the same.
Top alternative ecommerce platforms for Amazon brands and sellers
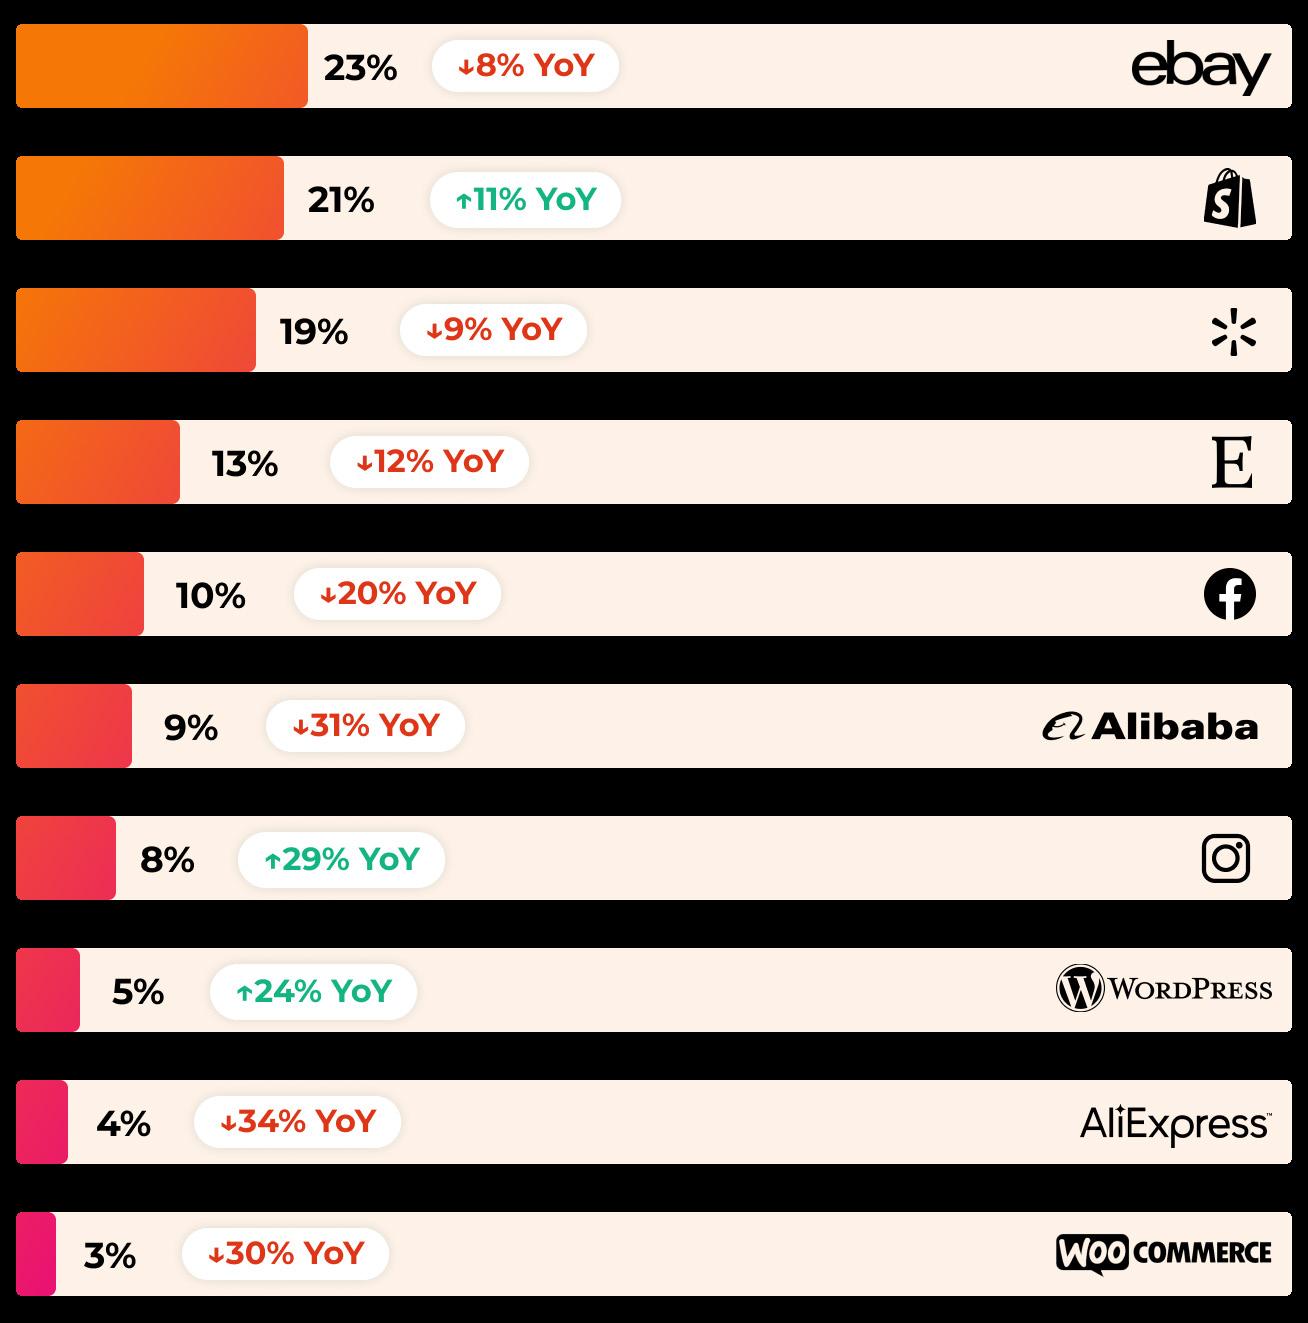
Source: Jungle Scout’s 2024 State of the Amazon Seller Report
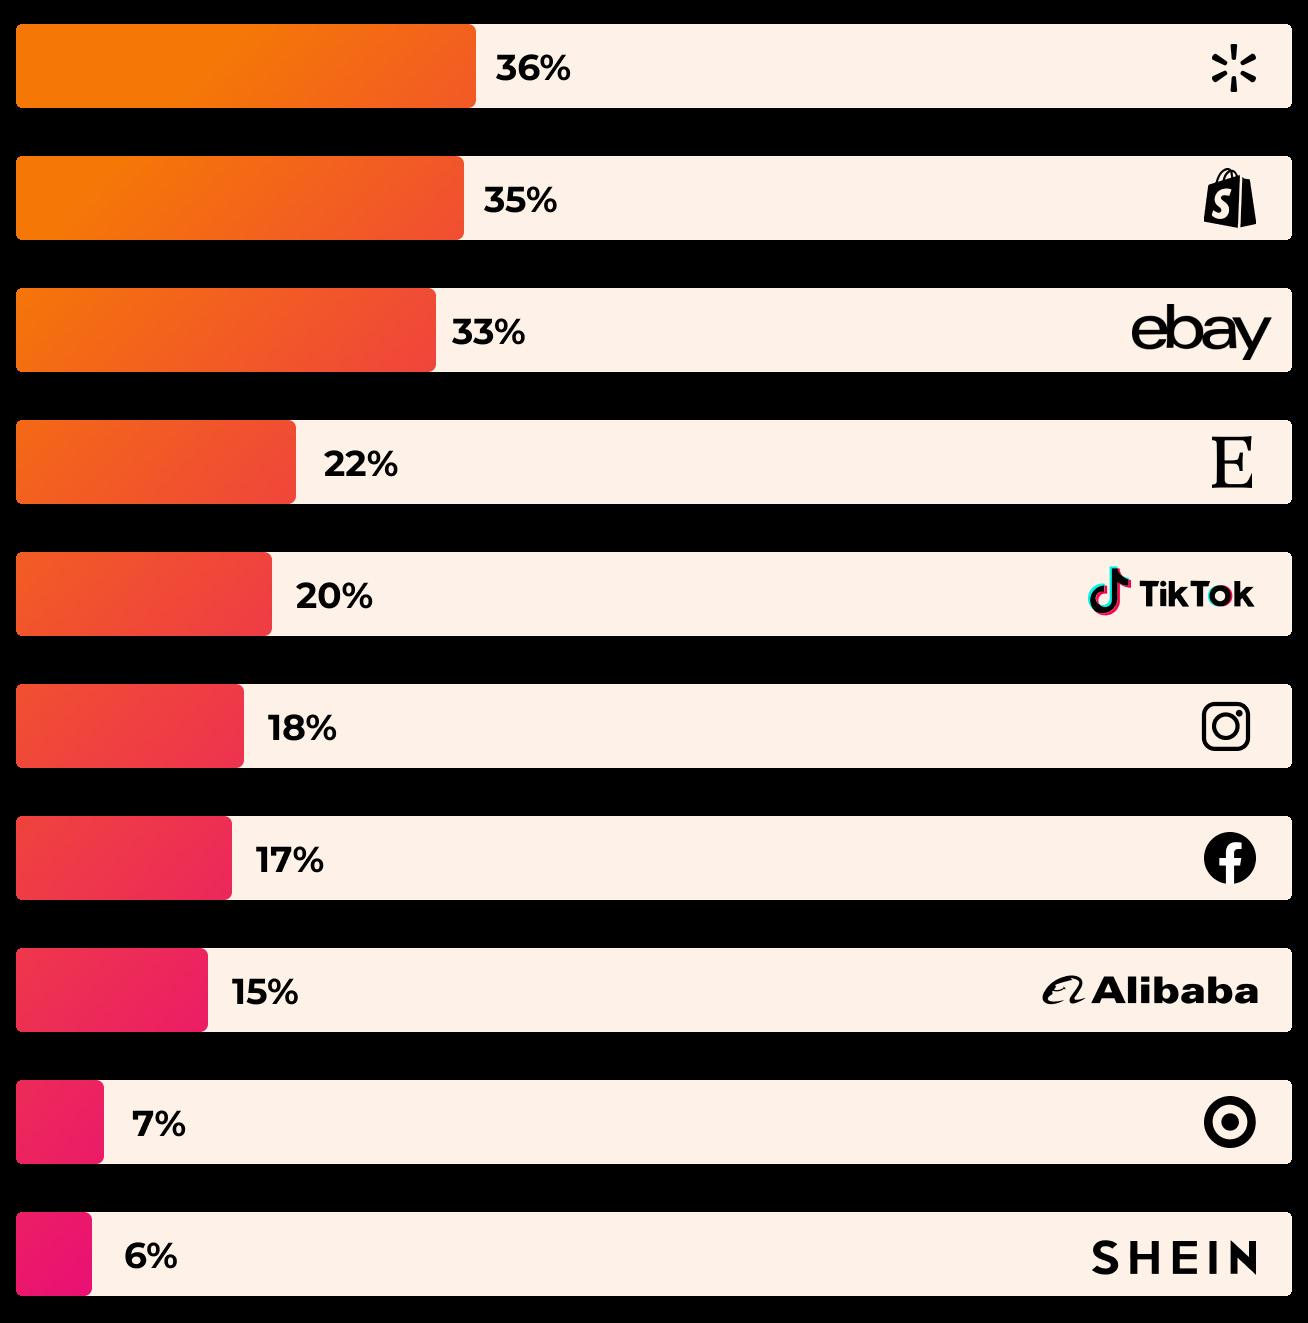
Top ecommerce platforms Amazon brands and sellers plan to expand to in 2024
4 Amazon Advertisng Report 2024 |
01. THE AMAZON ADVERTISING LANDSCAPE
The Importance of Advertising on Amazon
Even as the ecommerce landscape evolves, Amazon’s unrivaled popularity with shoppers remains. More than half of U.S. consumers (56%) turn to Amazon first when searching for a product online. Even the growth of social commerce is helping Amazon more than competing with it: A 2023 Jungle Scout consumer survey found that, even when shoppers discover a product on social media, they’re still most likely to purchase it on Amazon.
Where do consumers begin their search when shopping online?
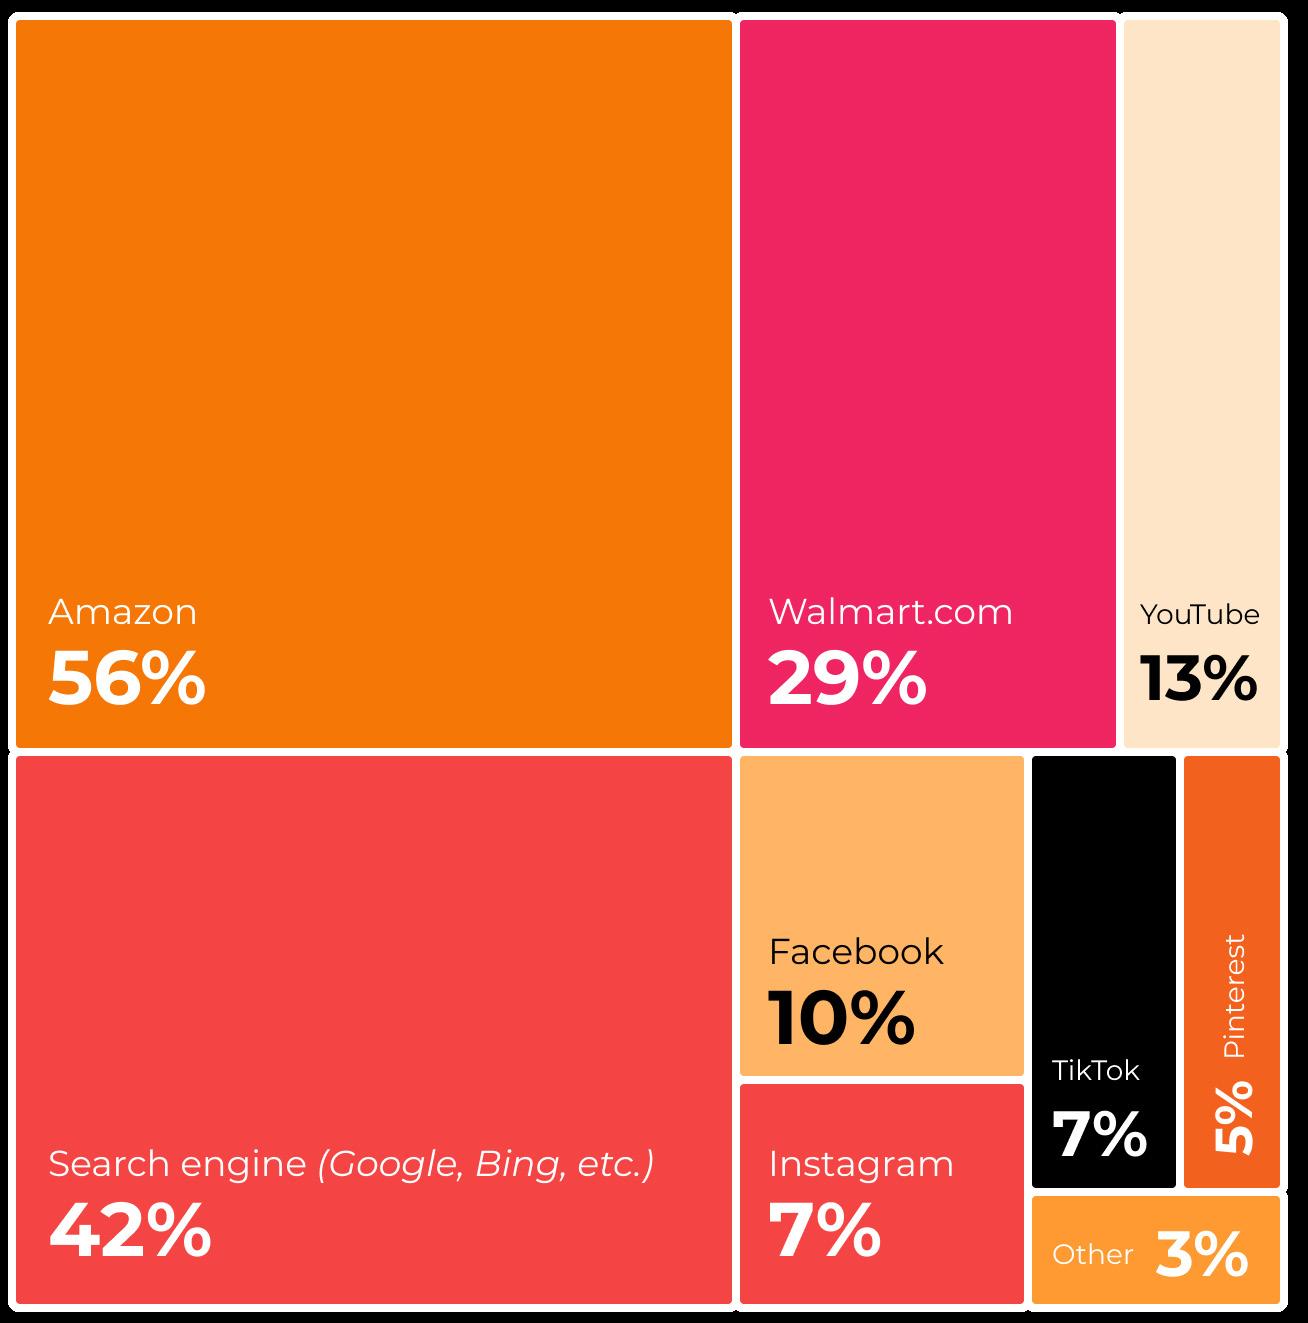
Source: Jungle Scout’s Q1 2024 Consumer Trends Report
INSIGHTS
While Amazon leads, search engines like Google are the second most popular destination for starting product searches online, making them an impactful advertising channel for brands and sellers.
Learn more about Google advertising in Chapter 5.
5 Amazon Advertisng Report 2024 |
01. THE AMAZON ADVERTISING LANDSCAPE
Online shopping frequency among U.S. consumers
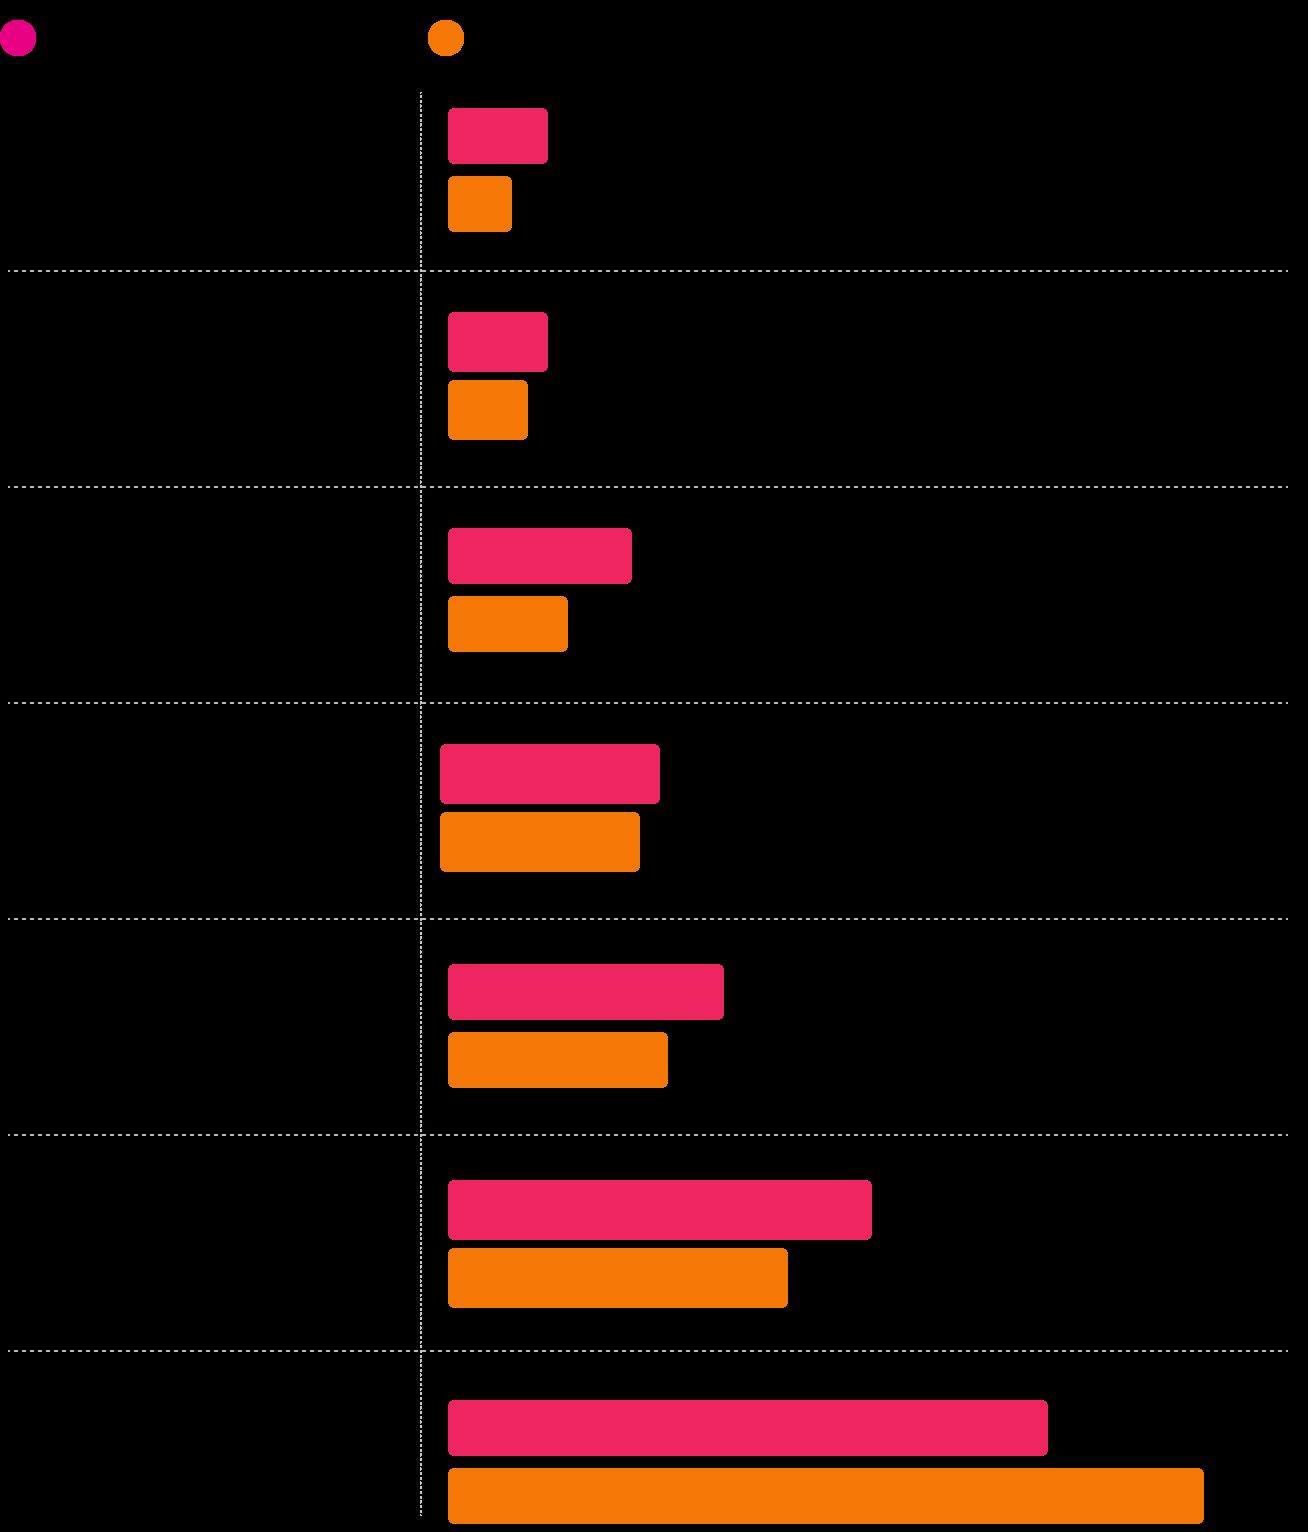
*Chart does not include respondents who reported that they never shop online (Any online store: 6%; Amazon: 10%)
Source: Jungle Scout’s Q1 2024 Consumer Trends Report
Amazon’s unique offering: Shopper targeting and detailed sales attribution
Amazon’s advertising services provide unique benefits that set it apart from competitors:
Audience of ready-to-buy shoppers
Amazon’s on-platform advertising enables brands to reach customers at the point of purchase, while offerings like Amazon DSP provide a way to connect or reconnect with shoppers throughout their journey.
Right product, right person
Amazon’s wealth of shopper data allows brands to expand their reach across channels. Its targeting options let advertisers build custom audiences based on behaviors like listing visits and previous purchases.
Measuring performance
Attribution is a key differentiator between Amazon and search or social media platforms. Attribution tells advertisers which ads are driving sales, and is a key piece of the formula to determine return on ad spend (RoAS).
6 Amazon Advertisng Report 2024 | 01. THE AMAZON ADVERTISING LANDSCAPE
How Big is Amazon’s Advertising Business?
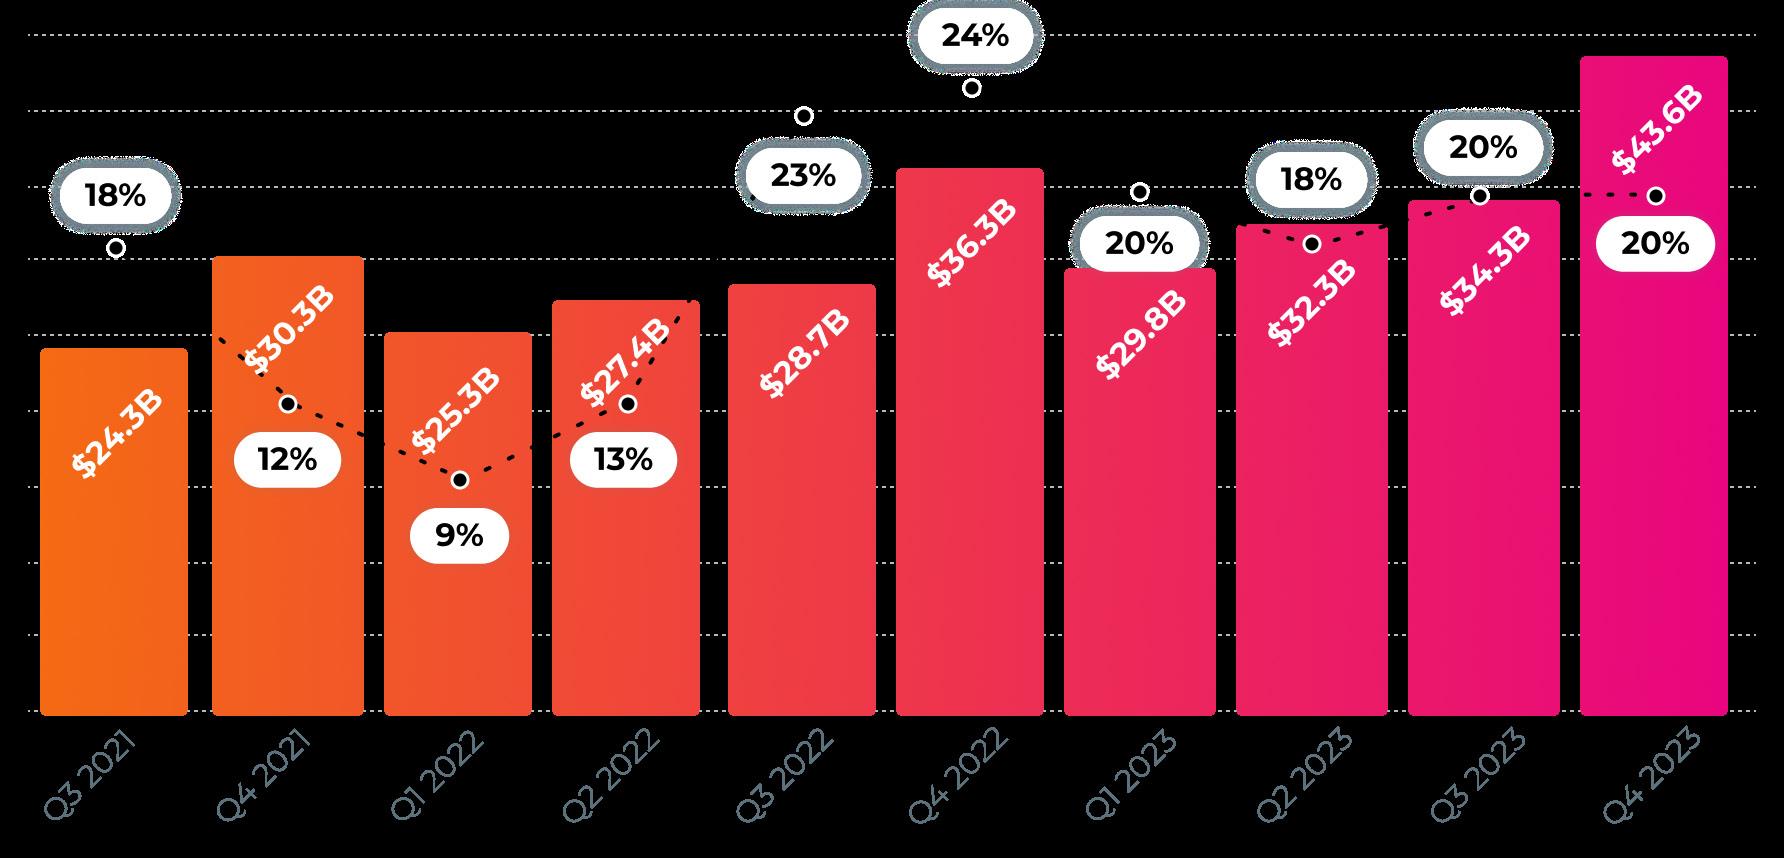
Amazon has sustained double-digit growth in its advertising revenue in recent years, and 2023 was no exception. Hitting $47 billion for the year, Amazon’s advertising revenue still trails Google and Facebook but eclipses its ecommerce competitors.
Advertising revenue by company
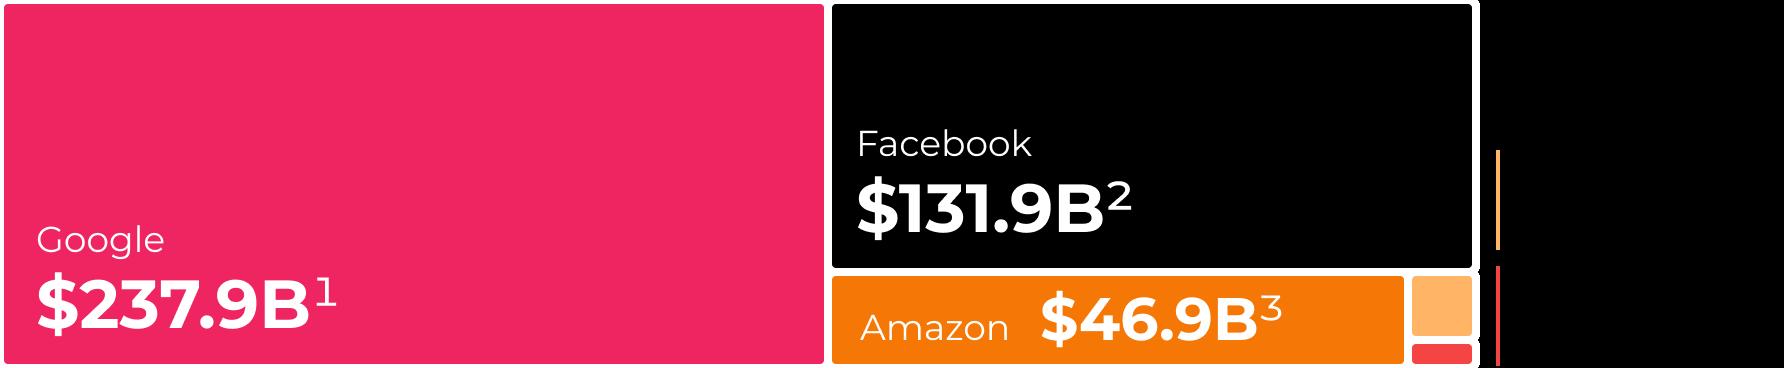
1Alphabet 2023 Form 10-K (includes Google Search, YouTube, and Google Network) 2Meta
10-K 4Walmart Q4 2023 earnings call 5eBay Q4 2023 earnings call 6Statista
Amazon quarterly advertising services* revenue (and YoY growth)
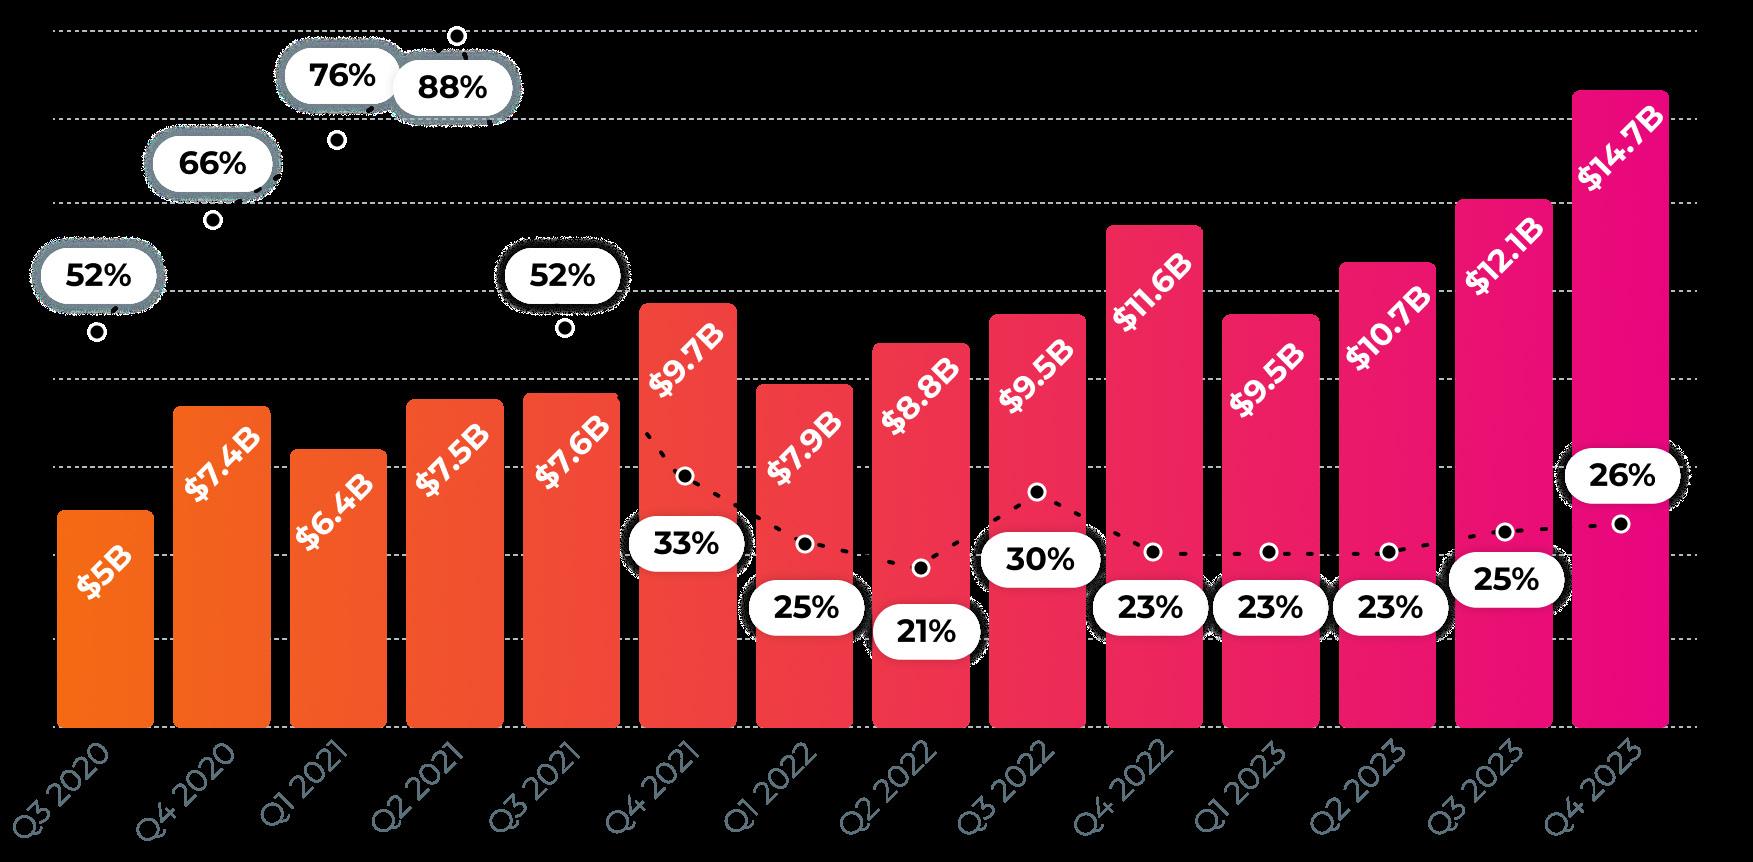
*Includes sales of advertising services to sellers, vendors, publishers, authors, and others through programs such as sponsored ads, display, and video advertising.
Source: Amazon fourth-quarter 2023 earnings release and historical data
INSIGHTS
Revenue from Amazon’s advertising services business segment represented 8.2% of Amazon’s total net sales in 2023, up from 7.3% in 2022

Google generates nearly 40% of digital advertising revenue worldwide6
Learn more about how Google advertising compares to Amazon in Chapter 5
7 Amazon Advertisng Report 2024 |
01. THE AMAZON ADVERTISING LANDSCAPE
2023 Form 10-K 3Amazon 2023 Form
Third-party seller growth on Amazon
Third-party sellers continue to grow on Amazon, with revenues related to third-party seller services increasing by approximately 20% each quarter throughout 2023.
Amazon selling models: 1P vs 3P
FIRST-PARTY SELLER
(1P):
Sells to Amazon as a vendor and uses Vendor Central.
THIRD-PARTY SELLER
(3P):
Sells on Amazon’s platform and uses Seller Central.
Annual revenue from third-party seller services* (and YoY growth)
INSIGHTS
Amazon’s revenue from thirdparty seller services rose 19% from 2022 to 2023.

Approximately 70% of brands and sellers on Amazon are 3P sellers.
Quarterly revenue from third-party seller services (and YoY growth)
“Third-party sellers were a big part of our success over the [2023] holidays, with worldwide third-party seller services revenue growing at 19% year-over-year, excluding the impact of foreign exchange. Worldwide third-party seller unit mix was 61%, its highest level ever.”
Amazon.com Inc. CFO Brian Olsavsky, speaking on the company’s fourth-quarter 2023 earnings call
Source: Amazon fourth-quarter 2023 earnings release and historical data; Includes commissions and any related fulfillment and shipping fees, and other third-party seller services.
8 Amazon Advertisng Report 2024 |
01. THE AMAZON ADVERTISING LANDSCAPE
Advertising Product Usage Among Brands and Sellers
Nearly three-quarters of all brands and sellers use Amazon’s Sponsored Products* ads, making it the most popular Amazon ad type. In 2023, ecommerce platform advertising dipped slightly overall, while the use of traditional media advertising increased. Investment in paid search ads on channels like Google also increased — by nearly 10% year-over-year.
*Sponsored Products delivered the highest RoAS of any Amazon ad product in 2023. Get more data on RoAS in Chapter 3.
Top channels where Amazon brands and sellers advertise their products
Source: Jungle Scout’s 2024 State of the Amazon Seller Report
INSIGHTS

Of the 36% of sellers who invest in paid search advertising, 95% use Google ads
In 2024, driving external paid traffic (Google ads, social media ads, etc.) to Amazon listings is a top focus area for 38% of sellers
9 Amazon Advertisng Report 2024 |
01. THE AMAZON ADVERTISING LANDSCAPE
Types of advertisers
Small and midsize businesses (SMBs)
Amazon sellers who earn less than $2M in annual revenue, including solo entrepreneurs.
Enterprise brands and businesses
High-earning sellers like large brands and parent companies encompassing a portfolio of brands.
Agencies
Consultants and partners who work with sellers of various types and sizes in managing their Amazon businesses.
10 Amazon Advertisng Report 2024 |
01. THE AMAZON ADVERTISING LANDSCAPE
Amazon PPC ad usage
Advertising trendlines
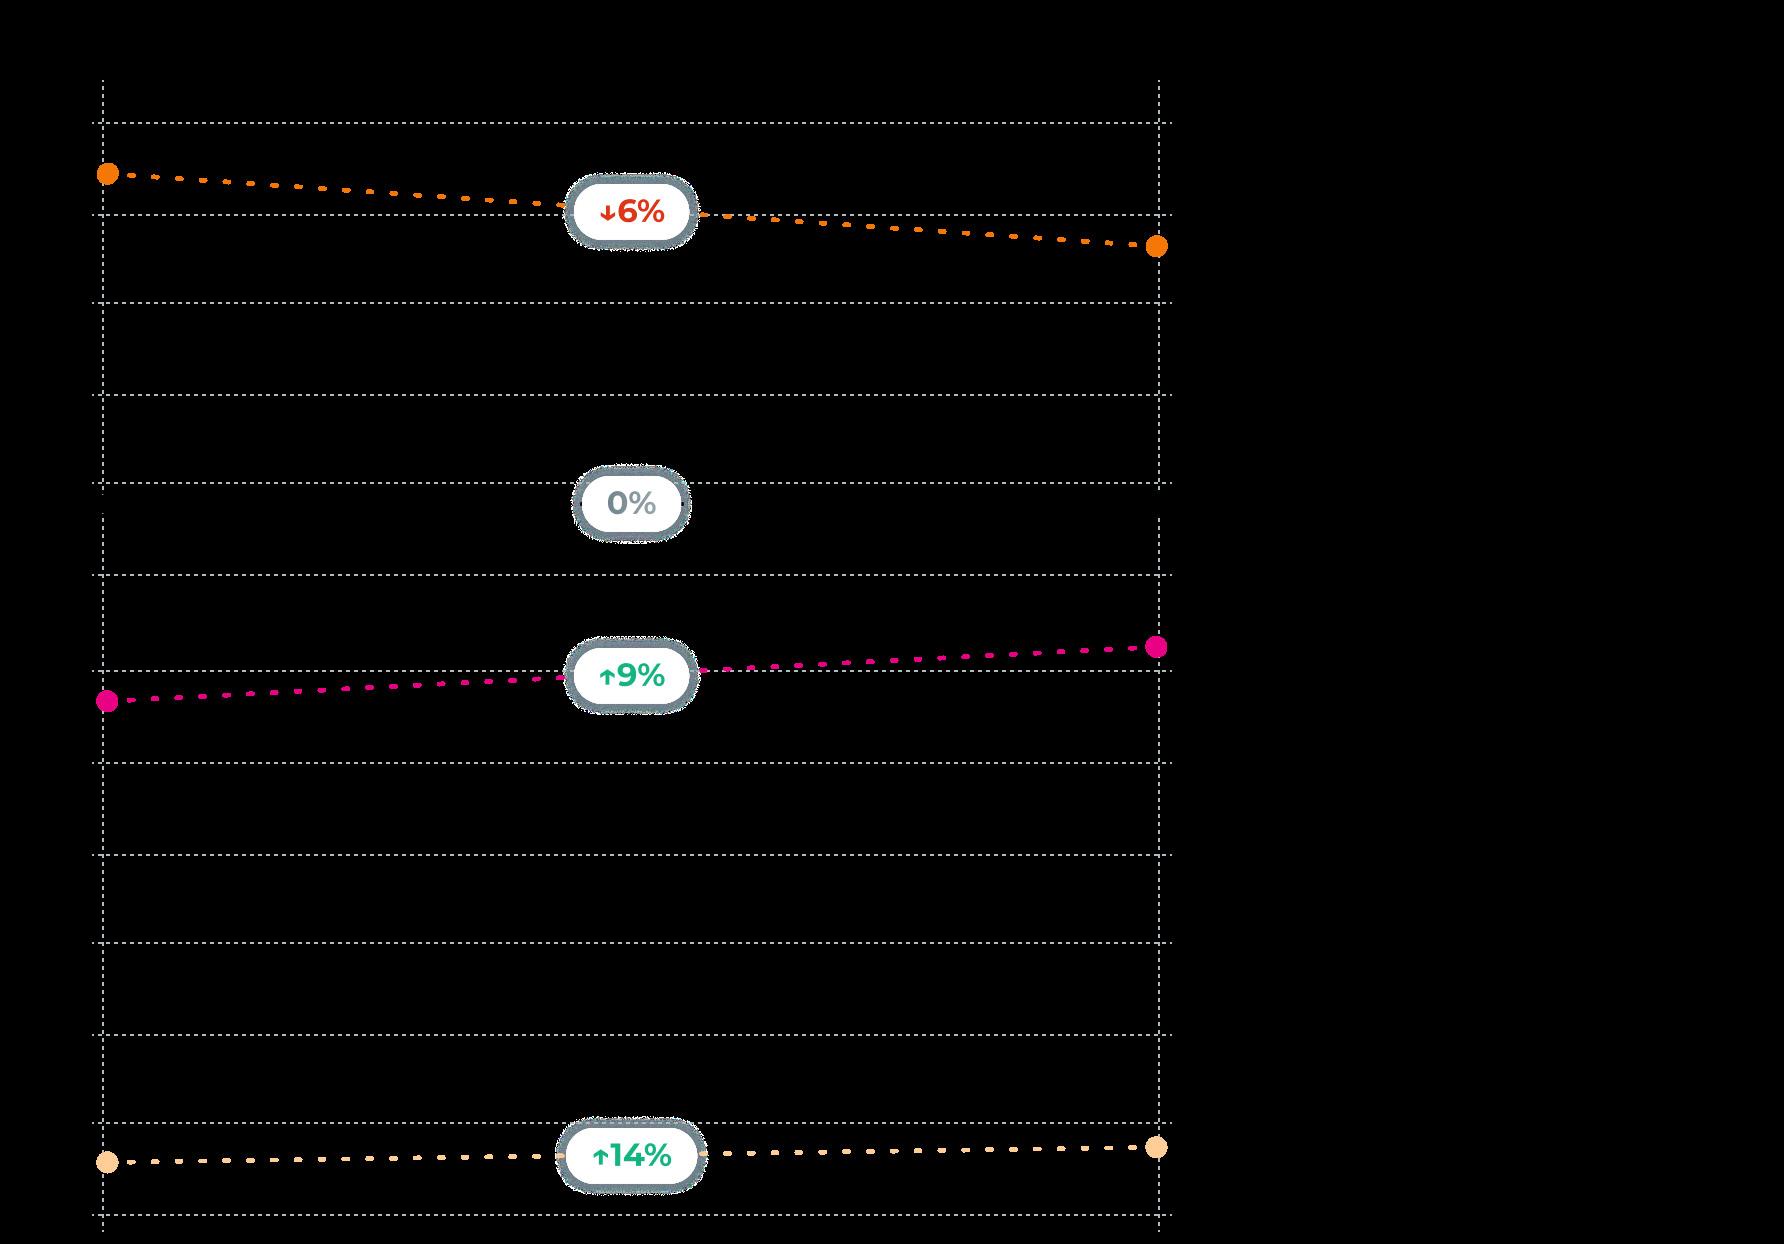
A closer look at advertising investment data among small and large Amazon sellers over the past two years reveals a few interesting trends. Both groups increased their investment in search engine/paid search ads (95% of which are Google Ads) over this time period, while investment in ecommerce advertising declined.
Notably, among enterprise brands and businesses, search engine advertising is overtaking ecommerce/Amazon advertising as the most widely used. In 2024, 64% of these sellers use Google or other search platform advertising – more than the 50% using Amazon advertising options.
Learn more about how sellers use Google advertising to promote their Amazon listings in Chapter 5.
Paid search
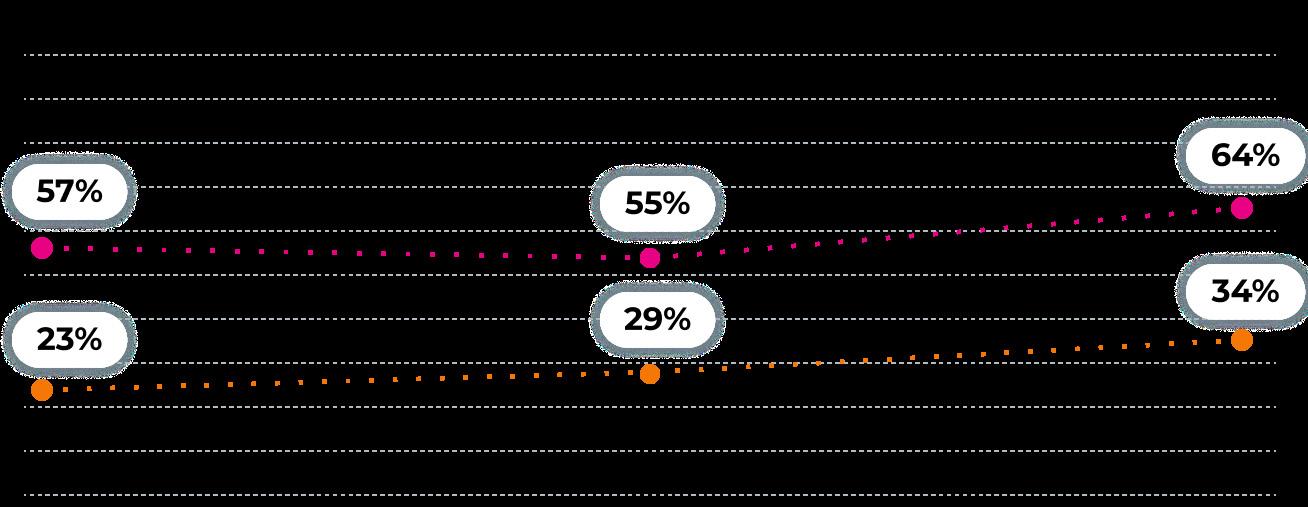
Ecommerce platforms
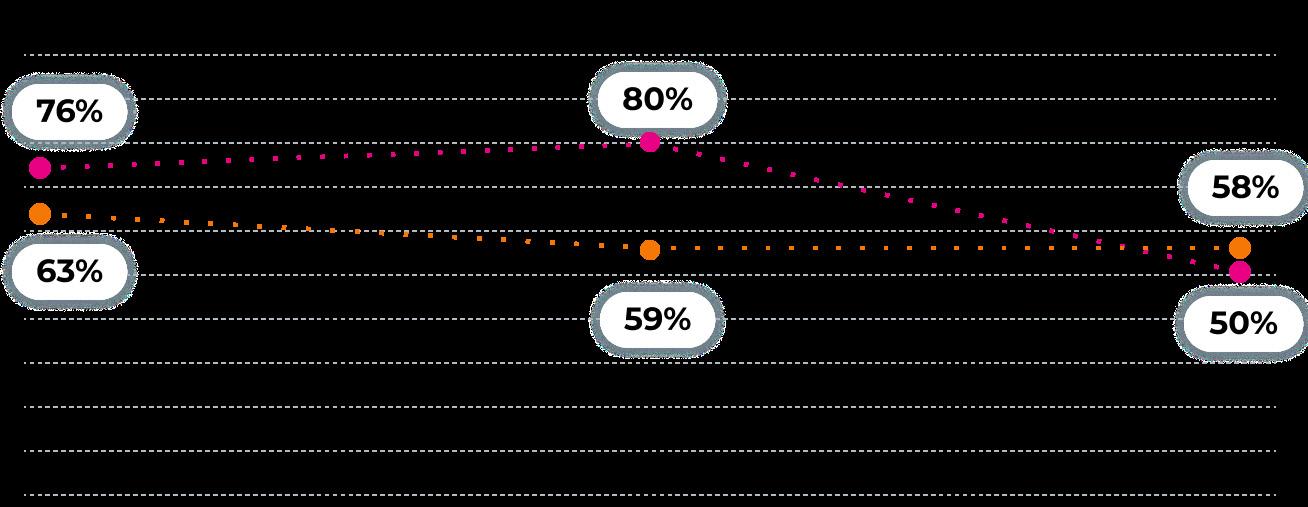
Social media

Traditional media
11 Amazon Advertisng Report 2024 |
01. THE AMAZON ADVERTISING LANDSCAPE
Other
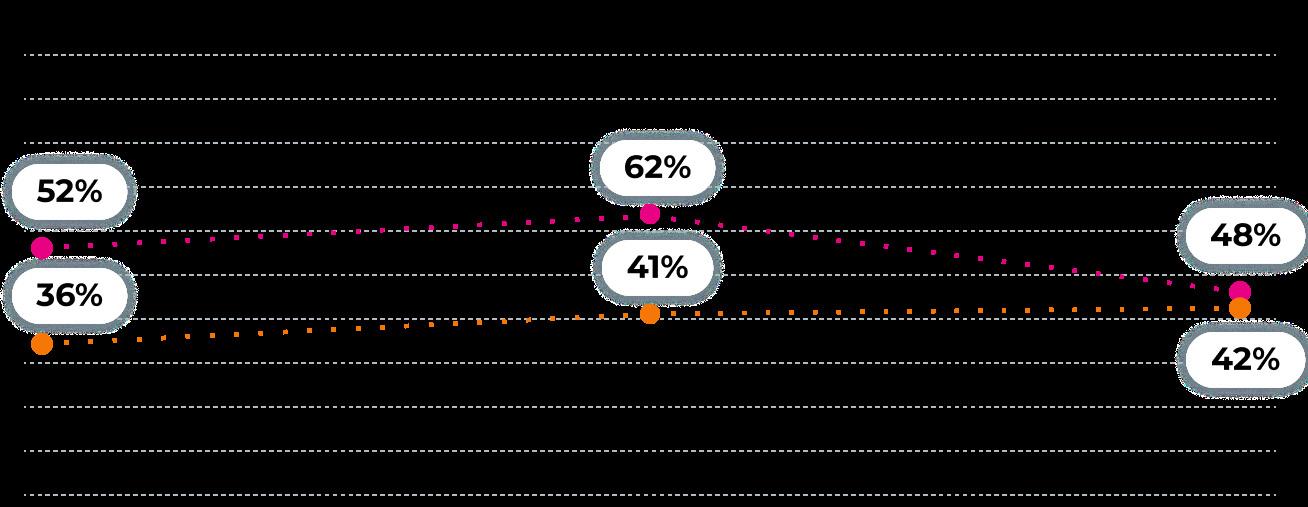
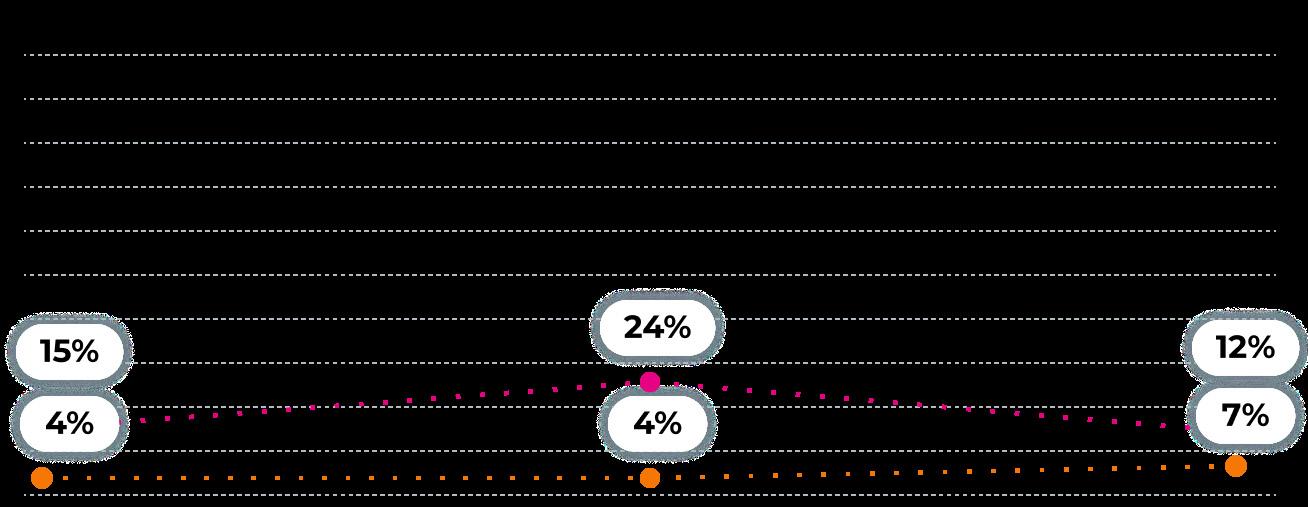
Amazon advertising and marketing tools
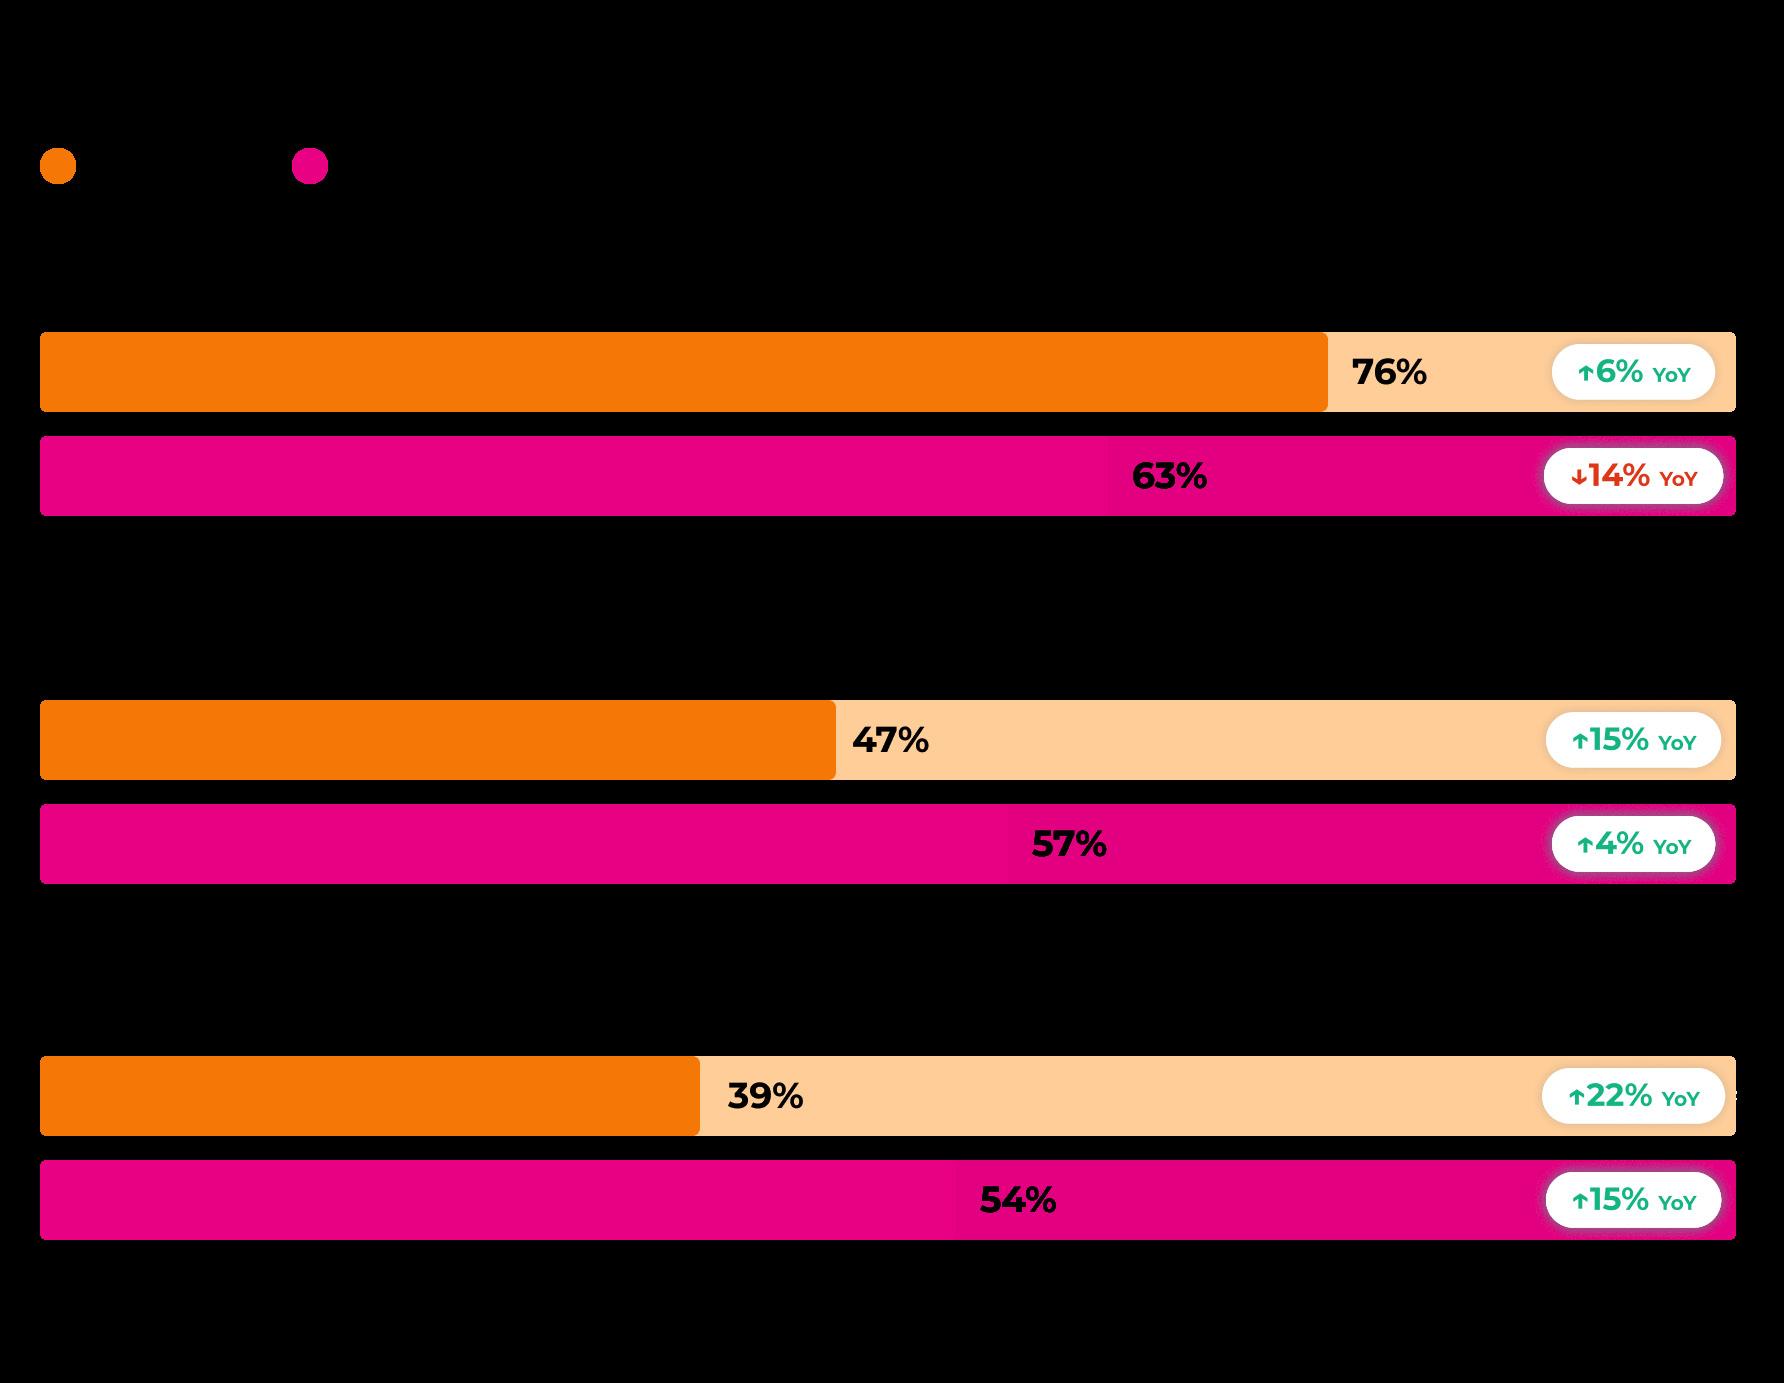
Sellers and SMBs are pulling back on additional Amazon advertising and marketing tools like Amazon Live and Amazon Posts.
Advertising and marketing tool usage by type: SMBs*
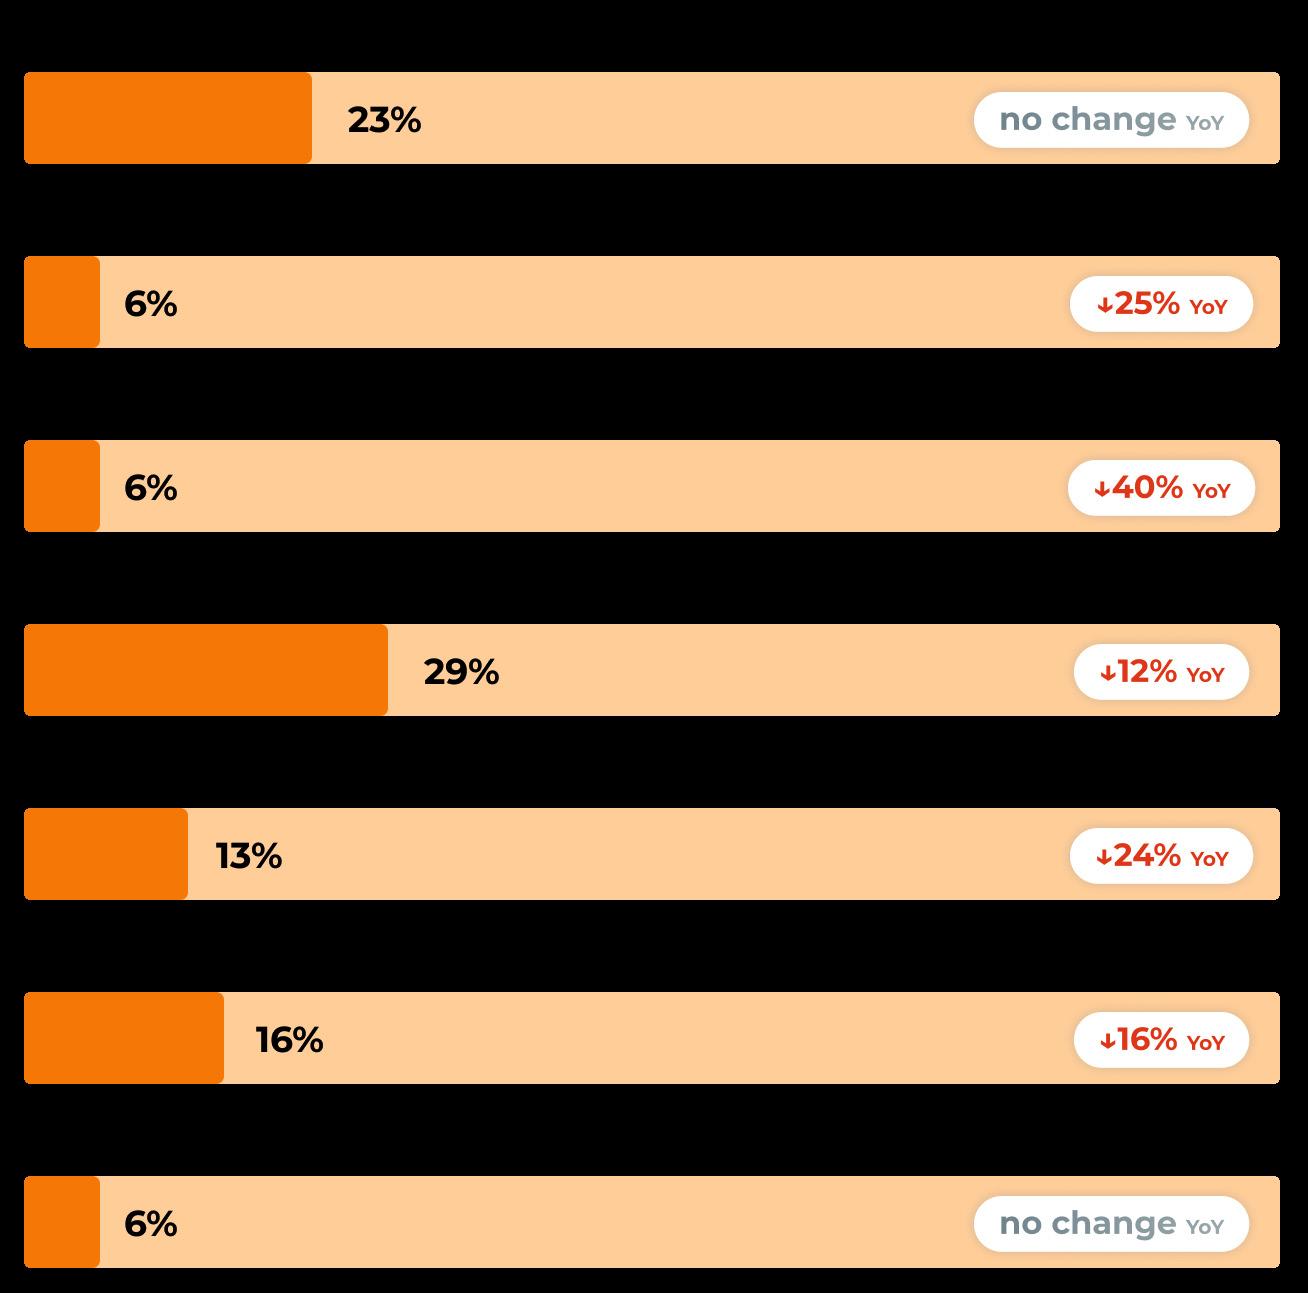
Enterprise-level brands, conversely, have increased their investment in many of these options, with Amazon Vine usage seeing the highest year-over-year increase.
Advertising and marketing tool usage by type: Enterprise brands*
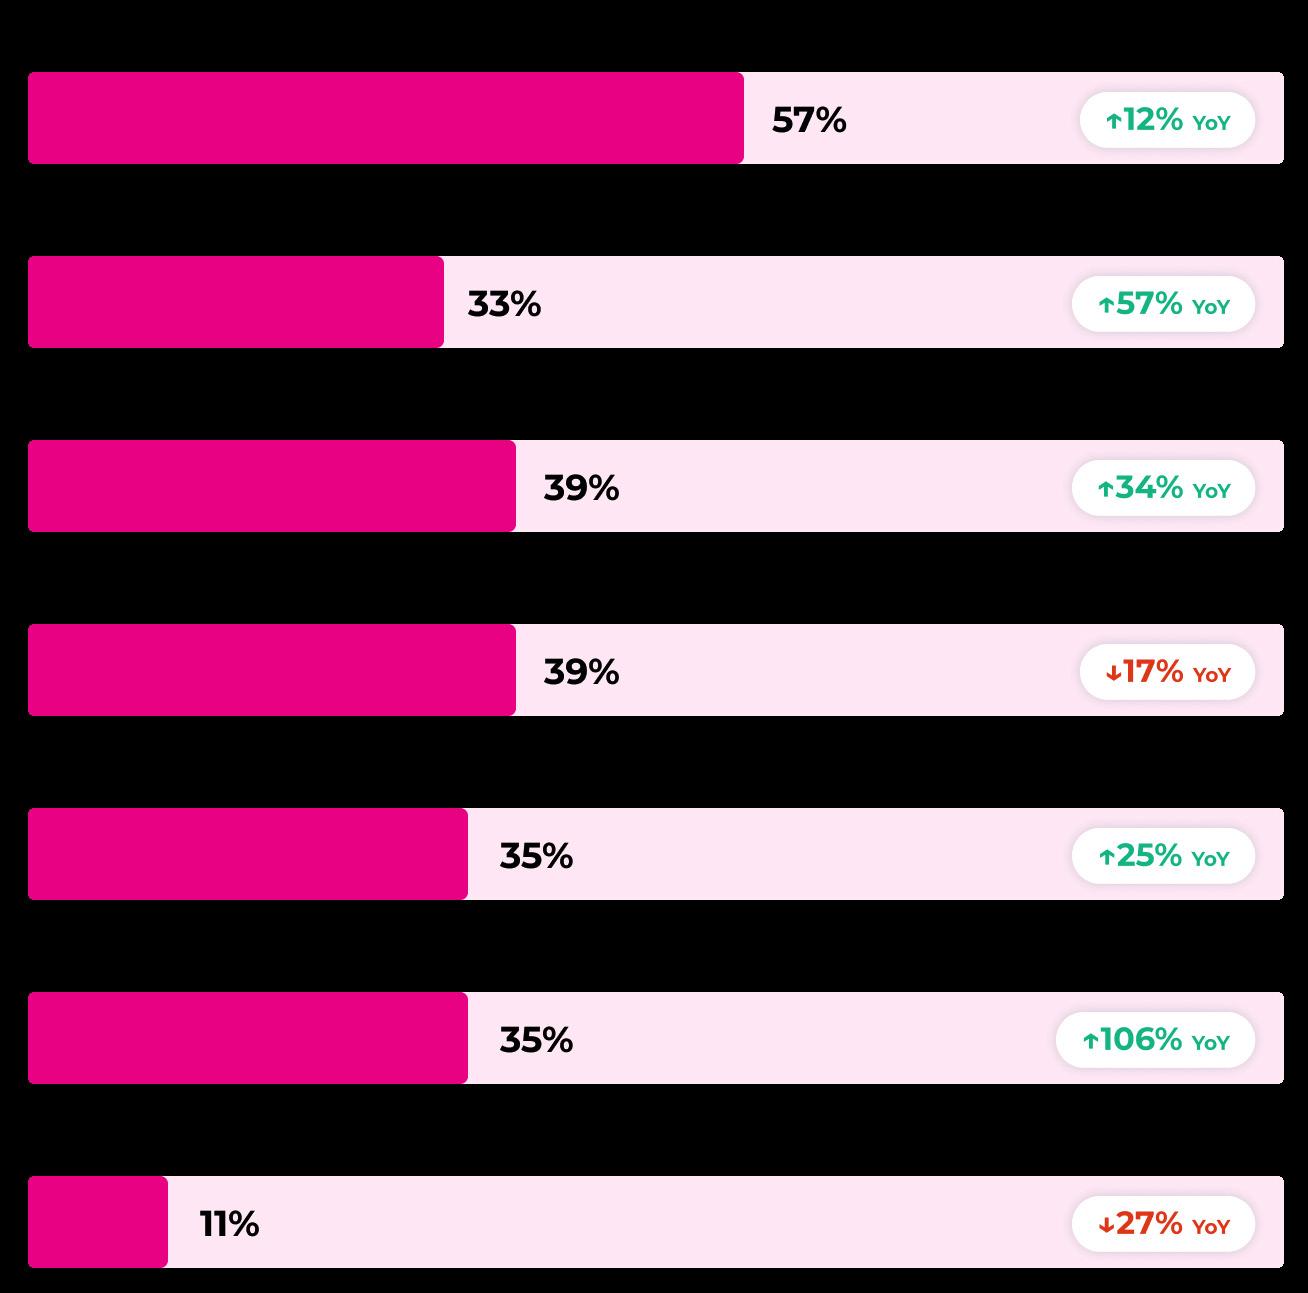
*Survey respondents could select multiple responses; as such, percentages in the above sections do not total 100%.
12 Amazon Advertisng Report 2024 |
01. THE AMAZON ADVERTISING LANDSCAPE
Omnichannel advertising: Google + Amazon
Having an off-Amazon customer engagement strategy has become increasingly popular — and important — to successfully sell on Amazon.
Google Ads are one of the most powerful options for brands, especially considering the large portion of consumers that turn to Google first when searching for a product online.
Google ads also provide deeper insights into a brand’s target audience, providing metrics that Amazon advertising doesn’t, such as new-tobrand (NTB) sales. Because Google is in the middle of the funnel, most of the KPIs are different than bottom-of-the-funnel channels like Amazon Ads.
Amazon Advertising KPIs Google Advertising KPIs
Return on Ad Spend (RoAS)
Total Sales
Advertising Cost of Sale (ACoS)
Source: Jungle Scout’s Q1 2024 Consumer Trends Report
Search engines like Google are the second most popular place for consumers to start online product searches (behind Amazon) and the third most popular place for brands and sellers to advertise their products.
Conversion Rate (CVR) → → → →
Source: Ampd
42% 36% 72% of consumers start their online product searches on Google or another search engine. of Amazon brands and sellers advertise their products on Google or another search engine. of all conversions from Google ads directing to Amazon are new-to-brand customers
Source: Jungle Scout’s 2024 State of the Amazon Seller Report
Click Through Rate (CTR)
Add to Cart Rate (ATC)
Cost Per Click (CPC)
Conversion Rate (CVR)
Learn more about how brands use Google ads to build awareness and drive sales on Amazon in Chapter 5
13 Amazon Advertisng Report 2024 |
01. THE AMAZON ADVERTISING LANDSCAPE
CHAPTER 2
Amazon Advertising Spend
A deeper look into advertising spend on Amazon reveals key insights into how brands, agencies, and sellers are using the platform to market their products. Based on Jungle Scout Cobalt data, this chapter breaks down advertising spend by marketplace, ad product, ad targeting type, and product price.
Spend by Marketplace
Among more than 20 marketplaces measured in Jungle Scout’s ecommerce database, advertising spend in the U.S. far outweighs that of any other country.
Marketplace spending on Amazon advertising by % of total
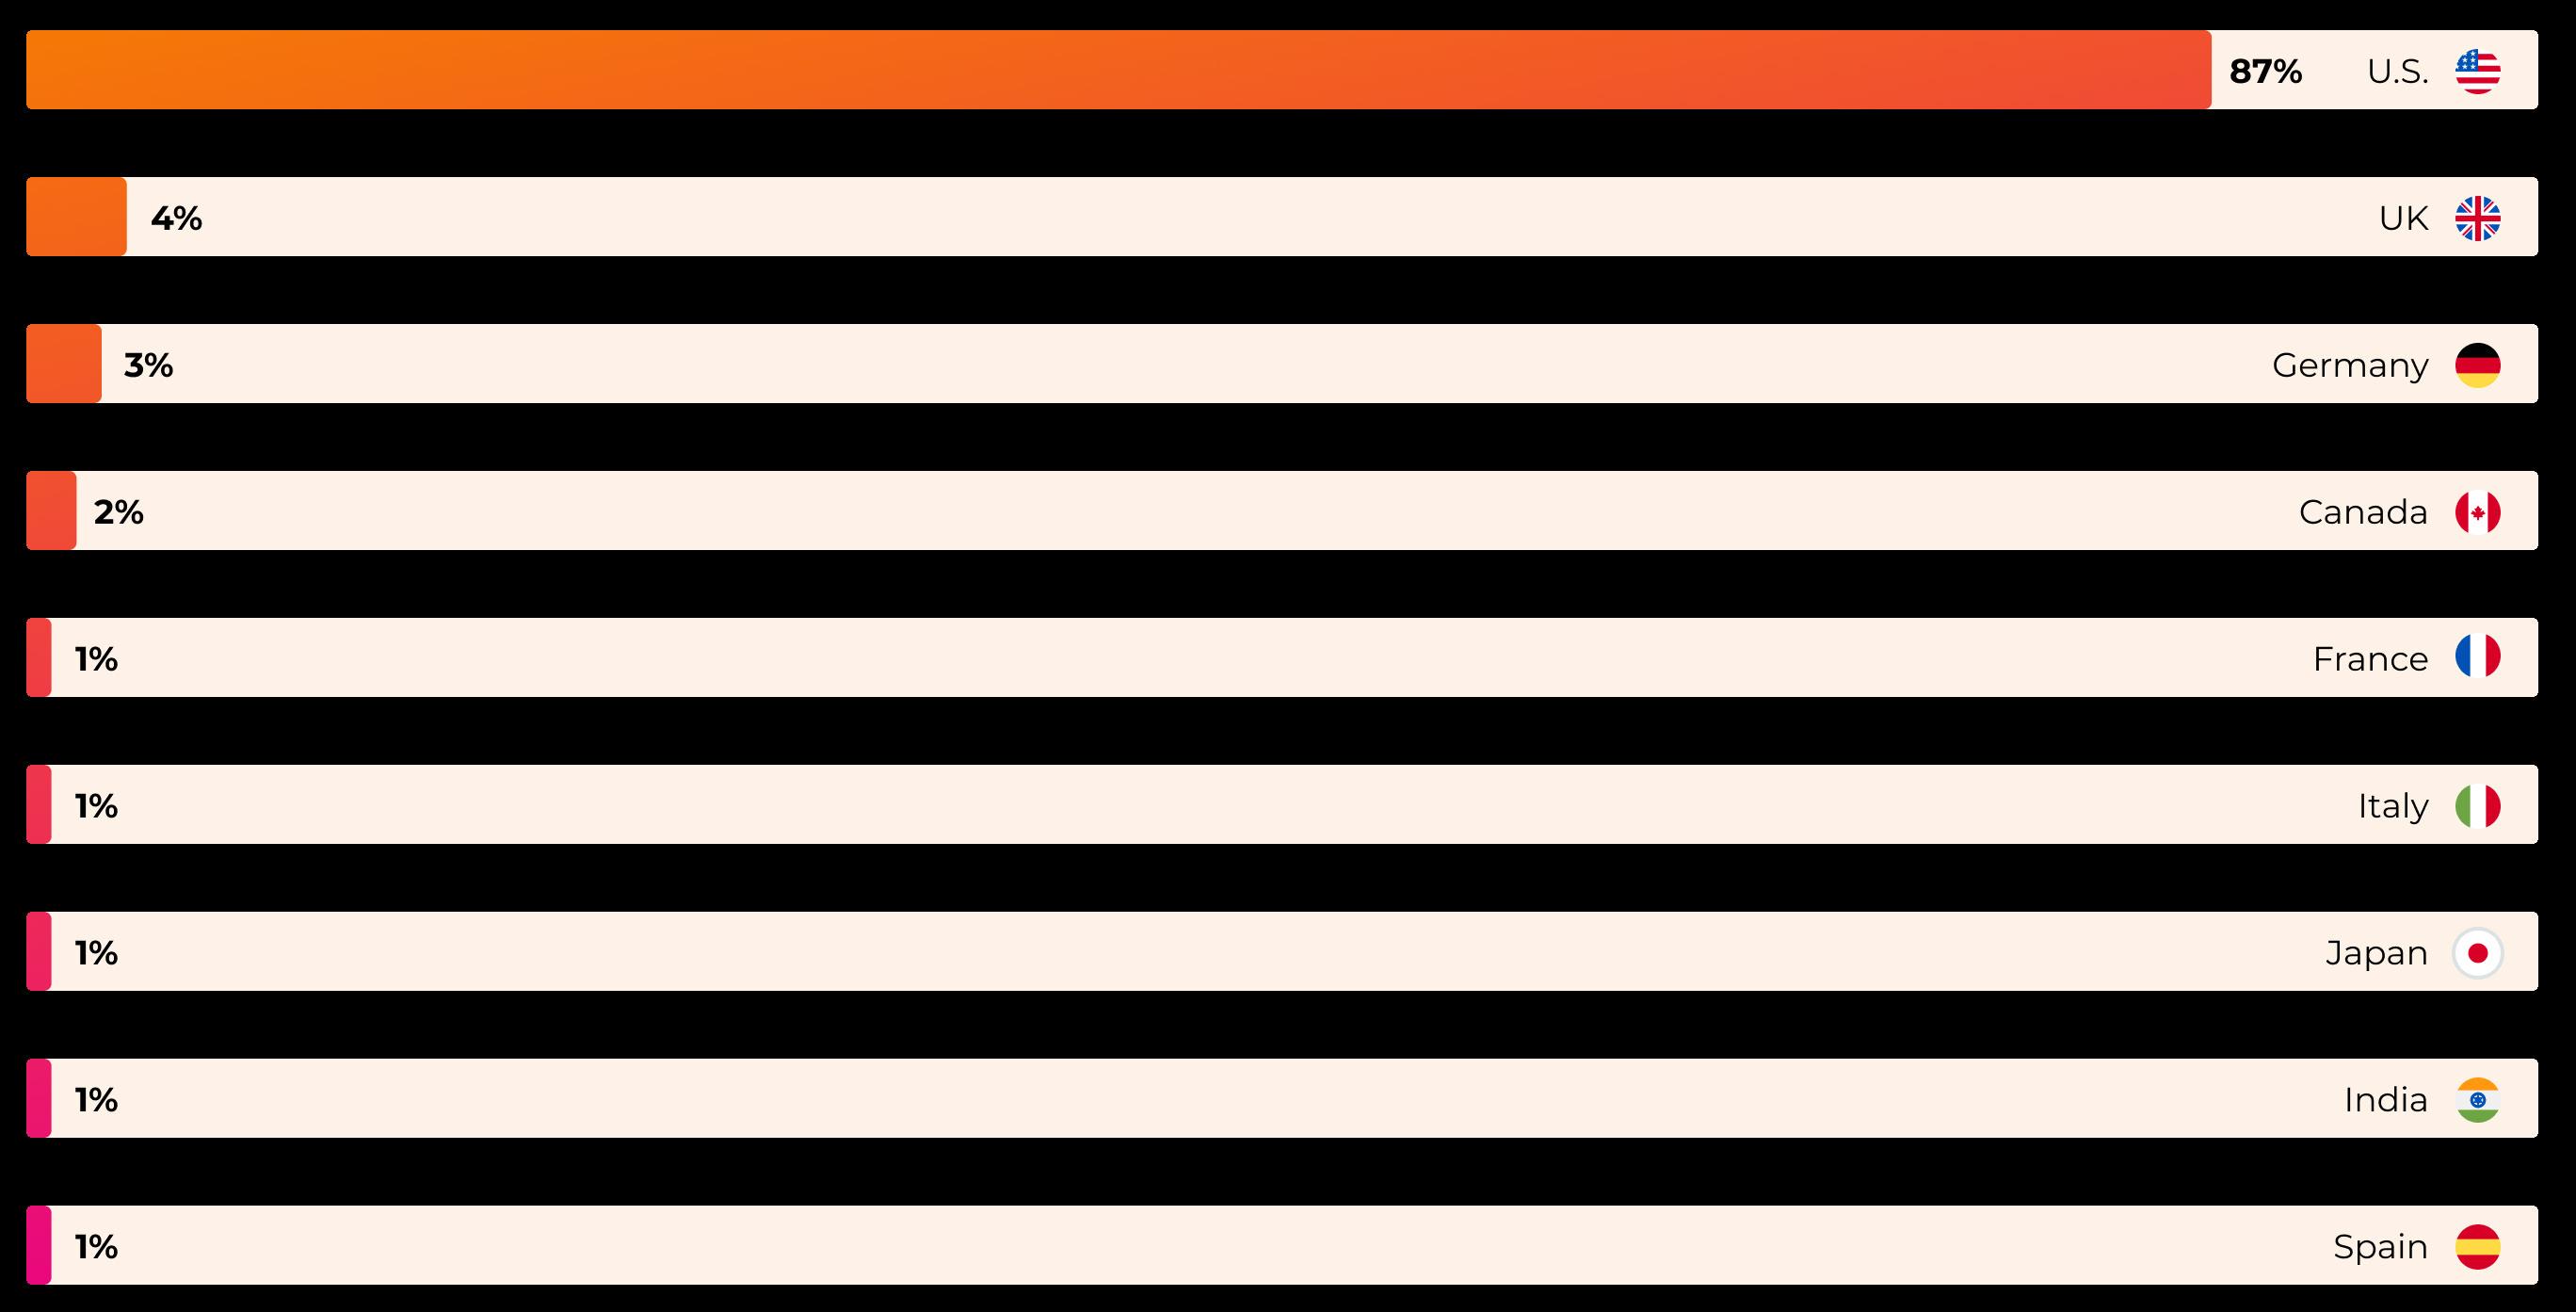
Markets with less than 1% share of advertising spend: United Arab Emirates, Australia, Mexico, Brazil, Saudi Arabia, Netherlands, Turkey, Sweden, Egypt, Singapore, Poland, Belgium
15 Amazon Advertisng Report 2024 |
02. AMAZON ADVERTISING SPEND
Spend by Ad Product
The majority of Amazon advertising spend is allocated to Sponsored Products, which allows brands to manually or automatically target keywords relevant to their audiences. These ads require advertisers to pay only when a shopper clicks. They also span a wide variety of goals, from increasing visibility to showcasing top-performing items.
For a detailed description of the ad products mentioned in this section, refer to the digital advertising glossary
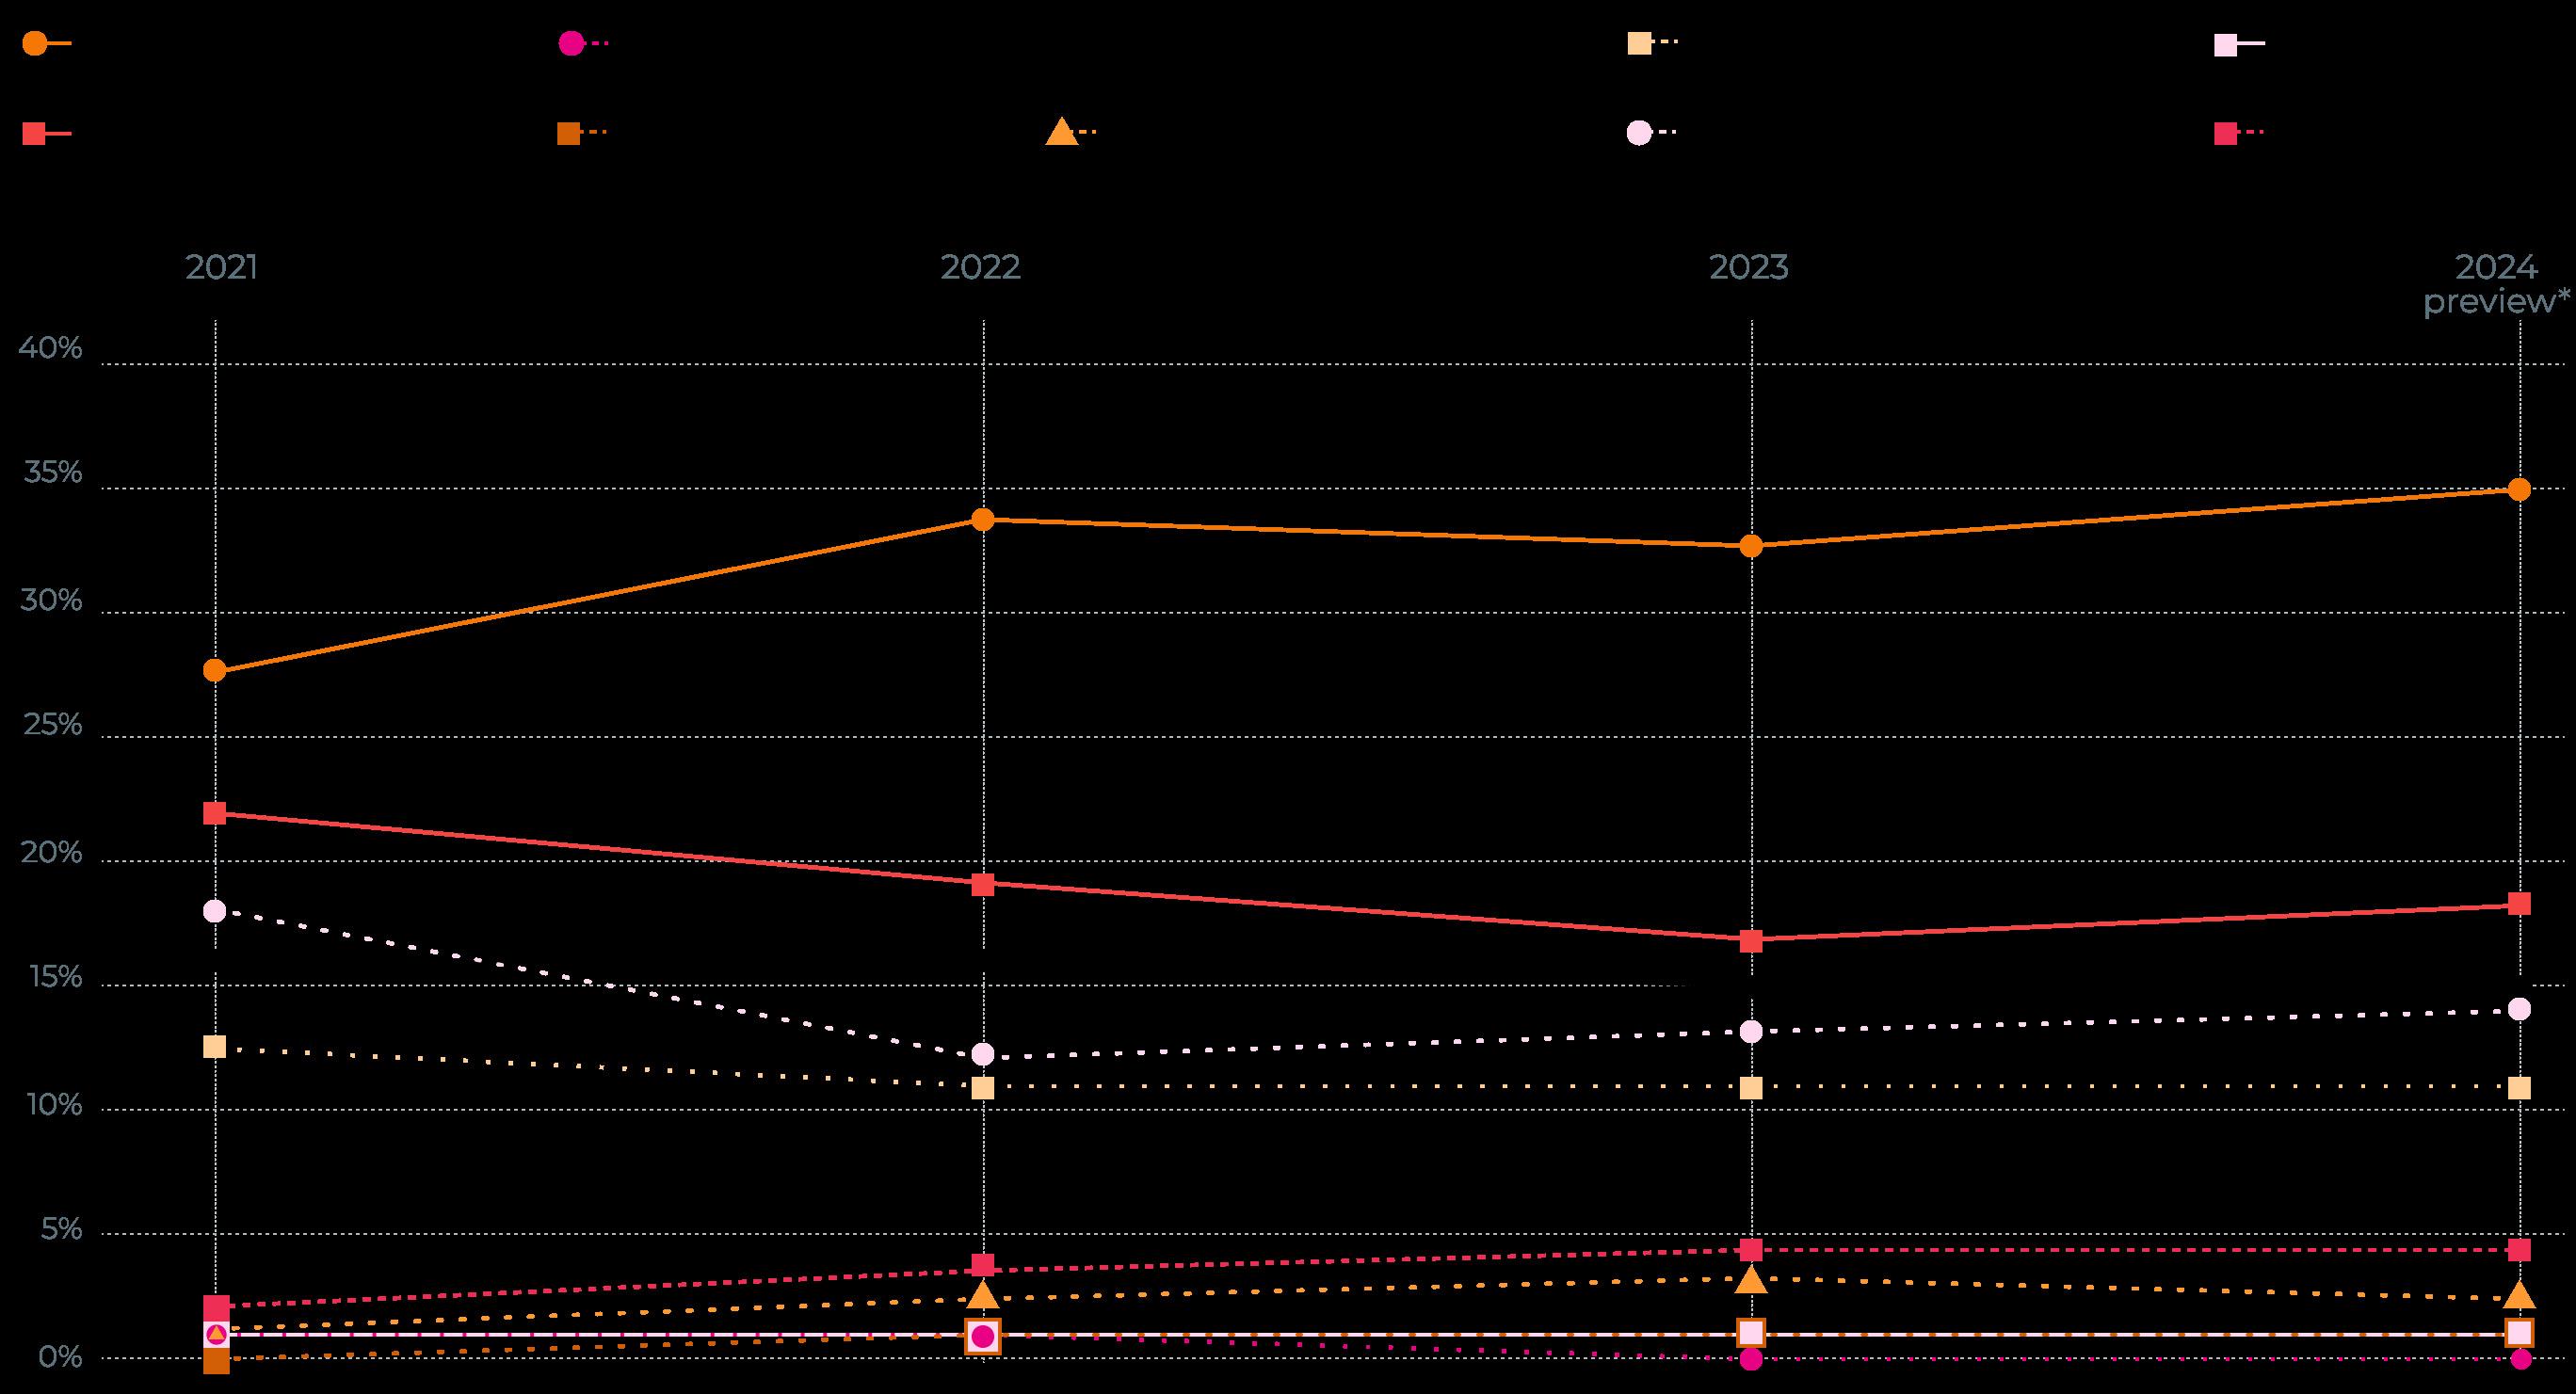
Trending share of ad spend by Amazon ad product 2018-2022*
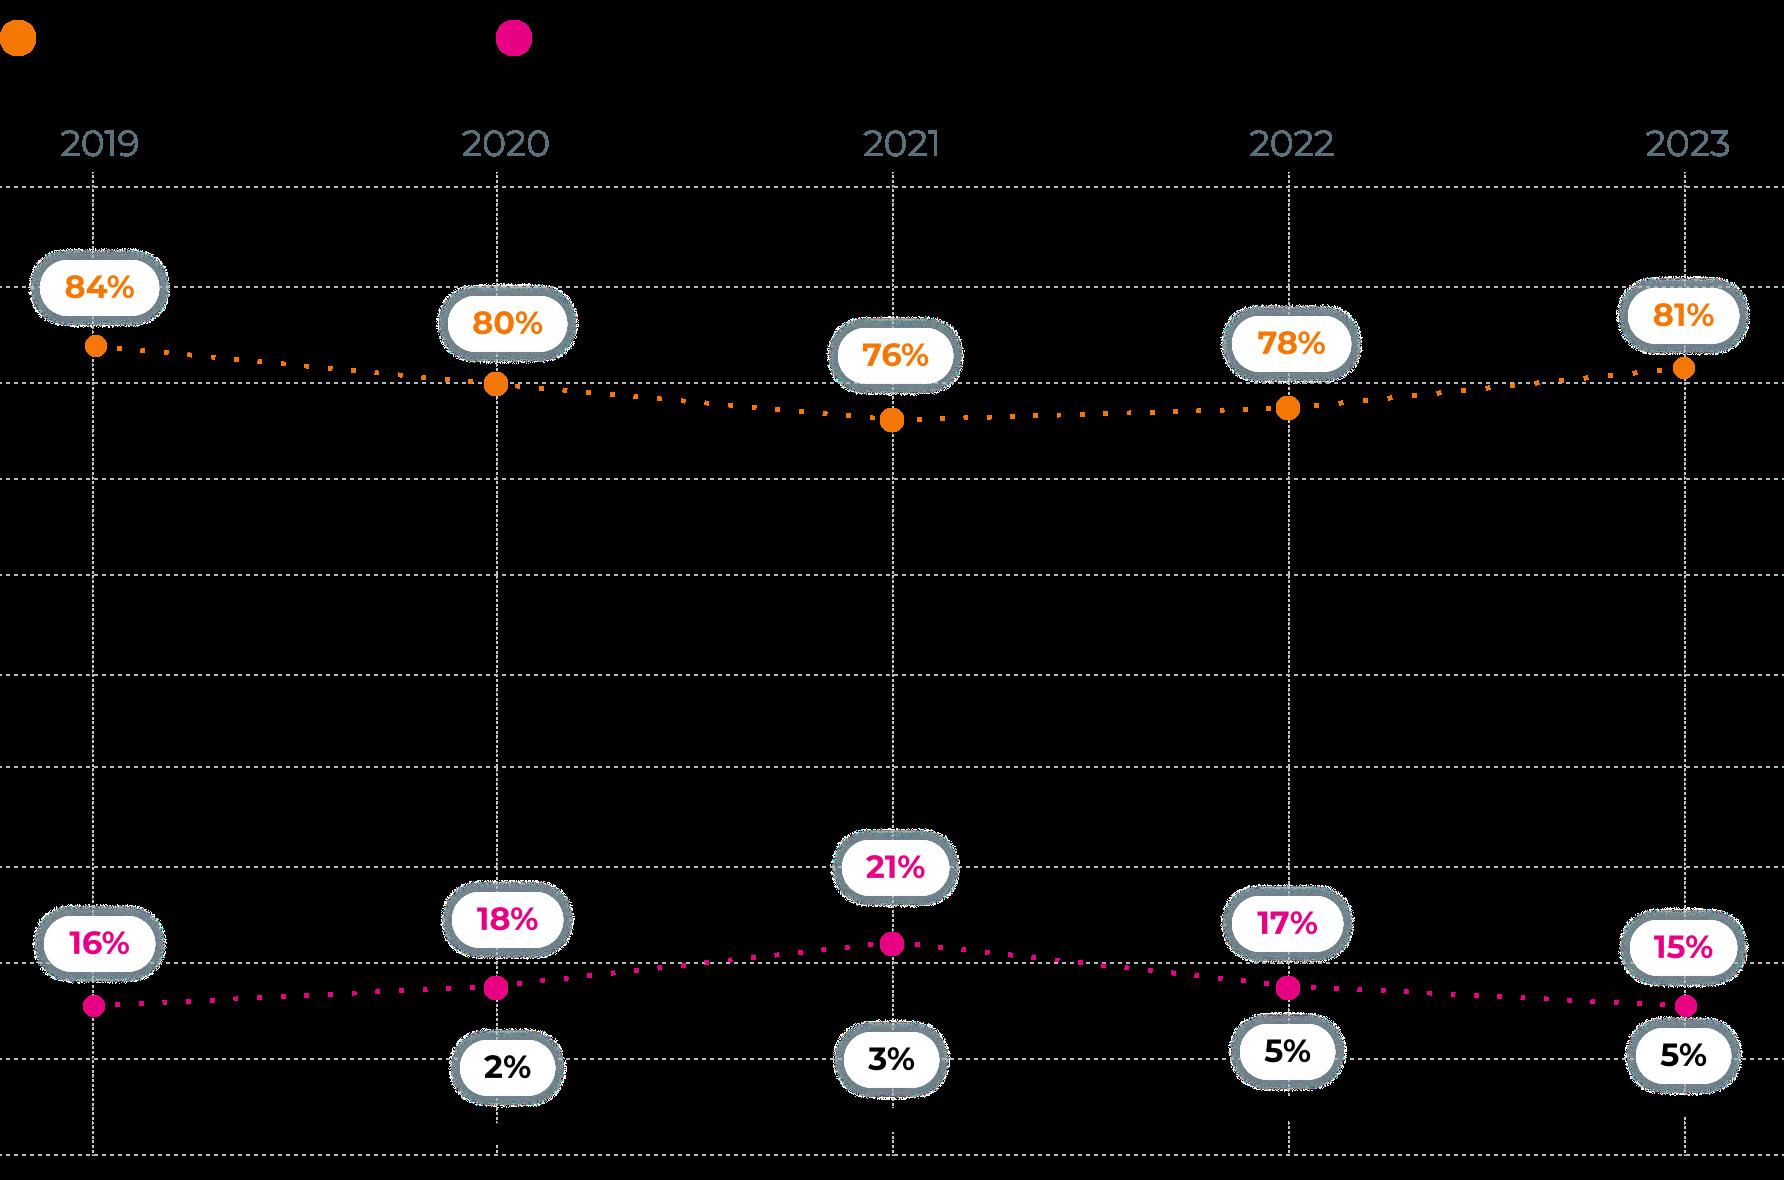
*Sponsored Display ads were introduced in 2019
INSIGHTS
Data from January - March 2024 shows Sponsored Display ads with a 4% share of advertising dollars, Sponsored Brands with 14%, and Sponsored Products with 82% in Q1 2024.
INSIGHTS
Spend for Sponsored Brands dropped from 17% to 15%, while Sponsored Display ad spend remained consistent from 2022 to 2023.
16 Amazon Advertisng Report 2024 |
02. AMAZON ADVERTISING SPEND
Spend by Ad Targeting Type
There are two targeting strategies for Sponsored Products:
Manual targeting
Advertisers handpick keywords to bid on and the products they want to advertise. Ads show only if the shopper’s search query matches keywords in the campaign.
Automatic targeting
Advertisers select the products they want to advertise and set a campaign budget. This strategy requires an ASIN, a date range, and a CPC bid. Amazon finds relevant keywords using ASIN metadata.
Within automatic targeting, there are four different match types:
Close match
Ads shown to shoppers who use search terms closely related to an advertiser’s products.
Loose match
Ads shown when shoppers use search terms loosely related to an advertiser’s products.
Substitutes
Ads shown to shoppers considering substitutes for an advertiser’s product (e.g., Reebok tennis shoes vs. Nike).
Complements
Ads shown to shoppers who view the detail pages of products that complement an advertiser’s products (e.g., a baseball glove to go with a baseball).
Advertisers can improve the relevance of their ads by targeting single products or categories or by targeting shoppers based on past behaviors:
Category targeting
Target entire categories within Amazon’s verticals, like Pet Supplies or Clothing.
ASIN targeting
Target specific products using ASINs (10-character standard product identification number assigned by Amazon).
Audience targeting
Target custom audiences, such as people who viewed certain product detail pages.
Views remarketing
Retarget shoppers who have previously viewed an advertiser’s product listings.
Purchases
Target shoppers based on their purchasing behavior.
Similar product
Target shoppers who are browsing products similar to an advertiser’s products.
17 Amazon Advertisng Report 2024 |
02. AMAZON ADVERTISING SPEND
Advertisers spent the most on ASIN ad targeting in 2023, consistent with trends from the previous two years. Overall, ad spend remained fairly steady across all targeting and match types year-over-year.For a detailed description of the ad products mentioned in this section, refer to the digital advertising glossary.
Targeting/match type by % of total ad spend
*2024 figures represent partial year data (January - March)
18 Amazon Advertisng Report 2024 |
02. AMAZON ADVERTISING SPEND
Spend by Product Price
The largest share of 2023 ad dollars went to promoting products priced at $50 or more, with spend on $21-30 products close behind.
Product price range by % of total ad spend
*2024 figures represent partial year data (January - March)
INSIGHTS
Early 2024 data shows ad spend on $21-30 products outpacing spend on products above $50. This deviates from trends for the previous three years, where advertisers dedicated the most ad spend to products in the highest price bracket.
19 Amazon Advertisng Report 2024 |
02. AMAZON ADVERTISING SPEND
CHAPTER 3
Return on Ad Spend (RoAS)
Amazon’s ability to measure the precise number of sales generated by advertising dollars is unique among broader search and social platforms, giving advertisers greater confidence in their investments. This chapter provides an overview of those returns – referred to as return on ad spend (RoAS).
Effective Advertising on Amazon: Measuring RoAS
What is RoAS?
RoAS measures the impact of digital ad campaigns by showing how many dollars of revenue were generated from a single dollar spent on advertising.
It is calculated by dividing total attributed sales by the total cost of the ad campaign(s).
Why measure RoAS?
RoAS allows brands and sellers to evaluate which advertising strategies perform best and where to make adjustments. Advertisers often use different RoAS targets for different types of products. Generally, a high RoAS is better for profitability.
RoAS is particularly crucial for bottom-of-funnel efforts — like Amazon PPC ads. Because these ads are served to consumers at the most highintent phase of their purchase journey, KPIs for Amazon PPC campaigns are heavily focused on conversion metrics, including return on ad spend.
How does RoAS compare to ACoS and TACoS?
RoAS is the inverse of Advertising Cost of Sales, or ACoS, which is calculated by dividing the total cost of a campaign by total attributed sales.
Ads targeting earlier stages of the purchase journey — such as the mid-funnel research and consideration phase — focus heavily on engagement metrics. For Google ads, for example, KPIs include clickthrough rates, add-to-carts, and cost per click over return on ad spend.
Learn how Amazon PPC campaigns and Google ads can work together in Chapter 5
ACoS focuses on a single campaign, while Total Advertising Cost of Sales (TACoS) takes into account the costs associated with all of a brand’s campaigns.
21 Amazon Advertisng Report 2024 |
03. RETURN ON AD SPEND (ROAS) ROAS = ROAS = TOTAL ATTRIBUTED SALES 1 TOTAL COST OF AD CAMPAIGN ACOS
RoAS by Ad Product
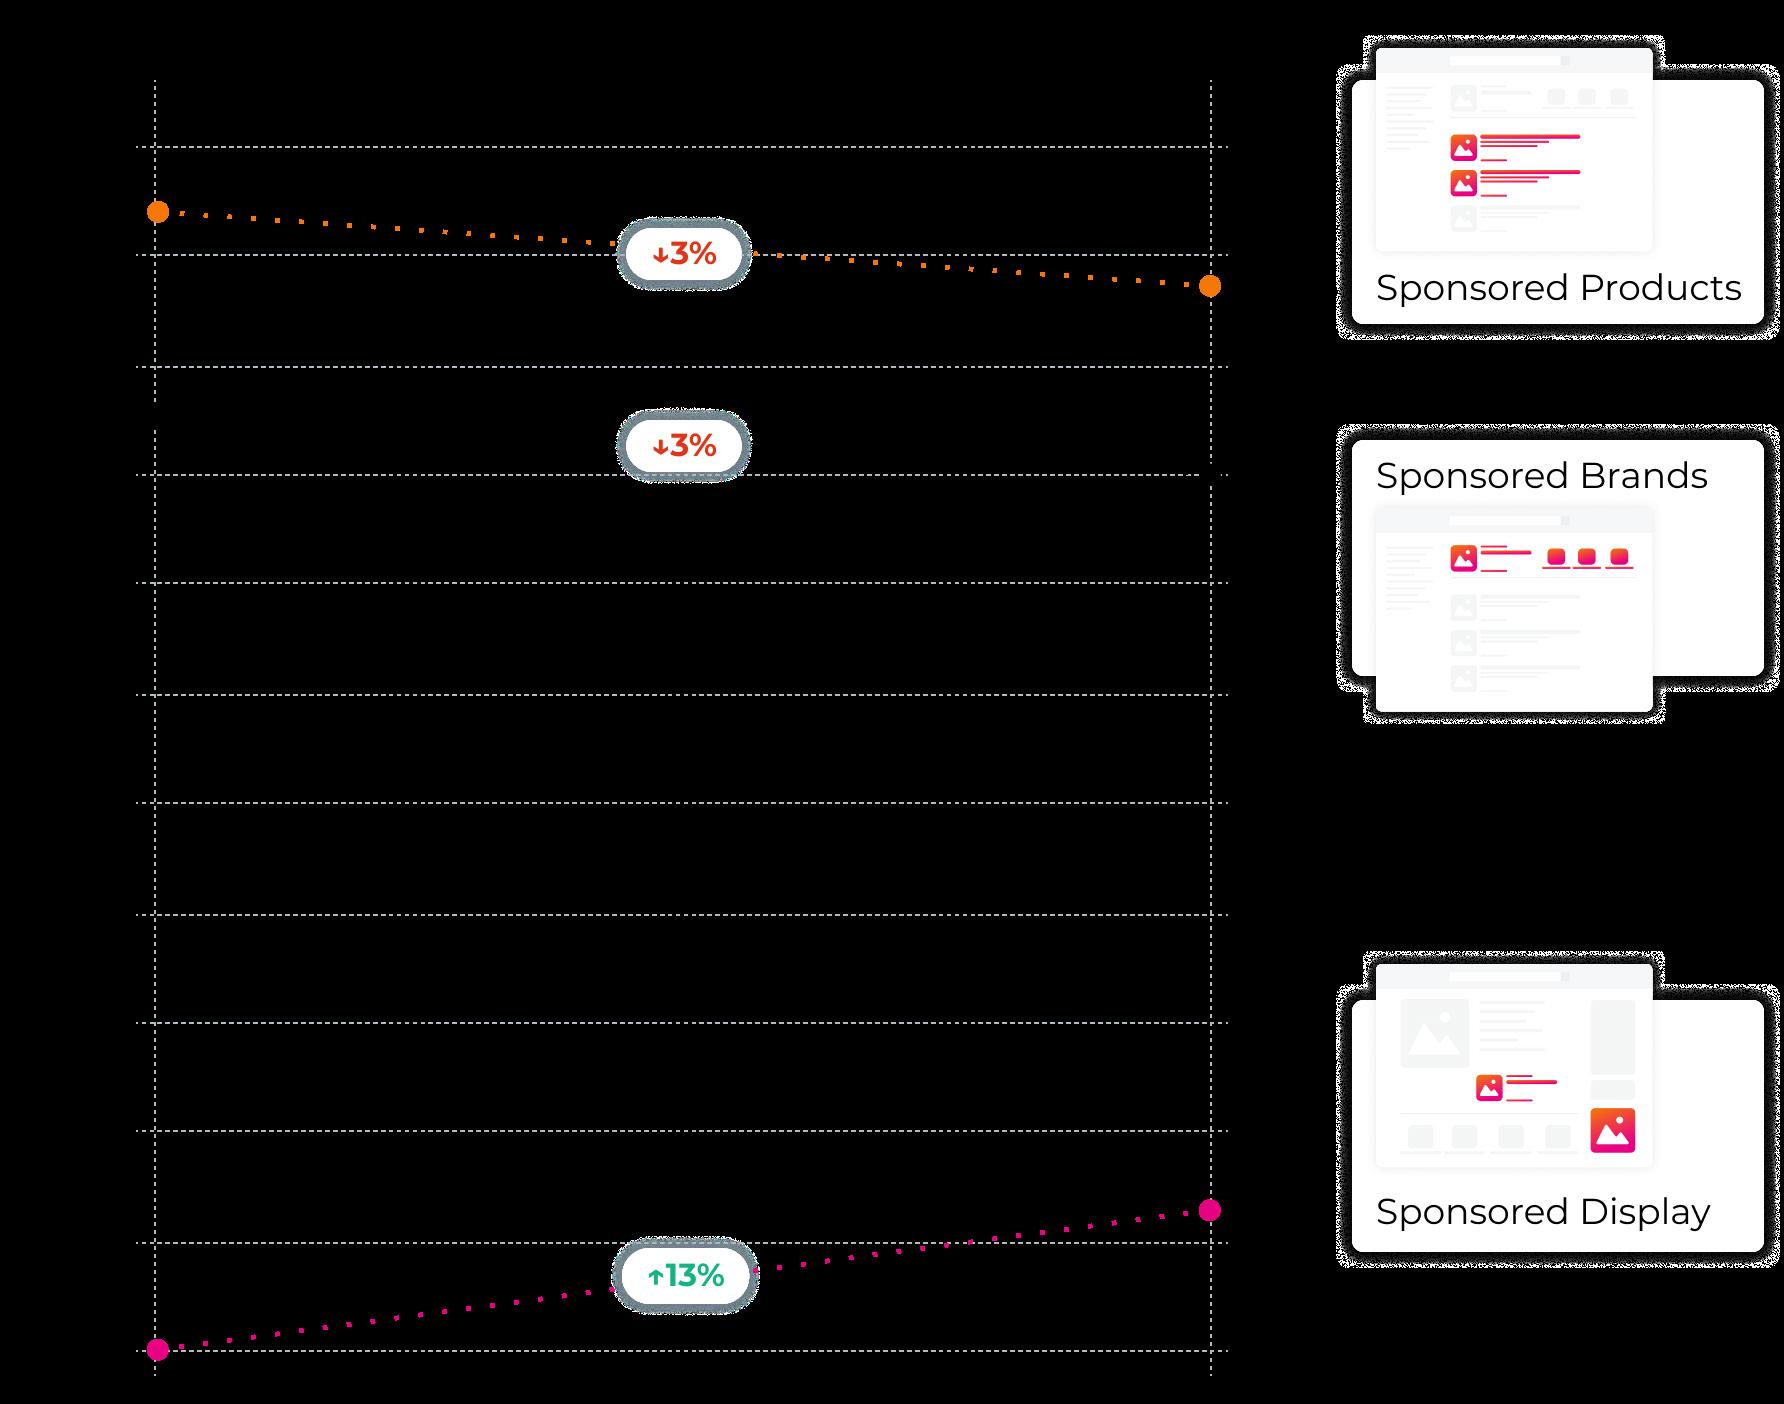
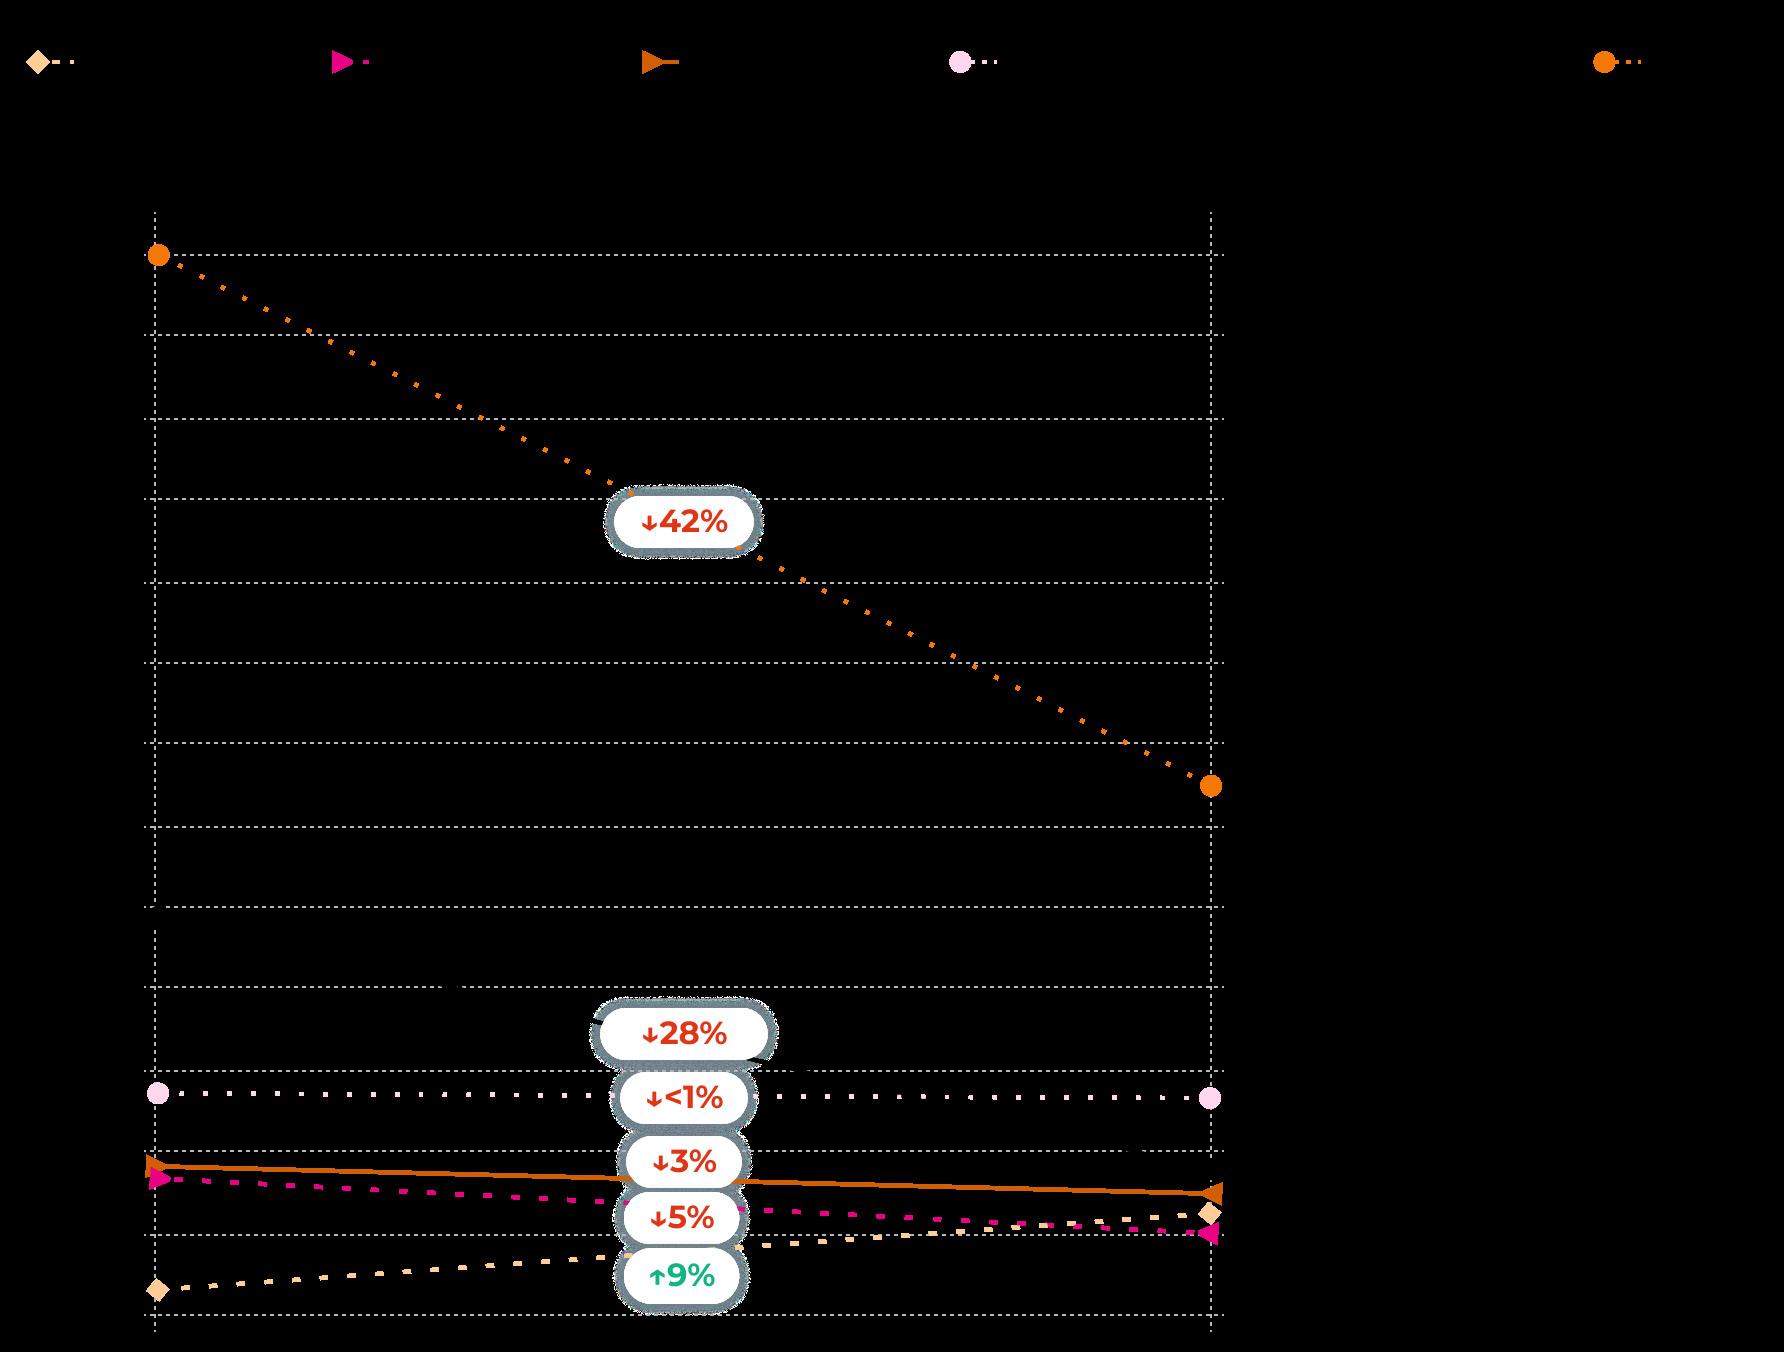
RoAS for Amazon Sponsored Brands and Sponsored Products dropped year-over-year, while RoAS for Sponsored Display increased by 13%. Since 2019, RoAS for Sponsored Products has dipped 21%, and RoAS for Sponsored Brands has decreased by 45%. Over the same period, however, RoAS for Sponsored Display has seen the biggest change — with an increase of nearly 70%.
Average 14-day RoAS by Amazon ad product
INSIGHTS
Early 2024 data (January - March) shows this year’s trends aligning with the previous two years, with Sponsored Products delivering the highest RoAS ($3.41), followed by Sponsored Brands ($3.06) and Sponsored Display ($1.85).
22 Amazon Advertisng Report 2024 |
03. RETURN ON AD SPEND (ROAS)
RoAS by Ad Targeting Type
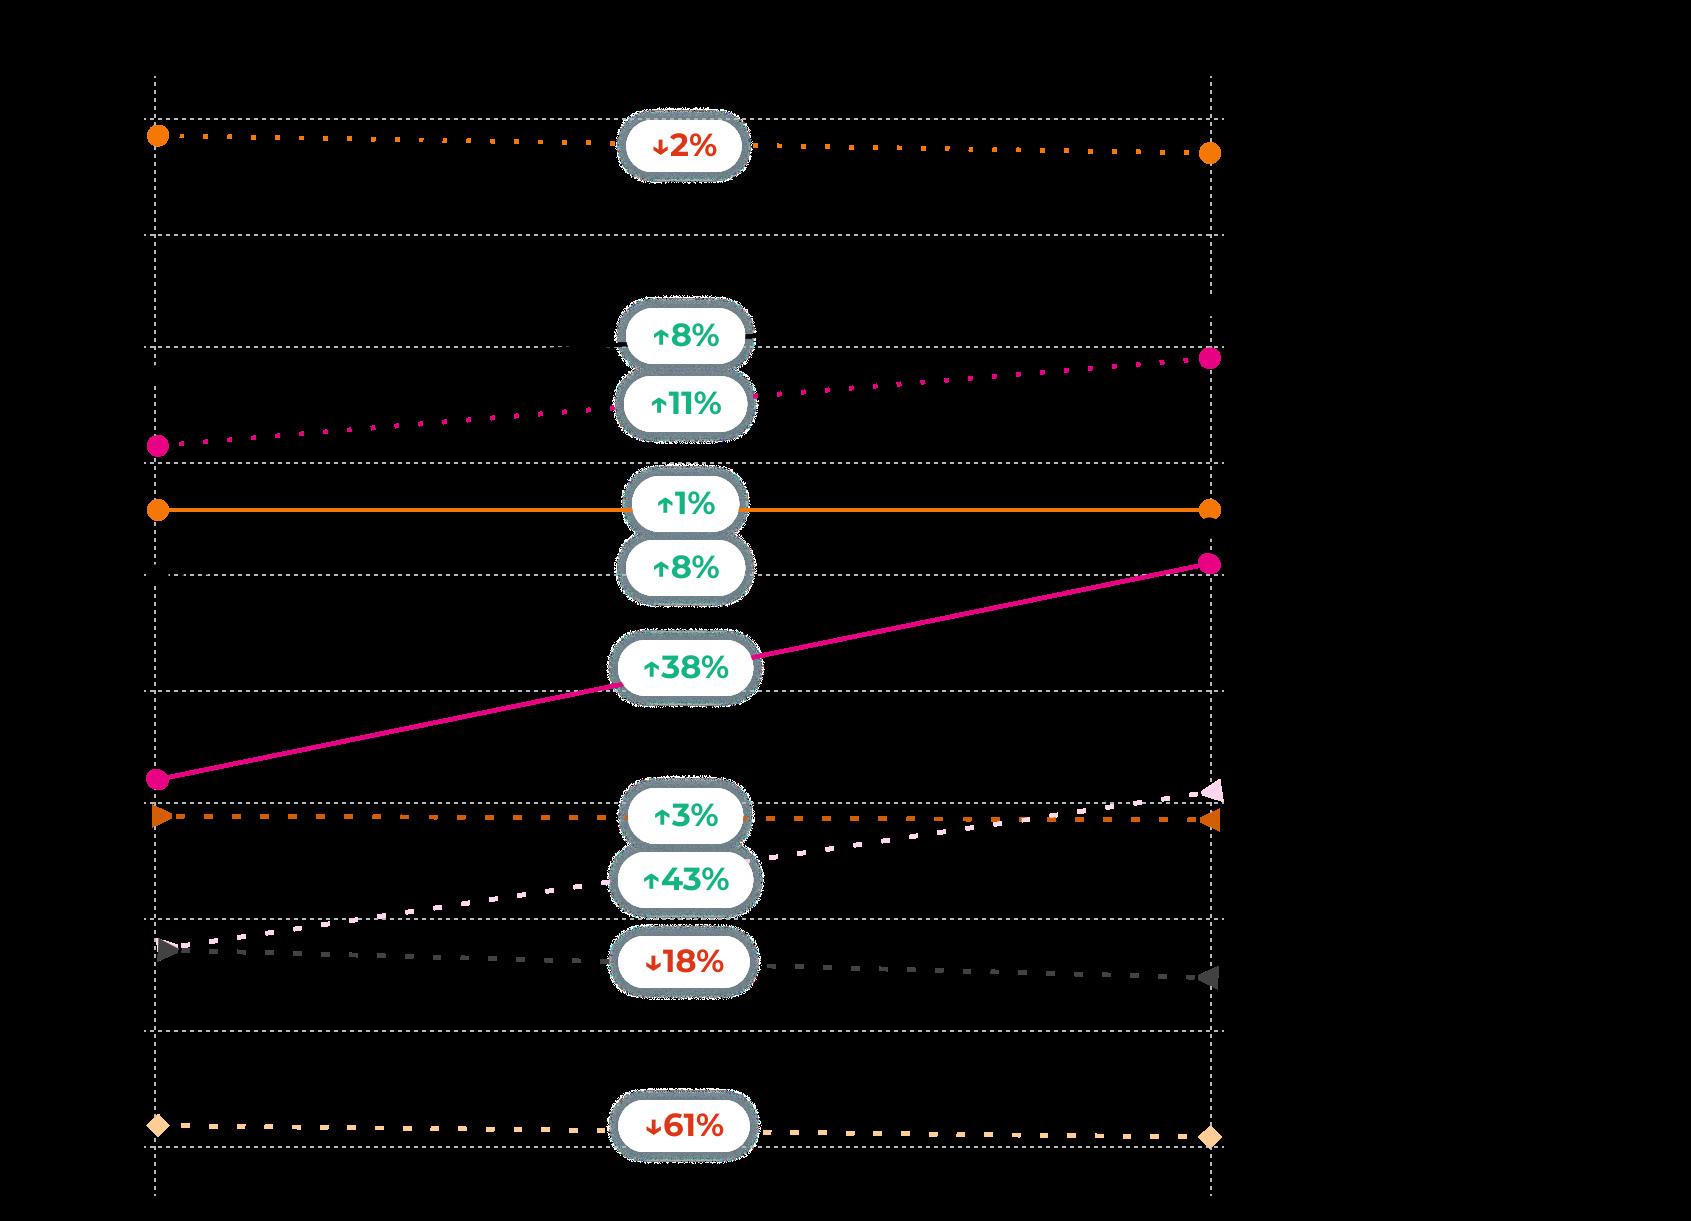
Returns trended upward for a majority of ad targeting types in 2023, with Purchases seeing the largest increase (43%). Three targeting types saw declines, with Audience targeting experiencing the most significant decline at over 60%.
It was Close Match targeting, however, that delivered the highest actual RoAS in 2023 ($4.35), despite RoAS falling by 2% year-overyear. ASIN and Loose Match targeting were the only other targeting types to achieve a RoAS of $3.00 or more.
Early 2024 data shows trends largely holding steady compared to 2023, with Close Match ($4.07), ASIN ($3.57), and Loose Match ($3.40) targeting taking the top spots for actual RoAS.
Average 14-day RoAS by ad targeting type
23 Amazon Advertisng Report 2024 |
03. RETURN ON AD SPEND (ROAS)
RoAS by Product Price
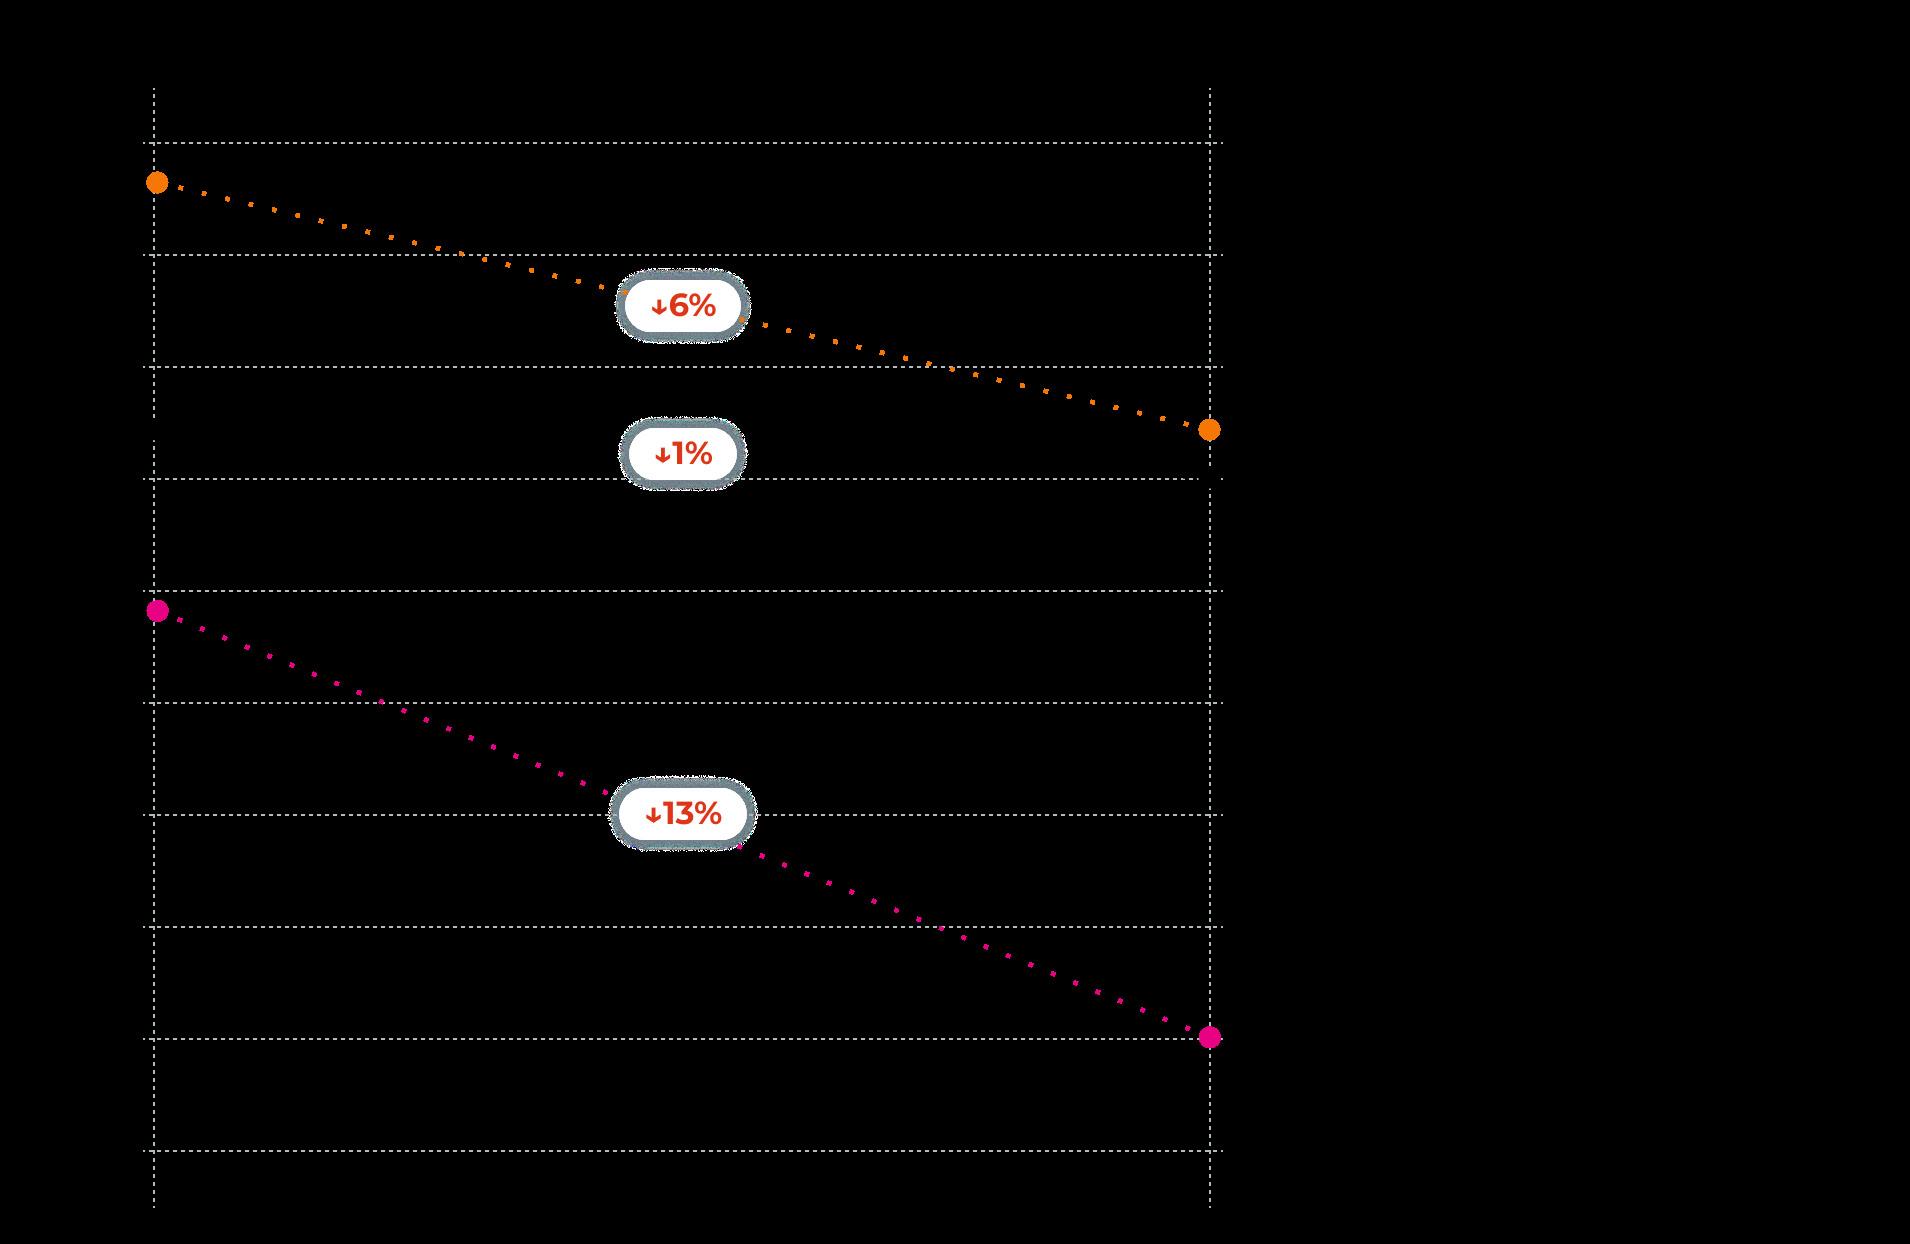
RoAS for products priced at $10 or less grew year-over-year, while RoAS for all other price ranges fell. This hints at consumer price sensitivity in 2023, which aligns with consumers’ reported ongoing financial and economic concerns like inflation and household income changes.
Actual RoAS generally coincides with product price, with those over $50 delivering the highest RoAS ($3.09) while lower-priced products ($20 and below) delivered the lowest.
Average 14-day RoAS by Amazon product price range
INSIGHTS
The year-over-year increase in RoAS for lower-priced products, which coincided with a significant decrease in RoAS for more expensive items, could be in part due to consumer spending caution. 79% of consumers say their spending has been affected by inflation, and 62% are worried about their finances.
Learn more in our Q1 2024 Consumer Trends Report.
24 Amazon Advertisng Report 2024 |
03. RETURN ON AD SPEND (ROAS)
RoAS by Bidding Strategy
Amazon offers various bidding strategies to allow more options for controlling ad spend and improving campaign performance. Advertisers who want to manage their bids can choose the “fixed bids” option. In contrast, advertisers focused on maximizing bid efficiency can choose from automated bidding strategies that adjust bids in real-time based on the likelihood of conversion.
Common bidding strategies for Amazon include:
Dynamic bids (down only) have the highest associated ad spend and attributed sales. However, when it comes to RoAS, a manual/fixed bidding strategy performed the best.
Dynamic bids (up and down) are when Amazon raises bids (by a maximum of 100%) in real-time when an ad may be more likely to convert a sale and lowers bids when they are less likely to convert a sale.
Fixed bids are when Amazon uses the exact bid and any manual adjustments an advertiser sets and won’t change based on the likelihood of a sale.
In 2023, dynamic up-and-down bidding strategies produced the highest RoAS, consistent with trends from the previous year. Year-over-year, RoAS was down across the board for all bidding strategies.
25 Amazon Advertisng Report 2024 |
03. RETURN ON AD SPEND (ROAS)
Average 14-day RoAS by bidding strategy
CHAPTER 4
Category Leaderboard (U.S.)
Product type has a huge impact on how brands and sellers advertise on Amazon – from budget size and allocation to the returns they see on their campaigns.
Congestion vs. Opportunity: Why Spend & RoAS Vary by Product Category
Total advertising spending and returns on those dollars can vary greatly across product categories, driven by competition and congestion in the market.
Health & Household, for example, is the category that saw the largest share of Amazon ad spend in 2023. This level of competition necessitates a higher investment of resources to rank in this category, in part pushing RoAS down. In 2023, ads for Health & Household products delivered the second-lowest RoAS across 23 categories.
Top 10 most competitive product categories*
Spend by Product Category
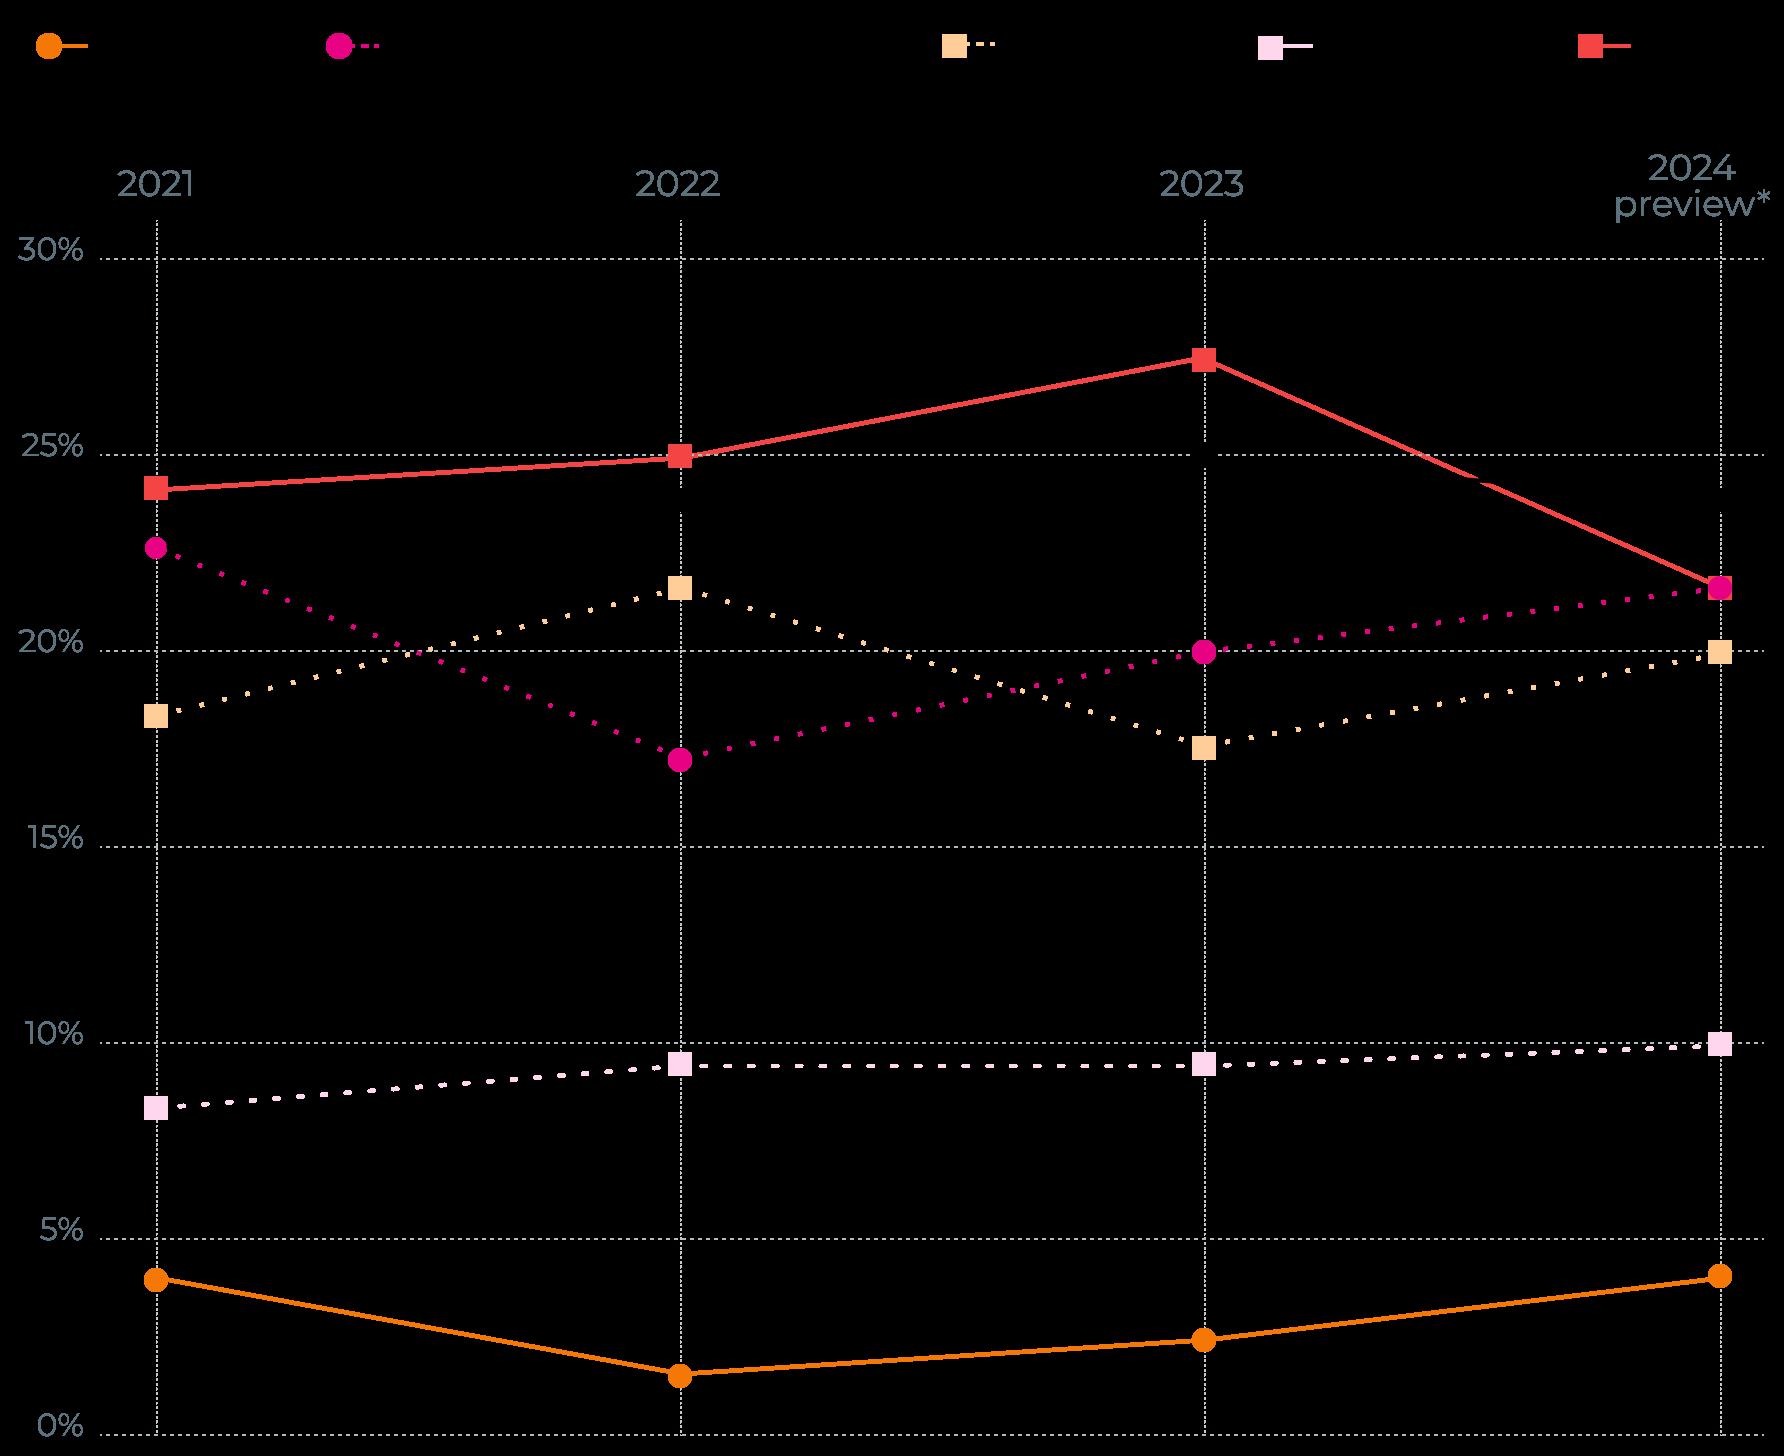
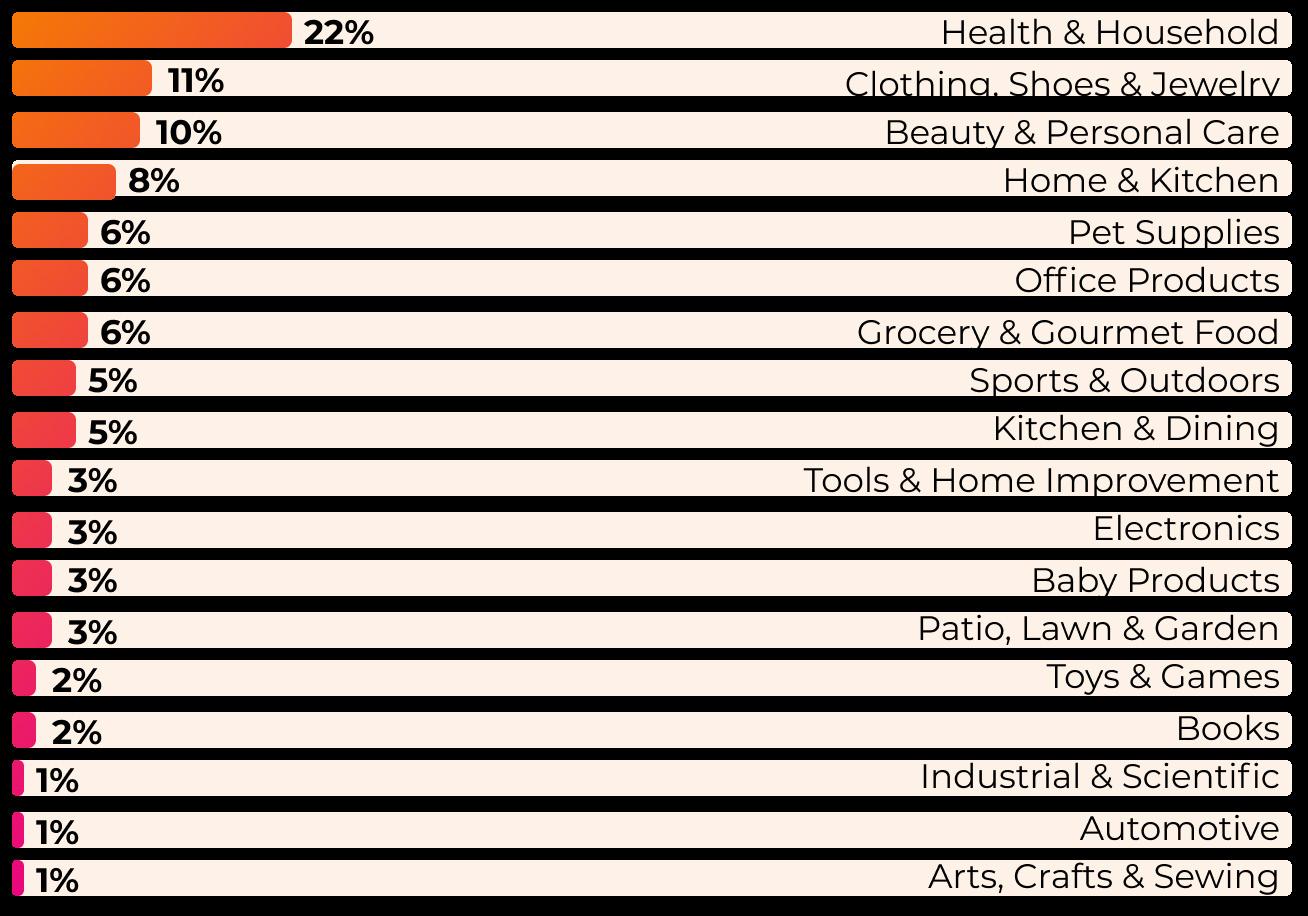
Health & Household remains the leader in terms of share of total advertising spend on Amazon in 2023, though spend fell from 27% to 22% year-over-year.
Clothing, Shoes & Jewelry was the category with the most significant year-over-year increase in share of ad spend, jumping from 6% in 2022 to 11% in 2023.
The largest decline was in the Pet Supplies category, where the share of ad spend dropped from 10% in 2022 to 6% in 2023.
Product category share of advertising spend
*Ranked by 2023 total number of distinct advertising campaigns.
Less than 1%: Musical Instruments, Video Games, Cell Phones & Accessories, Computers & Accessories, Appliances
27 Amazon Advertisng Report 2024 |
1. Health & Household 2. Office Products 3. Beauty & Personal Care 4. Grocery & Gourmet Food 5. Kitchen & Dining 6. Home & Kitchen 7. Sports & Outdoors 8. Clothing, Shoes & Jewelry 9. Tools & Home Improvement
Pet Supplies
10.
04. CATEGORY LEADERBOARD (U.S.)
RoAS by Product Category
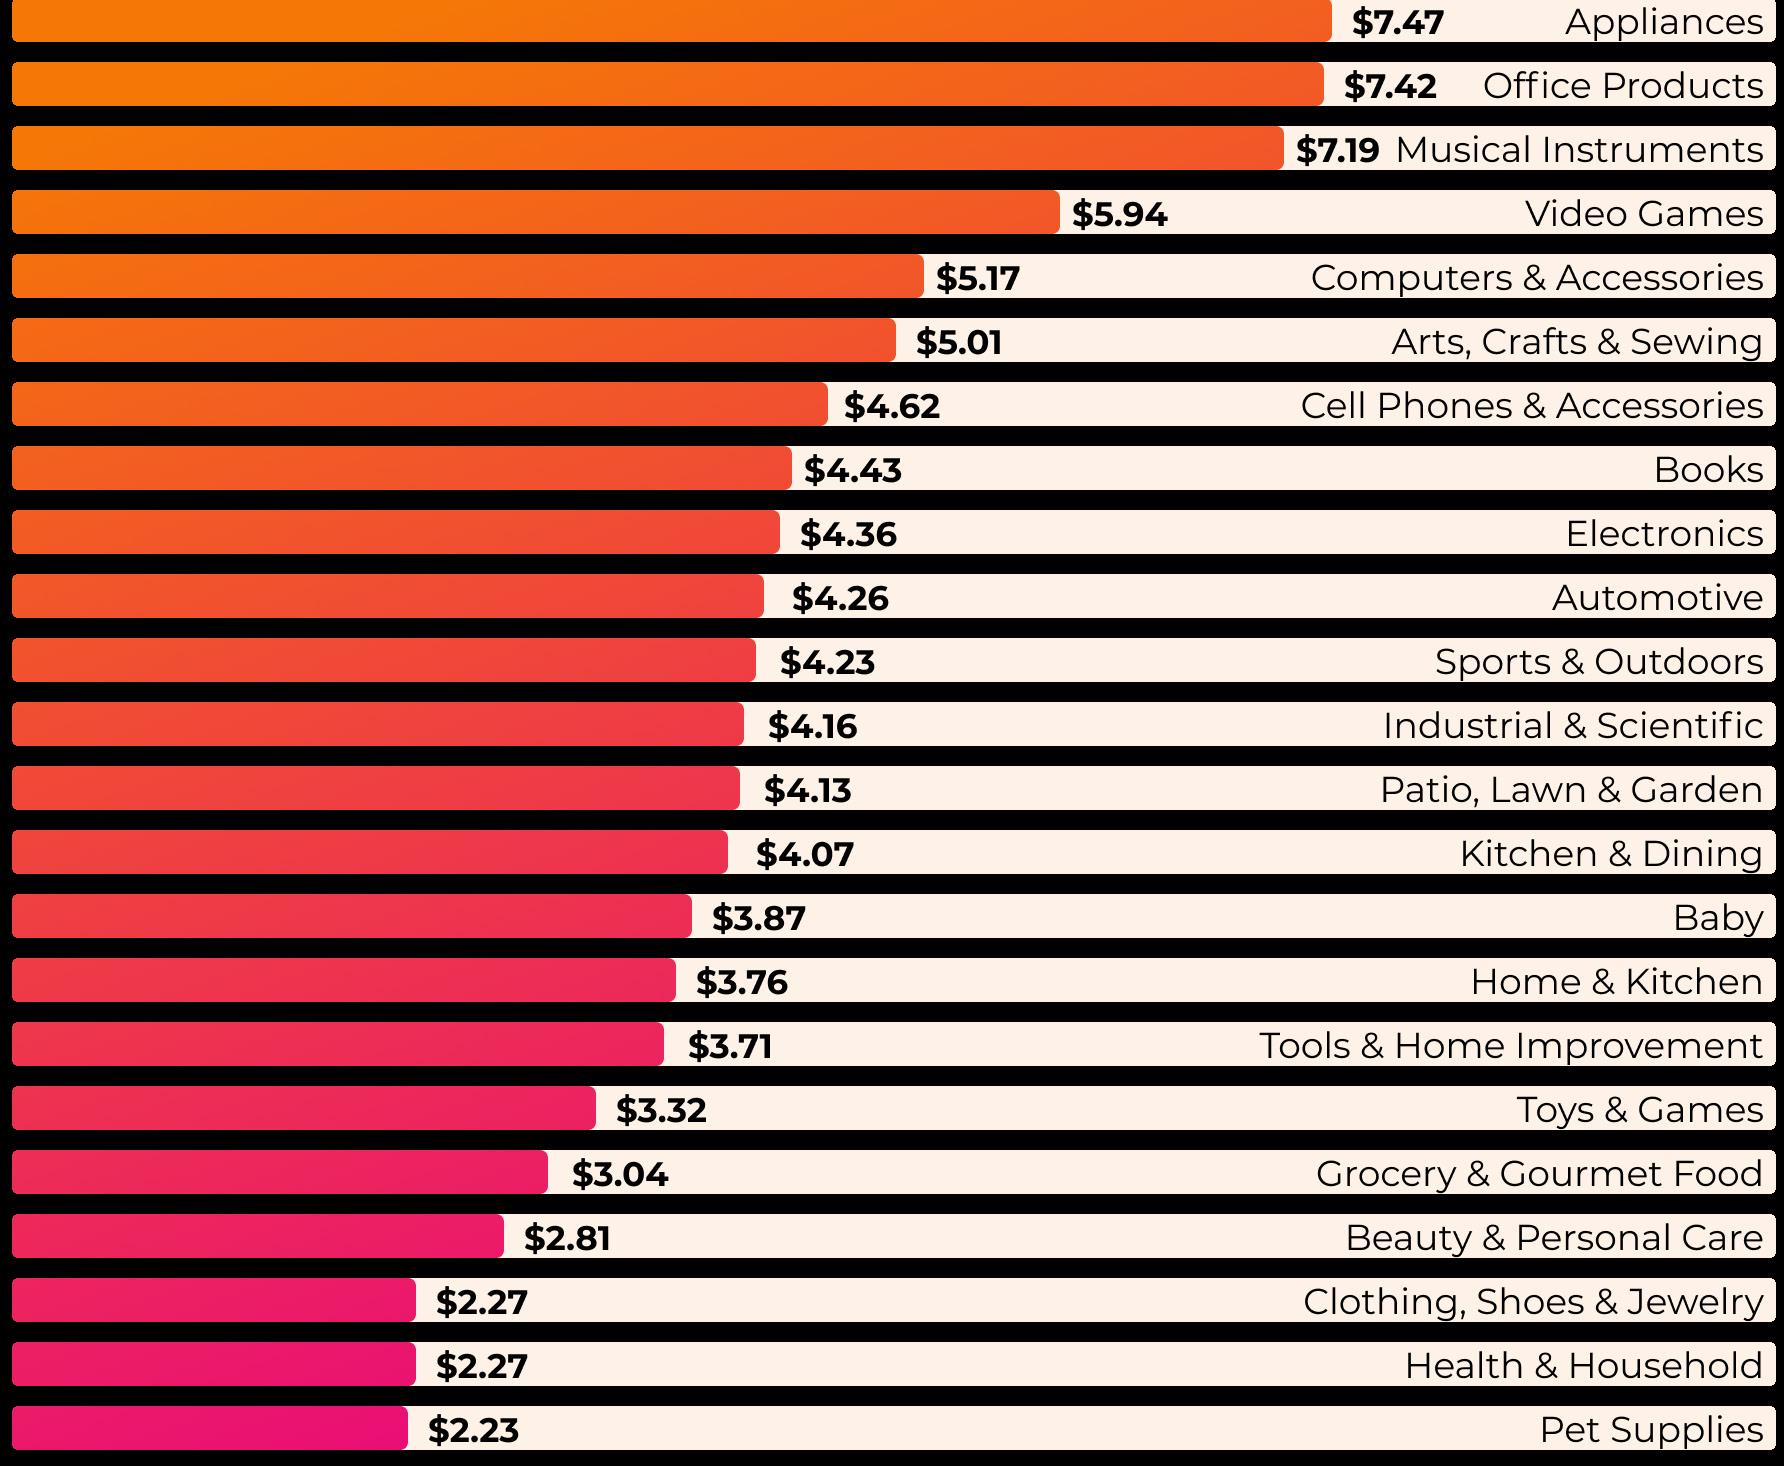
Ads for products in the Appliances category yielded the highest average returns in 2023 ($7.47), while categories delivering the lowest RoAS included Pet Supplies ($2.23), Health & Household ($2.27), and Clothing, Shoes & Jewelry ($2.27).
Product categories ranked by full-year 2023 average RoAS
INSIGHTS
RoAS often correlates with selling prices, with lower-priced products — like Health & Household goods — delivering a lower RoAS than big-ticket items like Appliances or bulk Office Products.
Learn more about the connection between RoAS and product price in Chapter 3
28 Amazon Advertisng Report 2024 |
04. CATEGORY LEADERBOARD (U.S.)
CHAPTER 5
Google Advertising for Amazon Brands
For brands thinking about growth, finding ways to engage high-intent shoppers who are searching on Google is a no-brainer. Unlike other mainstream advertising options — including social media — that often present ads to unsuspecting consumers, advertising on Google offers brands a way to reach potential customers at the exact moment they’re researching products like theirs.
This chapter was written in collaboration with Ampd, an intelligent advertising platform that connects Google Ads to Amazon and other marketplaces to reduce friction in the sales process.
Uses and Benefits of Google Ads
Google ads offer a range of unique benefits that make them a powerful asset for brands looking for effective and cost-efficient ways to drive more sales on Amazon:
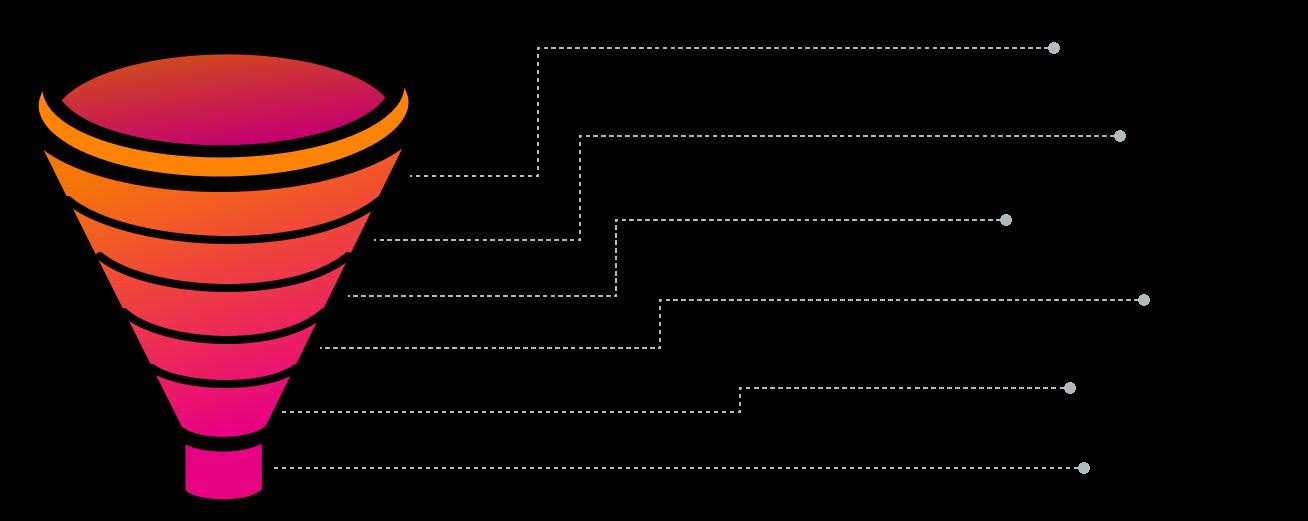
Touchpoints at multiple stages of the purchase journey
While Amazon ads are served at the bottom of the purchase funnel — when a shopper is most ready to purchase — Google ads are served during a shopper’s mid-funnel consideration phase.
To get the most out of using Google ads to drive traffic to Amazon, brands must also have a thoughtful on-Amazon nurture strategy. After injecting customers from Google into the middle of their funnel (keeping a close eye on KPIs like cost-perclick, add-to-cart rates, etc.), they nurture these potential customers with Amazon DSP, Amazon Display retargeting, Brand Tailored promotion, and other engagement strategies to stay top of mind as potential customers work through the buying process.
Awareness
DSP Prospecting, CTV, Facebook, Google Non-Branded Search
Metrics: Clicks, Impressions, Click-throughRate (CTR), eCPM, New-to-Brand (NTB) %
Consideration
Google Branded Search
Metrics: Add to Cart, Add-to-Cart Conversion Rate (CVR), NTB RoAS
Conversion
Onsite Sponsored Ads, DSP retargeting
Metrics: CVR, Return on Ad Spend (RoAS), Sales, Conversions
30 Amazon Advertisng Report 2024 |
05. GOOGLE ADVERTISING FOR AMAZON BRANDS
Google ads are particularly effective when a brand’s category becomes oversaturated and the competition and advertising costs have increased significantly. Limiting the visibility of competitors
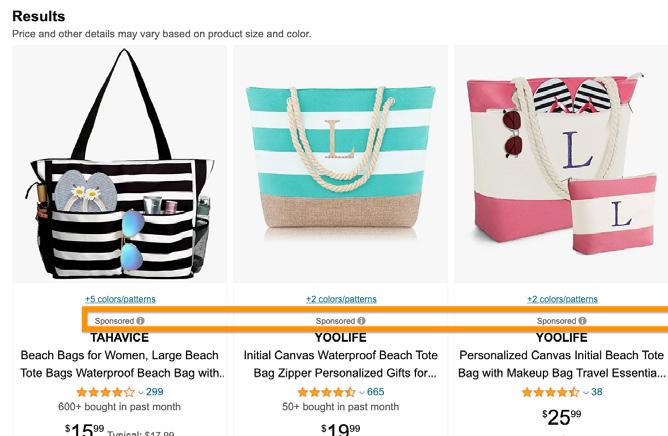
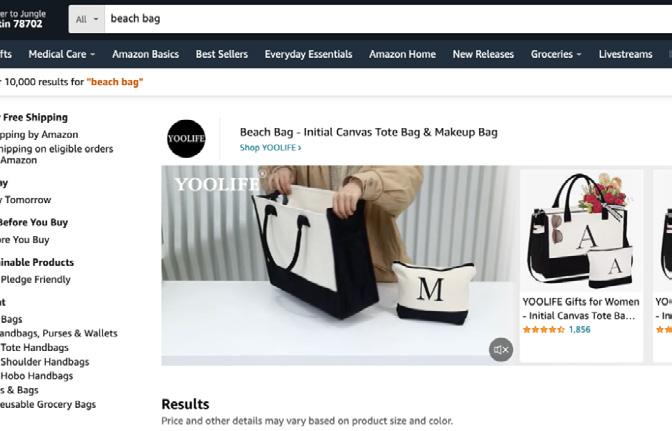
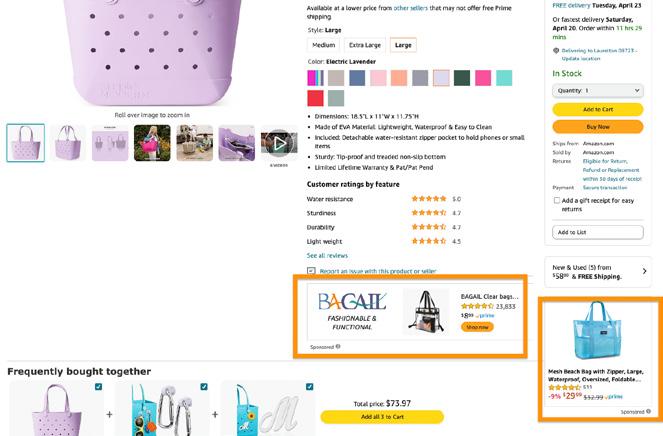
“Google ads are a way to bring customers directly to your brand without them seeing a bunch of your competitors. When a shopper searches on Amazon, they see 4-5 Sponsored ads at the top of the results.
When they search on Google, they only get 1-2 ads — and you can link your ads directly to product pages, bypassing Amazon search competition. This can deliver great results, especially if you’re competing with brands that are highly funded.”
 Brandon Nutter CTO, Ampd

38% of brands and sellers are worried about increasing ad costs, making it the top external challenge for Amazon businesses of all sizes.
Source: Jungle Scout 2024 State of the Amazon Seller Report
31 Amazon Advertisng Report 2024 |
05. GOOGLE ADVERTISING FOR AMAZON BRANDS
Increasing lifetime value through new repeat purchasers
For brands selling products with a high repeat purchase rate, Google is a great channel for finding new customers who will purchase multiple times, increasing Lifetime Value. This allows brands to consider customer acquisition costs and be more aggressive in their advertising, often taking a loss on the first purchase, knowing they will be profitable on the second and third purchases. By being more aggressive this way, brands can outbid their competitors and increase market share without eating into profitability.
Cost efficiency and new-to-brand sales
Google ads have a low cost-per-click and a high click-through rate, giving sellers a more cost-effective way to direct traffic to their product listings when competing in a highly saturated market. They are also highly effective at bringing new-to-brand customers into the purchase funnel.
Key Performance Insights, Google to Amazon Campaigns Engagement by
Data reflects averages across 20k products running Google ads directing to Amazon.
of all conversions from Google ads are new-to-brand (NTB) customers.
Source: Ampd Source: Ampd Source: Ampd
32 Amazon Advertisng Report 2024 |
Health, Household & Personal Care Home & Kitchen Pet Supplies Electronics 05. GOOGLE ADVERTISING FOR AMAZON BRANDS $1.14 72% 12.3% 203% 6.2% Average Cost Per
NTB
Add
Return
Conversion
72%
category, Google to Amazon Campaigns
Click (CPC)
(New to Brand)
to Cart Rate (ATC)
on Ad Spend (RoAS)
Rate (CVR)
Click Through Rate (CTR) Add to Cart Rate (ATC) Conversion Rate (CVR) Click Through Rate (CTR) Add to Cart Rate (ATC) Conversion Rate (CVR) Click Through Rate (CTR) Add to Cart Rate (ATC) Conversion Rate (CVR) Click Through Rate (CTR) Add to Cart Rate (ATC) Conversion Rate (CVR)
TIPS FOR BRANDS
How to Leverage Google Ads to Boost Amazon Sales
Use Amazon Attribution to see post-click conversion data for Google Ads
While a valuable tool, Amazon Attribution can be very manual and provides only campaignlevel data. Increase the value of this tool by using it to analyze the actions that shoppers take after engaging with your Google ads, giving you a fuller understanding of how the traffic generated from Google ads translates into actual sales on Amazon.
Leverage tools like Ampd to compare Google with Amazon conversion data. Take advantage of Amazon’s Brand Referral Bonus
When all the data is brought together, Ampd is able to apply intelligent bidding strategies that can optimize for conversions and maximize impact.

Through the Brand Referral program, Amazon offers sellers a bonus of up to 10% of all revenue generated from external marketing. If you generate $10K in revenue from Google Ads, for example, that’s a $1,000 bonus from Amazon.
05. GOOGLE ADVERTISING FOR AMAZON BRANDS
Omnichannel Advertising Tools for Brands
Get the most out of your ad investments with leading market intelligence and advertising tools.


Scout Cobalt
Cobalt is a leading Amazon market intelligence and advertising solution designed specifically for enterprise brands, retailers, and ecommerce agencies. With Cobalt’s Ad Accelerator feature, brands can:
Get recommendations to optimize campaigns and maximize RoAS
Scale advertising by accessing multiple accounts with a single login
Make bulk adjustments to PPC and DSP campaigns
Save time and resources with automations to schedule campaigns, adjust bids, and more
Build highly visual dashboards to measure and improve KPIs
Cobalt also has tools for analyzing your Amazon performance data at scale, tracking market trends, gathering competitive intelligence, gauging share of voice, discovering keyword trends, and more.

Ampd is changing the way customers discover, shop and buy. Connect the world’s largest advertising channels, from search to social, to the world’s largest marketplaces with closed-loop attribution and automation. Ampd allows you to accurately gauge the efficacy of your brand investments across the very channels where consumer transactions occur. Built with intelligent automation to achieve your commerce objectives, Ampd is the easiest path to turn shoppers into buyers.
Shorten the path to purchase down the funnel directly to your product page
Increase incremental revenue with new-to-brand customers
Find more advertising opportunities beyond the marketplace
The world’s largest brands and agencies depend on Ampd to improve performance from their marketing budgets..
Book a demo Sign up
34 Amazon Advertisng Report 2024 |
Jungle
Ampd → → → → → → → →
CHAPTER 6
Challenges & Predictions
Ecommerce is expanding, creating new challenges for sellers and for Amazon itself. Consumers are increasingly shopping on additional channels, while rapid technological advancements are disrupting commerce as a whole.
Shoppable Social Media
Social media is quickly becoming one of the most influential players in ecommerce, with the increasing shopability of social channels beginning to challenge Amazon’s long-held stronghold.

of consumers now say they are likely to purchase a product directly from social media*
of consumers browse or shop on TikTok Shop once a week or more*
More than 1/3 35% 20%
of Amazon sellers, brands, and businesses plan to expand to TikTok Shop this year**
*Source: Jungle Scout Consumer Trends Report
**Source: Jungle Scout’s 2024 State of the Amazon Seller Report
The explosive popularity of platforms like TikTok Shop has spurred Amazon to explore new ways to bridge the gap between social media and its own marketplace.
Amazon Inspire became available to all U.S. shoppers in May 2023. Like TikTok, Inspire uses short-form videos to create a personalized feed for shoppers to discover products.
In late 2023, Amazon announced partnerships with Meta and Snap that will allow users to buy Amazon products directly from ads on Facebook, Instagram, and Snapchat.
Even with the U.S. recently passing a bill that could ban TikTok in the United States, social media shopping isn’t going anywhere. As social channels continue building out their own marketplaces, expect Amazon to pursue additional partnerships and launch more features that mimic the social shopping experience and enable sellers to integrate Amazon directly into their social media strategies.
For more on how Amazon sellers use TikTok to boost sales — and what a ban could mean for them — see our report briefing, TikTok’s Ticking Clock.
06. CHALLENGES & PREDICTIONS
Continued Ecommerce Expansion
Social media is not the only channel that ecommerce brands and sellers are expanding to. Many have already started selling through additional platforms and markets, with plans to expand even further.
60%
46% of Amazon sellers, brands, and businesses sell on at least one other channel of Amazon sellers, brands, and businesses operating in the U.S. also sell in at least one other international marketplace

Amazon businesses list expanding to new global markets, expanding to additional ecommerce platforms, and expanding to brick-and-mortar stores as top goals for 2024
Source: Jungle Scout’s 2024 State of the Amazon Seller Report
As brands expand their sales channels beyond Amazon, Amazon is evolving to make it easier to reach shoppers elsewhere and drive them to product listings.
At unBoxed 2023, Amazon announced Sponsored TV ads. In addition to giving brands the option to advertise their products on Amazon Prime Video, this will allow them to run campaigns that reach audiences watching content on Freevee, Twitch, and 30+ other third-party services.
Amazon continues to refine its campaign planning and analytics tools for clearer attribution so brands can understand exactly which advertising efforts — both on and off Amazon — are generating sales.
Sponsored Products campaigns can now be run on additional apps and websites, like Pinterest, BuzzFeed, Mashable, and more.
Buy with Prime — which lets shoppers purchase from DTC websites using their Prime accounts — continues to grow. Since its launch in 2022, Amazon has added several new features, giving brands the ability to display Amazon reviews on their own websites, offer postorder customer service support through Amazon, and more.
Watch for Amazon to keep launching and refining tools that let brands harness Amazon’s unique advertising capabilities across multiple markets and channels.
To stay up to date on the latest Amazon news (and get access to exclusive resources), subscribe to Jungle Scout’s newsletter.
06. CHALLENGES & PREDICTIONS
The Age of AI
2023 marked the beginning of the age of AI, and the technology has already cemented its space in the ecommerce world.

“AI is going to transform every customer experience that we know.”
Amazon CEO Andy Jassy, in an interview with CNBC
Like most companies, Amazon was quick to jump on the new tech wave, launching AI-powered tools in September 2023 and announcing the latest wave of new features in March of this year.
Brands and sellers can use these generative AI tools to:
Optimize product listings
Automatically generate product listings from images or URLs
Generate lifestyle and brand images for advertising campaigns
According to Amazon, over 100,000 sellers have already used one or more of their AI tools:
“We’ve compared the AI-generated content to non-AI-generated content and found improvements across measures of clarity, accuracy, and detail, which can increase a product’s discoverability when customers search in Amazon’s store.”
Mary Beth Westmoreland, VP, Worldwide Selling Partner Experience, Amazon
48% of Amazon sellers, brands, and businesses have used AI to help manage their ecommerce operations
Source: Jungle Scout’s 2024 State of the Amazon Seller Report
The use cases for AI in ecommerce are just emerging, and Amazon plans to continue expanding its AI tools to improve both the selling and shopping experience:
“We are finding that generative AI has a profound capacity to simplify the effort it takes [...] to create great product listings, and we will continue to innovate upon these capabilities.”
Mary Beth Westmoreland, VP, Worldwide Selling Partner Experience, Amazon
06. CHALLENGES & PREDICTIONS
→ → →

CHAPTER 7
About the Report
Methodology
The Amazon advertising data used in this report comes from Jungle Scout’s ecommerce data, collected for the January 2021 through March 2024 time frame across 21 global marketplaces. It includes 6,000+ distinct brands and more than a million unique Amazon advertising campaigns across all key ad media and primarily represents large ecommerce enterprises. Category data is representative of Amazon’s U.S. marketplace only. Analysis and findings are based on this Jungle Scout data in addition to historical data collected on an annual basis since 2020, in addition to data from external sources.
Google advertising data was provided by Ampd and reflects Google ad campaigns directing traffic to Amazon. Category-specific Google ads data reflects 2023 full-year data for Google ads campaigns with over 100 conversions, using exact match search targeting. Google ads data spanning multiple categories reflects averages across 20,000 products running Google ads to Amazon.
Using the data
We encourage you to explore Jungle Scout’s 2024 Amazon Advertising Report and to share, reference, and publish the findings with attribution to “Jungle Scout” and a link to this page.
For more information, specific data requests, media assets, or to reach the report’s authors, please contact us at press@junglescout.com.
Jungle Scout: Leading Amazon Market Intelligence Tools
Over the past decade, Jungle Scout has gathered a wealth of data points through continuous monitoring and analysis of Amazon. The tools used to build this report are the same ones that 1 million+ sellers, enterprise brands, retailers, and agencies use daily to make confident decisions and develop effective strategies on Amazon. See how our tools can help your business grow by signing up or requesting a demo.
FOR FIRST-TIME AND ESTABLISHED SELLERS
Jungle Scout
Jungle Scout is the leading platform for Amazon sellers, supporting more than $50 billion in annual Amazon revenue.
Founded in 2015 as the first Amazon product research tool, Jungle Scout today features a full suite of best-in-class business management and market intelligence solutions to help sellers:
• Find and track winning products
• Discover high-value keywords
• Source suppliers for products
• Create and optimize product listings
• Jumpstart their business with exclusive tutorials
Jungle Scout Cobalt
Jungle Scout Cobalt empowers brands and retailers with a powerful suite of ecommerce tools designed to drive growth on Amazon. Comprehensive data analytics, built-in advertising automation, and intuitive visualizations turn insights into action. Cobalt is trusted by brands and retailers worldwide to:
• Track and grow market share
• Analyze performance data
• Gauge market trends and competitor performance
• Optimize ad campaigns
• Gauge share of voice and discover keyword trends
Sign up today Book a demo
Jungle Scout Data Cloud
Jungle Scout Data Cloud offers scalability and flexibility by providing retailers a way to get Jungle Scout’s industry-leading data, with the ability to analyze and visualize that data using the tools of their choice. It provides a comprehensive view of Amazon market dynamics by allowing retailers to:
• Access millions of data points
• Extract insights using tools like Snowflake, Azure, and others
• Create custom visualizations with PowerBI, Tableau, and similar tools
• Analyze trends in consumer demand
• Investigate third-party sellers
Try Data Cloud with Snowflake
40 Amazon Advertisng Report 2024 |
FOR BIG BOX RETAILERS AND INVESTORS
07. ABOUT THE REPORT
FOR BRANDS, RETAILERS, AND AGENCIES
Digital Advertising Glossary
What follows is a brief glossary containing explanations for some of the most common digital advertising terms.
1. Sponsored Products
Sponsored Products are keyword- or product-targeted ads that promote individual listings and appear in shopping results and on product detail pages on Amazon.
Sponsored Product ads help brands get their products in front of consumers who are actively deciding which product(s) to purchase. By bidding competitively, brands will have a better chance of having their product(s) listed near the top/front of the page. Since many consumers do not click past the first page of search results, it’s vital to appear on the first page as often as possible.
2. Sponsored Brands
Sponsored Brands are ads that are displayed in the search result pages as headline banner ads always above the result listing.
Sponsored Brands ads help reinforce a brand, grow sales, target competitive brands, defend branded keywords, and encourage shoppers to add more items to their carts. They can also bring new customers into a brand’s shopping funnel by stepping slightly outside your particular category and showing consumers a brand’s messaging while they are in the shopping and purchasing mindset.
3. Sponsored Display
Sponsored Display allows brands to reach customers via auto-generated ad placements. Sponsored display ads use relevant audiences, customizable creatives, and actionable insights to deliver a message to the right customers.
Sponsored Display ads encourage consumers to look at relevant adjacent products directed at consumers already looking at a product within a brand or a competitor’s brand portfolio. Unlike the other ad options, coupons can also be promoted through Sponsored Display Ads, and can function as one last push to close the sale.
41 Amazon Advertisng Report 2024 |
08. DIGITAL ADVERTISING GLOSSARY
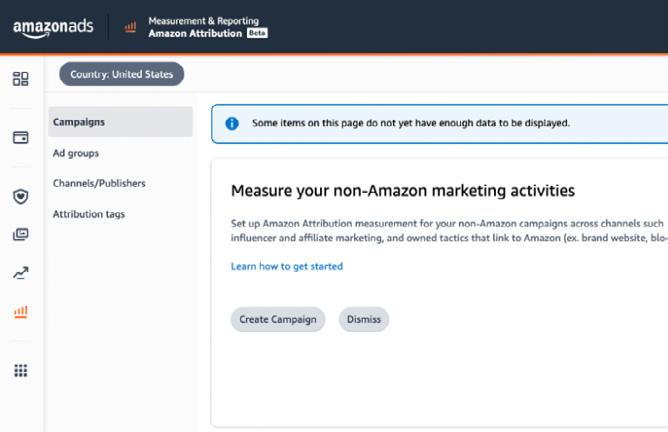
Amazon Attribution is an advertising and analytics measurement solution that gives marketers insight into how their non-Amazon marketing channels across search, social, video, display, and email impact Amazon shopping activity and sales performance.
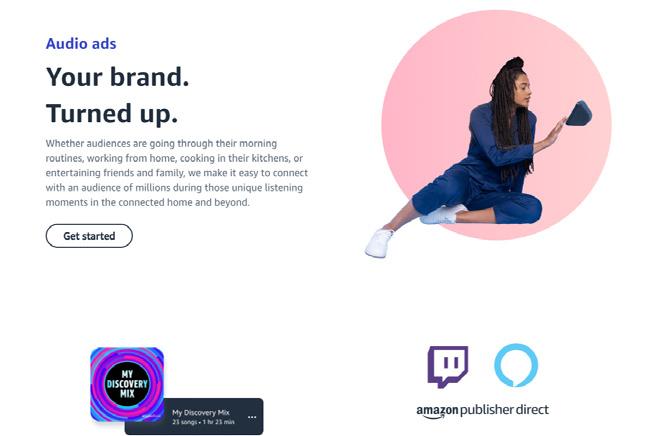
Audio Ads are ads on Amazon Music’s Free service that run across desktop, mobile, tablet, connected TVs, and smart speakers (e.g., Echo devices).
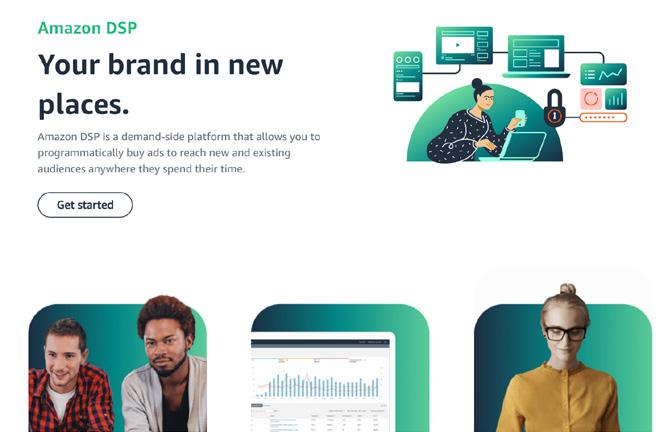
Amazon DSP, or demand-side platform, enables advertisers to programmatically buy display, video, and audio ads both on and off Amazon.
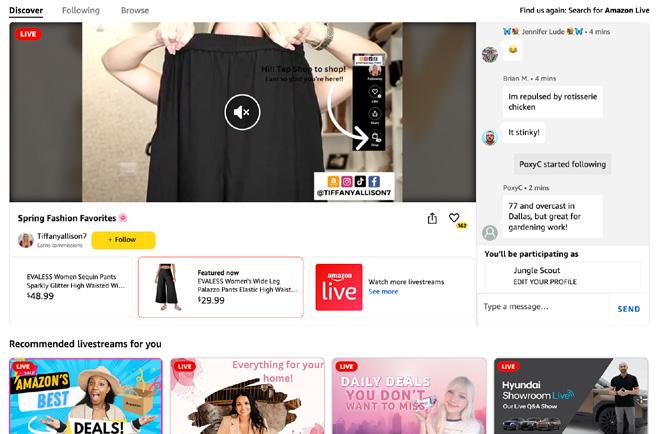
Amazon Live is a live streaming service that allows sellers to “promote discovery” of their products by hosting their own live streams for customers on Amazon.
Posts help drive brand and product discovery in a shoppable feed on Amazon.
Stores or Storefronts are where vendors and sellers enrolled in Amazon Brand Registry can exclusively showcase a curated collection of products and elevate their brand.
42 Amazon Advertisng Report 2024 |
4. Amazon Attribution
7. Audio Ads 5. Amazon DSP
8. Posts
6. Amazon Live
9. Stores or Storefronts
08. DIGITAL ADVERTISING GLOSSARY
10. Video Ads
Video Ads or Amazon over-the-top (OTT) video ads (ads served via the internet rather than cable/satellite) allow a brand to showcase itself alongside premium, brandsafe streaming content, including the latest movies and TV shows.
Advertising Metrics
NTB
NTB stands for “New To Brand,” and represents the total number of conversions attributable to customers who have not previously bought from a brand.
CTR
CTR is an acronym for “Clickthrough rate,” which represents the number of clicks an ad receives, divided by the number of times that ad is shown.
CVR
CVR is short for “Conversion rate,” the percentage of users who ‘convert’ by making a purchase after engaging with an ad.
eCPM
eCPM stands for “Effective cost per mile,” which measures how much an advertiser pays for an ad space per unit of 1,000 ad impressions. Read more about the different types of advertising available on Amazon here

08. DIGITAL ADVERTISING GLOSSARY
