
iii Editorial Board
iv On the Cover
v Publishing Schedule and Advertiser ’s Index
vi Editor ’s Note
1 eDNA Metabarcoding in the Ocean: A Powerful Molecular Sensor in Need of Optimization
Gordon H.R. de Jong, Jonathan A.D. Fisher
Fisheries and Marine Institute
David Côté, Fisheries and Oceans Canada
12 Navigating Turbid Waters: Developing Sensing Strategies for Uncrewed Systems Testing and Proving
Michelle Barnett, Sonardyne International
Patrick Bunday, Vic Grosjean
Australian Institute of Marine Science
26 Off Centre: Tilt Variation and Acoustic Receiver Detection Efficiency in a High Flow Environment
Iago Gradin, Ocean Tracking Network
34 Enhancing Sustainable Aquaculture with Environmental Sensors: A Gateway to Long-term Data Analysis and Improved Practices
Kaeleigh McConnell, Innovasea
42 Arctic Legacy of War: Tirpitz Site Project
Bryan Lintott, UiT The Arctic University of Norway
Gareth Rees, University of Cambridge
49 What Can Camera Concepts Sense for You – that Conventional Sampling Methods do Not?
Niels Madsen, Amanda Irlind, Alex Jørgensen, Karen Ankersen Sønnichsen, Malte Pedersen, Jonathan Eichild Schmidt, Anders Skaarup
Johansen, Galadrielle Humblot-Renaux, Thomas B. Moeslund, Nadieh de Jonge, Jeppe Lund Nielsen
Aalborg University
55 Detecting Light-attracted Leach’s Storm-Petrels in the Offshore
Justin So, Kyle d’Entremont, Andrew Peddle WSP Canada Inc.
64 Autonomous, Fixed-focus, High-resolution Deep-sea Camera Systems
Aaron Steiner, Mark Olsson, Stacey Church
DeepSea Power and Light
Eli Perrone, EP Oceanographic
Jon Clouter, Back-Bone Gear Inc.
Daniel J. Fornari, Woods Hole Oceanographic Institution
Victoria Preston, Olin College
Mae Lubetkin, independent researcher
100 Implementing Underwater Image Enhancement Algorithms on Resource Constrained Devices
Arun M., Visvaja K., Vidyha A. Mepco Schlenk Engineering College
117 Technicalities ... Considerations for Advancing Seafloor Imaging to Enable Long-term Monitoring
Victoria Preston, Olin College
Pushyami Kaveti, Dennis Giaya, Aniket Gupta, Hanumant Singh, Northeastern University
Mae Lubetkin, independent researcher
Timothy M. Shank, Daniel J. Fornari
Woods Hole Oceanographic Institution
122 Technicalities ... Calibration of Camera and Lighting Systems on Marine Robotic Platforms for Scientific Data Collection
Dennis Giaya, Pushyami Kaveti, Aniket Gupta, Jasen Levoy, Hanumant Singh
Northeastern University
Victoria Preston, Olin College
Daniel J. Fornari, Woods Hole Oceanographic Institution
126 Lodestar … Petros Mathioudakis, Rylan Command
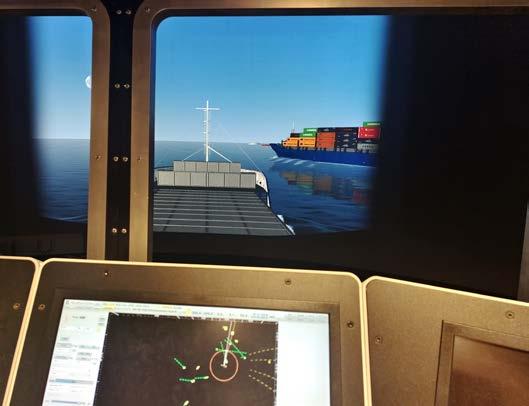
128 Role of Onshore Operation Centre and Operator in Remote Controlled Autonomous Vessels Operation
Muhammad Adnan, Yufei Wang
UiT The Arctic University of Norway
Lokukaluge Prasad Perera
SINTEF Digital
156 Q&A with Dainis Nams
158 Trade Winds … Real-time Marine Weather Data
Dan Reed and Carson Straub
OceanSync Data Solutions
160 Trade Winds … Autonomous and Efficient: Unpacking the Sensor-driven Technology Behind Oshen’s Micro-vessels
Anahita Laverack
Oshen
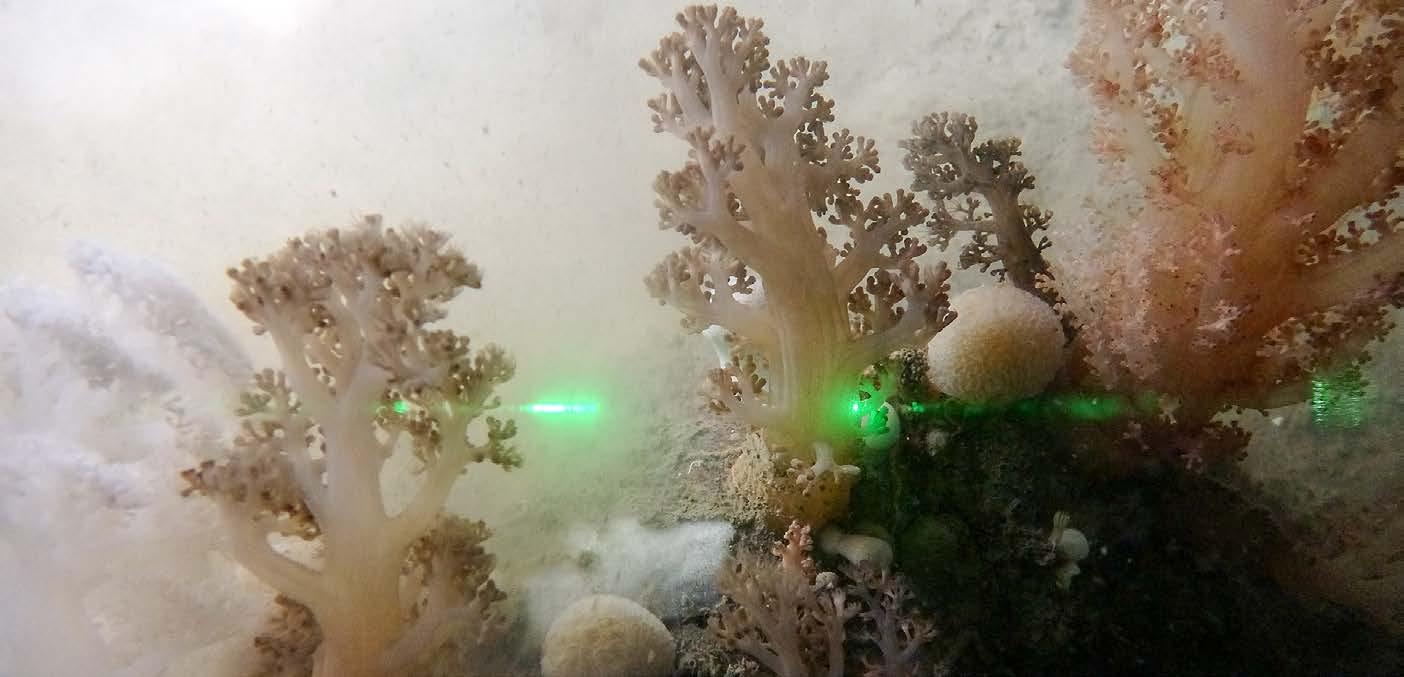
162 Trade Winds … Exploring Cold-water Coral Ecosystems with Advanced Underwater Optical Sensors: Insights from the Galápagos Expedition
Patricia Sestari
Voyis
164 Inside Out … Magnetometers in Marine Applications
Gorden Konieczek
SENSYS Magnetometers and Survey Solutions
169 Perspective … SubC Imaging
170 Reverberations … Sensing Superpowers: Using ROVmounted LiDAR and Magnetometers to Reveal the Unseen
Joshua Gillingham, SEAMOR Marine
172 Homeward Bound … Sound Mapping: The Future of Ocean Equipment Monitoring
Emma Carline, Ocean Sonics Ltd.
174 Parting Notes … Gauging the Ocean’s Mood
Edwina Nash
PUBLISHER
Kelley Santos info@thejot.net
MANAGING EDITOR
Dawn Roche Tel. +001 (709) 778-0763 info@thejot.net
Dr. David Molyneux
ASSISTANT EDITOR
Bethany Randell Tel. +001 (709) 778-0769 bethany.randell@mi.mun.ca
TECHNICAL CO-EDITORS
Director, Ocean Engineering Research Centre Faculty of Engineering and Applied Science Memorial University of Newfoundland
WEBSITE AND DATABASE
Scott Bruce
GRAPHIC DESIGN/SOCIAL MEDIA
Danielle Percy Tel. +001 (709) 778-0561 danielle.percy@mi.mun.ca
Dr. Katleen Robert Canada Research Chair, Ocean Mapping School of Ocean Technology Fisheries and Marine Institute
FINANCIAL ADMINISTRATION
Michelle Whelan
Dr. Keith Alverson University of Massachusetts USA
Dr. Randy Billard Virtual Marine Canada
Dr. Safak Nur Ertürk Bozkurtoglu Ocean Engineering Department Istanbul Technical University Turkey
Dr. Daniel F. Carlson Institute of Coastal Research Helmholtz-Zentrum Geesthacht Germany
Dr. Dimitrios Dalaklis World Maritime University Sweden
Randy Gillespie Windover Group Canada
S.M. Asif Hossain National Parliament Secretariat Bangladesh
Dr. John Jamieson Dept. Earth Sciences Memorial University Canada
Paula Keener Global Ocean Visions USA
Richard Kelly Centre for Applied Ocean Technology Marine Institute Canada
Peter King University of Tasmania Australia
Dr. Sue Molloy Glas Ocean Engineering Canada
Dr. Kate Moran Ocean Networks Canada Canada
EDITORIAL ASSISTANCE
Paula Keener, Randy Gillespie
Kelly Moret Hampidjan Canada Ltd. Canada
Dr. Glenn Nolan Marine Institute Ireland
Dr. Emilio Notti Institute of Marine Sciences Italian National Research Council Italy
Nicolai von OppelnBronikowski Memorial University Canada
Dr. Malte Pedersen Aalborg University Denmark
Bethany Randell Centre for Applied Ocean Technology Marine Institute Canada
Prof. Fiona Regan School of Chemical Sciences
Dublin City University Ireland
Dr. Mike Smit School of Information Management Dalhousie University Canada
Dr. Timothy Sullivan School of Biological, Earth, and Environmental Studies University College Cork Ireland
Dr. Jim Wyse Maridia Research Associates Canada
Jill Zande MATE, Marine Technology Society USA
The Journal of Ocean Technology is a scholarly periodical with an extensive international editorial board comprising experts representing a broad range of scientific and technical disciplines. Editorial decisions for all reviews and papers are managed by Dr. David Molyneux, Memorial University of Newfoundland, and Dr. Katleen Robert, Fisheries and Marine Institute.
The Journal of Ocean Technology is indexed with Scopus, EBSCO, Elsevier, and Google Scholar. Such indexing allows us to further disseminate scholarly content to a larger market; helps authenticate the myriad of research activities taking place around the globe; and provides increased exposure to our authors and guest editors. All content in the JOT is available online in open access format. www.thejot.net
The Journal of Ocean Technology, ISSN 1718-3200, is protected under Canadian Copyright Laws. Reproduction of any essay, article, paper or part thereof by any mechanical or electronic means without the express written permission of the JOT is strictly prohibited. Expressions of interest to reproduce any part of the JOT should be addressed in writing. Peer-reviewed papers appearing in the JOT and being referenced in another periodical or conference proceedings must be properly cited, including JOT volume, number and page(s). info@thejot.net
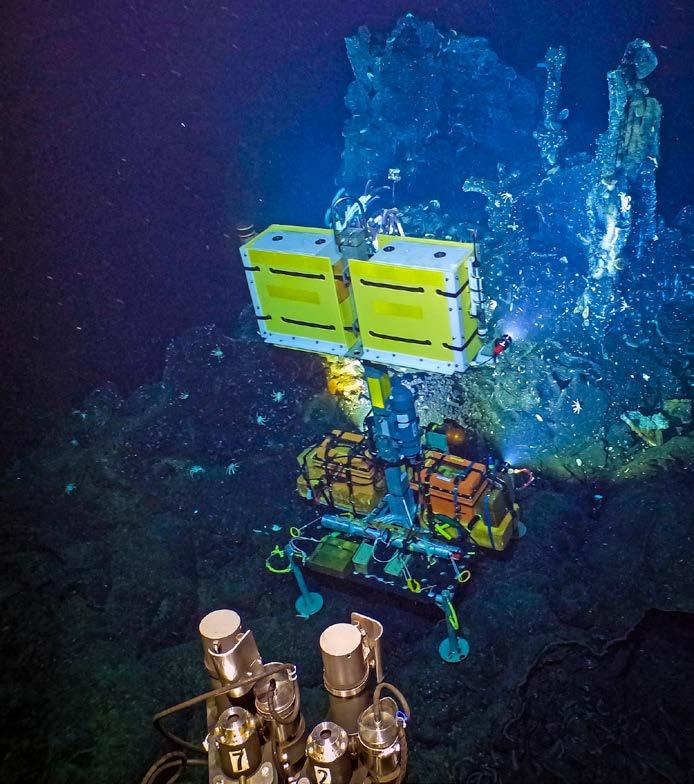
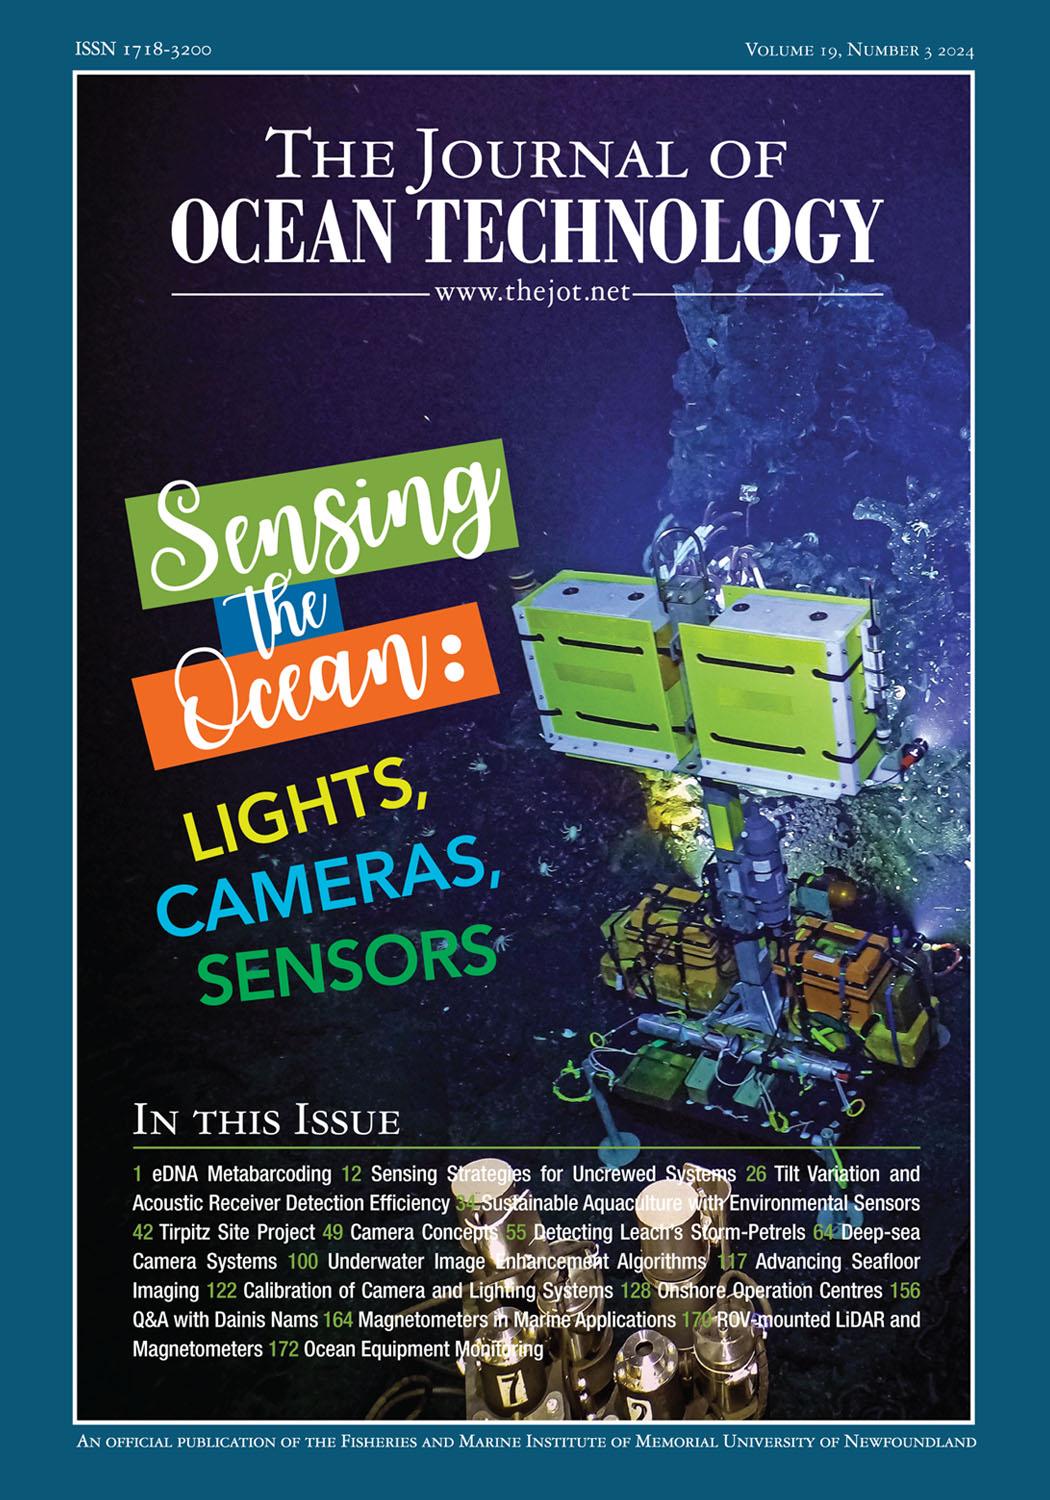
An imaging lander developed by the Woods Hole Oceanographic Institution’s Multidisciplinary Instrumentation in Support of Oceanography (MISO) Facility as deployed in the axial summit trough of the East Pacific Rise near 9°46.8'N at 2,508 m depth, during the AT50-21 expedition in March 2024. The lander uses four DeepSea Sealites™ to illuminate the seafloor and contains two MISO GoPro cameras, one shooting 5.3K video at 30 fps and the other 27MP still images every five seconds. Power to the lighting system is provided by two DeepSea SeaBatteries™, each delivering 24VDC with ~40 amp/h capacity. Two MISO deep-sea switches (small silver cylinders with magnetic reed switches on the lander) provide the ability to turn the lights on/off. The lander is positioned next to a hydrothermal diffuse flow area on a lava rampart near V vent, a high-temperature hydrothermal chimney, that is part of an ongoing NSF-sponsored research project to study the run-up to the next volcanic eruption at this fast-spreading mid-ocean ridge axis. The instruments at the middle bottom of the image are isobaric gas tight samplers used to sample high-temperature (>350°C) hydrothermal fluids, which are mounted on Alvin’s basket. The image was acquired by an autonomous MISO GoPro camera mounted above the pilot's viewport, shooting 27MP stills every five seconds during Dive 5248 (direction of view is 141°).
The JOT production team invites the submission of technical papers, essays, and short articles based on upcoming themes. Technical papers describe cutting edge research and present the results of new research in ocean technology or engineering, and are no more than 7,500 words in length. Student papers are welcome. All papers are subjected to a rigorous peer-review process. Essays present well-informed observations and conclusions, and identify key issues for the ocean community in a concise manner. They are written at a level that would be understandable by a non-specialist. As essays are less formal than technical papers, they do not include abstracts, listing of references, etc. Typical essay lengths are up to 3,000 words. Short articles are between 400 and 800 words and focus on how a technology works, evolution or advancement of a technology as well as viewpoint/commentary pieces. All content in the JOT is published in open access format, making each issue accessible to anyone, anywhere in the world. Submissions and inquiries should be forwarded to info@thejot.net.
All themes are approached from a Blue Economy perspective.
Winter 2024 Safety first: humans at sea
Spring 2025 Marine tourism
Summer 2025 Ocean monitoring
Fall 2025 Maritime security
Winter 2025 Indigenous use of technology
CIOOS 24, 25
Educational Passages 11 Marine Institute 48, 62, 168
OceansAdvance IBC
SBG Systems 40 Workboat Show IFC
Each issue of the JOT provides a window into important issues and corresponding innovation taking place in a range of ocean sectors –all in an easy-to-read format with full colour, high-resolution graphics and photography.
The Journal of Ocean Technology c/o Marine Institute P.O. Box 4920 155 Ridge Road St. John's, NL
A1C 5R3 Canada
+001 (709) 778-0763 info@thejot.net www.thejot.net


It has been over 120 years since the first underwater photographs were captured. French scientist Louis Boutan wanted to bring the visuals of the underwater world he discovered while diving to the surface. He and his colleagues developed not only an underwater camera, but a lighting system and a remote trigger to accompany it. Keep in mind the technical challenges that had to be overcome to illuminate and capture an underwater scene. Not only did the camera’s mechanics have to be kept dry, but at that time, flash photography required a substance that would burn. This innovation speaks to the ingenuity of people dedicated to a goal: if the solution to a problem does not already exist, we will create one.
Underwater photography has come a long way since the time of Boutan, as evidenced by our beautiful cover. The image was taken more than 2,500 m below the surface, in a region of hydrothermal vents on the East Pacific Rise. Such regions of the deep ocean, sometimes looking more like an alien planet than the world we are familiar with, are only available to us through the use of lights, cameras, and sensors.
Cameras and their necessary lights may be some of the oldest sensing technology, but they are being used in many new and novel ways. High-resolution imagery is being used to construct colour-accurate 3D models of underwater structures, be they natural or manmade, to give us a more complete picture of what is going on. This could be used to give biologists a more complete understanding of the ecosystem around a hydrothermal vent, show engineers where corrosion is occurring on subsea infrastructure, or track the deterioration of a shipwreck.
While the imagery captured by underwater cameras is stunning, pictures alone are not enough to tell the whole story. Other sensors are needed to help us understand the marine environment, and we showcase just some of them in this hefty edition of the JOT.
Monitoring sounds underwater is just as old as underwater photography and is similarly being used in new ways. Sophisticated hydrophones are being used to capture not only the natural sounds
within the ocean, but also the manmade sounds that contribute to ocean noise pollution. These sounds can even be visualized on top of imagery, producing a “sound map” that shows areas of intensity. While the Bay of Fundy has been inspiring awe since time immemorial, we know very little about how animals navigate its turbulent waters.
Acoustic receivers deployed within the passages are gathering new insights as animals with acoustic tags pass through the area. Collecting eDNA from water samples allows researchers to determine what organisms are living in a region without ever having to witness an individual of a species, which is especially important for elusive or endangered species. This field is still growing in potential, and researchers are working hard to overcome the challenges. Continuing with the theme of things we humans cannot sense without augmentation, magnetometers allow us to detect disturbances in the electromagnetic field that could lead to finding unexploded ordnances or debris from a shipwreck.
While single data points are better than no data points, continuous monitoring of a system is the best way to learn about what is happening. This allows us to catch changes early and have enough data to make predictions about what could happen in the future. That could mean installing sensors in a fixed location, or equipping various sensors on a vehicle that could be crewed or uncrewed. Whether those sensors are continuously monitoring an aquaculture pen to ensure conditions are optimal for fish growth or collecting data in remote regions of the vast ocean, sensors that collect data 24/7 are of great benefit. Furthermore, those continuously operating sensors can be used to capture data during unexpected or dangerous events, as researchers with the Australian Institute of Marine Science found out when sensors within their ReefWorks test range endured (for the most part) Tropical Cyclone Kirrily.
Just like our own eyes, ears, and nose, sensors allow us to take in information about the surrounding environment. But taking in the information is not the only goal. We need to use that information, process it, to turn it into something useful, like a deeper understanding of how the ocean works, or make decisions necessary to ensure the resources provided by the ocean are used effectively and sustainably.
On its historic voyage 150 years ago, the HMS Challenger investigated the biological structure of the deep sea for the first time. Spanning nearly four years (1872-1876), nearly 69,000 nautical miles, and returning with more than 100,000 samples, the Challenger mission has been celebrated for its unprecedented scale of marine scientific endeavour and for quickly advancing knowledge of ocean processes through the repeated deployment of sensors and collectors.
However, reflecting on both the HMS Challenger mission and progress in oceanography, John Murray (1885) predicted: “This science cannot, from its nature, advance
slowly and gradually; it must proceed by strides, which will probably be as far apart in point of time as they are important with respect to discovery.” Murray’s prediction has since been supported by rapid advances in many fields (e.g., acoustics, digitalization, and satellite communications), expanding and improving the suite of available oceanographic sensors towards increasingly optimized data collection.
More recently, strides have been taken to create new survey tools, employing the power of genetic analyses to sense the biodiversity in all areas of the ocean within oceanographic survey programs. Analogous to
the researchers aboard the HMS Challenger having to optimize their equipment to successfully complete their historic expedition, molecular sensors are now in a similar stage where they must be optimized to complement or perhaps replace some of the more conventional survey methods used today. This essay outlines key terminology and workflows to move towards optimizing environmental DNA analyses.
What is Environmental DNA and Why is it so Useful?
All living things leave traces of DNA that are passed into the environment through substances, including mucus, scales, hair,
and feces. Through advances in genetic research, tools and methods have been developed to identify this shed genetic material, called environmental DNA (eDNA). One of the primary methods that uses eDNA is metabarcoding, also called high throughput sequencing; a method developed to simultaneously detect the many species present within this “eDNA soup.” Metabarcoding uses sequencing technology to identify short DNA segments unique to each species. These segments are called barcodes and are somewhat analogous to a human fingerprint. Detected barcodes can be compared to a reference library that contains barcodes of known species. Therefore, eDNA metabarcoding can scan many barcodes at once and provide a list of all the species in a sample. Being able to identify many species within different environments, from the deepsea environments once explored by the HMS Challenger to tide pools, freshwaters, and even land and air, has made eDNA metabarcoding an extremely versatile biodiversity sensor for many different applications.
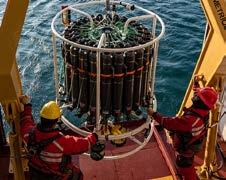
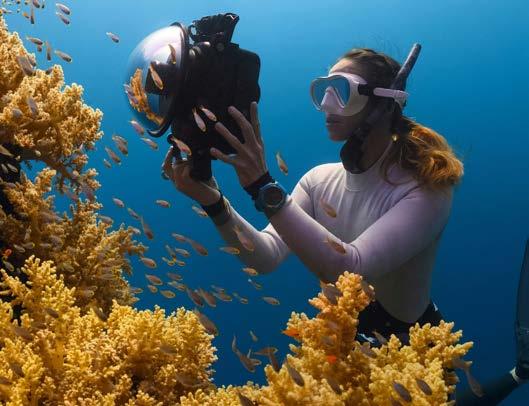
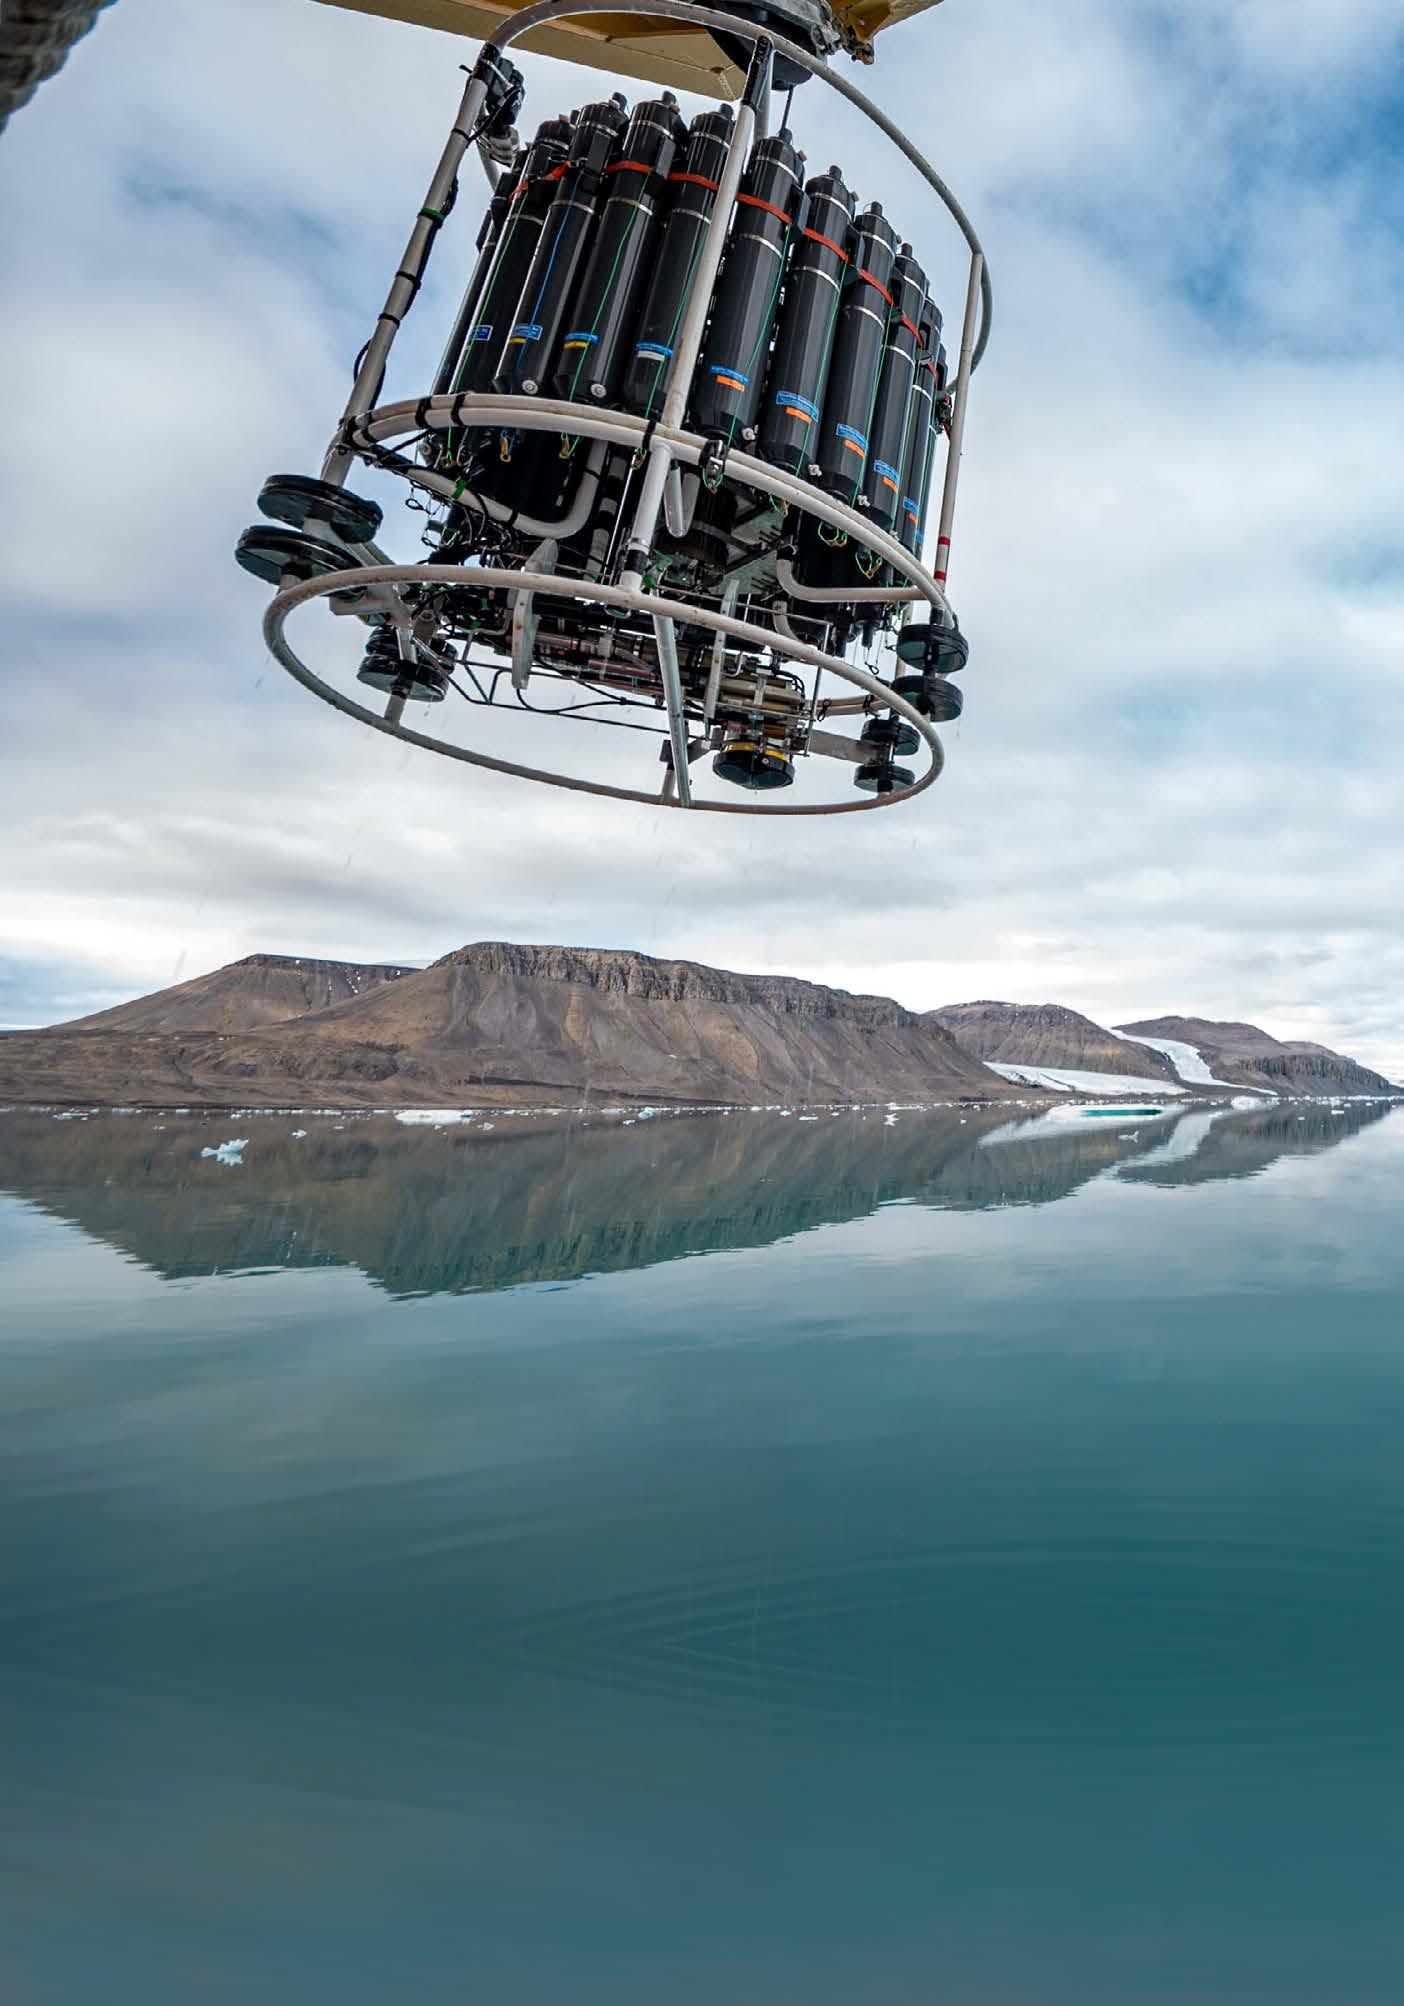
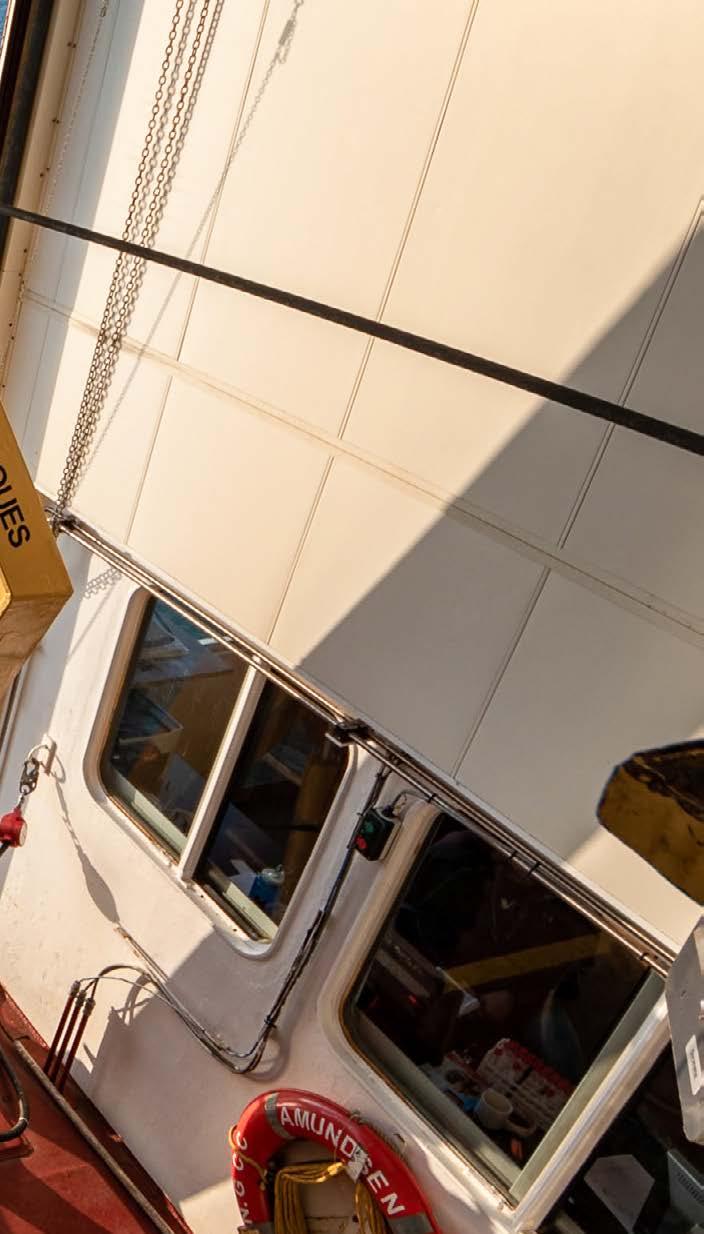
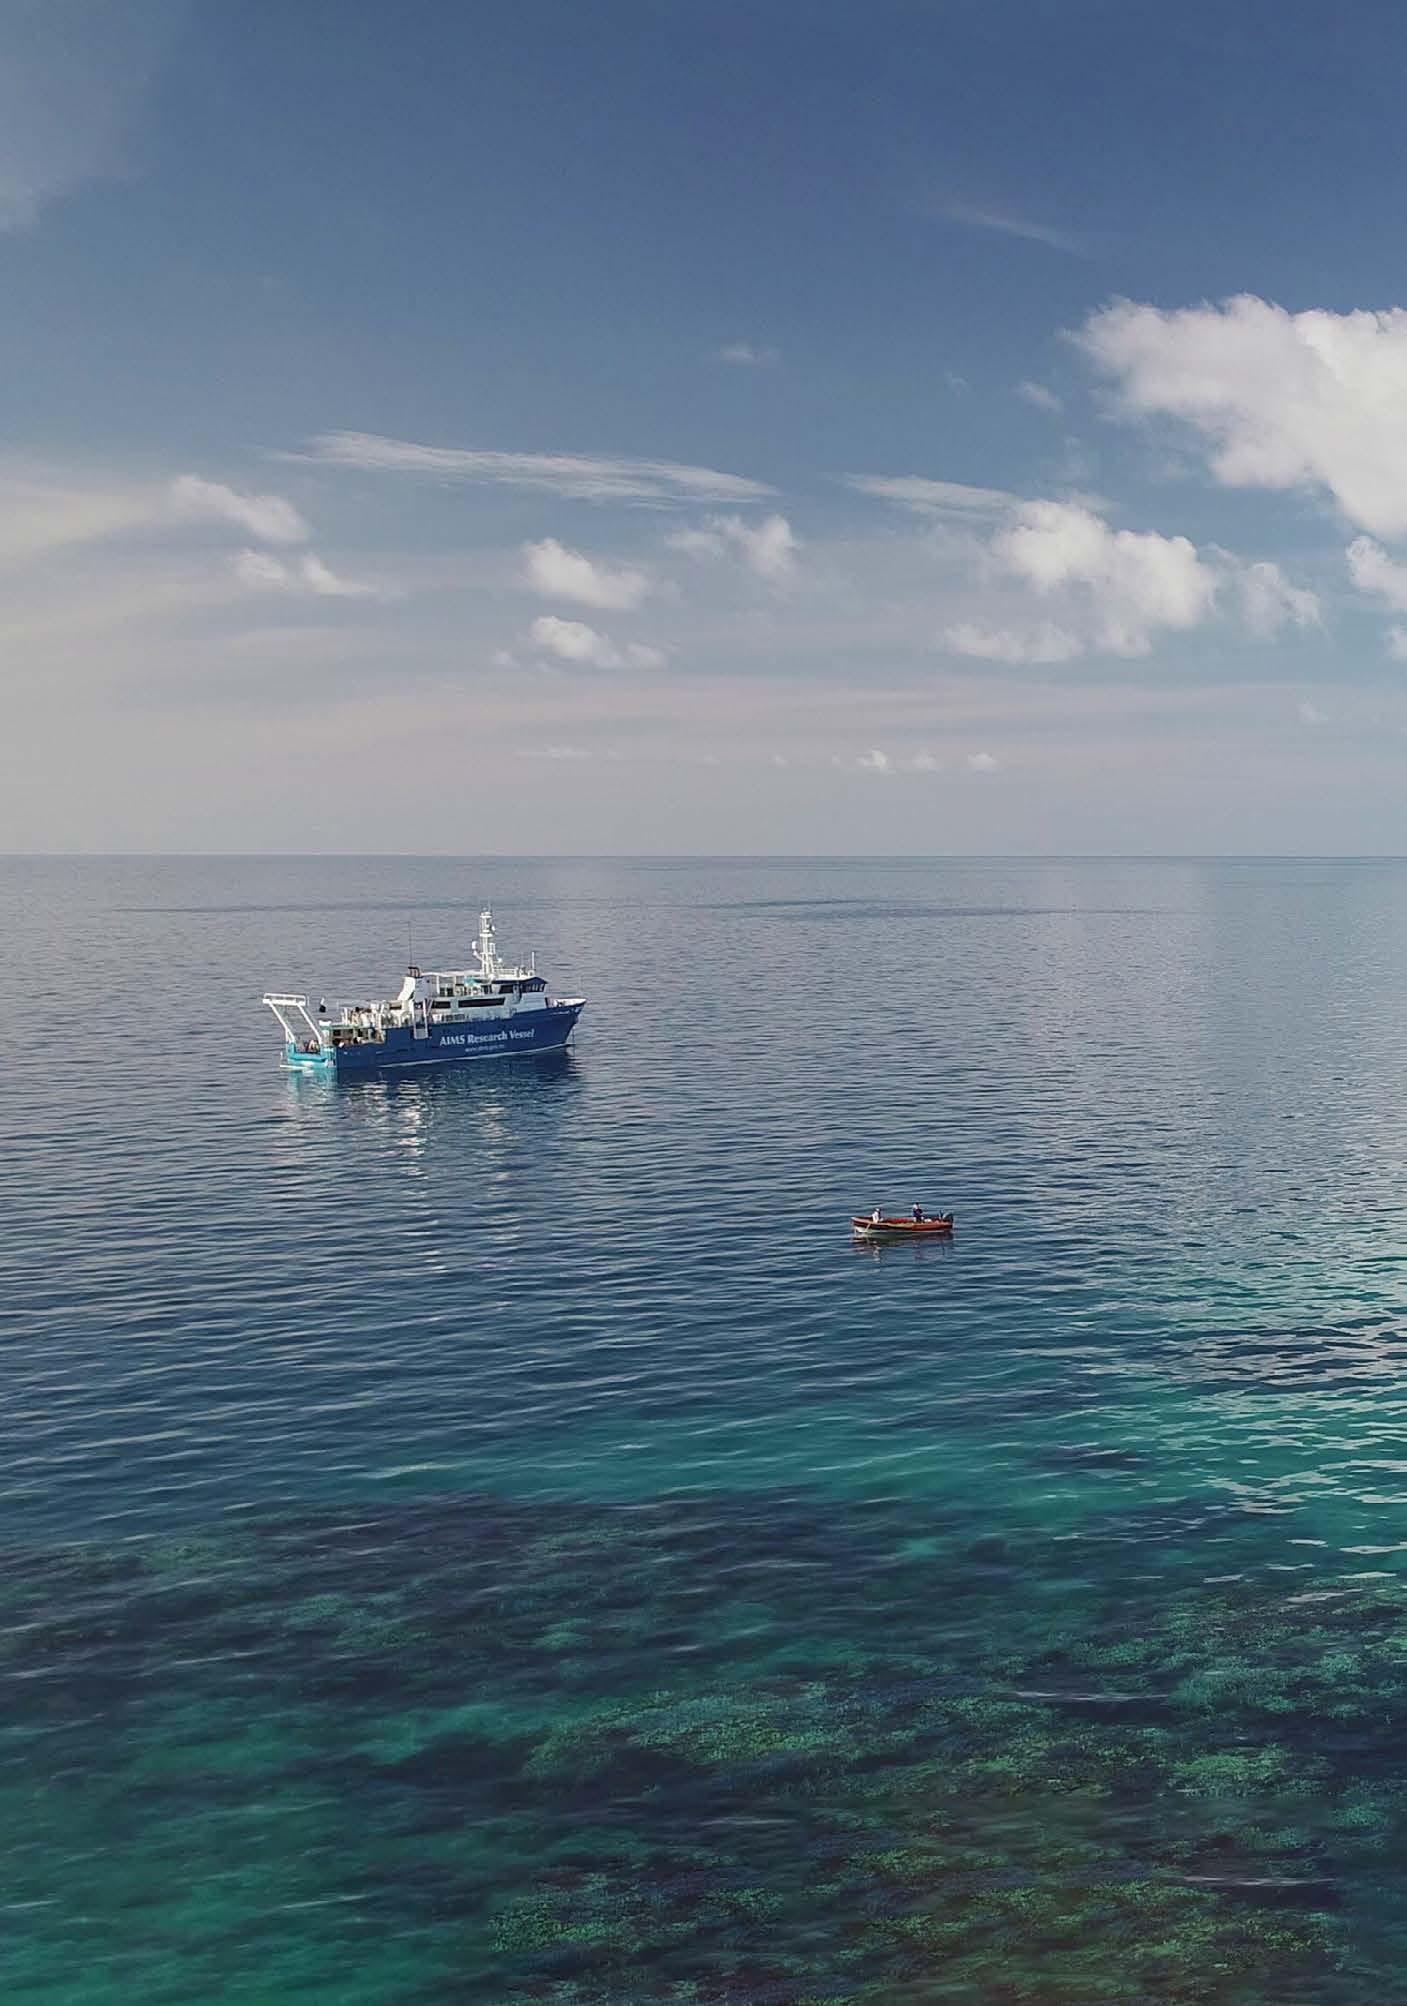
The immense potential of eDNA metabarcoding for sensing ocean biodiversity is reflected in its rapidly increasing use across diverse environments. In addition to its versatility in different environments, its noninvasive nature makes it ideal for monitoring biodiversity in sensitive environments such as marine protected areas. Additionally, since all that needs to be collected for marine environments is seawater or sediment, it is easy to collect, thus often not requiring a high level of expertise or a specialized research vessel (Figure 1). Consequently, this method is easily scalable, allowing users to collect many samples quickly. These attributes, in combination with a world where qualified taxonomists are increasingly scarce, have transformed eDNA metabarcoding into an ideal method for many users. Despite the many positive aspects of eDNA metabarcoding, transforming a water or sediment sample into a species list is a complex set of tasks, which can be unclear to new users.
While eDNA metabarcoding may seem like a single method to new users, in reality, it is a series of methods where each decision can impact the final output. First, sample preprocessing is simply filtering and/or storing those DNA samples after samples have been collected from the environment for further processing. DNA extraction occurs when the contents of the filter or sediment (e.g., cells) are broken down into their basic components, including DNA, removing unwanted materials and contaminants, purifying, and collecting the DNA. After extraction, the DNA desired for sequencing is amplified with genetic markers (a.k.a. primers), where short sections of DNA that have the potential to differentiate species are copied and reproduced many times using a chain reaction. Afterwards, DNA tags are attached to short DNA fragments so that they can be identified as derived from sample sequences in later stages of the process; this is known as library preparation. The tagged DNA is then pooled into a machine for sequencing that provides the specific order of base pairs (genetic building blocks of which there are four types) that make up the DNA fragments. Throughout these steps, quality checks are completed to ensure that the DNA is suitable for analysis and has not been contaminated by artificial sources during collection or in the lab. After the DNA has been sequenced, bioinformatic analysis is initiated, where the sequences are separated by the previously added tags. Those tags are then removed, and sequences are filtered, removing everything that does not pass quality control. Those sequences are then identified by uniqueness, which can ideally be assigned to a species by comparing sample sequences to a reference database of known species sequences. The output is a list of species from the eDNA samples.
Given the potential applications of eDNA, many researchers and organizations have expressed great interest in using this series of methods. As a result of this enthusiasm, new methods are constantly being developed. The
multitude of new and complex methods can often lead to new and even experienced users questioning the optimal processes to implement in eDNA monitoring programs. As with many new technologies and methods, eDNA metabarcoding has been scrutinized for many different reasons. This includes the potential for false positives, i.e., detecting species that are not present within the ecosystem of study, and false negatives, i.e., not detecting species that are present within the ecosystem of study. These outcomes can be due to contamination, sequencing ability or biases, or a lacking reference database. Because of this, some researchers remain skeptical of the results of eDNA metabarcoding analyses – even when similar problems exist for most conventional methods. Optimizing eDNA programs can, however, reduce the number of false positives and negatives and move towards a powerful sensor that researchers can rely on to detect biodiversity in marine environments.
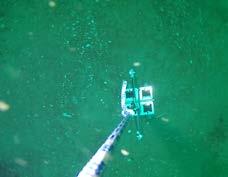
With some basic knowledge of eDNA metabarcoding methodology, this section provides a brief overview of decisions and considerations that can be made in developing an eDNA metabarcoding monitoring program. However, before beginning to optimize an eDNA program, users must understand the feasibility of completing this workflow (Figure 2). Processing eDNA for metabarcoding, including DNA extraction, amplification, library preparation, and sequencing, can be expensive if portions of the workflow are outsourced. However, this cost can be reduced if completed in-house, but it requires the facilities and the technical expertise to complete it.
Sample collection and post-collection sample processing are arguably the most important steps within eDNA metabarcoding, as they cannot be corrected through reanalysis. Therefore, the sampling design should be laid out well before collection begins. Decisions
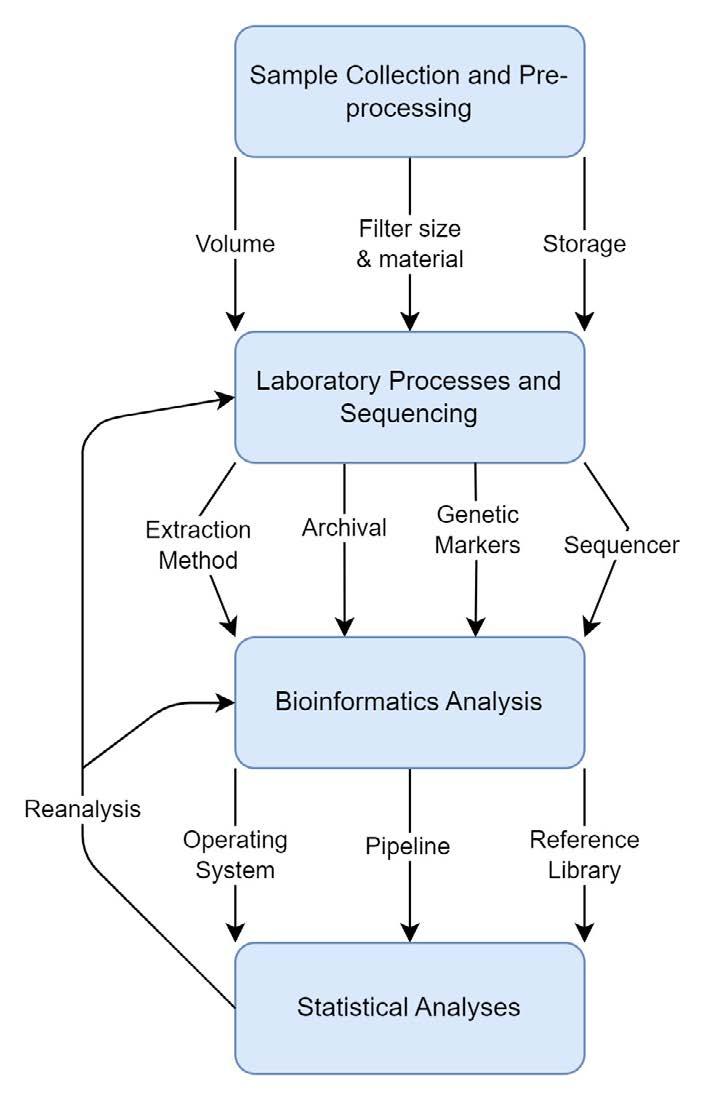
besides study location and sampling depth include sample volume, replicates, filter size and material (if sampling water), preservation methods, and contamination prevention measures. When eDNA metabarcoding was in its infancy, collecting small volumes of environmental samples, such as 250 ml, was deemed sufficient. However, the field has been moving towards collecting larger volumes (i.e., multiple litres) when analyzing eDNA from animals that are more sparsely distributed to obtain a more thorough depiction of the species present. However, larger volumes may not be possible, depending on the availability of at-sea collection containers. In this case, using multiple replicates can
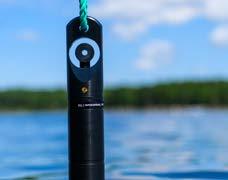
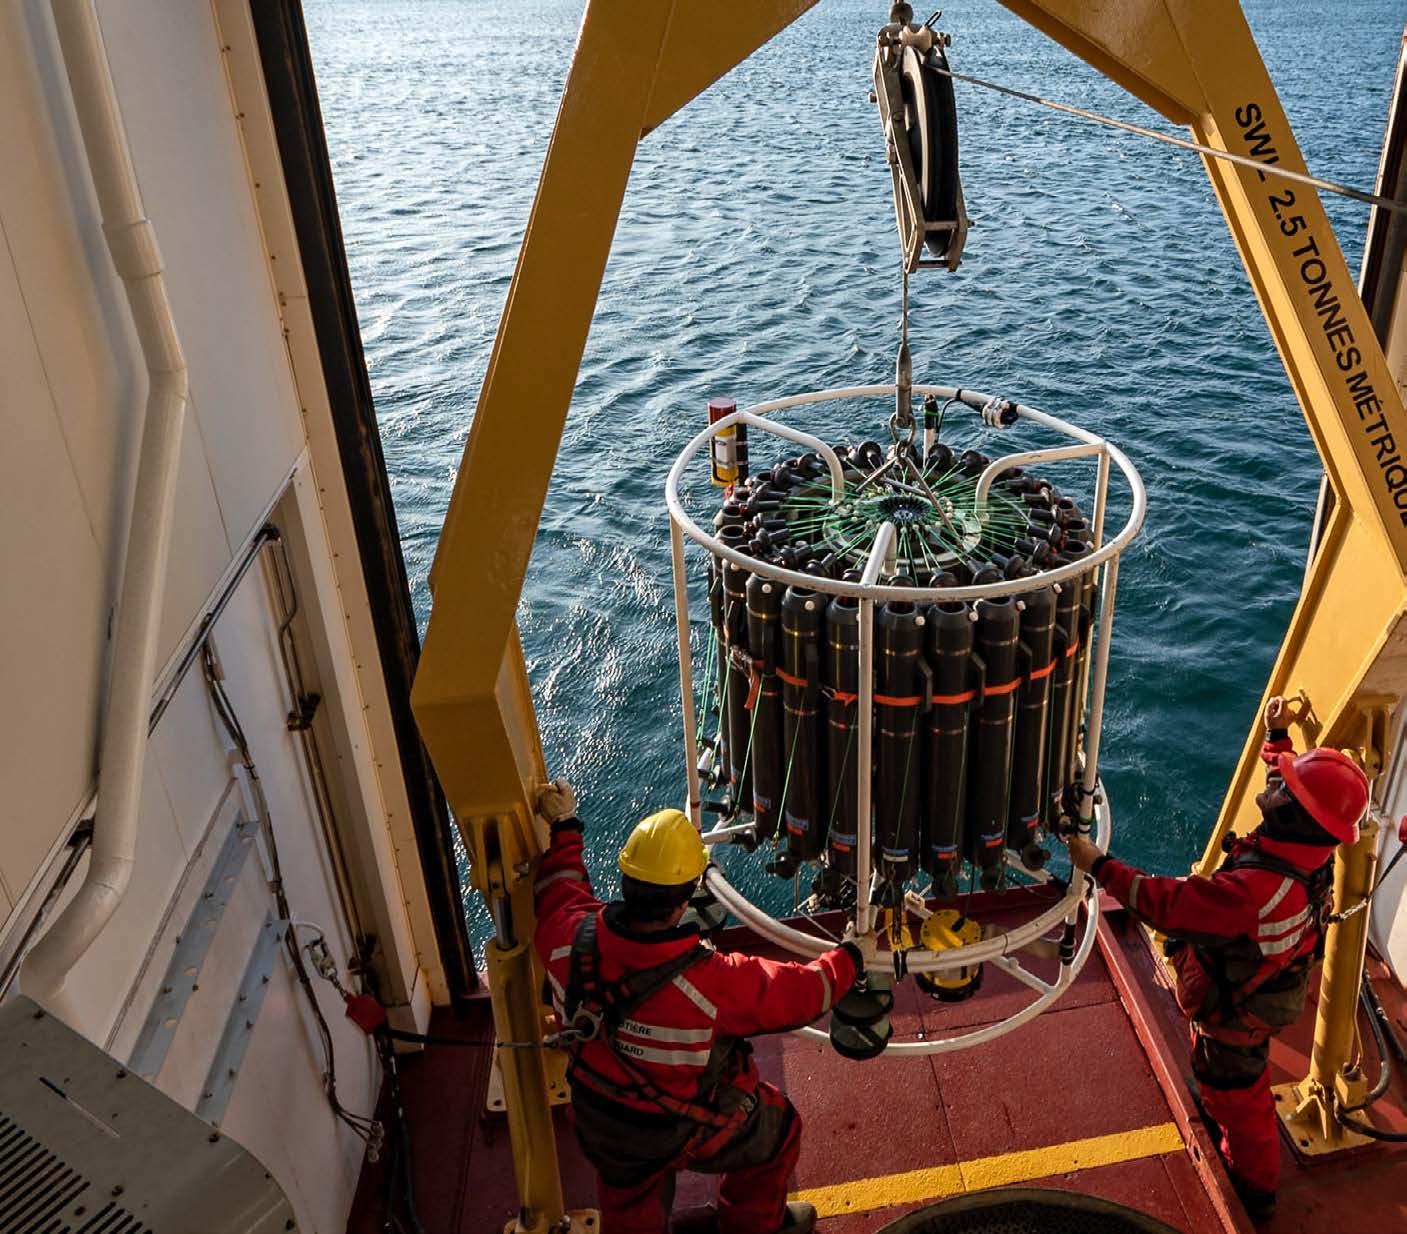
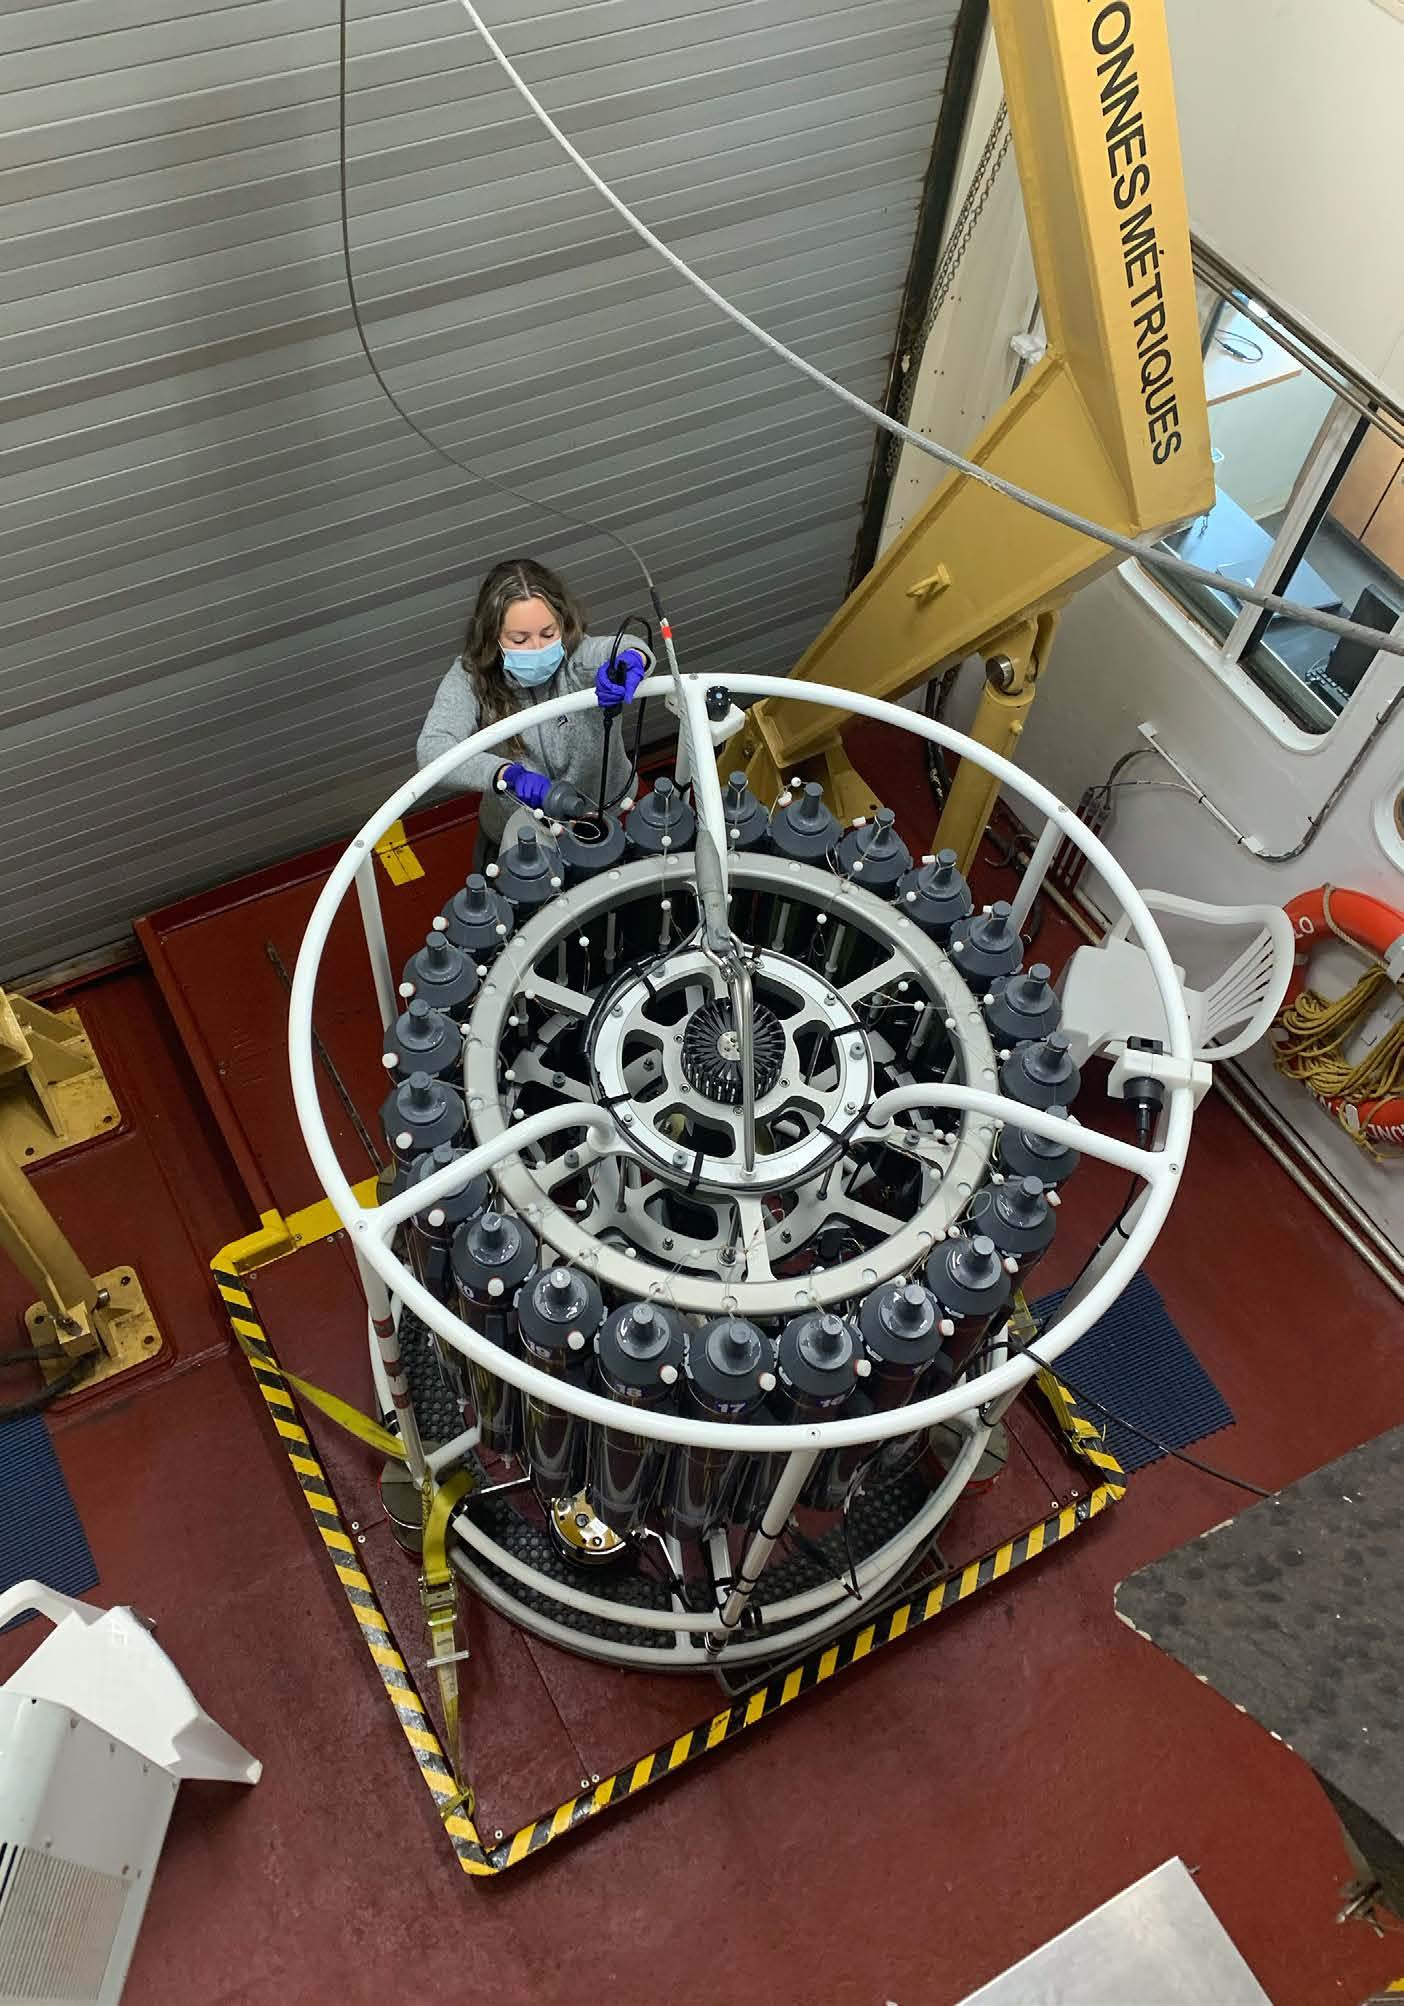
also increase the species lists via eDNA metabarcoding. Additionally, when collecting seawater, users should consider filtering the sample immediately before storing it. This prevents DNA degradation, as temperature and ultraviolet radiation can quickly destroy DNA in samples. Ideally, filtering samples should be completed in a clean space to prevent contamination (Figure 3). Although this cannot always be achieved depending on vessel capacity, users should consider including blanks (i.e., controls) in the field, in which clean, distilled water in place of eDNA samples is run through the sampling process to identify contaminating sources/species for removal in later processes.
previous deployments.
When choosing filters, one should consider the size and material of the filter, as both can influence the amount and type of DNA collected. Filters with smaller pore sizes can collect greater concentrations of eDNA but can be easily clogged depending on water volume and turbidity. The same goes for different kinds of filter material. Therefore, users should carefully consider the environment and volume of filtered water when selecting filters. As for storage of filters and/or sediment, freezing them in a -20 to -80°C freezer within sterile bags is one of the most common methods. However, similar to filtering, at-sea research does not always include the availability of a freezer; thus, other preservatives can also be used.
Laboratory processes and sequencing can begin after sample collection and pre-processing. The first step is DNA extraction, which has been made accessible to many researchers and organizations thanks to the multitude of available commercial kits. This includes commonly used kits for water, sediment, and animal tissue extraction, which can involve mechanical and/or chemical extraction. Kits allow users to choose the optimal extraction protocol for their specific needs. It is also possible to include an extraction blank at this point to identify any contamination that may have occurred during laboratory processes. Lastly, extracts can be archived for long-term storage, allowing the opportunity for future (re)processing (see below).
Choosing the genetic markers is another key choice within the eDNA metabarcoding process, as it determines which species sets are targeted (Figure 4). Each marker has inherent biases. This is because each marker targets a short genetic region, and a single region is incapable of differentiating all species. For example, if the study specifically targets fish, then genetic markers designed to differentiate fish sequences should be chosen. However, users should consider that a single genetic marker cannot detect all species or groups of
species and that using combinations of markers better characterizes community structure.
Library preparation and sequencing processes are related to one another as the preparation of adding tags to the sequence fragments will depend on the sequencing machine used. Sequencing machines are often expensive to purchase, and therefore, this step is often outsourced. There are many different machines from manufacturers such as Illumina, PacBio, and Nanopore, each having different sequencing depths and accuracy. Each sequencer model from these companies will have varied sequencing depth. Deeper sequencing allows users to sequence more of the DNA fragments from a sample, which means it has a better chance of capturing rarer species. However, higher sequencing depth comes at a greater cost; therefore, users must decide whether detecting rare species within samples is worth the extra expense. Additionally, if the study goal requires data products quickly for methodological adaptations, there are portable sequencing machines that can allow for immediate sequencing, even in offshore environments. However, these portable sequencers differ in sequencing depth and accuracy (having lower sequencing depths and reduced accuracy) than some sequencers from other manufacturers, potentially missing rare species detections. Therefore, the choice of optimal sequencer should be based on the priorities of the program.
While bioinformatics can seem daunting, many pipelines (software suites) have been created for those inexperienced with its software and programming languages. Choosing which pipeline for a particular program can be difficult, but one factor to consider is the operating software available, such as Linux, macOS, and Windows, as some software is limited to specific platforms. Additionally, the choice of reference database can be critical as this is how the species sequences found in environmental samples are determined. The largest reference database, NCBI’s GenBank,
has many sequences of identified species. However, the contents of this database are not verified and can contain misidentified species sequences. Because of this, it is sometimes best to use a curated reference database of verified sequences. This is ideal when users know which species should be found within the system of study. However, one of the major liabilities of eDNA metabarcoding is that reference databases often lack species, as many have yet to be sequenced and added to these databases, a problem that is more prominent in understudied species or environments.
eDNA metabarcoding is most often used for biodiversity assessments using presence/ absence data. Using eDNA metabarcoding to quantify species abundance is still in its infancy. However, some studies have been able to correlate eDNA sequence abundances with the local abundance or density of a species. These data have been used for monitoring ecosystems and conservation areas, finding invasive or endangered species, and much more. Many of the studies completed have compared the power of eDNA metabarcoding to other conventional technology, such as trawls and camera surveys, and most have found that eDNA metabarcoding detects greater diversity than the conventional techniques it was compared to, showcasing the capability of eDNA metabarcoding. However, as previously mentioned, eDNA metabarcoding does have limitations, and users can apply strategic use of complementary methods that may be required to address study goals. Applications of eDNA continue to expand such as using eDNA metabarcoding for food web analysis to answer ecological questions, increasing the versatility of this molecular sensor.
One of the many benefits of eDNA metabarcoding is the ability to reanalyze data at different parts of the workflow. For example, suppose new genetic markers are created. In such a case, DNA extracts, when archived, can be reanalyzed with new genetic markers targeting species that may have been
missed. Additionally, as reference libraries are updated, sequences can be re-run through a bioinformatic pipeline to determine if species were missing due to a lacking reference database. There are few conventional methods that can be reanalyzed as effectively and efficiently as eDNA metabarcoding.
Alongside efforts to optimize eDNA metabarcoding, there has been a large push in the scientific community to standardize eDNA metabarcoding. Standardizing eDNA workflows will enable researchers and organizations to achieve comparable and reproducible data, allowing them to compare datasets from different studies or geographical locations. However, the variety of applications of this technology will create conflicts in achieving both optimal practices and standardization. Standardizing this field may not benefit individual studies as different environments (freshwater vs. marine, coastal vs. offshore vs. estuarine) and objectives, such as species of interest, may require different methods for optimal results that would not conform to a set standard. As methods and tools quickly advance, the standard protocol with current technology may not be ideal in the future. Therefore, standardizing all aspects of the eDNA workflow may not benefit researchers or groups using eDNA metabarcoding.
Widescale standardization may not be feasible, but standardization may still be beneficial within more specific fields. For example, research groups and large organizations can incorporate a common general biodiversity genetic marker in all eDNA metabarcoding programs. Though this will have marginal increases to the cost of each program, it allows the ability to compare a portion of the data across different studies/regions using eDNA. Additionally, since laboratory methods can be reanalyzed, having standard sample collection and pre-processing methods enables the possibility of creating a standard dataset, if desired. Further, optimal practices can be
instilled for studies within a program such as including the use of blanks, both in the laboratory and field, as well as maintaining consistent preservation methods. These compromised solutions illustrate how eDNA metabarcoding workflows can be standardized for large-scale programs while maintaining optimal methodologies for individual studies.
One hundred and fifty years after the celebrated HMS Challenger expedition, the quest continues to explore the diversity of life in the deep ocean frontier and across the world’s other ecosystems that are increasingly under threat. eDNA metabarcoding is already a great asset in achieving this goal. However, it requires optimization as did the methods of the past eras. Reflecting on John Murray’s quote, we can see that eDNA technology has and continues to advance science in great strides. The immense versatility and accessibility of this molecular sensor will no doubt solidify it as a core survey tool for years to come. Just as the researchers of the HMS Challenger could not have envisioned the ability to detect marine communities from a cup of seawater, there is little doubt that future developments in genetic tools will be beyond our imagination of today. u
Gordon H.R. de Jong is a master’s student in fisheries science at the Fisheries and Marine Institute of Memorial University of Newfoundland. Having interests in genomic methodologies, marine ecology, and conservation, his primary aim for his master’s is to understand the potential application of environmental DNA metabarcoding for monitoring Canadian marine conservation areas, specifically focusing on how community composition, determined using environmental DNA, changes across space.
David Côté is a research scientist at Fisheries and Oceans Canada, working within a team devoted to achieving Canada's marine conservation targets. Collaborating closely with Indigenous communities, harvesters, and academic institutions, this team harnesses interdisciplinary synergy to characterize and safeguard biodiversity in some of Canada's most beautiful marine areas.
Dr. Jonathan A.D. Fisher is an associate professor and research chair in marine fisheries ecosystems dynamics at the Centre for Fisheries Ecosystems Research, Fisheries and Marine Institute of Memorial University of Newfoundland. His primary research goals are to understand and quantify how changing environmental conditions and fisheries alter the characteristics and recovery dynamics of marine populations, communities, and ecosystems – with a focus on Newfoundland and Labrador and the eastern Canadian Arctic.
Developing Sensing Strategies for Uncrewed Systems Testing and Proving
by Michelle Barnett, Patrick Bunday, and Vic Grosjean
With the ever-increasing pressures of climate change, population growth, and human use, the state of the world’s ocean is in decline. Yet, by improving our understanding of the ocean and comprehension of these pressures, there is opportunity to drive a healthy, resilient, and productive ocean that benefits human safety, well-being, and prosperity.
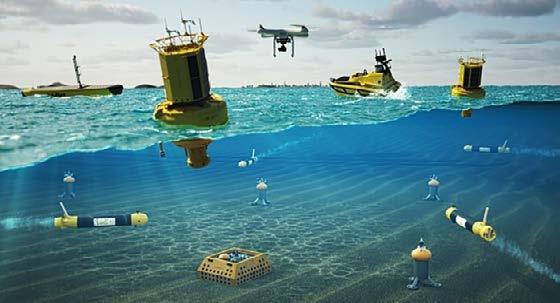
To better understand the ocean environment, enhanced ocean observation and measurement is essential. This involves development of next-generation technologies from subsea sensors to autonomous monitoring systems, and the establishment of safe, economical, environmentally sustainable, and efficient ocean observation operations. This means that uncrewed vehicles and intelligent instrumentation have an increasingly significant part to play in ocean measurement campaigns.
Development of next-generation marine technologies includes testing, and as such we are seeing development of subsea test beds in several countries across the world. A prime example of an underwater testing environment is being delivered in Plymouth, UK, by the Smart Sound Connect Subsurface (SSCS) project. Using instrumentation supplied by technology partners Sonardyne International Ltd., the SSCS project is delivering an underwater acoustic communications and navigation network that will link to existing surface assets to facilitate the world’s first ocean-focused 5G proving ground for subsea innovation (Figure 1). Integrated seabed sensor nodes will also provide real-time reporting of
oceanographic parameters (currents, waves, temperature) critical for operational safety and for full calibration of the test facility (Figure 2).
Sonardyne International Ltd. is a global subsea engineering company specializing in the design, manufacture, and supply of acoustic positioning, inertial navigation, acoustic and optical communications, monitoring, wireless control, and autonomous data acquisition products for a diverse range of underwater applications.
Similar to Smart Sound, several other subsea technology testbeds are being developed in temperate and even boreal climates. Indeed, the focus of subsea technology testbed development has been in such climates. Yet, 42% of the world’s ocean is tropical, a marine environment very different to its temperate and boreal counterparts, presenting a whole host of operational challenges, including extreme heat, aggressive biofouling promoted by the warm waters, strong ocean currents, remote expanses, hazardous marine predators, substantial sand shifts, and extreme tropical weather.
One of the first to address the gap presented by the lack of tropical underwater testbeds was the Australian Institute of Marine Science (AIMS) with its ReefWorks test ranges. AIMS, headquartered in Townsville on the northeastern coast of Queensland, Australia, is a world leader in tropical marine
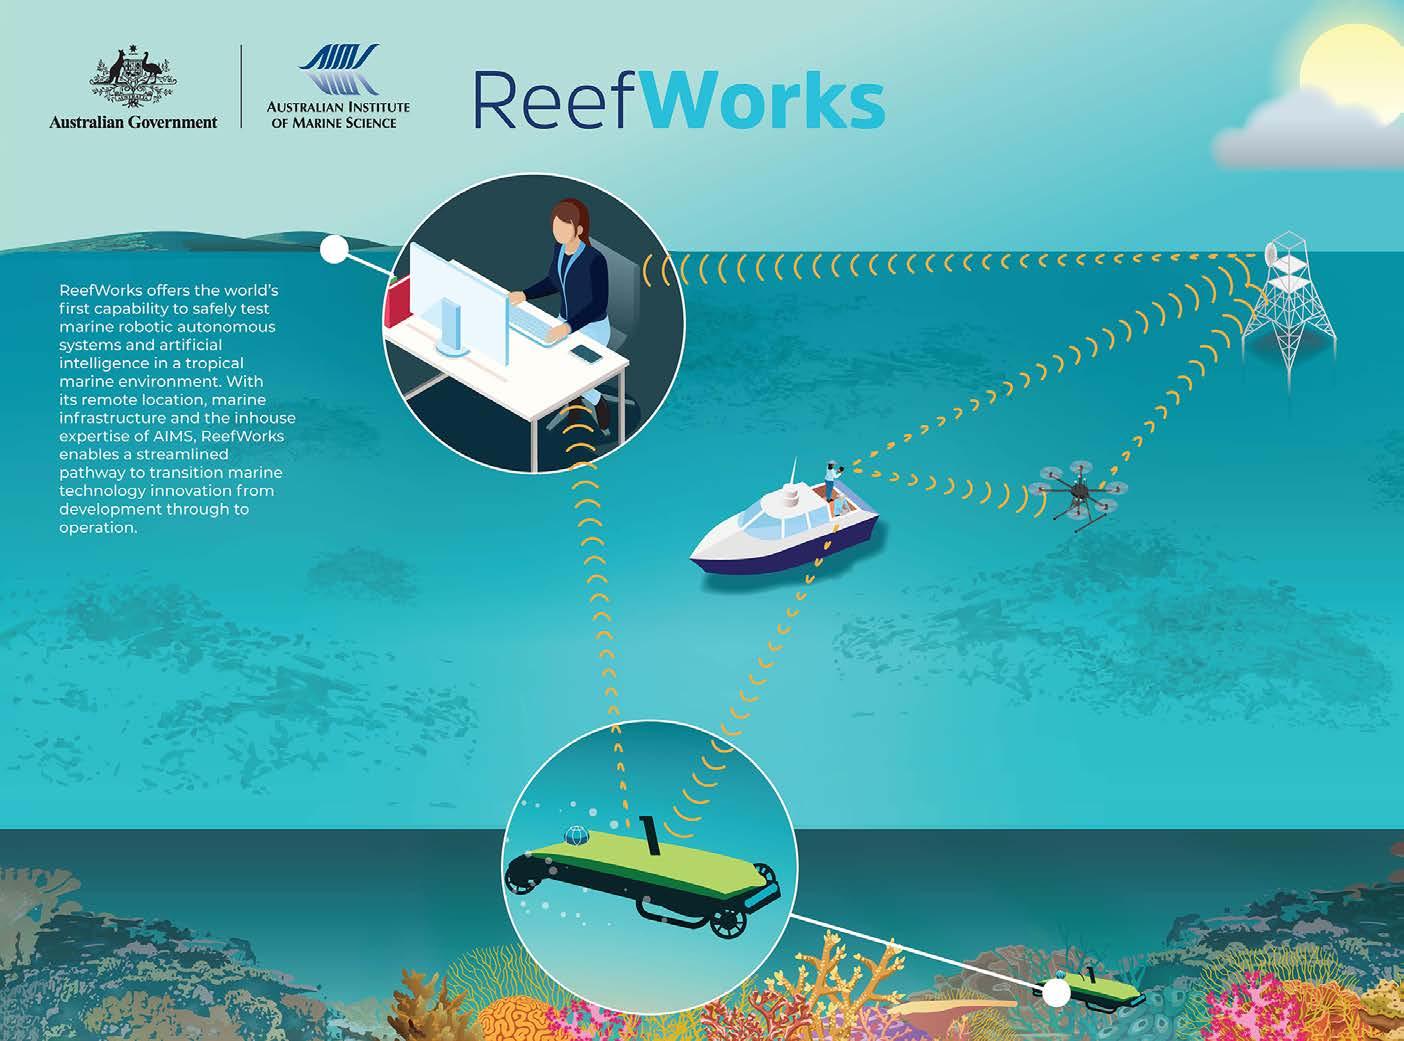
research, providing unique insight into Australia’s tropical waters, and knowledge to develop globally relevant and innovative research solutions. The institute is developing ReefWorks, a sandbox consisting of several authorized test ranges situated within the Great Barrier Reef covering approximately 348,000 sq/km. This premier tropical marine test facility provides a flexible, scalable architecture to overcome environmental complexities unique to tropical Australia, allowing for the development of trusted uncrewed marine technologies in tropical waters (Figure 3). At ReefWorks, marine system developers can rigorously test their platforms in real world conditions to improve and demonstrate technology readiness level to regulators, thus facilitating the transition
from traditional human-centric data acquisition methods to uncrewed marine technologies.
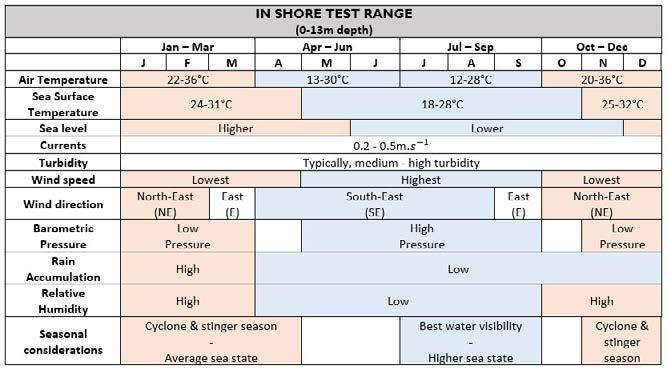
To support its ReefWorks users, AIMS needed to identify an array of integrated real-time technologies for understanding test range conditions to support system testing and proving in the challenging tropical, shallow environment. Specific challenges presented by the ReefWorks environment include warm water, turbidity, currents, shallow water, and sea states that change rapidly with the wind and tide.
To meet these diverse testing requirements, a solution integrating real-time current and water quality information was proposed as an initial proof-of-concept. This solution was to
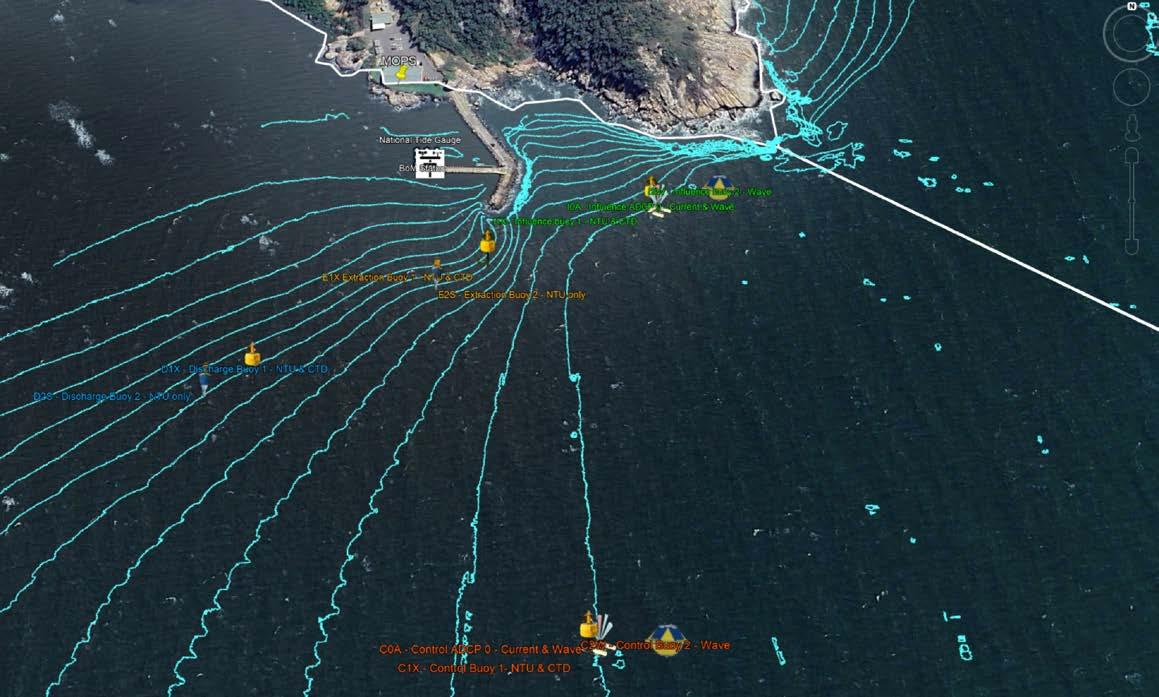
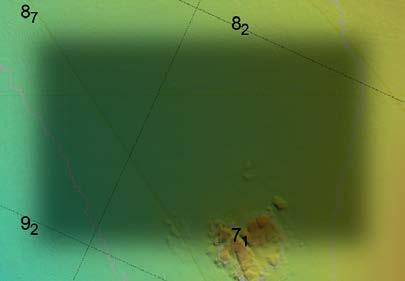
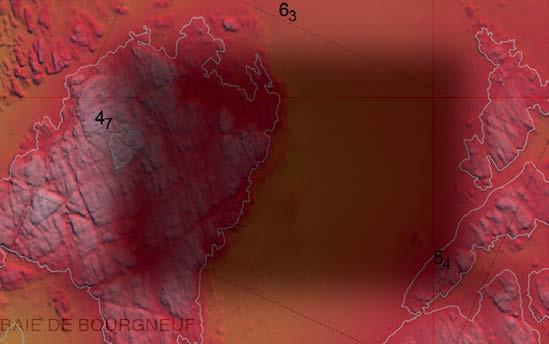
Figure 4: Deployment map of ReefWorks trial showing deployment locations of instrumentation at influence and control locations. Technologies deployed include Sonardyne Origin 600 ADCPs, YSI DB600 water quality Xylem buoys, turbidity SESA buoys, smart moorings, and Spotter buoys.
bring together recent advancements in realtime underwater communication and machineassisted data analysis to enable seamless integration of standard communication protocols into oceanographic marine sensing.
Between November 2023 and March 2024, AIMS, with the support of partners including Sonardyne, put this solution into action.
A range of technologies with real-time data capability were extensively trialled, including wave buoys, ADCPs, and water quality multiparameter instruments integrated on floating buoys linked to an Eagle.io cloud-based data visualization platform (Figure 4). The proposed outcomes were to (1) identify technologies able to deliver real-time data that supports development of an autonomous systems test range; and (2) collect data that will support future activities, such as periodic maintenance dredging and sea water pumping for the National Sea Simulator.
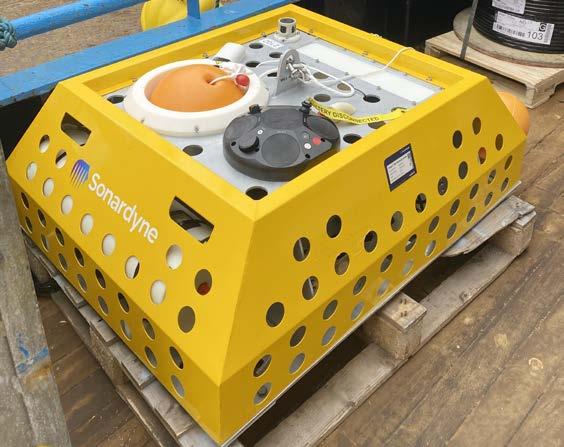
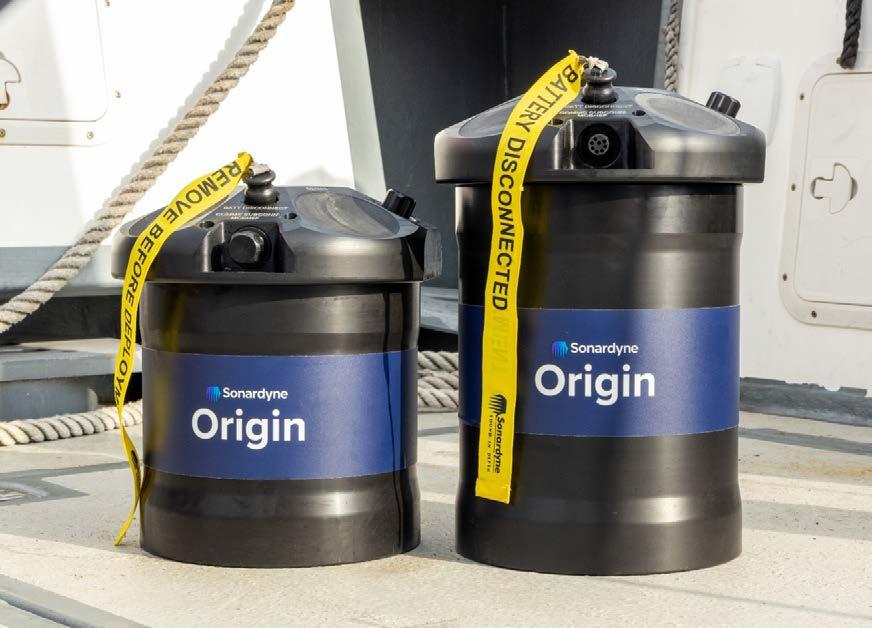
Sonardyne was responsible for supplying ADCPs for the proof-of-concept study at the ReefWorks facility, specifically its Origin 600 ADCPs. The Origin 600 is an “all-in-one” unit ADCP with integrated modem and onboard
Edge data processing functionality (Figure 5); the pairing of these two features enables realtime data reporting of critical oceanographic variables, including currents, waves, and temperature, from the seabed to the surface. The Edge functionality works to process data on board the instrument via implementation of a data processing algorithm that outputs an NMEA-format string small enough to be exported over the acoustic modem.
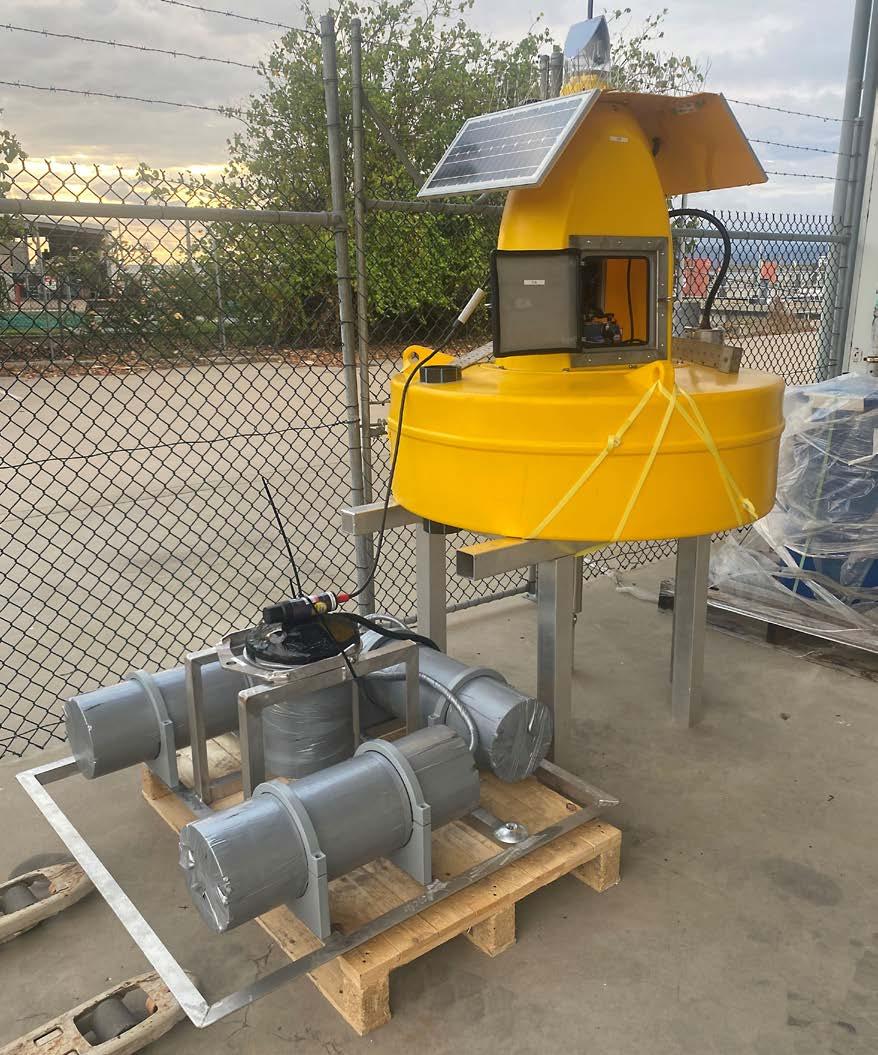
Leveraging the capabilities of the Origin 600 ADCP running a currents and waves data processing Edge algorithm, and by integration of a Sonardyne topside “Nano” modem with a YSI DB600 water quality Xylem data buoy (Figure 6), real-time oceanographic data on the range could be obtained. AIMS and Sonardyne collaborated to integrate the data exported via the Nano Modem into Eagle.io via the Xylem buoy logger. Modifications to the RCBasic script on the Campbell datalogger facilitated data extraction from the Nano Modem attached to the Xylem buoy, enabling real-time data retrieval to Eagle.io.
The Eagle.io dashboard (Figure 7) enabled the observation of oceanographic parameters
AIMS
Figure 6: Subsea (Sonardyne Origin 600) and topside (Sonardyne “Nano” modem attached to YSI DB600 water quality Xylem buoy) instrumentation set-up for realtime reporting of oceanographic data on the ReefWorks range.
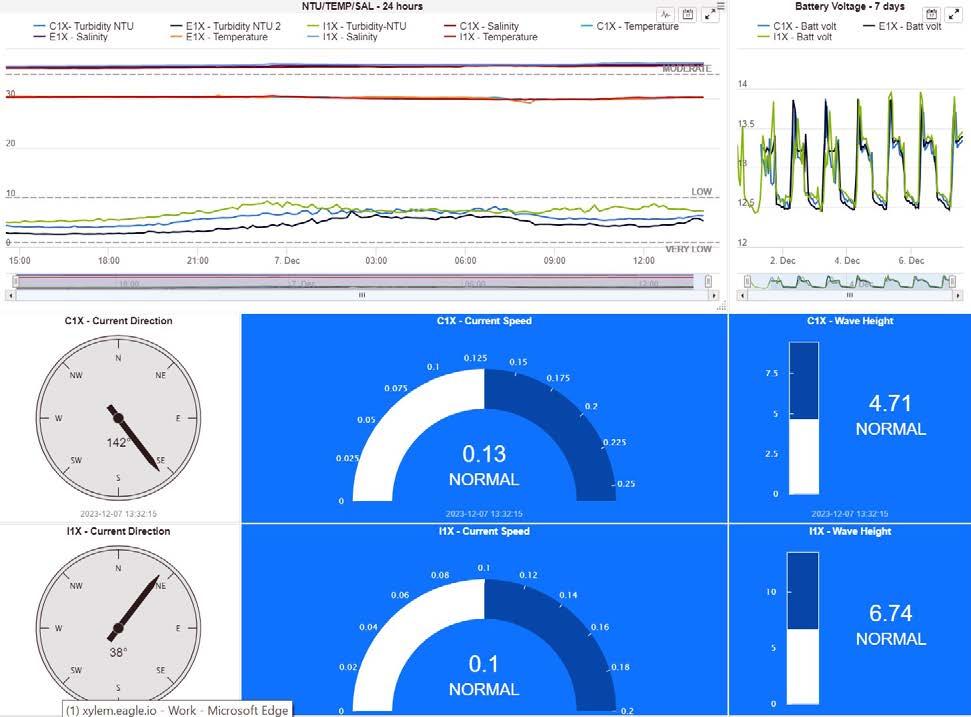
and system statuses over the deployment period, and aided decision-making for testing timing and platform selection. The comprehensive collection of data captured encompassed solar, atmospheric conditions, hydrographic data, wave parameters, power metrics, instrument status, and location data. Furthermore, the real-time map displayed on the Eagle.io dashboard tracked asset movement, enabling proactive monitoring and responsive decision-making based on current asset locations and conditions in the field (e.g., anchor slip, mooring failure), with autonomous real-time alerts set up to ensure operational integrity and timely response to anomalies. Specific alerts for instrument malfunction, high turbidity, extreme weather, battery voltage, positioning ringfence, logging, and abnormal sudden turbidity increase were included. Many of these alerts were triggered by the passage of Cyclone Kirrily, which served as a pivotal scenario to assess the resilience of the tested technologies deployed during the cyclone season (Figure 8). The tropical cyclone
challenged the trial by damaging most of the instrument buoys. However, its passage was initially tracked hour by hour from a remote location in real time thanks to the technologies selected for the trial. This in itself is worthy of examination.
Extreme weather events like tropical cyclones provide critical real-world test scenarios for evaluating the robustness of deployed technologies. The increasing prevalence of such events underscores the need for resilient and adaptive marine technology testing environments. The tests conducted at ReefWorks faced a rigorous weather event during Tropical Cyclone Kirrily, which reached Category 3 at 3pm on AEST January 25, 2024 (Figure 9).
On the approach of the cyclone, some team members relocated to Melbourne to undertake the monitoring of the cyclone in an area not affected by power loss. A support team
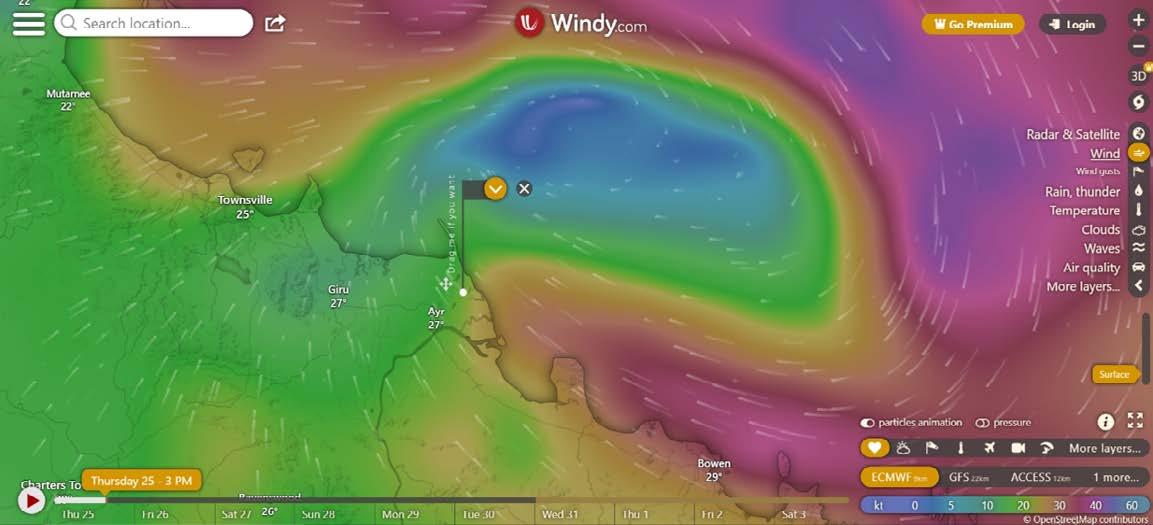
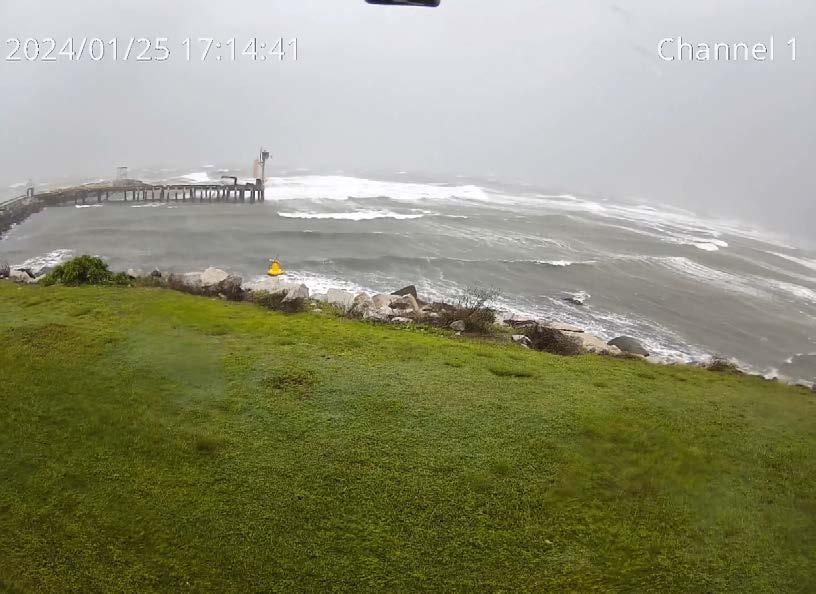
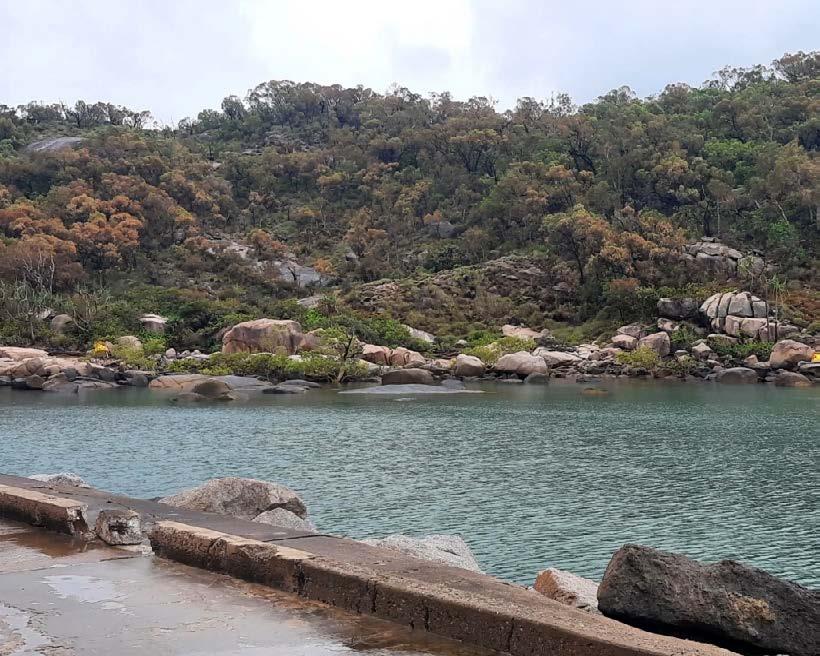
remained in the Townsville region, which was already affected by power loss issues. Tropical Cyclone Kirrily made landfall on January 25, 2024, impacting deployed systems in the test zone. Wind and wave activity escalated throughout the day, leading to the loss of contact with the Cape Bowling Green weather station and one ADCP at 1pm. Turbidity levels and wave heights increased at 3pm when the cyclone reached category 3. Between 4pm and 5pm, the Xylem buoy bungee cable snapped, and the buoys headed towards the rock cliff (Figure 10).
By 7pm, wave heights reached nearly three metres. At 8pm, AIMS lost power on-site resulting in significant data gaps, including the loss of data collected by the Bureau of Meteorology Automatic Weather Station (AWS) located on the wharf. Satellite Iridium-
enabled devices continued to report wave and position data until the connectivity fully stopped overnight.
Cyclone Kirrily revealed critical challenges and insights from deployed systems. Redundancy in communication systems was crucial when 4G connectivity was lost, prompting a shift to redundant instruments with Iridium-enabled satellite links. Larger assets, particularly noncyclone-proofed buoys, faced heightened risks, underscoring the need for robust and modular infrastructure capable of withstanding extreme conditions. ADCPs deployed at shallower depths were susceptible to sediment burial.
Power outages disrupted data acquisition efforts, affecting systems without uninterruptible power supplies (UPS), especially security cameras. Strategic
placement of these cameras proved essential, with recommendations for elevated installations to enhance coverage and resilience. Accurate asset positioning during deployment emerged as crucial for efficient post-cyclone recovery operations.
Despite the challenges, Eagle.io’s real-time monitoring capabilities were invaluable, though enhancements in data visualization and the use of physical cameras with reliable power
backup are needed. This would particularly help prevent data misinterpretation such as when the Xylem buoys continued to report turbidity and CTD data the day after the cyclone while being lodged on the cliff (Figure 11)
Over the days following the cyclone, service was slowly re-established. Recovery efforts revealed varying states of disrepair among
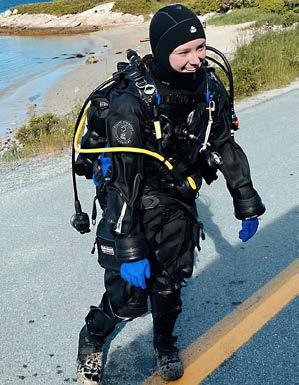
the equipment, buoys had disappeared, and one ADCP was buried. The few test systems which remained active were significantly weakened and detached or went offline a couple of weeks after the cyclone. The use of scuba divers and helicopters for equipment recovery (prior or after the cyclone) was identified as more effective and safer than traditional vessel-crane-based methods for efficient asset retrieval.
Post-cyclone recovery efforts focused on assessing asset displacement and damages. Buoys were all recovered in varying states of disrepair, necessitating refurbishment, upgrades, and recalibration. The loss of a SLB700 buoy highlighted some vulnerabilities in the deployment location strategies.
Lessons from recovery efforts emphasized redundancy in communication systems, robust construction and deployment practices for larger assets, the need for seasonal suitability assessments, and the necessity for UPS systems. Strategic placement of security cameras and accurate asset positioning during deployment emerged as critical for efficient asset recovery. The effectiveness of alternative recovery methods was highlighted, offering lower cost, greater flexibility, and better safety for future operations.
The trial was certainly a success, demonstrating how real-time data from a variety of sensors can be collected, collated, and transmitted, and how such real-time monitoring capability is key for establishing efficient test regimes. This opens the potential for the development of a marine synthetic environment (digital twin), delivering information on a variety of parameters to support the needs of ReefWorks range users, or to support and inform operators of sea water pumping and maintenance dredging activities.
While a success, the trial also faced challenges presented by the shallow, tropical environment, culminating in the extreme weather event, and these are worth exploring
too. We include assessment of the efforts to overcome specific challenges, a closer examination of the impact of the cyclone on real-time subsea to surface communications, and insights gained from the trial.
The first challenge was establishing communications between the Origin modem and the Nano modem mounted on the YSI buoy in one of the most difficult environments to handle acoustic communications – shallow water, in this case operating in only 6-8 m water depth. The strategy for approaching this challenge was to mount the Origin 600 ADCPs on a low-profile frame in line of sight with the Nano modem on the Xylem buoy and adopt a special mooring design using bungees. These bungees accommodated maintenance of line of sight by preventing the YSI data buoys from moving far away from the seabed ADCPs; however, were unsuitable to withstand extreme weather events.
Communications were extensively challenged by the passing of Cyclone Kirrily. The violent weather conditions provided real insights into the most extreme conditions the equipment could face when deployed. The Origin 600 ADCPs continued to log data subsea and could have still been remotely accessed via their integrated modems if the Nano modems on board the Xylem buoys had not been compromised by striking the rocks. This gave important insights of the requirements for surface infrastructure to support the establishment of ReefWorks test ranges.
In addition to presenting a challenge to communications, the shallow water on ReefWorks inshore test range imposed a requirement for the design and implementation of special low-profile ADCP frames to prevent the YSI DB600 water quality data buoys from hitting the Origin 600 ADCPs at low tide and during the deployment. In this effort to overcome one challenge of the ReefWorks environment, another presented itself in the form
of sand and sediment shifting and covering the bedframe, particularly during the cyclone. With sediments having the potential to compromise ADCP data, redesign of the bedframes needs to be considered moving forward.
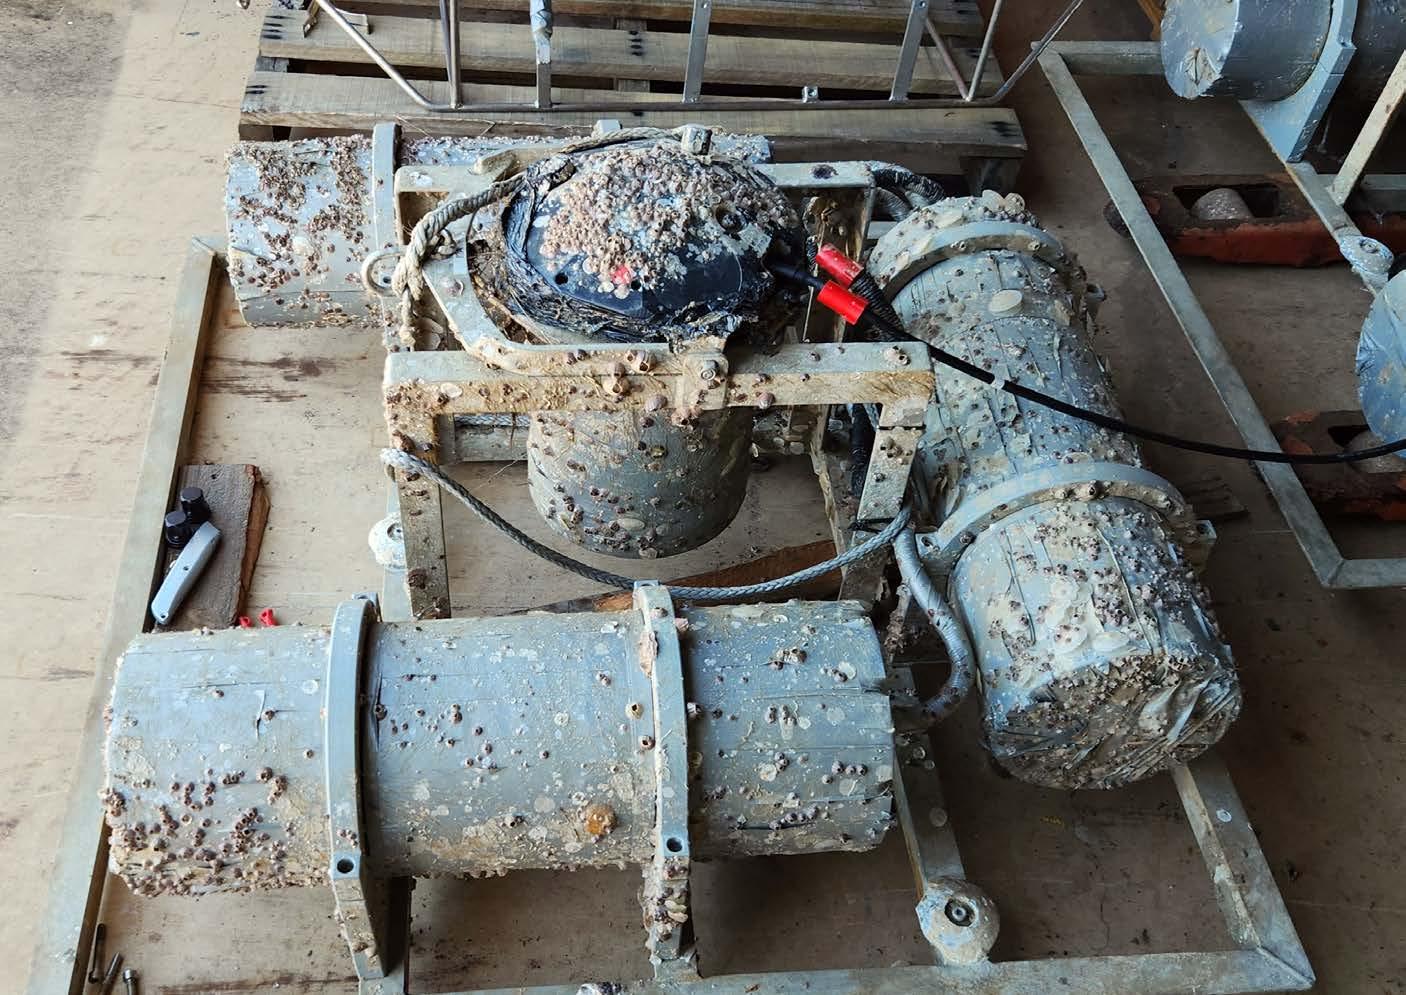
A final challenge contended with was the intense biofouling prevalent during the warmer months in tropical Queensland, which included adhesion of large barnacles on top of the ADCPs (Figure 12). This prompts adoption of a high-performance anti-foul coating to protect the ADCPs from marine growth and fouling in future.
The ReefWorks trials, buffeted by the challenges of a tropical marine environment, emerged with a roadmap for a robust collaborative testing ecosystem. This ecosystem caters to the diverse needs of global uncrewed system operators and
instrument manufacturers. Innovative subsea technologies, like Sonardyne’s Origin 600 ADCP, with its real-time reporting capabilities, have been shown to have a significant role to play within this ecosystem.
Cyclone Kirrily served as a baptism of fire, revealing the critical need for enhanced communication redundancy, robust infrastructure, and effective real-time data collection. Valuable insights informed the development of more resilient mooring designs and refined sensor performance analyses. Additionally, they bolstered a comprehensive business case for ReefWorks’ continued operation.
In addition, the trial demonstrated the power of technologies for ocean monitoring in general and gaining actionable insights, a power which should not be underestimated in our quest to improve our understanding and management of the ocean. u
Dr. Michelle Barnett is the business development manager for ocean science at Sonardyne International Ltd. She has been responsible for supporting development of Sonardyne’s ocean science global business since 2021, with a special focus on the Origin Acoustic Doppler Current Profiler (ADCP) instruments. She has a strong academic background in the ocean sciences, culminating in a PhD in marine biochemistry from the University of Southampton funded by the Graduate School of the National Oceanography Centre Southampton.
Patrick Bunday is the operations planner at the Australian Institute of Marine Science (AIMS). He works on long-term planning and strategy at AIMS to ensure the institute’s infrastructure and operations meet future science needs. He works on identifying, implementing, and optimizing utilization of capability to meet forecast science requirements; and has a background across a range of industries in continuous improvement.
Vic Grosjean is the ReefWorks systems engineer, at the Australian Institute of Marine Science (AIMS). He specializes in environmental monitoring, ocean instrumentation and uncrewed systems applications. With a formal qualification in mechatronics engineering and physical oceanography, he has worked over the past 18 years in the ocean and environmental technology fields. He is now setting up ReefWorks 2.0 using state-ofthe-art ocean instrumentation, high-accuracy positioning, and high-speed communication across AIMS test ranges.
by Iago Gradin
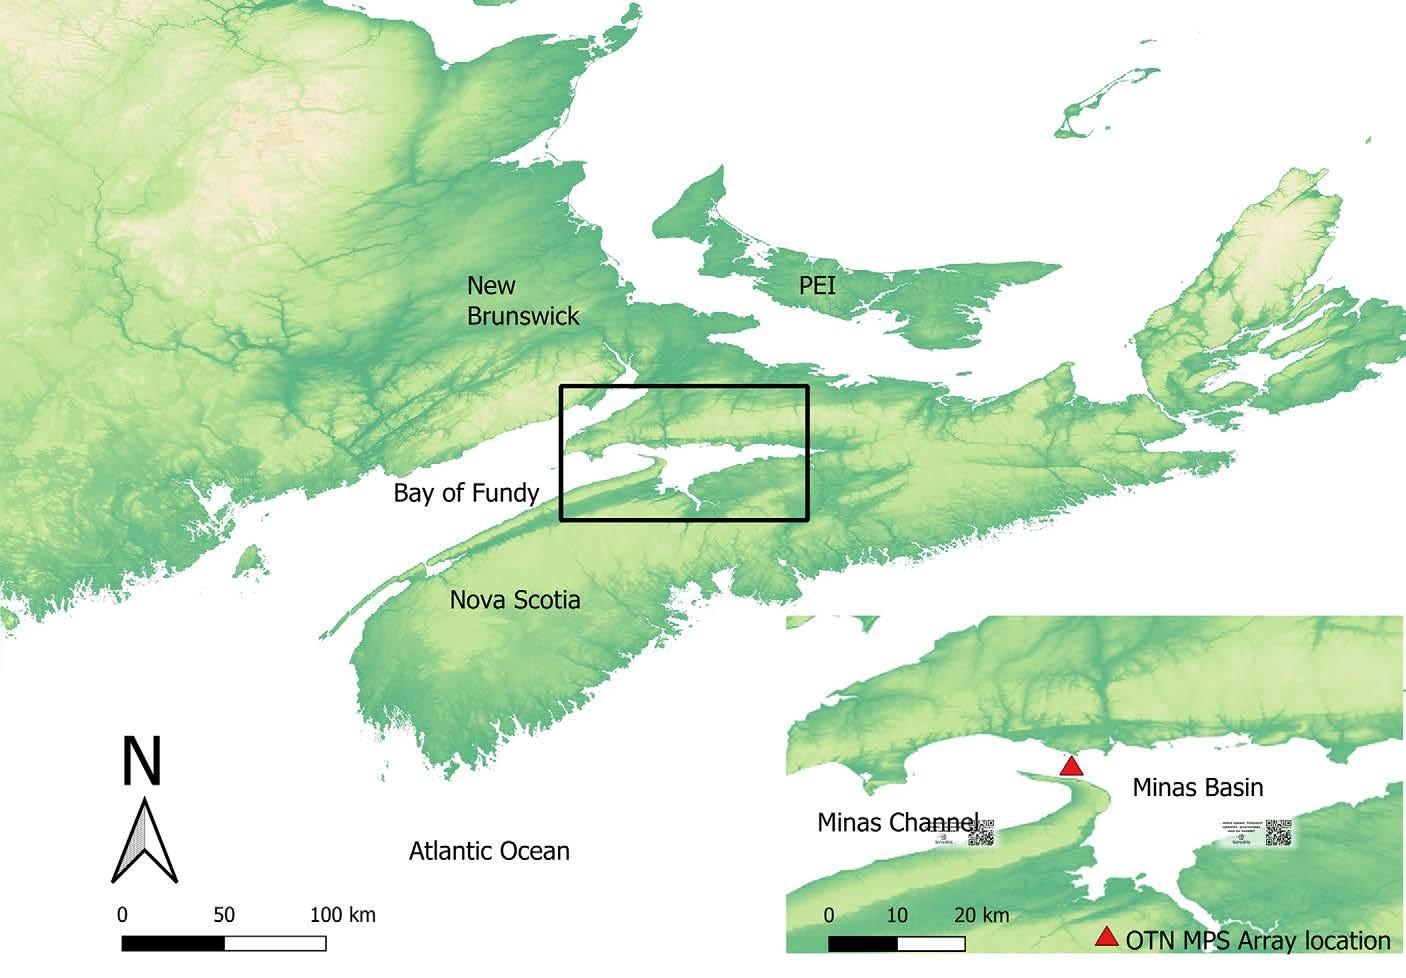
The Bay of Fundy is home to the highest tides in the world. About 160 billion tons of water flow through the Bay on each six-hour tide, equivalent to four times the estimated flow of all freshwater rivers in the world combined.
The Minas Channel connects the Minas Basin to the Bay of Fundy (Figure 1). The channel is 50 km in length, with a width of 20 km in the outer area that reduces to only 5 km in the Minas Passage. Depths range from 50-100 m in the outer channel to above 150 m in the Minas Passage.
Considered a stressful environment with its extreme tides, turbulent currents, soft substrates, and silt-laden waters, the Minas Basin is home and often a migration route to a variety of economically and ecologically important marine animals. The channels winding through the salt marshes are important nursery and feeding areas for species such as American shad, Gaspereau, American
eel, Atlantic sturgeon, Striped bass, Atlantic salmon, and even White sharks.
The Minas Passage has the strongest currents in the Bay of Fundy, where water speed can reach up to 5 m/s and is thus considered an area of interest for tidal power generation. So far, three commercial attempts to harvest power from the Minas Passage have failed for various reasons. The first attempt was in 2009 and failed just three weeks after the underwater turbine deployment, when all 12 turbine rotor blades were destroyed by tidal flows. The second attempt in 2016 failed when the company went bankrupt, leading it to abandon the project and the turbine underwater.
In 2018, a different concept of harvesting power using a floating in-stream tidal platform was conceived. Being surface-based, rather than seabed-based, the technology is easier and less costly to maintain and repair.
The turbines are mounted on a hydraulic lift and can be independently raised out of the water for routine maintenance, and in case of severe damage, the whole platform can be towed to shore for repairs. The platform was successfully tested and generated power for one year at Grand Passage, a different location of the Bay of Fundy. Despite the promising results, the company could not secure a license to implement the project in the Minas Passage. According to the Department of Fisheries and Oceans, the company failed to provide a proper management program and prove a lack of negative impact to the many animal species in the area.
Methods and technologies developed to investigate animal usage of a specific area are often expensive, limited in duration, and require constant maintenance to optimally operate. Acoustic telemetry, the use of acoustic transmitters attached to animals to relay
information to stationary, moored receivers, is a powerful tool to understand how animals move and may be using a specific area. This technology is relatively low cost, easy to use, reliable, and able to track individual animals over long periods (e.g., > 10 years).
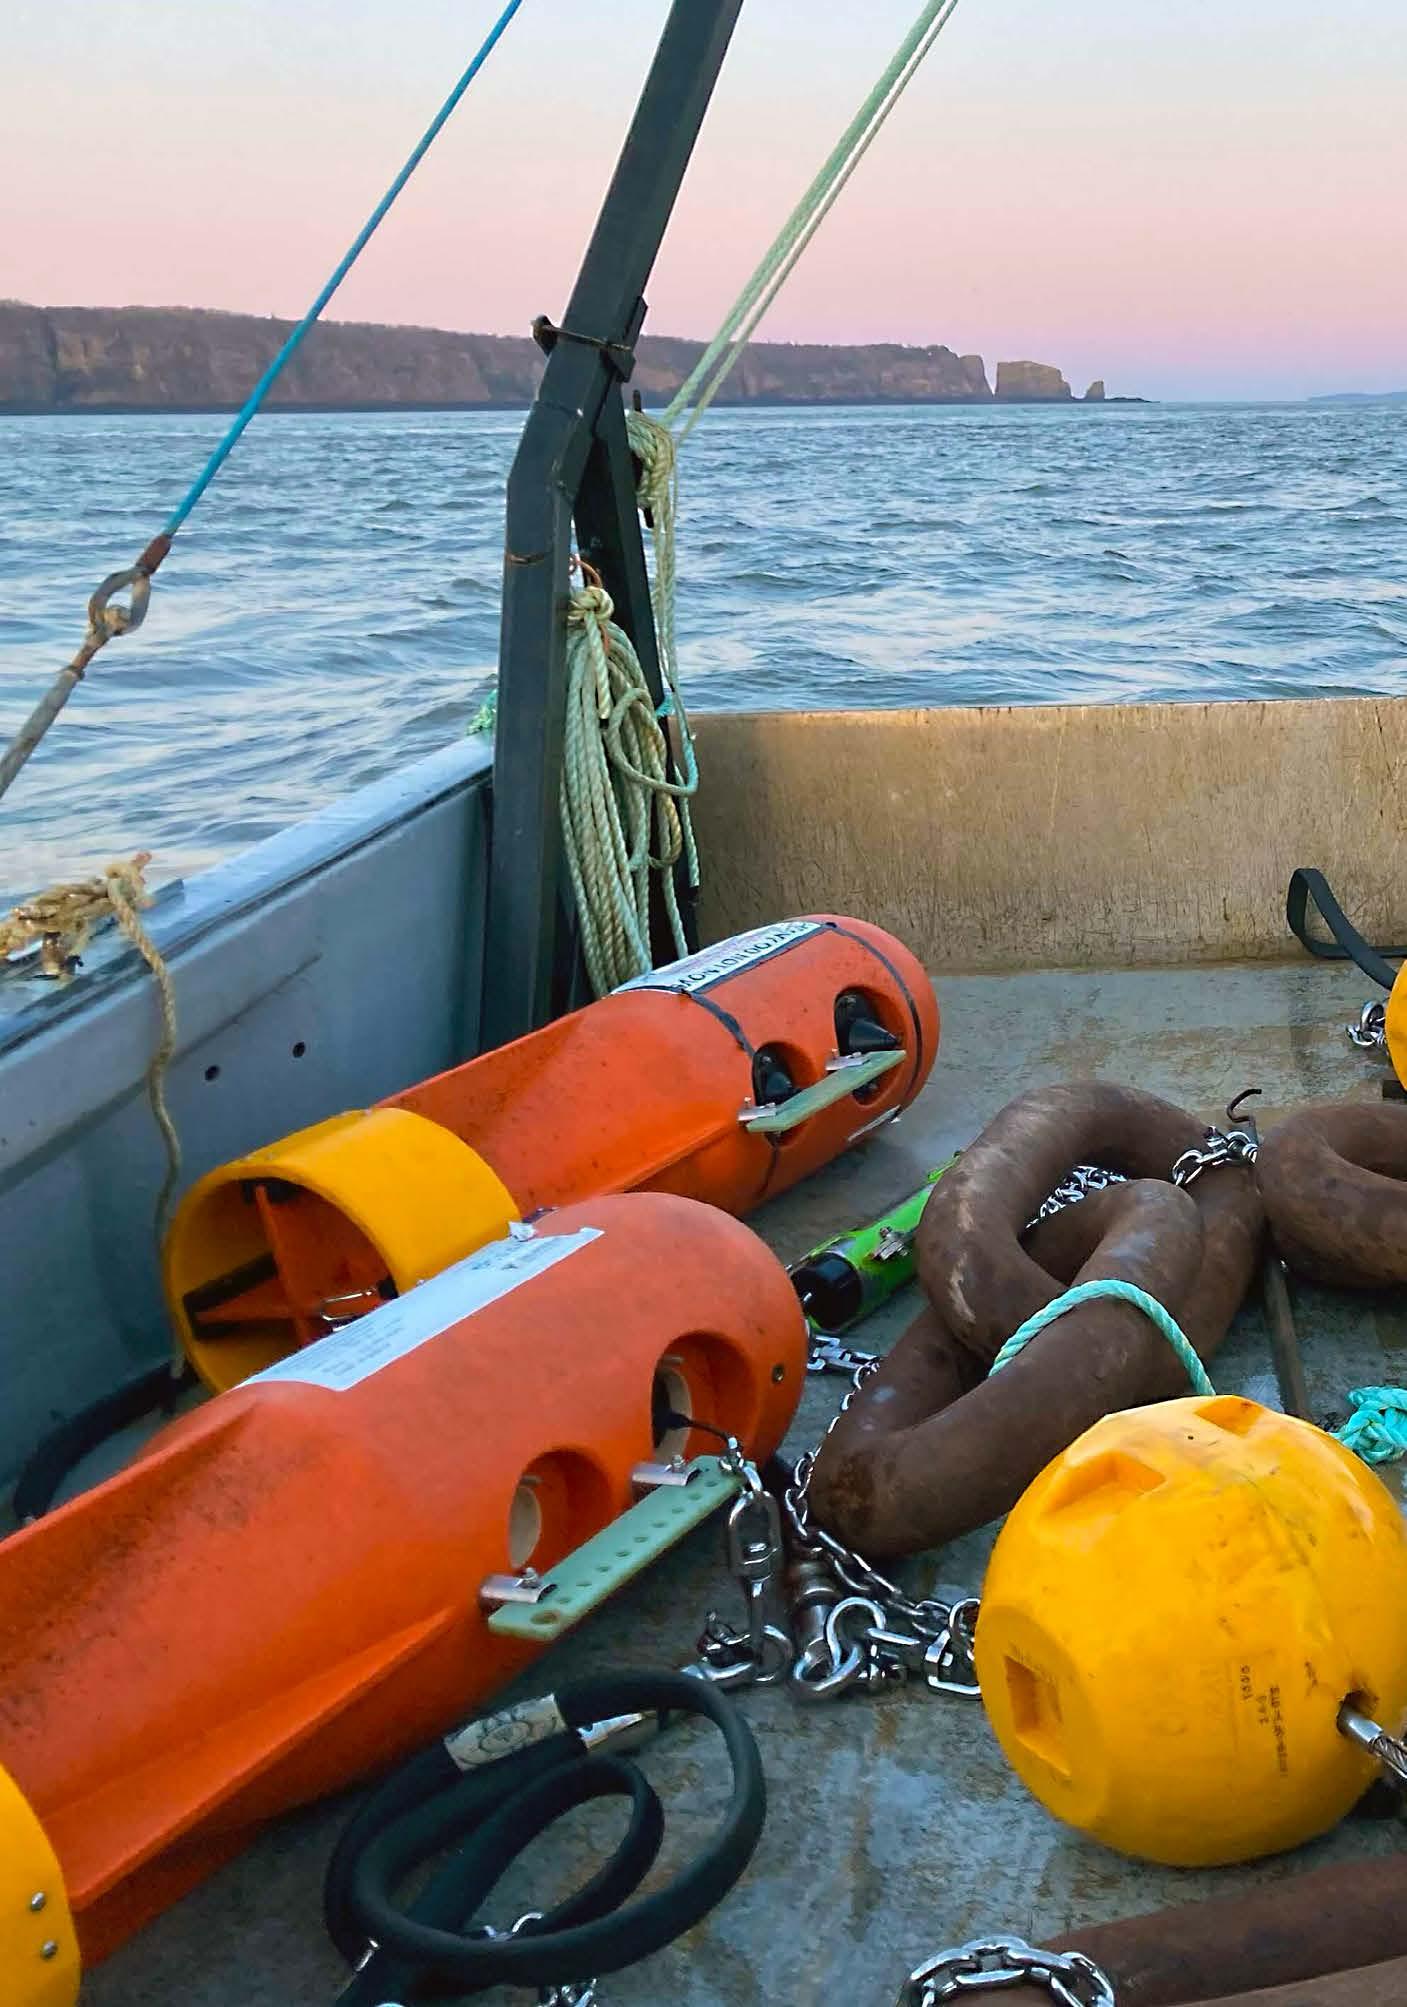
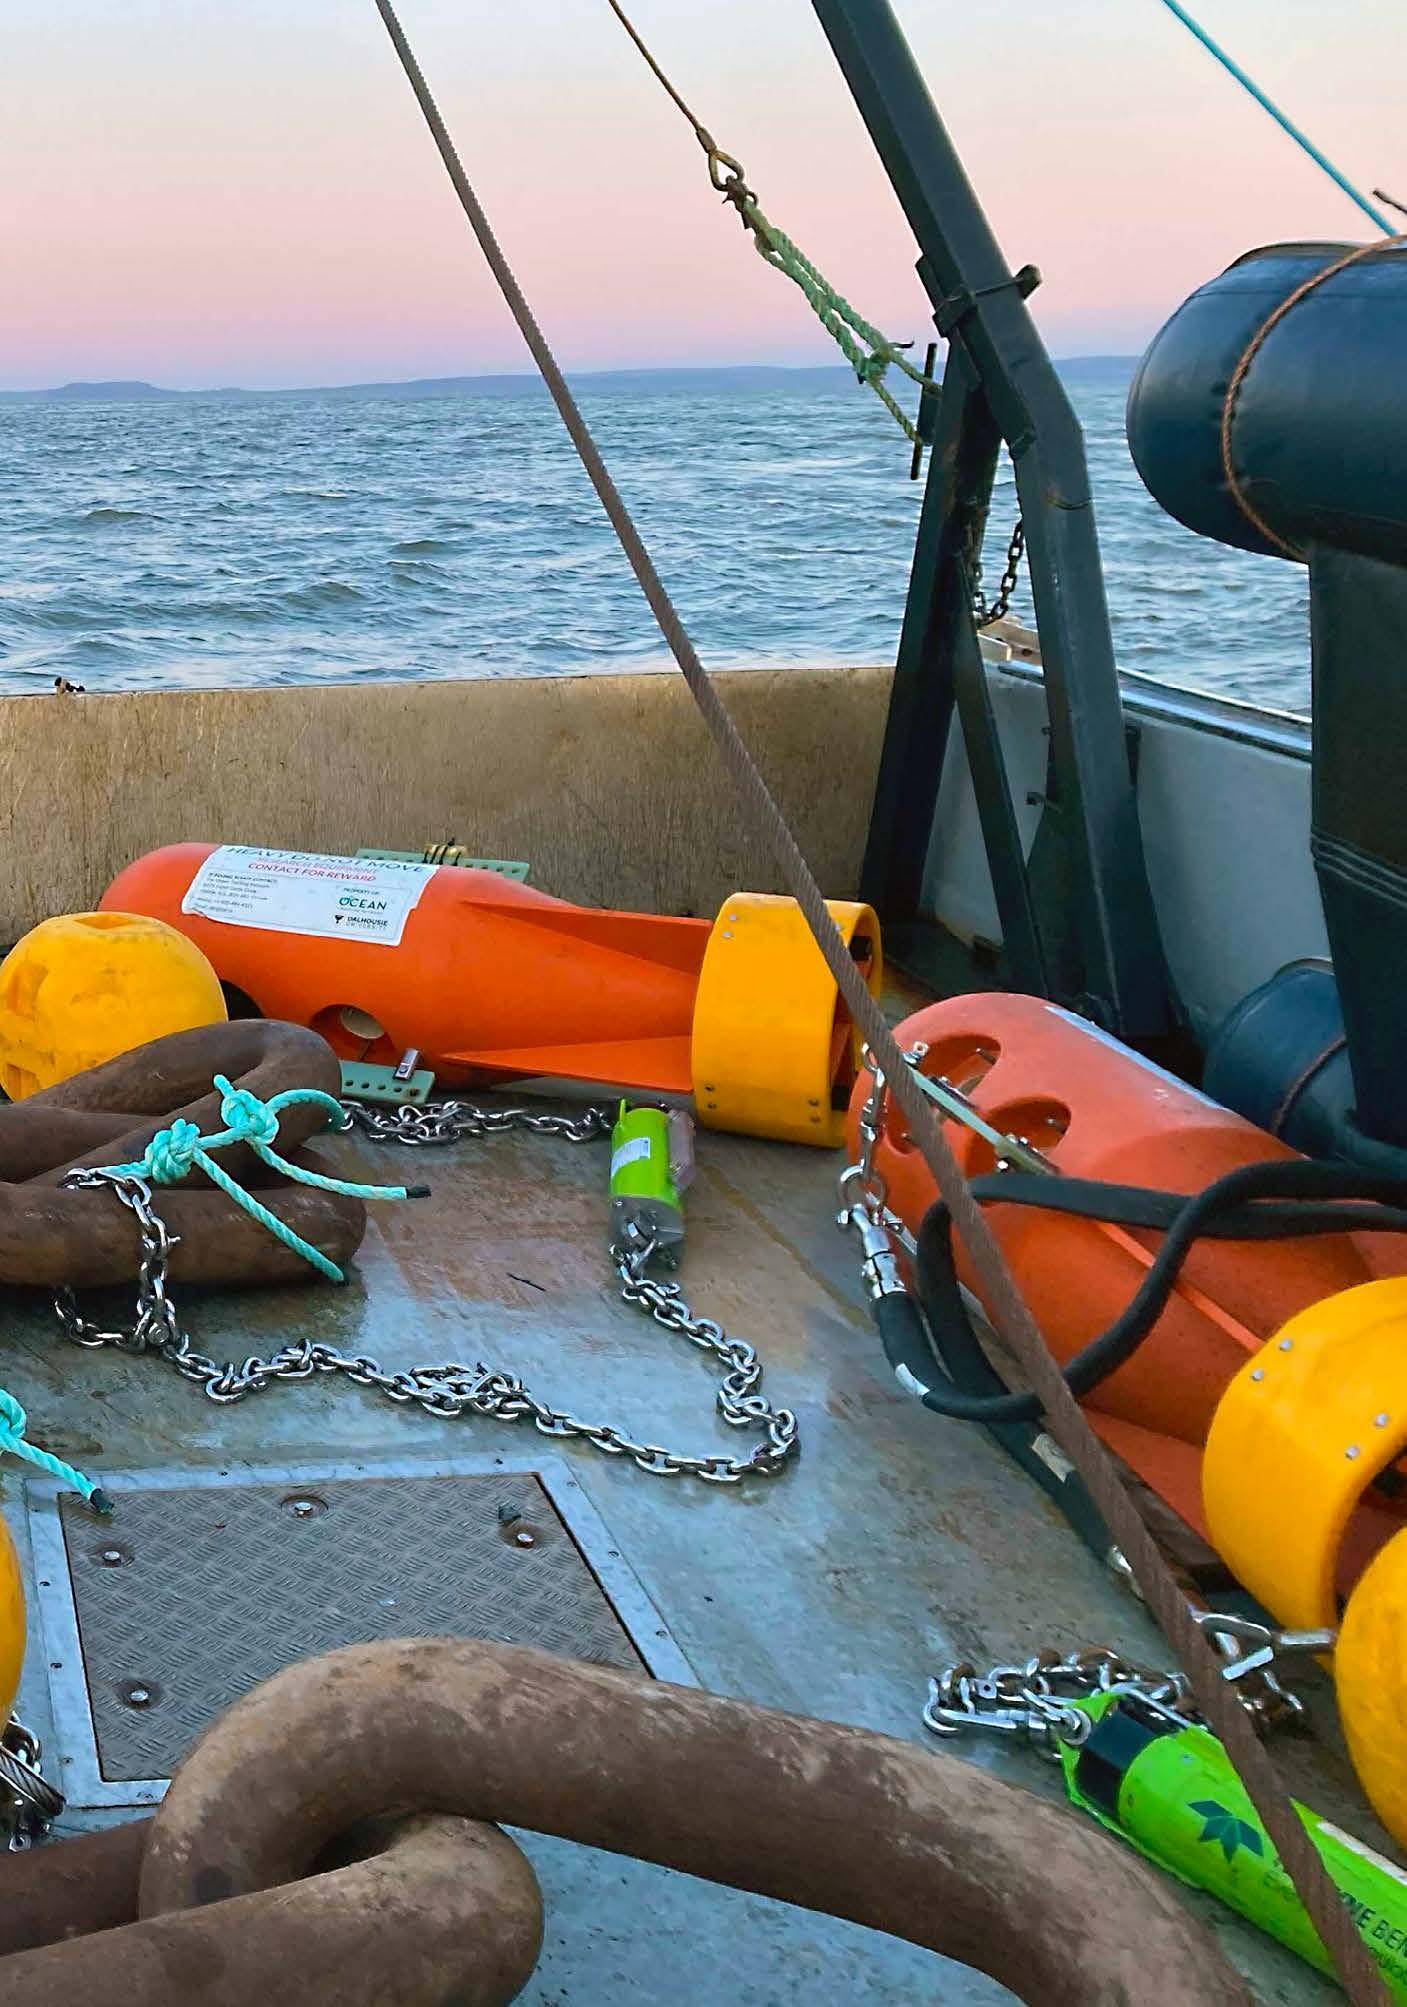
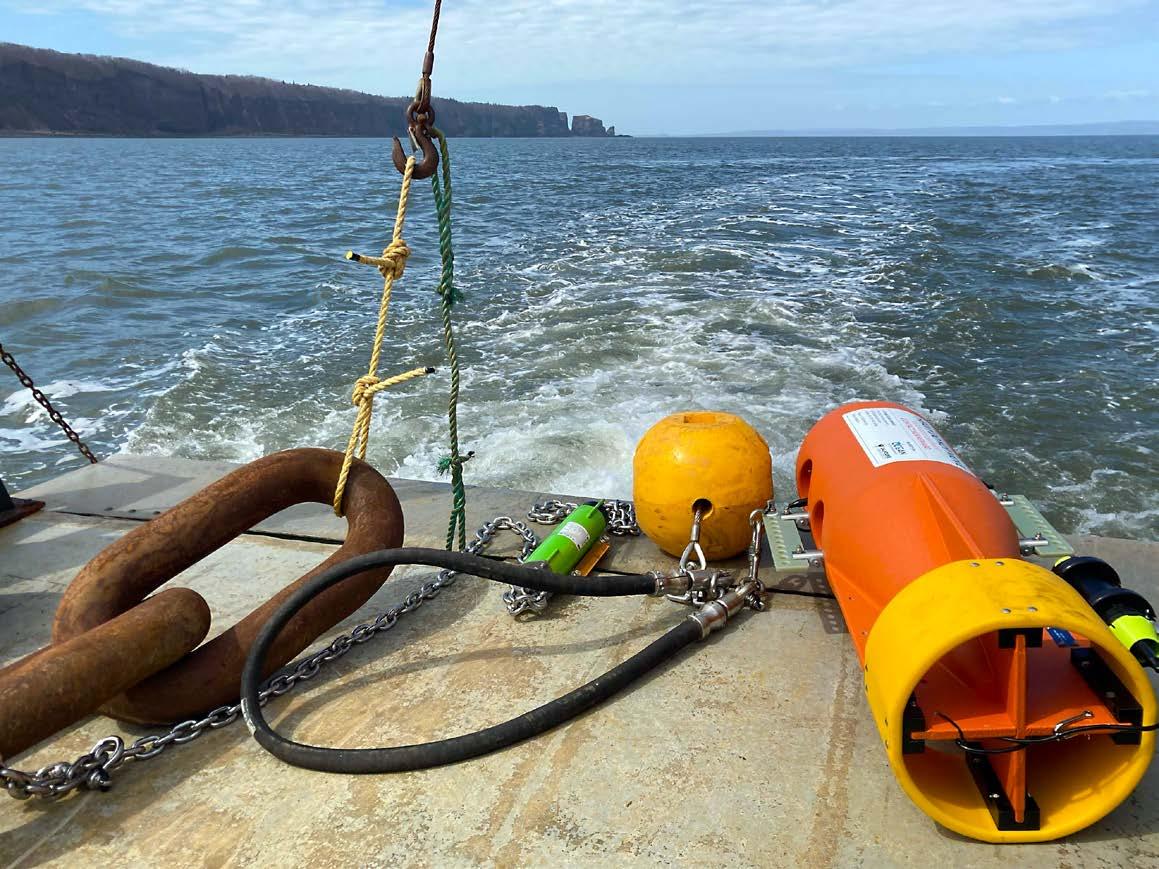
Since 2010, the Ocean Tracking Network (OTN) has been maintaining an acoustic receiver array (Figure 2) in the Minas Passage composed of 12 stations. Throughout the years, the mooring design has changed several times to try and improve data quality and minimize equipment loss. The present mooring is composed of a 450 kg chain link anchor; ½” stainless steel chain, shackles, and swivels; a Teledyne Benthos R2K Acoustic Transponding Release; an 2.4 m Stretch EM Cable manufactured by EOM Offshore (the hose can stretch up to 6 m under stress and return to its original length); and two floatation devices, a regular 45 cm syntactic
foam Balmoral float, and a DeepWater Buoyancy StableMoor® Mooring Buoy.
Each mooring is equipped with two different receiver models, one Innovasea 69 kHz VR2TX and one HR2 High Residency Receiver. The VR2TX acoustic receiver operates in the Innovasea traditional Pulse Position Modulation (PPM) coded communication system. Tags that operate in this system transmit a series of 8-10 pulses and each “pulse train” represents a unique ID. Each pulse train takes approximately three to five seconds, and for a receiver to decode the ID, all pulses must be heard. The HR2 receiver is capable of decoding 180 kHz tags using both the PPM transmission system as well as the High Residency transmission system, which encodes the complete tag ID within a single pulse that only takes a few milliseconds to transmit.
The detection efficiency of any acoustic telemetry array (the relationship between the detection probability and the distance between tag and receiver) varies by receiver model and the environmental conditions. Water temperature, turbidity, and noise are often considered the main driving factors in reducing detection efficiency; however, tilt can play an even greater role, especially in high-flow estuarine environments.
Both acoustic receiver models on the OTN moorings are equipped with auxiliary sensors that collect tilt data. To have a fine-scale assessment of the tilt displacement, the VR2TX receivers were set to fast diagnostic – a mode where the receiver collects tilt data every minute for a 14-day period (May 19 to June 1, 2023).
This collection of high-frequency tilt measurements revealed three different patterns (Figure 3). Stations 1-5 experienced higher tilt displacement when the tides were ebbing, stations 6-8 experienced similar tilt displacement at both periods of the tide, and stations 9-12 demonstrated more tilt
displacement when the tides were flooding. The tilt oscillation happened throughout the whole tide change but was more intense for an average of three hours half-way through the tide cycle. Most importantly, it is evident that the stations were not sustaining the same displacement for more than a few minutes at the time, being constantly knocked down and coming back to their natural vertical position. This pattern was observed at all stations.
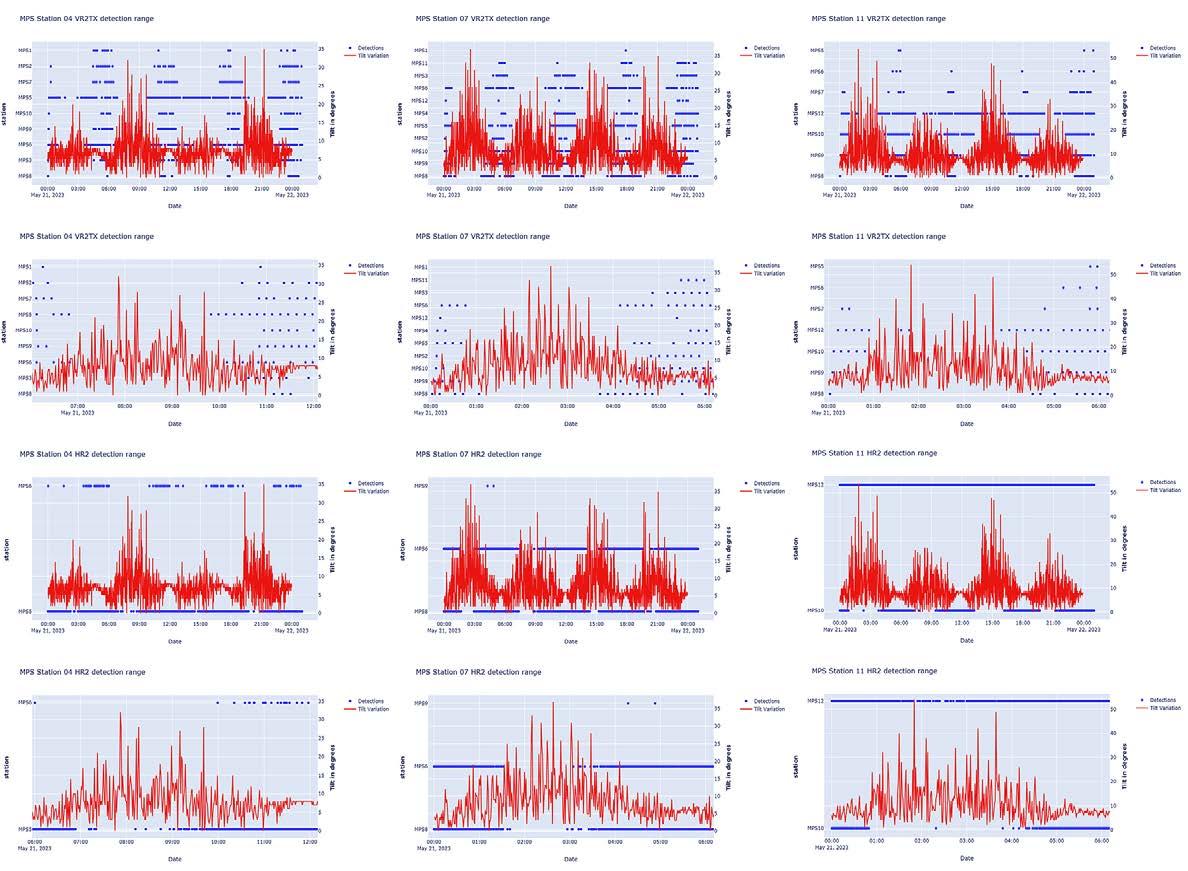
Each receiver also emits its own transmitter code, allowing us to assess the detection range of each receiver unit to its neighbours during the deployment period. Stations were deployed approximately 150 m apart, the expected distances between stations and the expected pings from neighbouring receivers were used to measure changes to each station’s detection range. Maximum detection ranges were observed during slack tide and decreased as the tide started to change. The VR2TX maximum detection range was 1,650 m and the HR2 receiver was only 300 m. This difference was expected and is likely due to the difference in the frequency power at which those receivers’ tags operate, and therefore how far the acoustic signal can travel.
Surprisingly, despite the different transmission methods, both receivers demonstrated extremely limited detection range capabilities during the tide change for an average period of three hours (coincidentally with the high tilt displacement moments), with periods where no detections were present in either of the units, depending on the station (Figure 4). Although the HR2 receivers had a few more detections during the high tilt oscillation periods, given its capabilities to resolve a detection in a millisecond, it is concluded that the receiver was not able to maintain its designed functionality when the mooring started to be destabilized during the tide change.
When examining actual animal detections during the analysis period, the VR2TX outperformed the HR2 (Figure 5). The VR2TX had a total of 819 detections from five unique
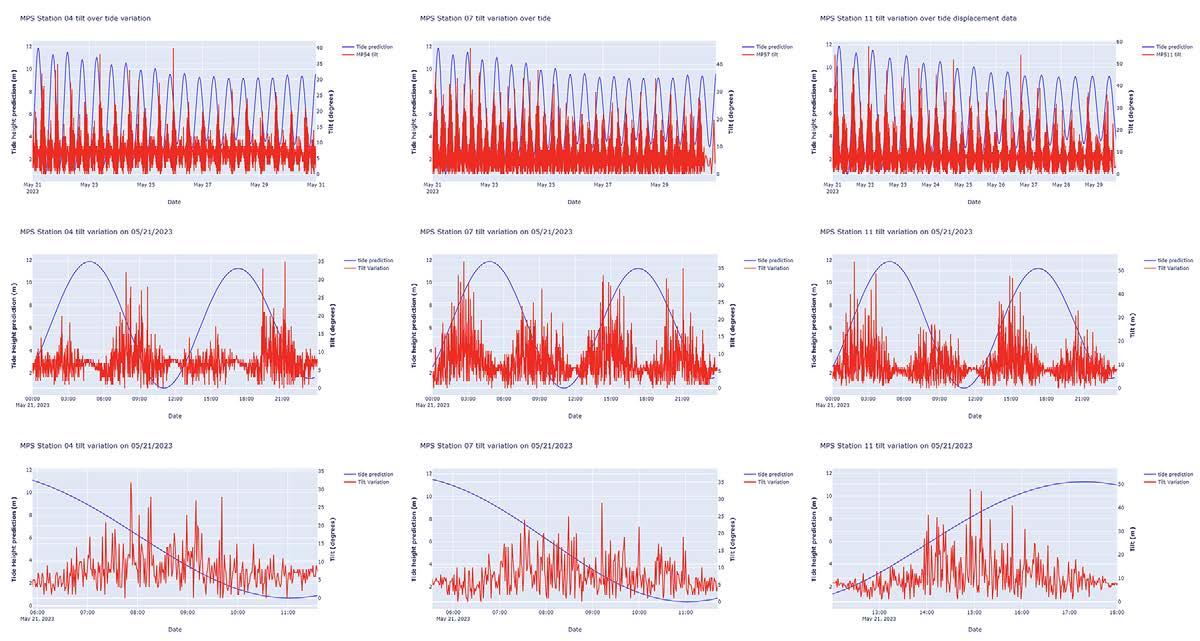
3: Tilt variation from Ocean Tracking Network Minas Passage Acoustic Receiver Line stations 04, 07, and 11 plotted over the 15-minute predicted tide variation from Baxter Harbour acquired from the Department of Fisheries and Oceans website.
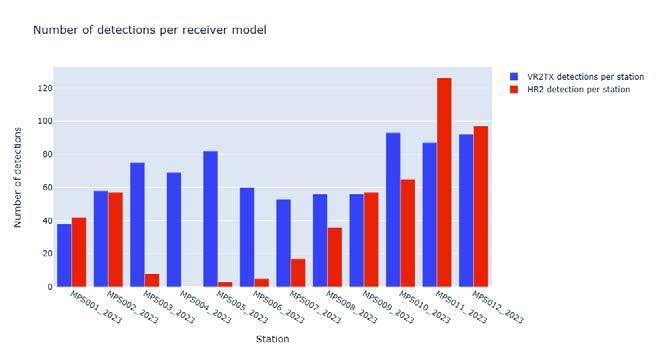
tags, whereas the HR2 had 513 detections from 14 unique tags. Most importantly, the VR2TX had a representative number of detections from each of the 12 stations of the array, whereas the HR2 had no detections from station MPS04 and very few detections from stations MPS03, MPS05, and MPS06.
The results from this analysis strongly suggest that when the tide is changing, and the moorings are being constantly destabilized by the force of the moving water, despite their different capabilities, the detection range of both acoustic receiver models is extremely affected and there are periods when the receivers are not able to resolve detections. The tilt is likely to be the main driving factor for this loss in detection capability, especially seeing the great range of the VR2TX during slack tide.
Other variables that can influence detection range such as temperature, salinity, and turbidity appear to not have as much influence as the tilt since the water at the Bay of Fundy is always turbid and well mixed from top to bottom, so there is almost no chance of stratification (formation of different layers of temperature and salinity).
This cyclical range limitation from extreme tidal currents must be considered when analyzing animal detection data. In areas like Minas Passage, acoustic telemetry data collection may be limited for up to 12 hours a day, which could completely change the conclusions of studies being conducted, especially when less mobile
animals are being studied, including those that depend on tidal stream transport such as American eel through the Minas Passage.
Furthermore, the PPM-based 69 khz VR2TX receiver unit seemed to be a more suitable unit for the environmental conditions of the Bay of Fundy than the high residency receivers that have been thought to be more resilient to environmental noise. Despite having the capability to resolve detections more quickly using the HR technology compared to PPM, the HR2 receivers recorded fewer detections in total and per station during this observation period.
To confirm the patterns and the conclusions in this analysis, OTN is adding external loggers to the moorings that can measure tilt and environmental data at fine temporal scales to create a complete timeseries during the next six months deployment period and determine if what was observed during these 14 days is consistent throughout the longer deployment. u
Born and raised in the Brazilian coast, Iago Gradin quickly developed a passion for the ocean and the marine life, culminating with him pursuing a B.Sc. in oceanography. Throughout his career, he mainly worked with remote sensing and oceanographic data manipulation. Seeking to further develop his technical skills, he acquired an advanced diploma in ocean technology. Since 2019, Mr. Gradin has been working for the Ocean Tracking Network (OTN) as a field technician, where he is responsible for assembling, deploying, and recovering hundreds of oceanographic moorings. Because of his background in data processing, he takes pleasure in immersing himself in the data world searching for ways to improve the OTN technical operations and the quality of the data collected.
by Kaeleigh McConnell

As the global population steadily increases, the challenge of meeting rising food demands has become more pressing than ever. Aquaculture, the farming of aquatic organisms, has emerged as a vital component in the quest for global food security. By providing a reliable and sustainable source of seafood, aquaculture can significantly reduce the strain on wild fish populations and contribute to a more balanced and secure food supply.
A key component in the success and sustainability of aquaculture is the implementation of advanced technological solutions designed to enhance the efficiency and sustainability of operations. A pivotal advancement in the industry is the introduction of underwater environmental sensors, offering real-time monitoring capabilities and enabling farm staff to track vital parameters such as dissolved oxygen (DO), salinity, temperature, pH, etc. These features are crucial for maintaining optimal conditions in aquaculture environments, ensuring the health and growth of aquatic species. The integration of underwater environmental sensors is instrumental in driving the aquaculture sector towards a more resilient and productive future.
Traditional monitoring methods in aquaculture, such as manual observations and periodic sampling, present several inefficiencies and potential inaccuracies. Manual observations require considerable labour and are susceptible to human error, leading to inconsistencies and unreliable data. Additionally, periodic sampling provides only snapshots of environmental conditions at specific times, failing to capture dynamic changes in aquatic environments between sampling intervals. This limitation can compromise the health and growth of farmed species, as critical changes may go undetected until the next scheduled sampling event, potentially leading to erroneous decision-making due to the lack of a thorough understanding of the conditions.
In contrast, advanced monitoring systems offering continuous and real-time data collection are revolutionizing aquaculture management (Figure 1). Real-time monitoring allows for immediate detection and response to fluctuations, reducing risks associated with delayed reactions, such as disease outbreaks or water quality crises. For instance, sudden drops in dissolved oxygen (DO) levels can be quickly identified, prompting immediate mitigation actions such as increasing aeration or adjusting water circulation to prevent stress or mortality in fish.
Immediate access to comprehensive data empowers aquaculture operators to implement proactive management practices. This includes adjusting feeding schedules, optimizing water circulation, and managing population density to maintain optimal conditions for fish health and growth. Continuous data collection facilitates a deeper understanding of the aquatic environment over time, allowing managers to analyze trends and patterns. This enhanced understanding supports informed decision-making regarding stocking densities, feed formulations, and overall farm operations, thereby improving the efficiency and sustainability of aquaculture operations and promoting better resource management.
Underwater sensors are revolutionizing aquaculture by providing real-time data on crucial environmental parameters, which enhances decision-making and farm management. These sensors continuously measure metrics such as DO, temperature, salinity, and pH. They detect environmental changes and convert this information into electric signals. Many modern sensors use acoustic wireless telemetry, which sends data through sound waves in the water. The data are then transmitted wirelessly to a cloud-based system, allowing operators to access up-to-date information and make timely adjustments to maintain optimal conditions.
Key sensors used in aquaculture include:
• DO sensors monitor oxygen levels,
essential for aquatic respiration. Low DO can cause stress and mortality.
• Temperature sensors track water temperature, which affects metabolic rates and growth. Proper temperature management prevents stress and boosts productivity.
• Salinity sensors measure salt concentrations to ensure it stays within optimal ranges for the specific species being cultivated.
• pH sensors measure the acidity or alkalinity of the water, which affects
nutrient availability and overall health of the aquatic species. Maintaining proper pH levels is critical for preventing stress and ensuring a stable environment.
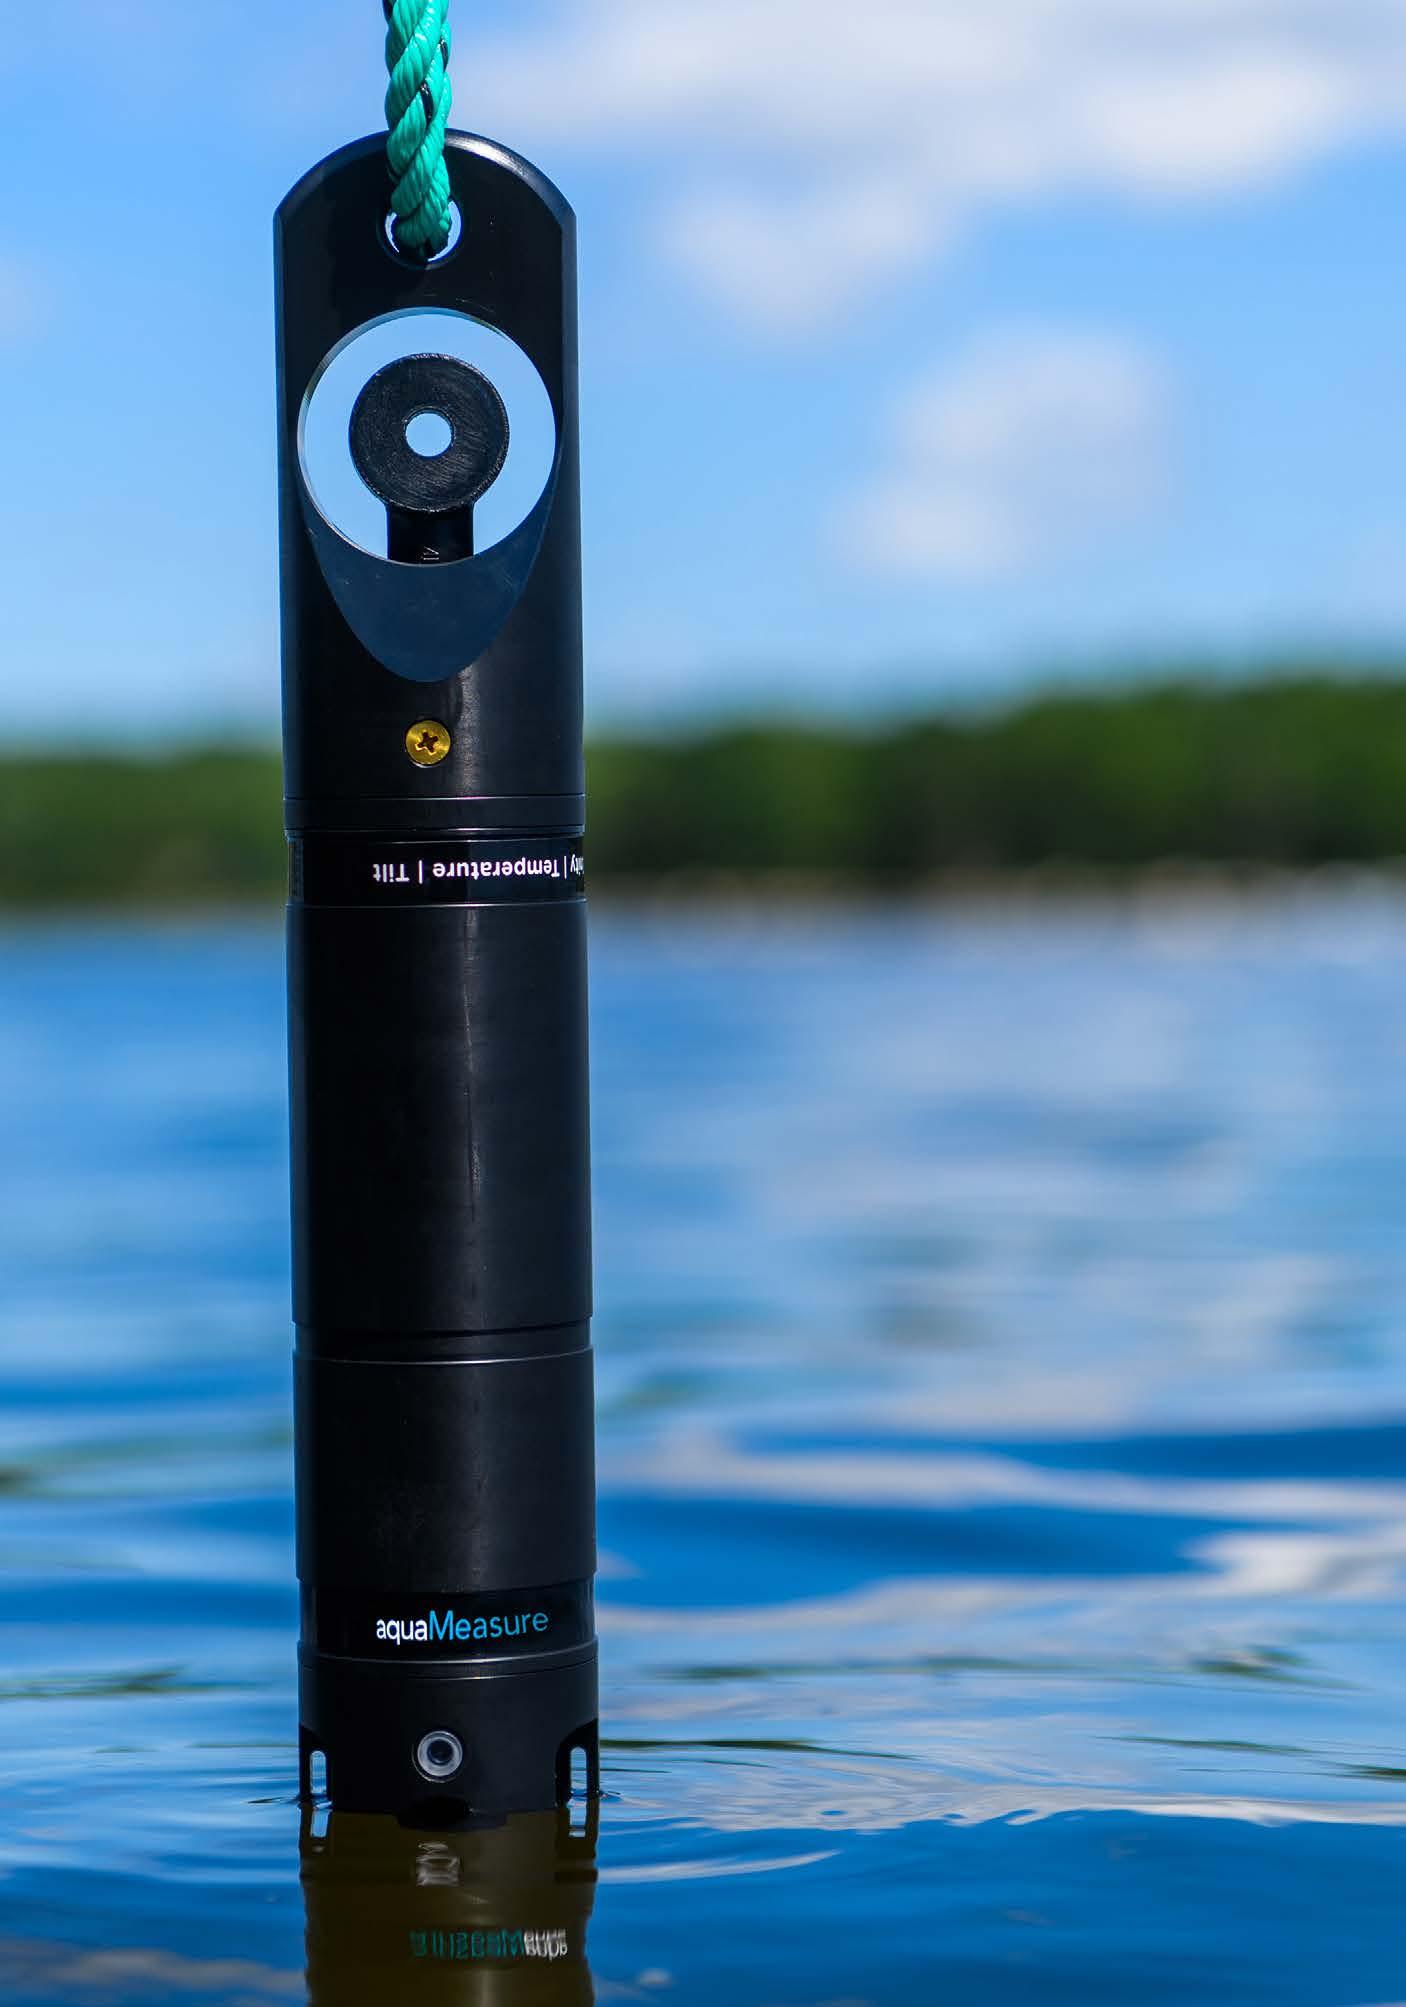
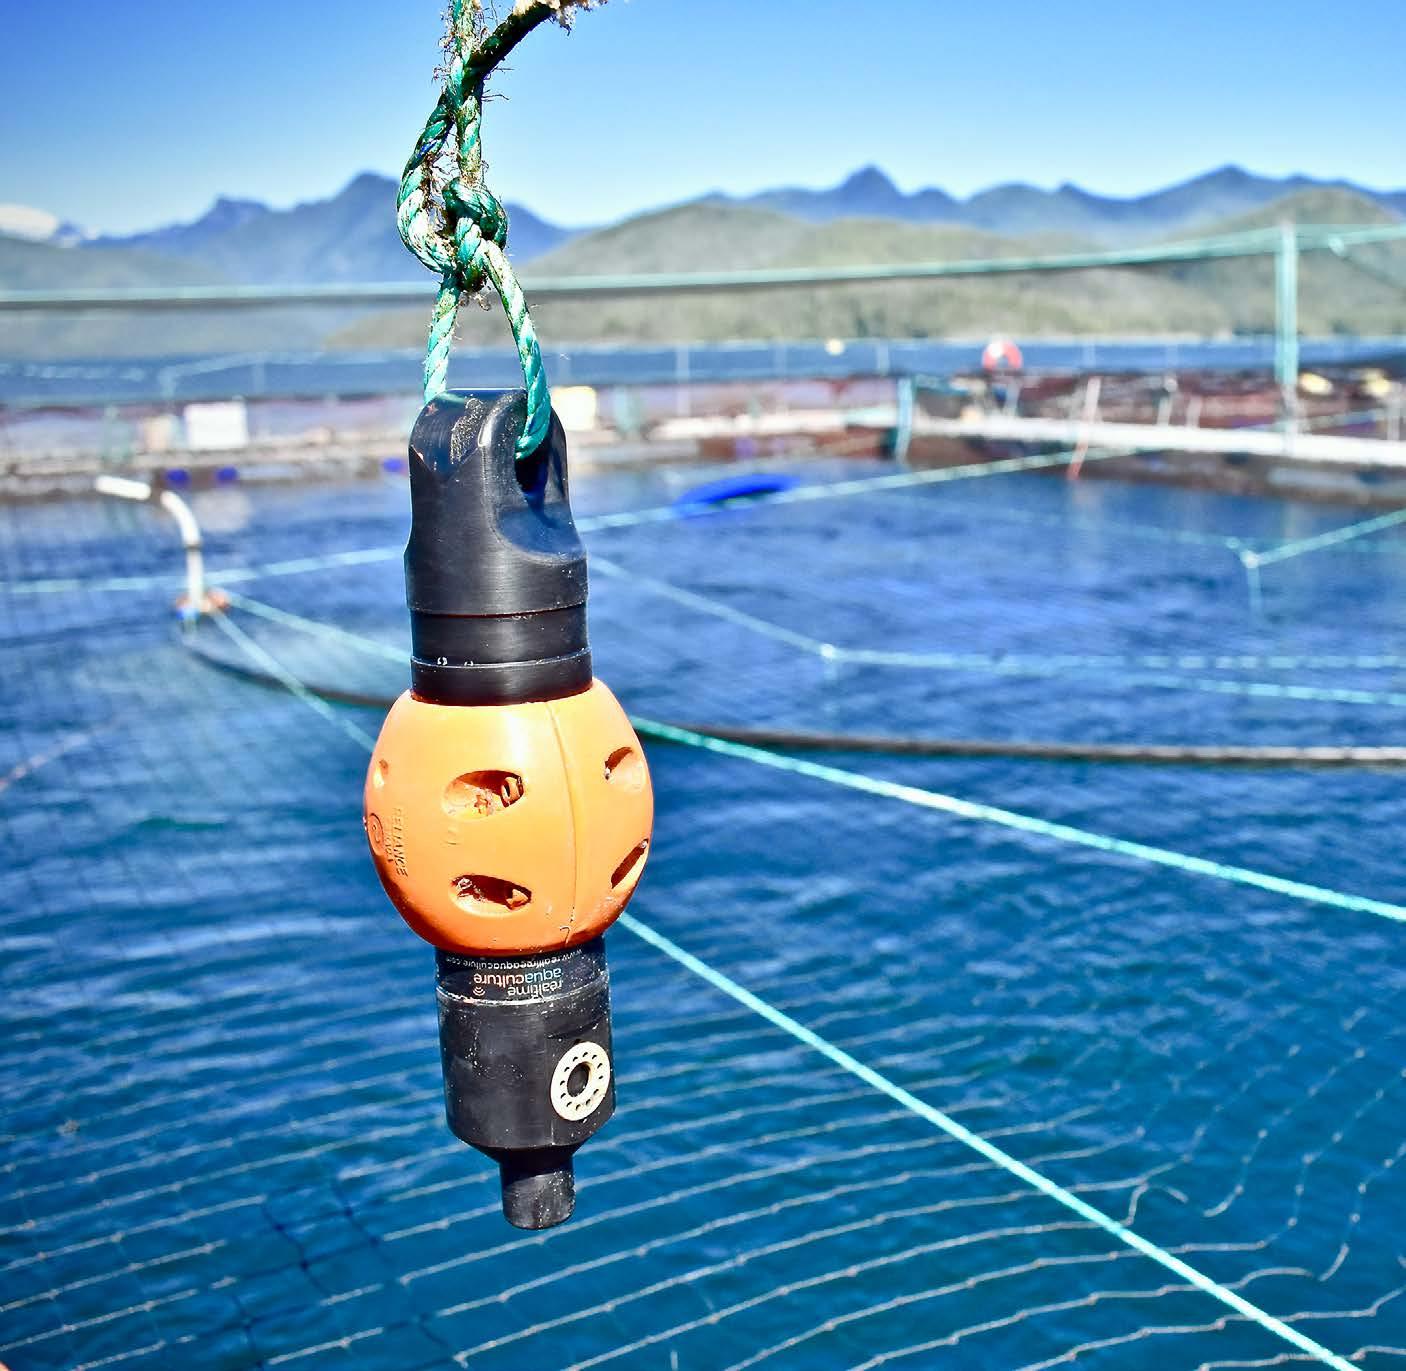
Underwater environmental sensors provide a unique advantage by enabling the placement of individual sensors in each pen without the need for cables. This setup ensures precise monitoring of key parameters at the pen level. For instance, Innovasea’s aquaMeasure sensors exemplify this approach, providing
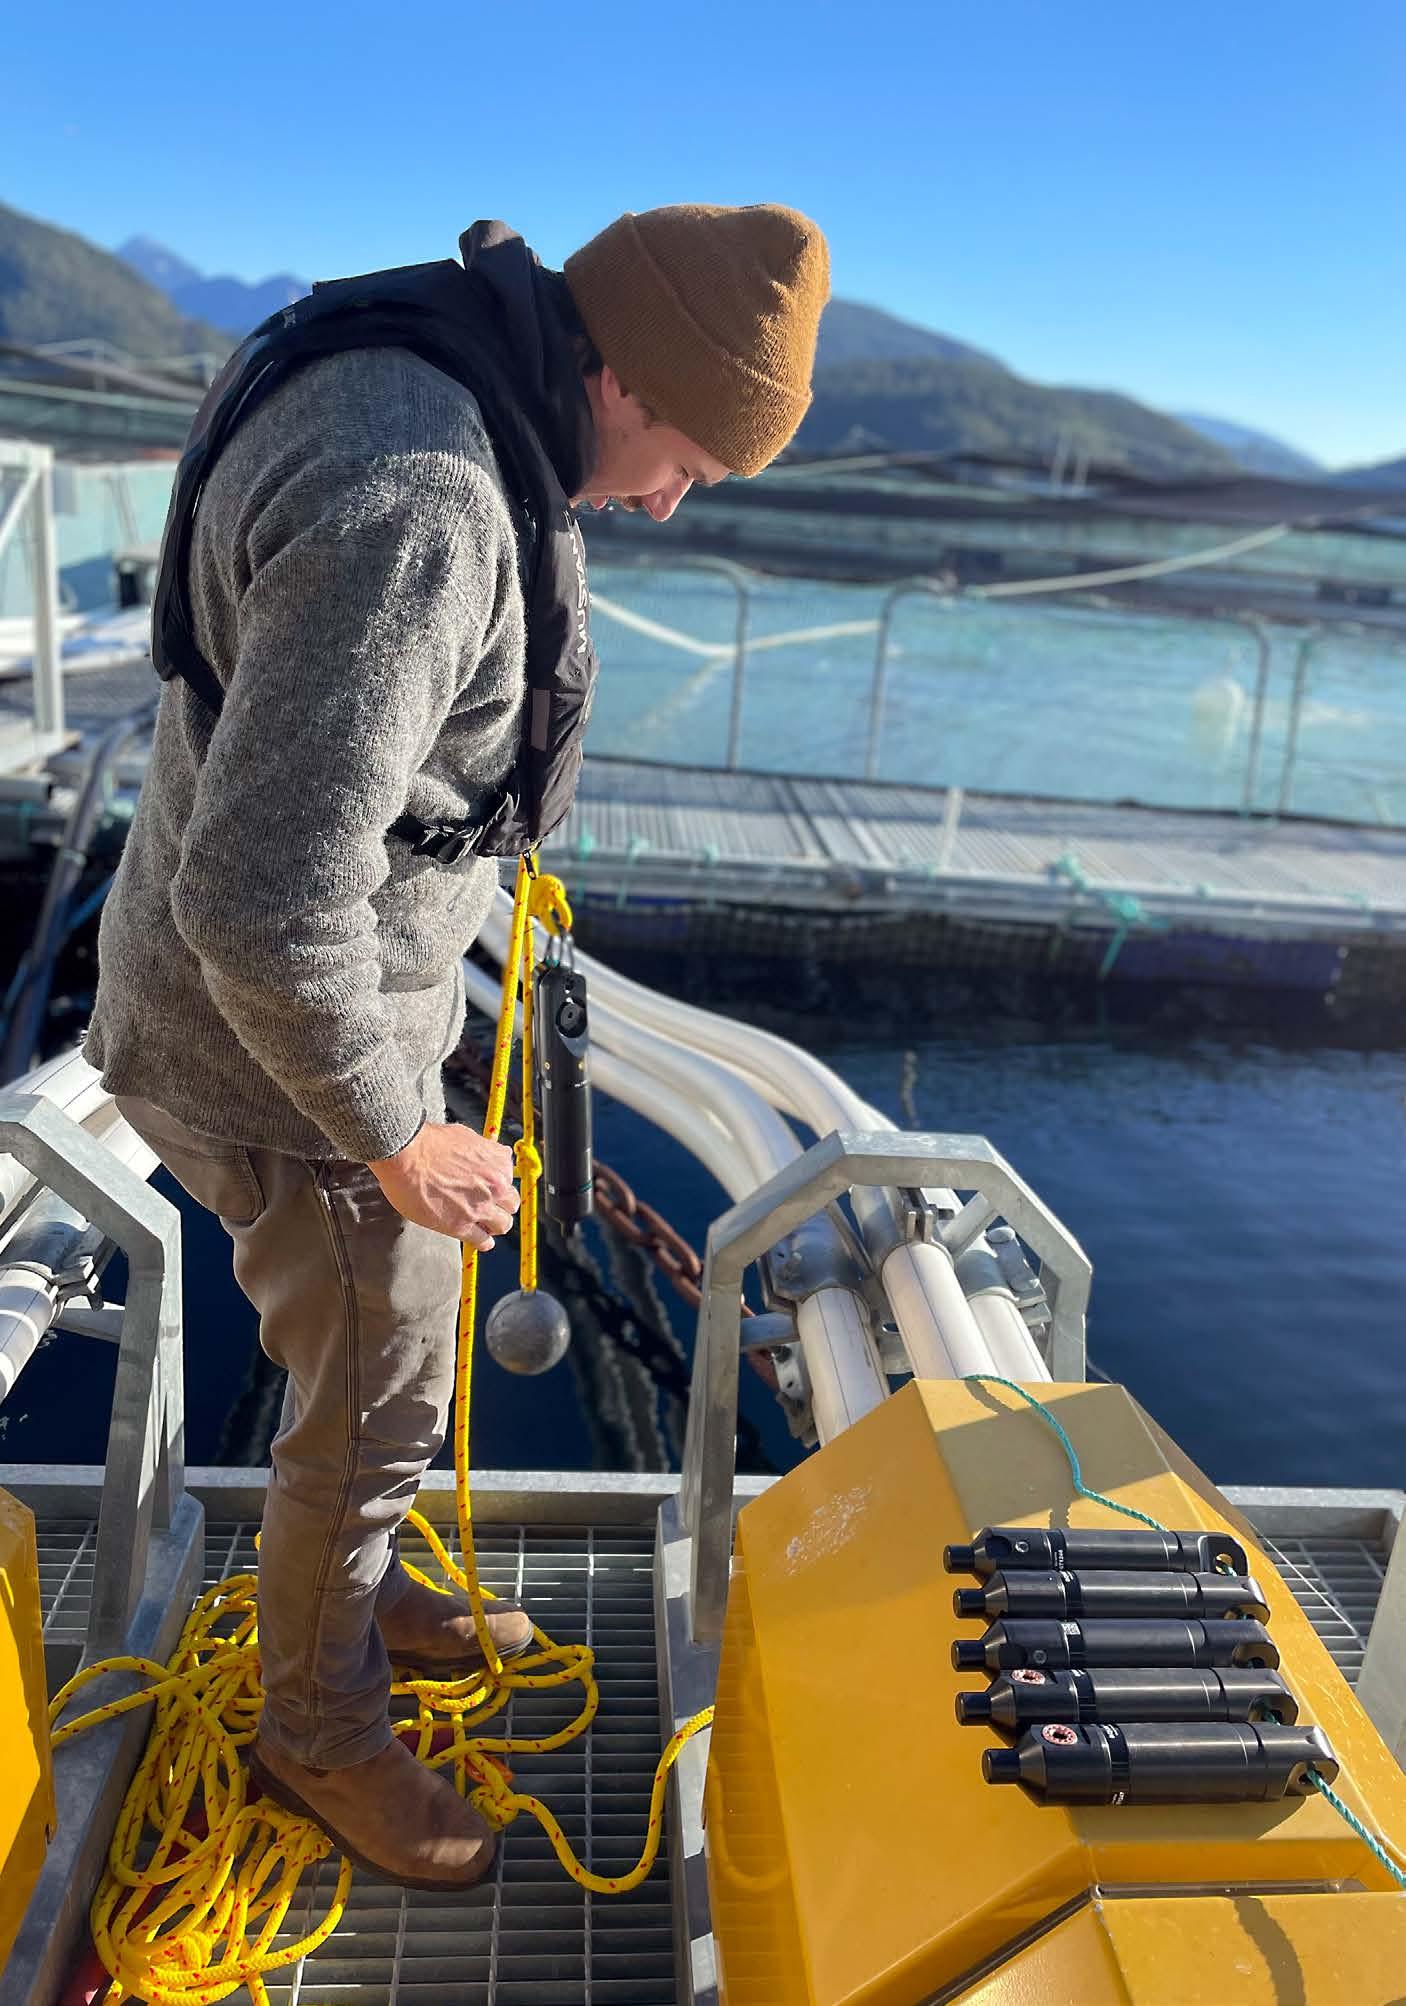
Figure 2: A technician preparing to deploy an aquaMeasure sensor at an aquaculture farm, ensuring precise monitoring of underwater environmental parameters to support sustainable fish farming practices.
real-time insights and seamless integration with its cloud-based software, Realfish Pro. This integration leads to better management and sustainability in aquaculture, supporting global food security.
The integration of underwater sensors in aquaculture operations offers significant long-term advantages (Figure 2). Continuous monitoring helps farm staff identify trends, patterns, and anomalies over time, leading to more informed and effective management practices. By consistently recording and analyzing environmental parameters, aquaculture managers can gain valuable insights into the factors that influence the health and productivity of their farmed species.
One of the key benefits of long-term data collection is the ability to detect trends and patterns that may not be apparent in shortterm observations. For example, monitoring dissolved oxygen levels over several months or years can identify seasonal variations and anticipate periods when additional aeration may be needed. Long-term temperature data can also reveal the impacts of climate changes on water conditions, enabling proactive adjustments to mitigate stress on farmed species. This deeper understanding of environmental dynamics allows for the implementation of more effective management strategies, reducing risks and enhancing the overall resilience of aquaculture operations.
Data analytics plays a crucial role in leveraging long-term data to improve production efficiency and optimize resource utilization. Advanced analytical tools can process and interpret the vast amounts of data collected by underwater sensors, providing actionable insights for farm managers. Predictive analytics can forecast future conditions based on historical data, helping plan feeding schedules, optimize stocking densities, and manage water quality more efficiently. Machine learning algorithms can identify correlations between different parameters, such
as the relationship between water temperature and growth rates, allowing for fine-tuning of farm practices to maximize yields.
Continuous data collection and analysis can also contribute to mitigating the environmental impacts of aquaculture operations. By closely monitoring key parameters, farm staff can better understand the interactions between different factors, such as water temperature and oxygen levels, which can help to manage resource use more effectively. Early detection of anomalies can prompt timely corrective actions, minimizing potential negative environmental impacts. Long-term data supports compliance with environmental regulations and certification standards, demonstrating the commitment of aquaculture operations to sustainable practices.
The advancement of aquaculture is critical in addressing the growing global demand for sustainable seafood. Traditional monitoring methods, plagued by inefficiencies and potential inaccuracies, fall short in providing the necessary insights to maintain optimal conditions for aquatic species. The integration of continuous and real-time data collection has revolutionized the industry, enabling more responsive and informed management practices. Central to this transformation are underwater environmental sensors, which offer precise monitoring of critical environmental parameters such as dissolved oxygen, temperature, and salinity. These sensors ensure that aquaculture operations can swiftly detect and address changes, safeguarding the health and growth of farmed species.
However, deploying these sensors and interpreting the vast amounts of data they generate come with challenges. Ensuring proper sensor placement, maintenance, and data analysis requires investment and expertise. Despite these hurdles, the opportunities and insights gained through sensor technology are substantial. Continuous monitoring allows farm staff to identify trends,
patterns, and anomalies over time, leading to more effective and proactive management strategies. Through data analytics, aquaculture managers can optimize resource utilization, improve production efficiency, and mitigate environmental impacts. Predictive models and machine learning algorithms enhance the ability to foresee and respond to future conditions, ensuring that aquaculture operations remain resilient and productive.
In summary, the integration of real-time data collection, facilitated by underwater sensors, is transforming the aquaculture industry. These technologies not only enhance immediate management capabilities but also provide the long-term insights necessary for sustainable growth. By enhancing these advancements, the industry can better meet the rising global demand for seafood while promoting environmental stewardship and resource efficiency. The future of aquaculture
is promising, with continuous monitoring technology playing a crucial role in achieving a reliable, sustainable, and resilient seafood supply. u
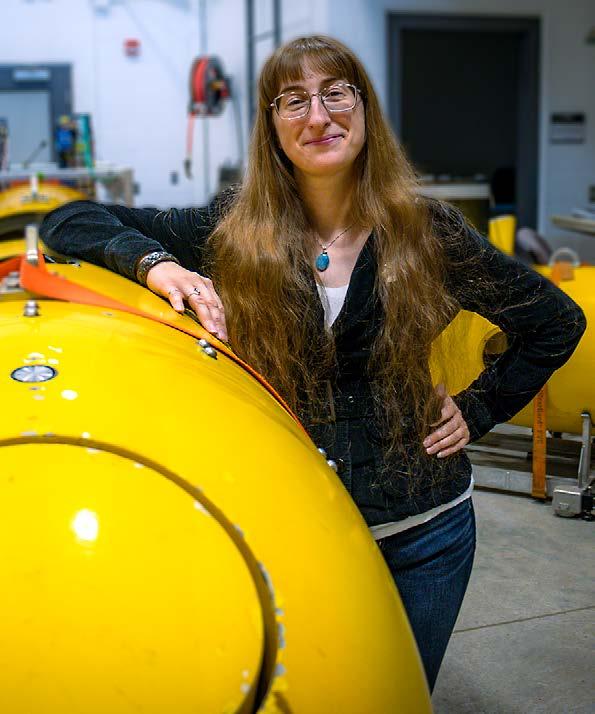
Residing in Halifax, Nova Scotia, Kaeleigh McConnell is a dedicated professional in the aquaculture intelligence division at Innovasea. With a bachelor of science in marine biology from Dalhousie University and a certified PADI Divemaster, her expertise is well-rounded, merging academic knowledge with hands-on experience. Her keen interest in sustainable fisheries and aquaculture, coastal management, and marine communications highlights her commitment to advancing ocean conservation and management.


by Bryan Lintott and Gareth Rees
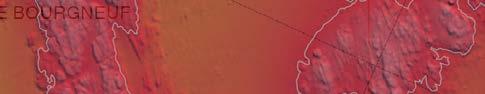
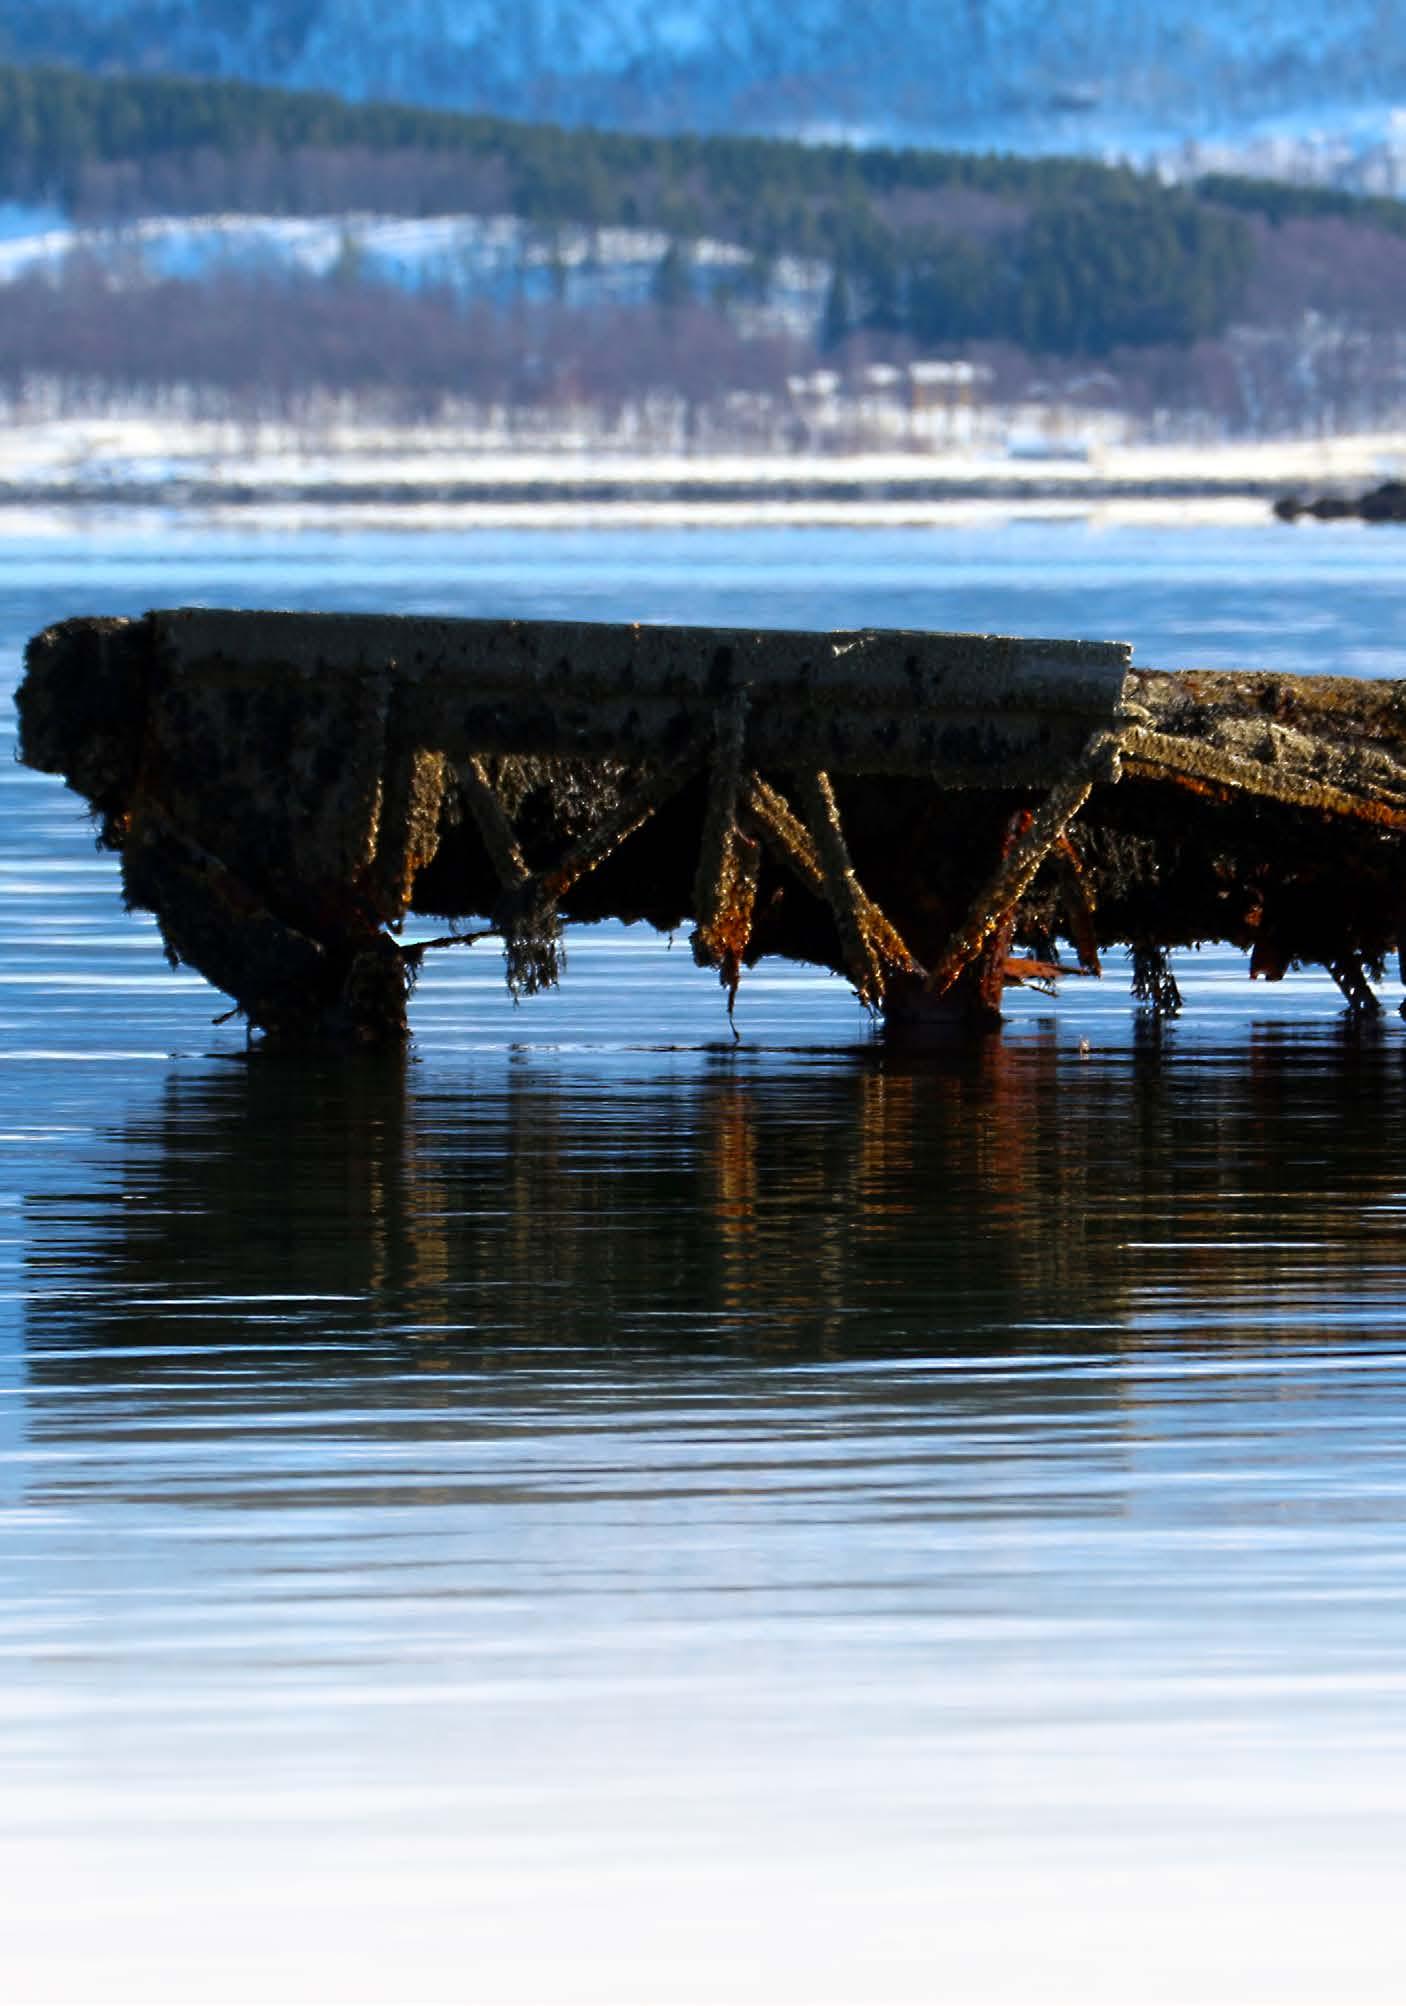
The Tirpitz salvage site is one of many areas in the Arctic where the legacy of war has resulted in contemporary concerns about effects on the biosphere and broader health and safety risks. Decades after the Royal Air Force sank the German battleship Tirpitz in 1944, and a subsequent salvage operation removed the ship’s high-quality steel and operational equipment, hundreds of cubic metres of nonsalvaged items remain on the site, along with widespread environmental contamination of the seabed. Current research on the Tirpitz salvage site, utilizing remote sensing and robotics, is developing innovative methods to map and monitor the site that can be utilized globally in near-shore environments.
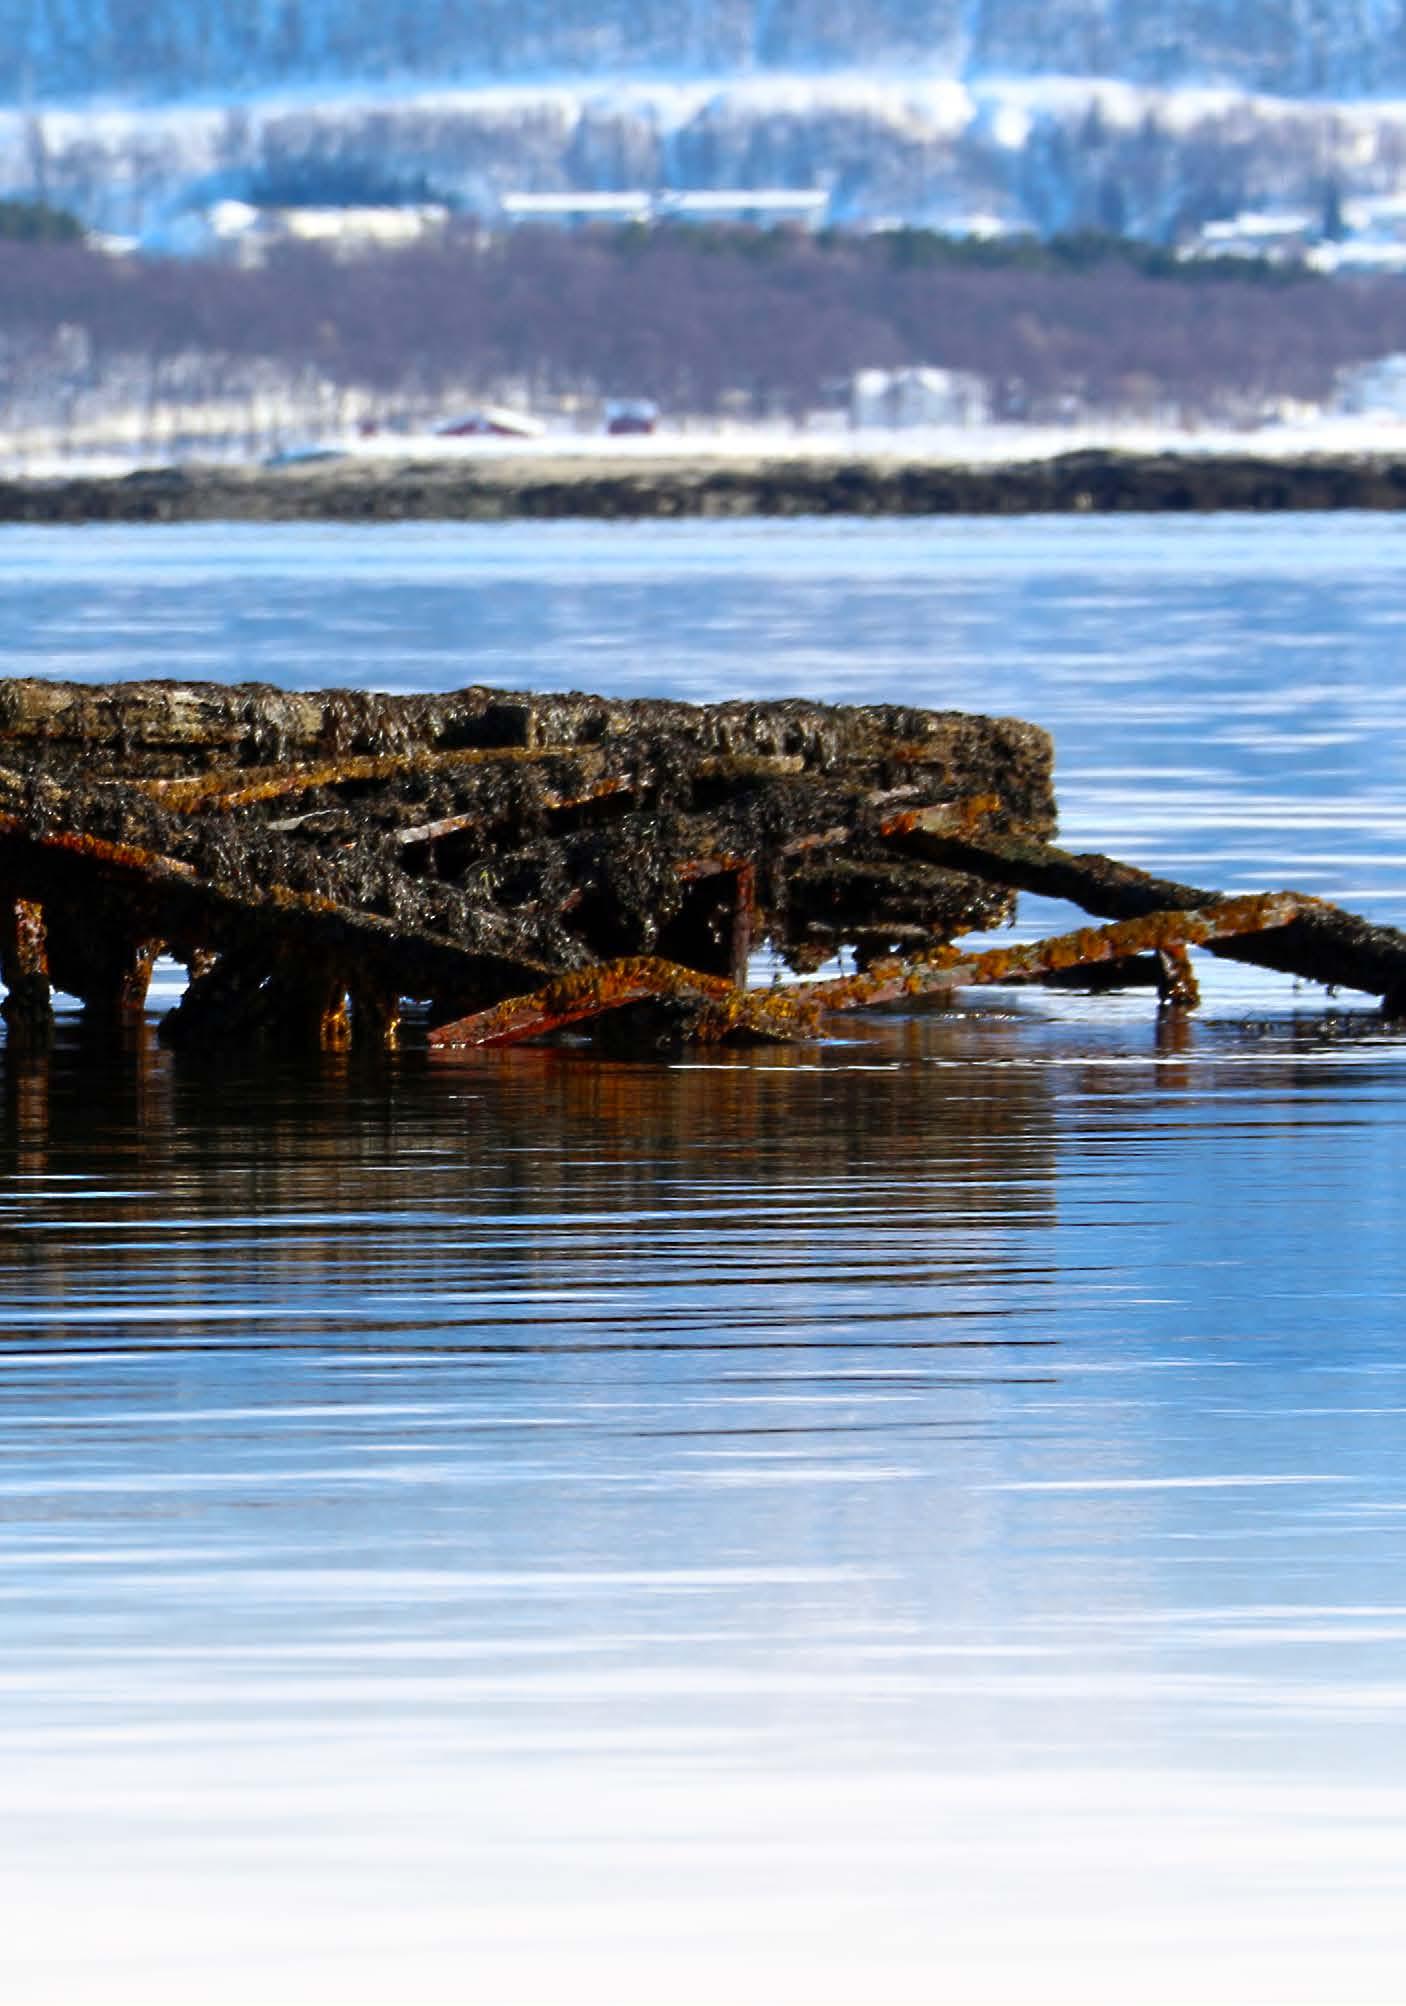
The Tirpitz and its sister battleship Bismarck were the pride of the Third Reich’s Kriegsmarine. Among the largest and most powerful battleships ever built, these ships posed a severe risk to Allied shipping convoys. Bismarck’s one sortie into the North Atlantic resulted in the sinking of HMS Hood, the flagship of the Royal Navy, before combined air and surface attacks sank the Bismarck. In response to this sinking, the Tirpitz was ordered to Norway, where it became a “fleet in being.” The potential threat was so severe that even at anchor, the Royal Navy was forced to deploy numerous ships in case the Tirpitz attacked the Arctic convoys, which supplied vital military equipment to the USSR. While at anchor, Tirpitz was repeatedly attacked by the Fleet Air Arm, the Royal Air Force, the Red Army Air Force, and Royal Navy midget submarines. Due to extensive damage from these attacks, the Tirpitz was sailed to Tromsø, designated as a shore battery, and moored in shallow water. This would, it was thought, allow it to settle on the bottom if damaged in an attack. On November 12, 1944, the Royal Air Force’s famous Dam Busters 617 Squadron and 9 Squadron attacked Tirpitz with Tallboy bombs. After direct hits and an internal explosion, the ship – badly damaged on one side – capsized (Figure 1) with the loss of over 900 German lives; the Royal Air Force squadrons returned
with no losses. Churchill, Roosevelt, and Stalin commended the mission.
The German military swiftly commenced salvage work, transporting the propellers and some of the hull’s armourplate steel to Germany. Following the war, the Norwegian government awarded salvage rights to the private company Høvding Skipsopphoggeri, which cut apart the ship in conjunction with Eisen und Metall of Hamburg. Highquality steel and operational equipment were salvaged, but other materials were dumped on the seabed. No environmental protection controls were in place. Over subsequent decades, environmental surveys have shown that the site is still contaminated with hydrocarbons, PCBs, and heavy metals.
The Tirpitz Site Project is utilizing the site for ongoing scientific research, technological development, and environmental monitoring. The project is being undertaken by UiT The Arctic University of Norway’s Institute for Technology and Safety and the Scott Polar Research Institute of the University of Cambridge. In 2025, an updated environmental contamination assessment is planned with the REMARCO EU research consortium (Remediation, Management, Monitoring and Cooperation addressing North Sea UXO, a European project funded by Interreg North Sea).
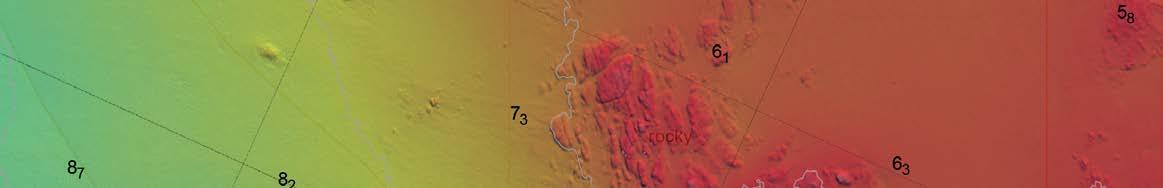
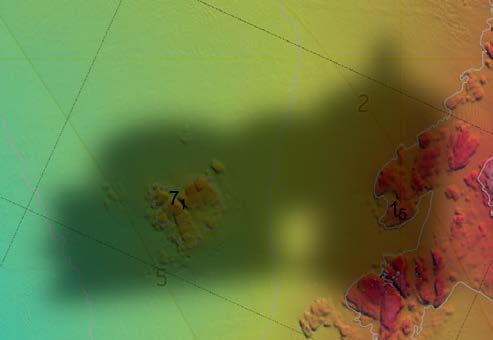
The Tirpitz Site Project team has begun to survey the site using an innovative method of aerial-based through water remote sensing (Figure 2). This work has resulted in the first map of the salvage site, which shows the remains of the salvage wharf and debris piles. The map was produced with an airborne robot with RGB and multispectral cameras that took images through the water on a calm, sunny day. Hundreds of images were combined, using Pix4D and further processing, to produce an image map showing over 7 hectares of the site for the first time. From this data, measurements accurate to around 2 cm were made to a depth of 5 metres. The
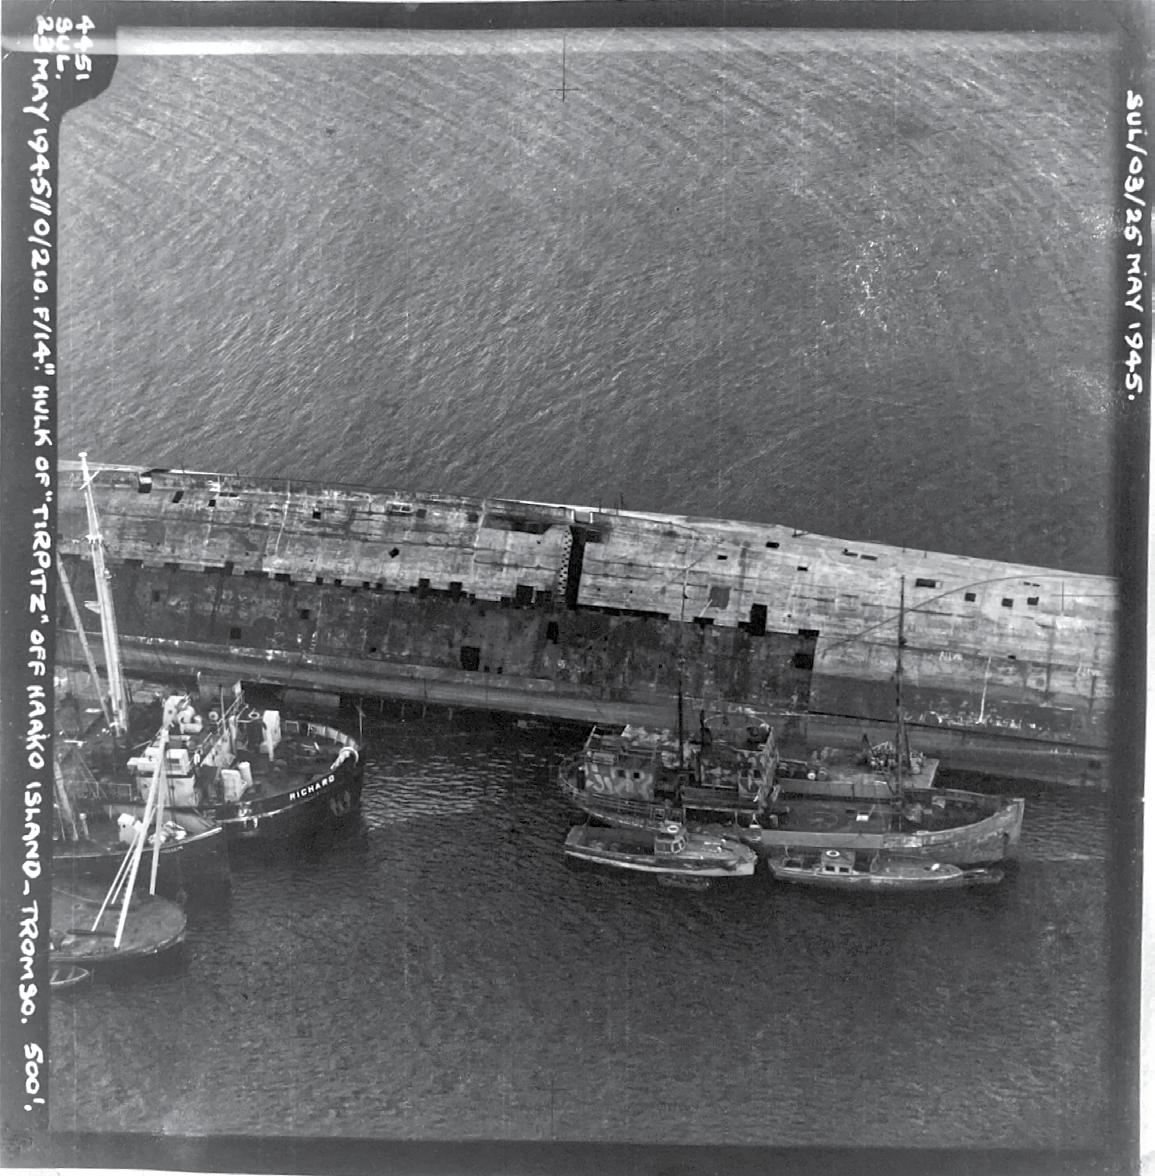
Figure 1: The capsized Tirpitz, May 26, 1945. The adjacent boats are from the German salvage operation.
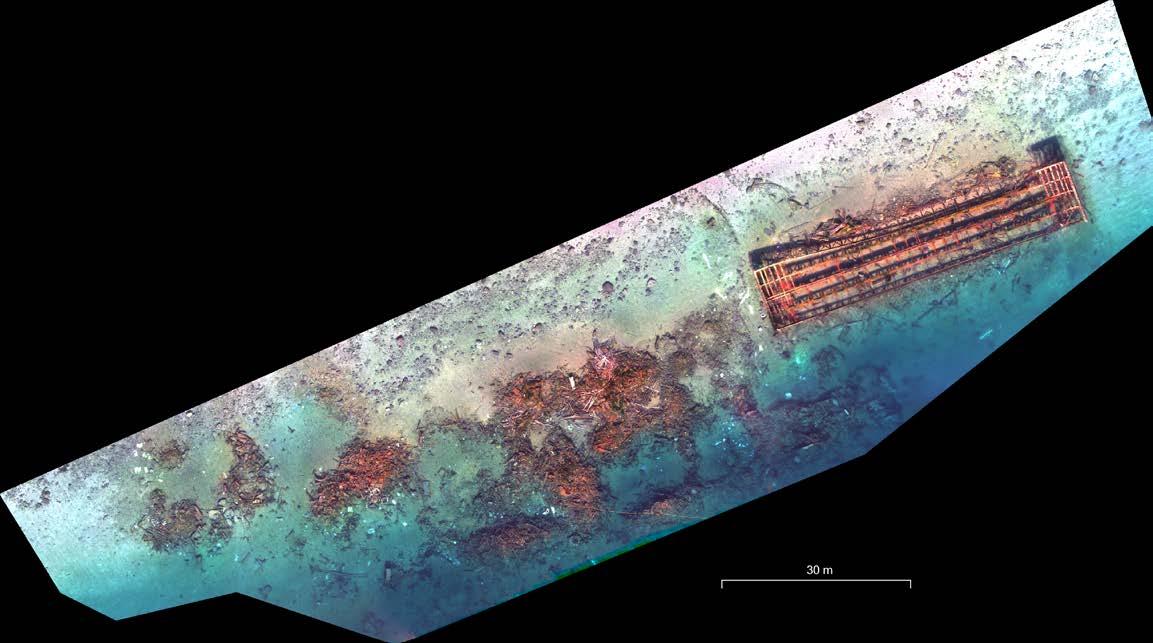
Figure 2: Tirpitz Salvage Site. Natural colour orthoimage image (extract) from aerial surveys on March 28, 2023, using a Phantom 4 UAV with a multispectral imager. The orthoimage, with a spatial resolution of 2.5 cm, will be used for a bathymetric map to accurately estimate the area covered by the Tirpitz debris. Image processing: Dr. Olga Tutubalina and Professor Gareth Rees (Scott Polar Research Institute, University of Cambridge). Image acquisition: Markus Dreyer, aerial images; Martin Bjørndahl, supporting underwater images (UiT Norway´s Arctic University).
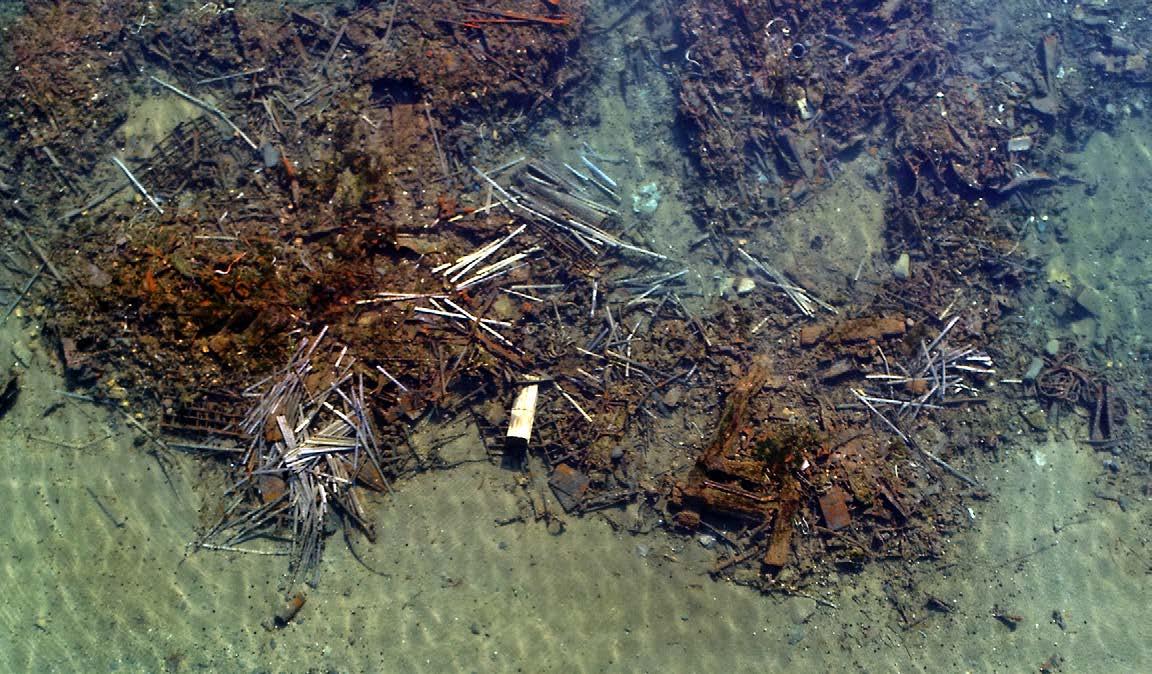
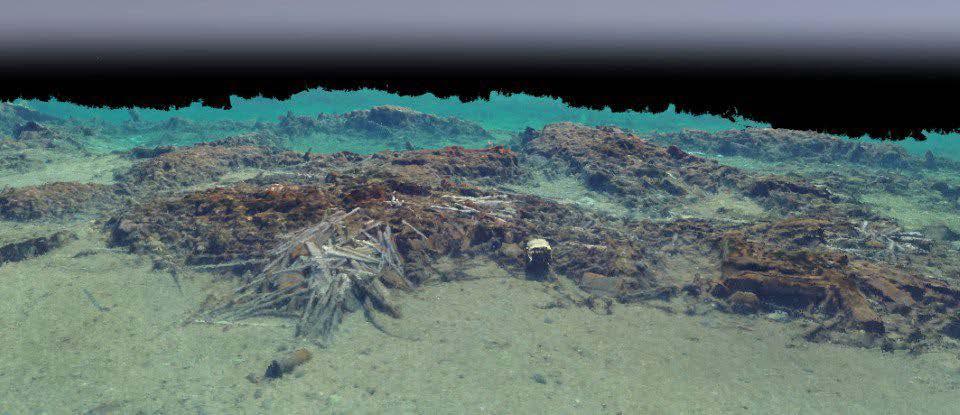
volume of debris piles has been estimated at around 750 m3, with a total mass of over 2,500 tonnes.
In addition, structure from motion has been utilized to produce 3D models of the debris piles (Figure 3). Blueye underwater robots have been deployed to identify images, such as the boiler tubes in Figure 4. This combination of robots proved to be swift, cost-effective, and environmentally benign.
This multidisciplinary project integrates science, technology, and archaeology with historical research. Recreational divers, who are a valuable source of information on how the site has evolved over the decades, are also important sources of information – as is the broader Tromsø community. This public engagement is a testament to the project’s commitment to citizen science. It also acknowledges and respects the local community’s central role in remembering the broader history of war in the Arctic.
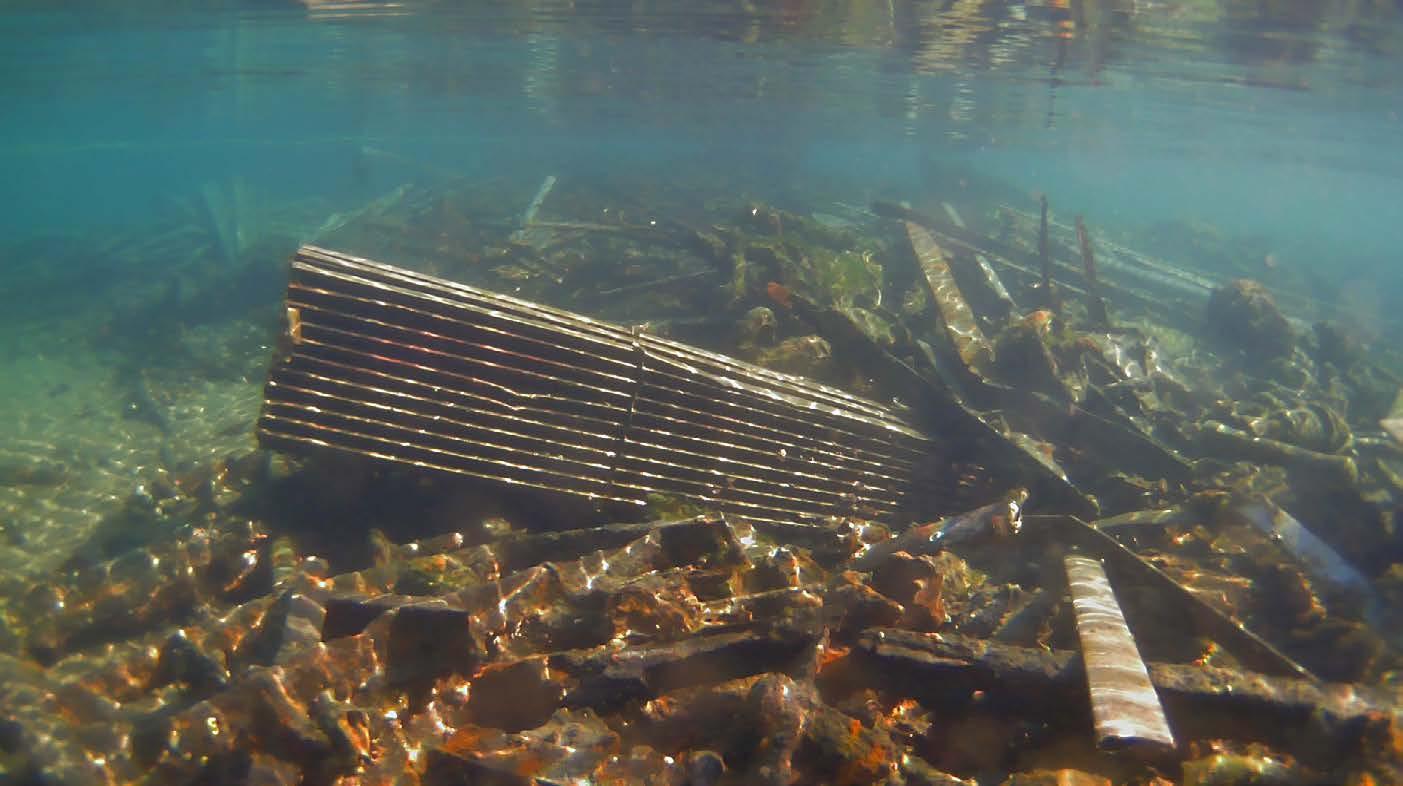
The legacy of war in the Arctic is similar to many other sites in the maritime realm. Areas where conflict has occurred may contain dangerous, even deadly, material that needs to be located, recorded, monitored, and, if necessary, the site remediated. There are also important issues of respect for the past; many sites are war graves and are profoundly important in national and related naval narratives and identities. Enhancing related technologies and methods has societal, environmental, and commercial value, particularly in ensuring fish stocks, lobsters, crayfish, mussels, and oysters are not contaminated. There is also a responsibility to current and future generations to deal with a worsening problem as fuel tanks leak and corroded shell cases allow explosives to enter the marine biosphere, posing a significant threat to the delicate balance of the marine ecosystem. Going forward, the Tirpitz Site Project’s enhancement of remote sensing techniques and robotic technologies contributes to global endeavours to deal with the toxic legacy of war. The through water imagery techniques also apply to other research, planning, and engineering activities in the inter-tidal and near-shore environment. u

Dr. Bryan Lintott is a polar historian at UiT Norway’s Arctic University. He specializes in multidisciplinary projects ranging from Antarctic and Arctic heritage conservation, to dealing with the environmental aftermath of wars in the Arctic. He is a leading member of the International Council on Monuments and Sites (ICOMOS) polar and aerospace heritage endeavours. Dr. Lintott is an institute associate of the Scott Polar Research Institute, University of Cambridge.
Professor Gareth Rees is a pioneer in polar geoinformatics, utilizing his theoretical research and fieldwork in the Arctic. Based at the Scott Polar Research Institute, University of Cambridge, his research strongly focuses on interactions between climate, ecosystems, and energy policy in the Arctic. Increasingly, he is engaged with science diplomacy, guiding international research agendas for the Arctic, and with the democratization of science through citizen engagement. He is a fellow of Christ’s College, Cambridge. Professor Rees has a strong association with UiT Norway’s Arctic University.

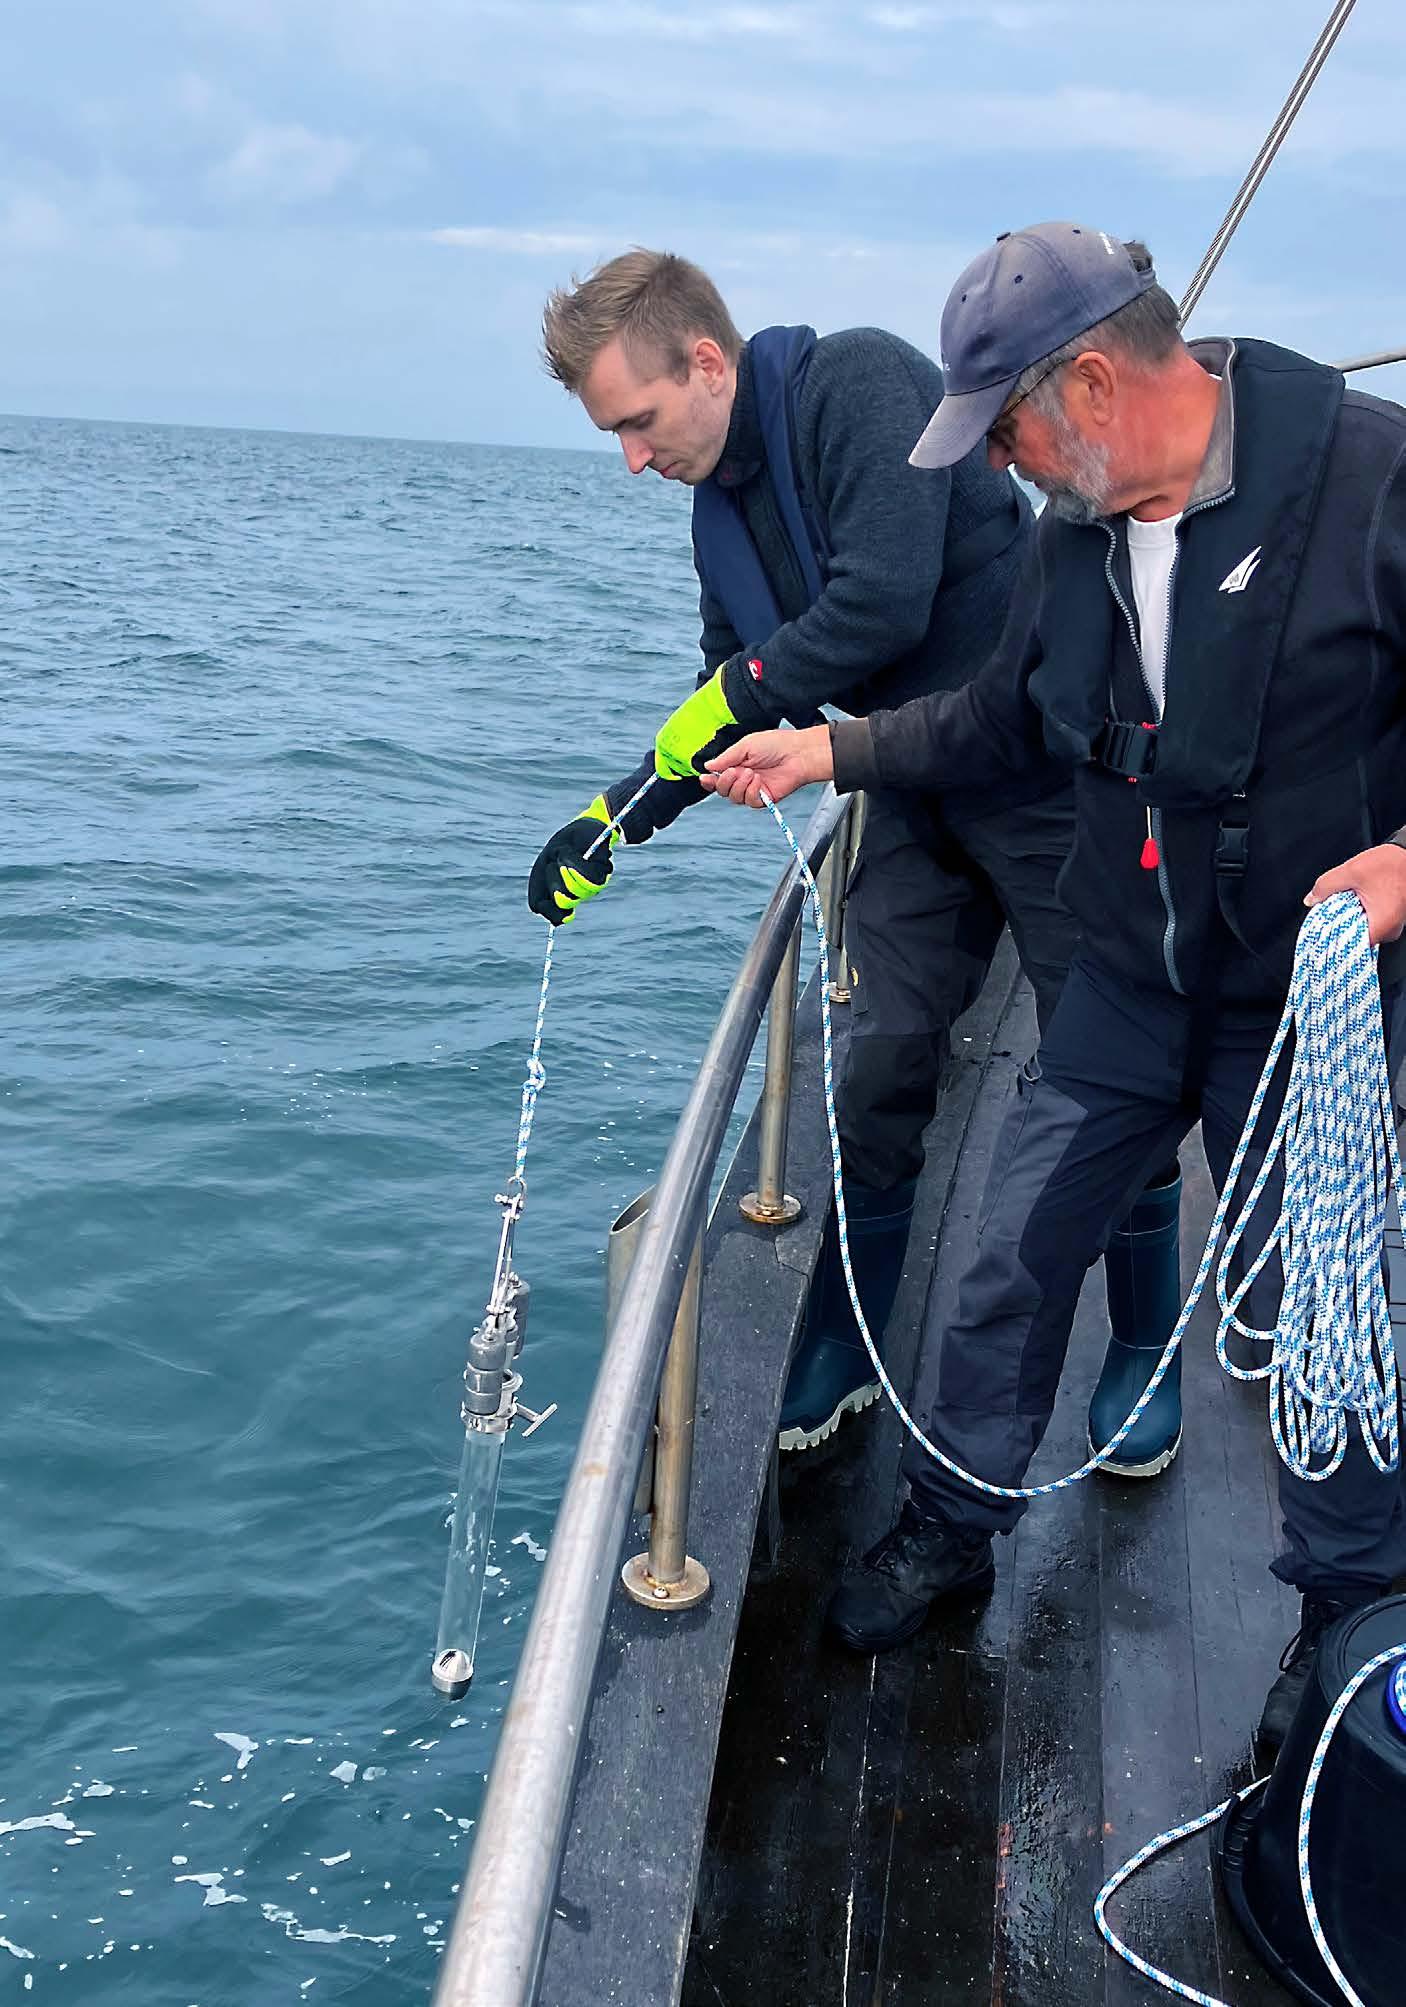
by Niels Madsen, Amanda Irlind, Alex Jørgensen, Karen Ankersen Sønnichsen, Malte Pedersen, Jonathan Eichild Schmidt, Anders Skaarup Johansen, Galadrielle Humblot-Renaux, Thomas B. Moeslund, Nadieh de Jonge, and Jeppe Lund Nielsen
Our essay reflects on the limitations of conventional sampling methods used in standardized marine monitoring programs, which have rapidly increased in importance to overcome the necessity of marine spatial monitoring. Underwater cameras are generally not used, although present monitoring programs do not collect sufficiently detailed information. Recognizing this, we have embarked on a process to develop and implement camera-based concepts to collect important supplementary information in marine monitoring. We have made a
qualitative assessment of their use compared to the conventional methods and aim to answer the question: “What can camera concepts sense for you – that conventional sampling methods do not?”. Implicit is, therefore, our assessment of the applicability of conventional sampling methods.
Our qualitative analysis is presented in Table 1. It is particularly grounded in experience from a recent study conducted in 2023 in the Greater North Sea (5-35 m depth). The aim was to map seabed fauna and habitats and observe the effects of anthropogenic activities (particularly
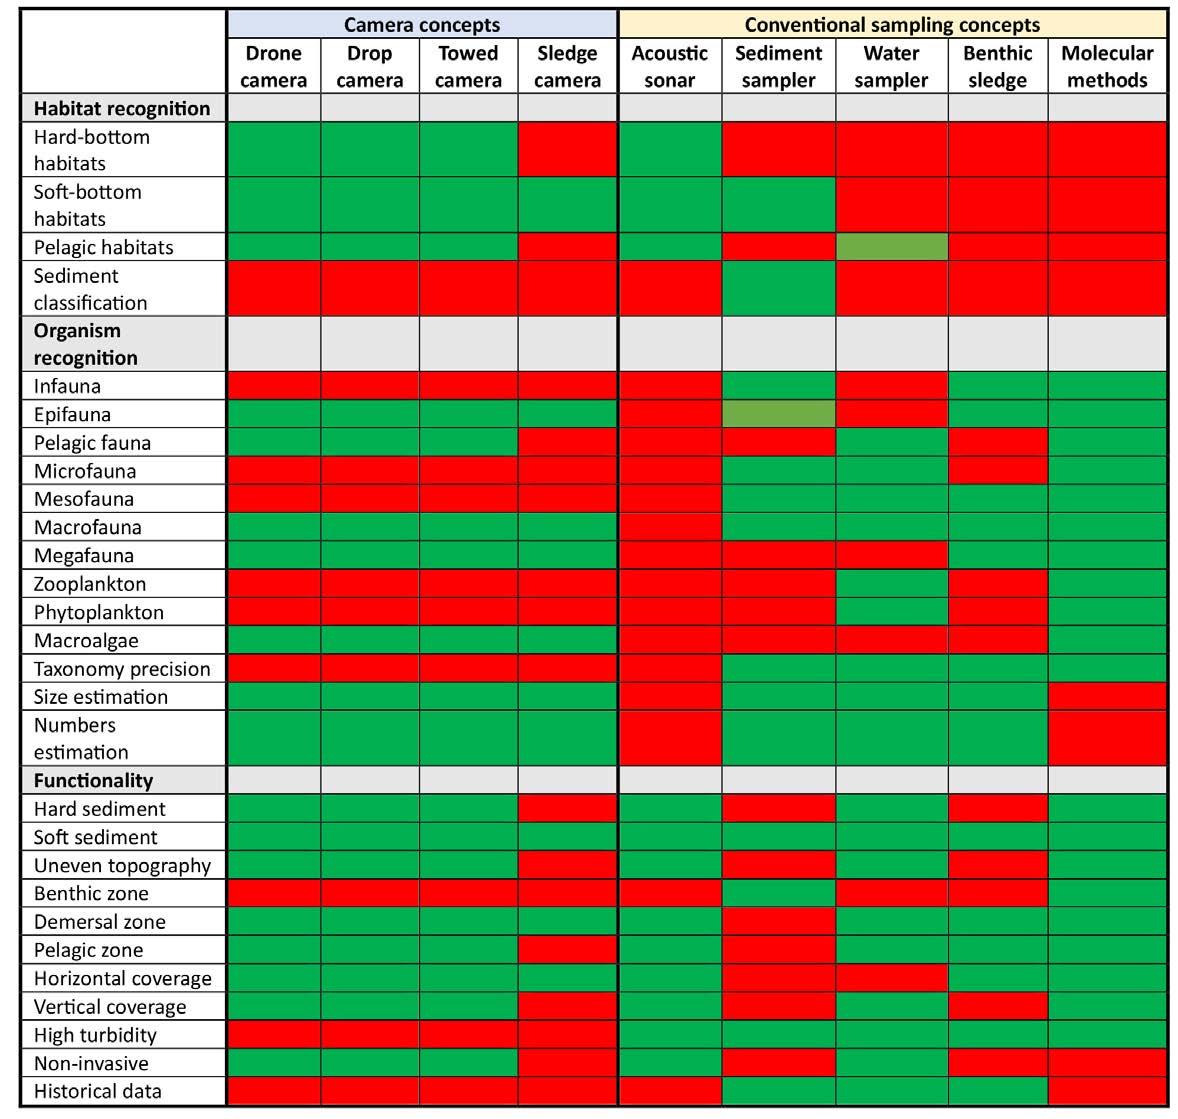
fisheries). We were challenged to develop additional methods to collect information in greater detail than conventional sampling methods offer. Our use of standard methods is based on the standardized national Danish sampling programs, which are comparable to many other European countries. Our sampling equipment used is briefly described at the end of the essay, but the comparisons presented in Table 1 are considered to be of general character for the sampling concepts.
We hope our reflections can inspire other scientists to improve monitoring programs beyond where we started.
The demand for ecosystem-based marine spatial planning is rapidly increasing in the European Union (EU), necessitating comprehensive, detailed, high-quality data. This direction is driven by a number of key directives and strategies that mandate detailed marine mapping, including data on flora and fauna, habitats, substrata, and the assessment of anthropogenic ecosystem pressures (such as fisheries). These include the European Union Biodiversity Strategy, the Marine Strategy Framework Directive, the Habitats Directive, and the Maritime Spatial Planning Directive. Furthermore, the regulation of increasingly prevalent anthropogenic marine activities, such as offshore energy areas, large marine infrastructure projects, and fisheries, underscores the necessity for detailed environmental mapping to prevent adverse environmental impacts.
Most marine organisms are found in connection with the benthic zone (sediment surface and upper layer subsurface), which is the main focus in marine spatial planning. There is a very limited focus on the demersal zone (the water column near the seabed) and, in particular, the pelagic zone (water column).
Acoustic methods, particularly single-beam, multibeam, and side scan sonars (sound
navigation and ranging), have been the main tools for seabed mapping. Since the early 1970s, a primary objective for seabed mapping in many areas has been identifying sand and gravel resources. However, the focus has shifted, particularly because of the construction of offshore wind farms and, more recently, habitat mapping programs related to marine protection in the increasing number of EU directives. Advanced acoustic technology can efficiently cover large areas and be used as habitat indicators since sediment types and three-dimensional seabed structures are identified in great detail but cannot identify marine organisms.
Historically and currently, the primary source of information on marine fauna comes from the standardized use of sediment samplers. Sediment can also be collected, but they are generally not useable to collect macroalgae. Various constructions of box corers are among the simplest and most commonly used sediment samplers. Grabs (clamshelltype) are typically chosen as an alternative or supplement to a corer. Since the methodology for most sediment samplers is standardized, collected data offers the great benefit of comparability, including historical data. Epibenthos sledges are also commonly used as a conventional sampling method, particularly to monitor the epifauna that are generally more mobile, have greater size ranges, and are fewer in numbers. Epibenthos sledges can cover relatively large areas but are highly restricted by seabed topography and hard substrates (particularly stones).
Environmental DNA (eDNA) is an increasingly used molecular method for identifying organisms, but mainly as a supplement to standard monitoring surveys and for specific purposes. This is an interdisciplinary method in which samples are collected using conventional methods (mainly sediment or water samplers), and DNA is extracted from the environmental matrix. The great advantage of eDNA analysis is the ability to identify the full-size spectrum
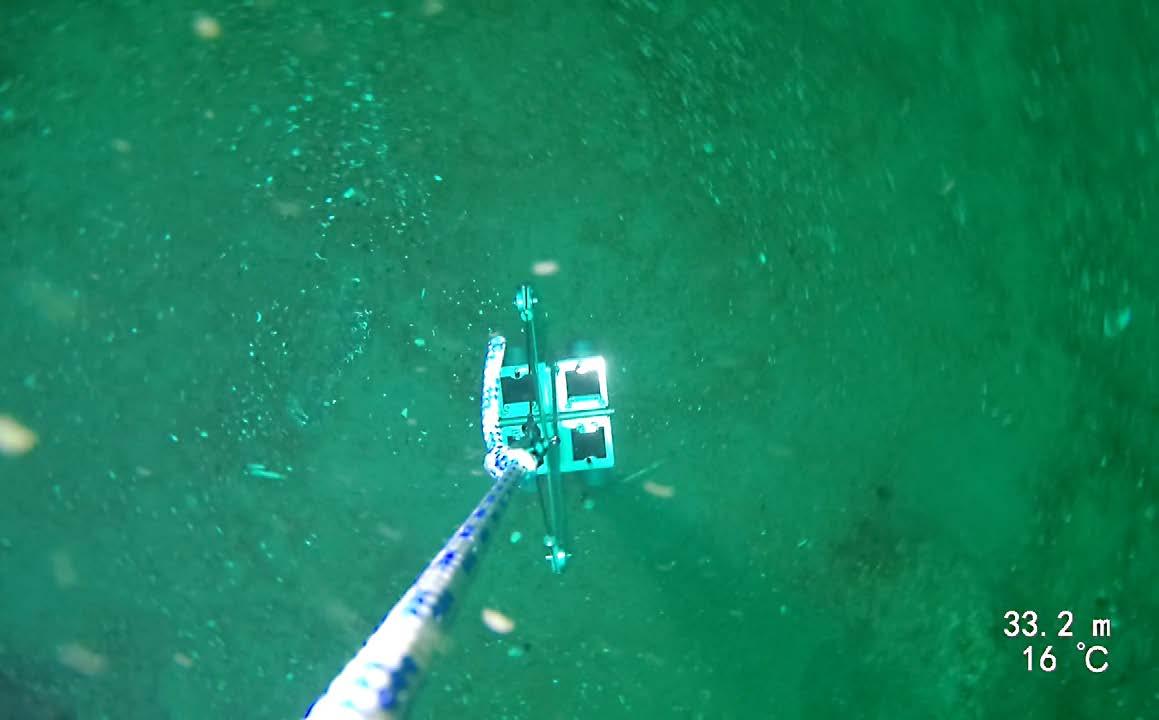
of all organisms from microbiome (bacteria, archaea, fungi, algae, and small protists) to the megafauna and hence also detailed insight into trophic levels and ecosystem functioning. A constraint is the transportation of DNA in the marine environment and the inability to quantify in numbers and sizes, as well as incomplete reference databases, needed to identify the eDNA signals.
Technological progress has made underwater camera techniques expand rapidly for marine monitoring. They are particularly used for habitat recognition and identification of macrofauna and megafauna. They are not used in standardized sampling programs, although occasionally for specific monitoring tasks. There are presently no sampling protocols or technical descriptions to ensure comparability among studies.
The four camera concepts we have developed and used are described below and some examples are shown in Figures 1 and 2. For size estimation, laser pointers or stereo
vision technology is applicable for all of the four concepts. There is a wide range of HD underwater cameras and shapes (cylindric or box-shaped) that can be used according to aims and choice of method.
• A “drone camera” where the camera is mounted on an underwater drone (M2 Pro Max, Chasing), manoeuvrable in all directions, with a real-time connection to a screen on deck and can be used for specific targeted operations in relevant areas (in principle, a small, low-cost, highly manoeuvrable remotely operated vehicle).
• A “drop camera” where the camera is mounted 1 m above a sediment grab (Van Veen grab), alternatively compact heavyweights when covering hard habitat areas where grabs are not used, easily incorporated into standard monitoring programs with sediment grabs and will provide a view of about one square metre around the sediment trap.
• A “towed camera” where the camera is mounted on a towfish (hydrodynamic towfish, LH camera, Denmark) that
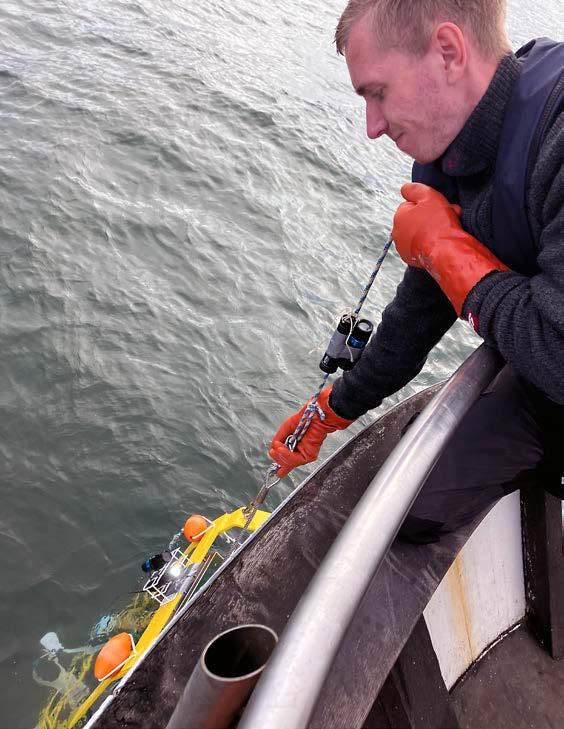
is dragged after the vessel, vertically manoeuvrable with a real-time connection to a screen on deck.
• A “sledge camera” mounted on an epibenthos sledge (Ockelman sledge, KCDenmark) has a forward view of the area covered by the sledge.
What can Camera Concepts Sense for You – that Conventional Sampling Methods do Not?
Our qualitative assessment of methods is presented in Table 1, from where we identify that the use of camera concepts is particularly relevant as a supplement for conventional sampling methods in:
• Areas with hard-bottom habitats like stone reefs that are currently poorly monitored with conventional methods.
• Habitat recognition to collect supplementary information.
• The demersal zone, but also with some potential in the pelagic zone.
• Monitoring the epibenthic fauna, particularly the macro- and megafauna.
• Identification of macroalgae.
• Monitoring where taxonomic precision is not crucial.
• Areas and periods where turbidity is not a limiting factor.
• Surveys where sediment samplers and benthic sledges can be used as platforms.
• Acoustic surveys where towed cameras can be used simultaneously.
• Sensitive areas where non-invasive methods are required.
• Combination with molecular methods, potentially mounted on eDNA samplers.
In conclusion, we find that cameras can provide information that conventional sampling methods do not. They can be combined with conventional methods, but sampling protocols must be established. In the future, continuous improvements in camera technology, image analysis, and accessories (light, laser, batteries, etc.) will further favour camera concepts for monitoring surveys. Furthermore, the potential use of artificial intelligence will greatly strengthen the information that is sensed by cameras.
Materials used in our studies: side scan sonar (DeepEye Dual 340/680, DeepVision), sediment samplers used are a sediment corer (Kajak corer, KC-Denmark) and a sediment grab (Van Veen grab, KC-Denmark), a water sampler (Niskin, KC-Denmark), an epibenthos sledge (Ockelman sledge, KC-Denmark), and eDNA testing (metabarcoding with welldescribed DNA barcodes). Cameras used: HD-Trawl Eye Camera (LH camera), GoPro HERO Black 11 camera (GoPro, USA), Paralenz 4K resolution camera (Paralenz, Denmark). DNA metabarcoding (molecular methods) was performed with well-described DNA barcodes targeting the microbiome, meiofauna, invertebrates, and vertebrates. The generated PCR products were pooled in equimolar concentration per sample prior to preparation for DNA sequencing with Oxford Nanopore Technologies PCR Barcoding and Ligation Sequencing protocols.
The funding for this study was provided by the European Maritime and Fisheries Fund and the Ministry of Environment and Food of Denmark (Grant number 33113-B-23-190). u
Dr. Niels Madsen is a professor at Aalborg University (Denmark) and a member of the Danish Biodiversity Council. His main research areas are marine biology and technology. His current research focus is on marine protected areas and the environmental effects of fishing gear.


Amanda Frederikke Irlind (M.Sc. in biology) is a PhD fellow at Aalborg University. Her research is focused on the impact of fisheries on the marine environment. She has previously studied bycatch in smallscale fishing in Greenland fisheries.
Alex Jørgensen (M.Sc. in biology, research assistant) has worked on research projects on discard survival in fisheries and the environmental impact of fishing gear.

Jonathan Eichild Schmidt holds a three-year PhD scholarship at the Technical University of Denmark, specializing in the assurance of perception systems for autonomous vessels. He earned his M.Sc. in robotics with a focus on computer vision for navigation. His current research focuses on using computer vision at sea.

Dr. Anders Skaarup Johansen is a postdoc at Aalborg University. He studies applications of objectcentric computer vision algorithms for real-world applications. He is interested in how to retain the performance of machine-learning based vision systems in adverse conditions.
Galadrielle Humblot-Renaux (M.Sc. in robotics) is a PhD fellow funded by the Danish Data Science Academy and a member of the Visual Analysis and Perception Lab at Aalborg University, Denmark. She is particularly interested in the problems of model uncertainty and data ambiguity in machine learning.
Karen Sønnichsen’s (M.Sc. in biology, research assistant) research interests are primarily focused on the ecology and population biology of marine macroand megafauna, particularly the impact of human disturbance on these communities. She has also conducted research on marine mammals.
Dr. Malte Pedersen holds a PhD in computer vision focused on problems in underwater environments. For the past eight years, he has worked extensively on projects involving computer vision and machine learning in marine environments and is currently working as a postdoc in the Visual Analysis and Perception Lab at Aalborg University.

Professor Thomas B. Moeslund (PhD) is currently the head of the Visual Analysis and Perception Laboratory, head of Section for Media Technology, and head of AI for the People Center, all at Aalborg University, Denmark. His overall research interest is building intelligent systems that make sense out of data with a special focus on computer vision and AI.
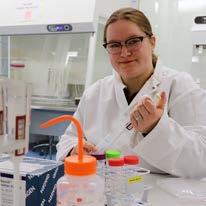
Dr. Nadieh de Jonge is a tenure track assistant professor at the Department of Chemistry and Bioscience, Aalborg University, Denmark. Her research is focused on the application of molecular techniques, particularly eDNA, in ecological studies and biodiversity monitoring of natural ecosystems.

Dr. Jeppe Lund Nielsen is a professor at Aalborg University, Denmark, with expertise in the use of molecular technologies for biomonitoring (eDNA) and microbiome studies.
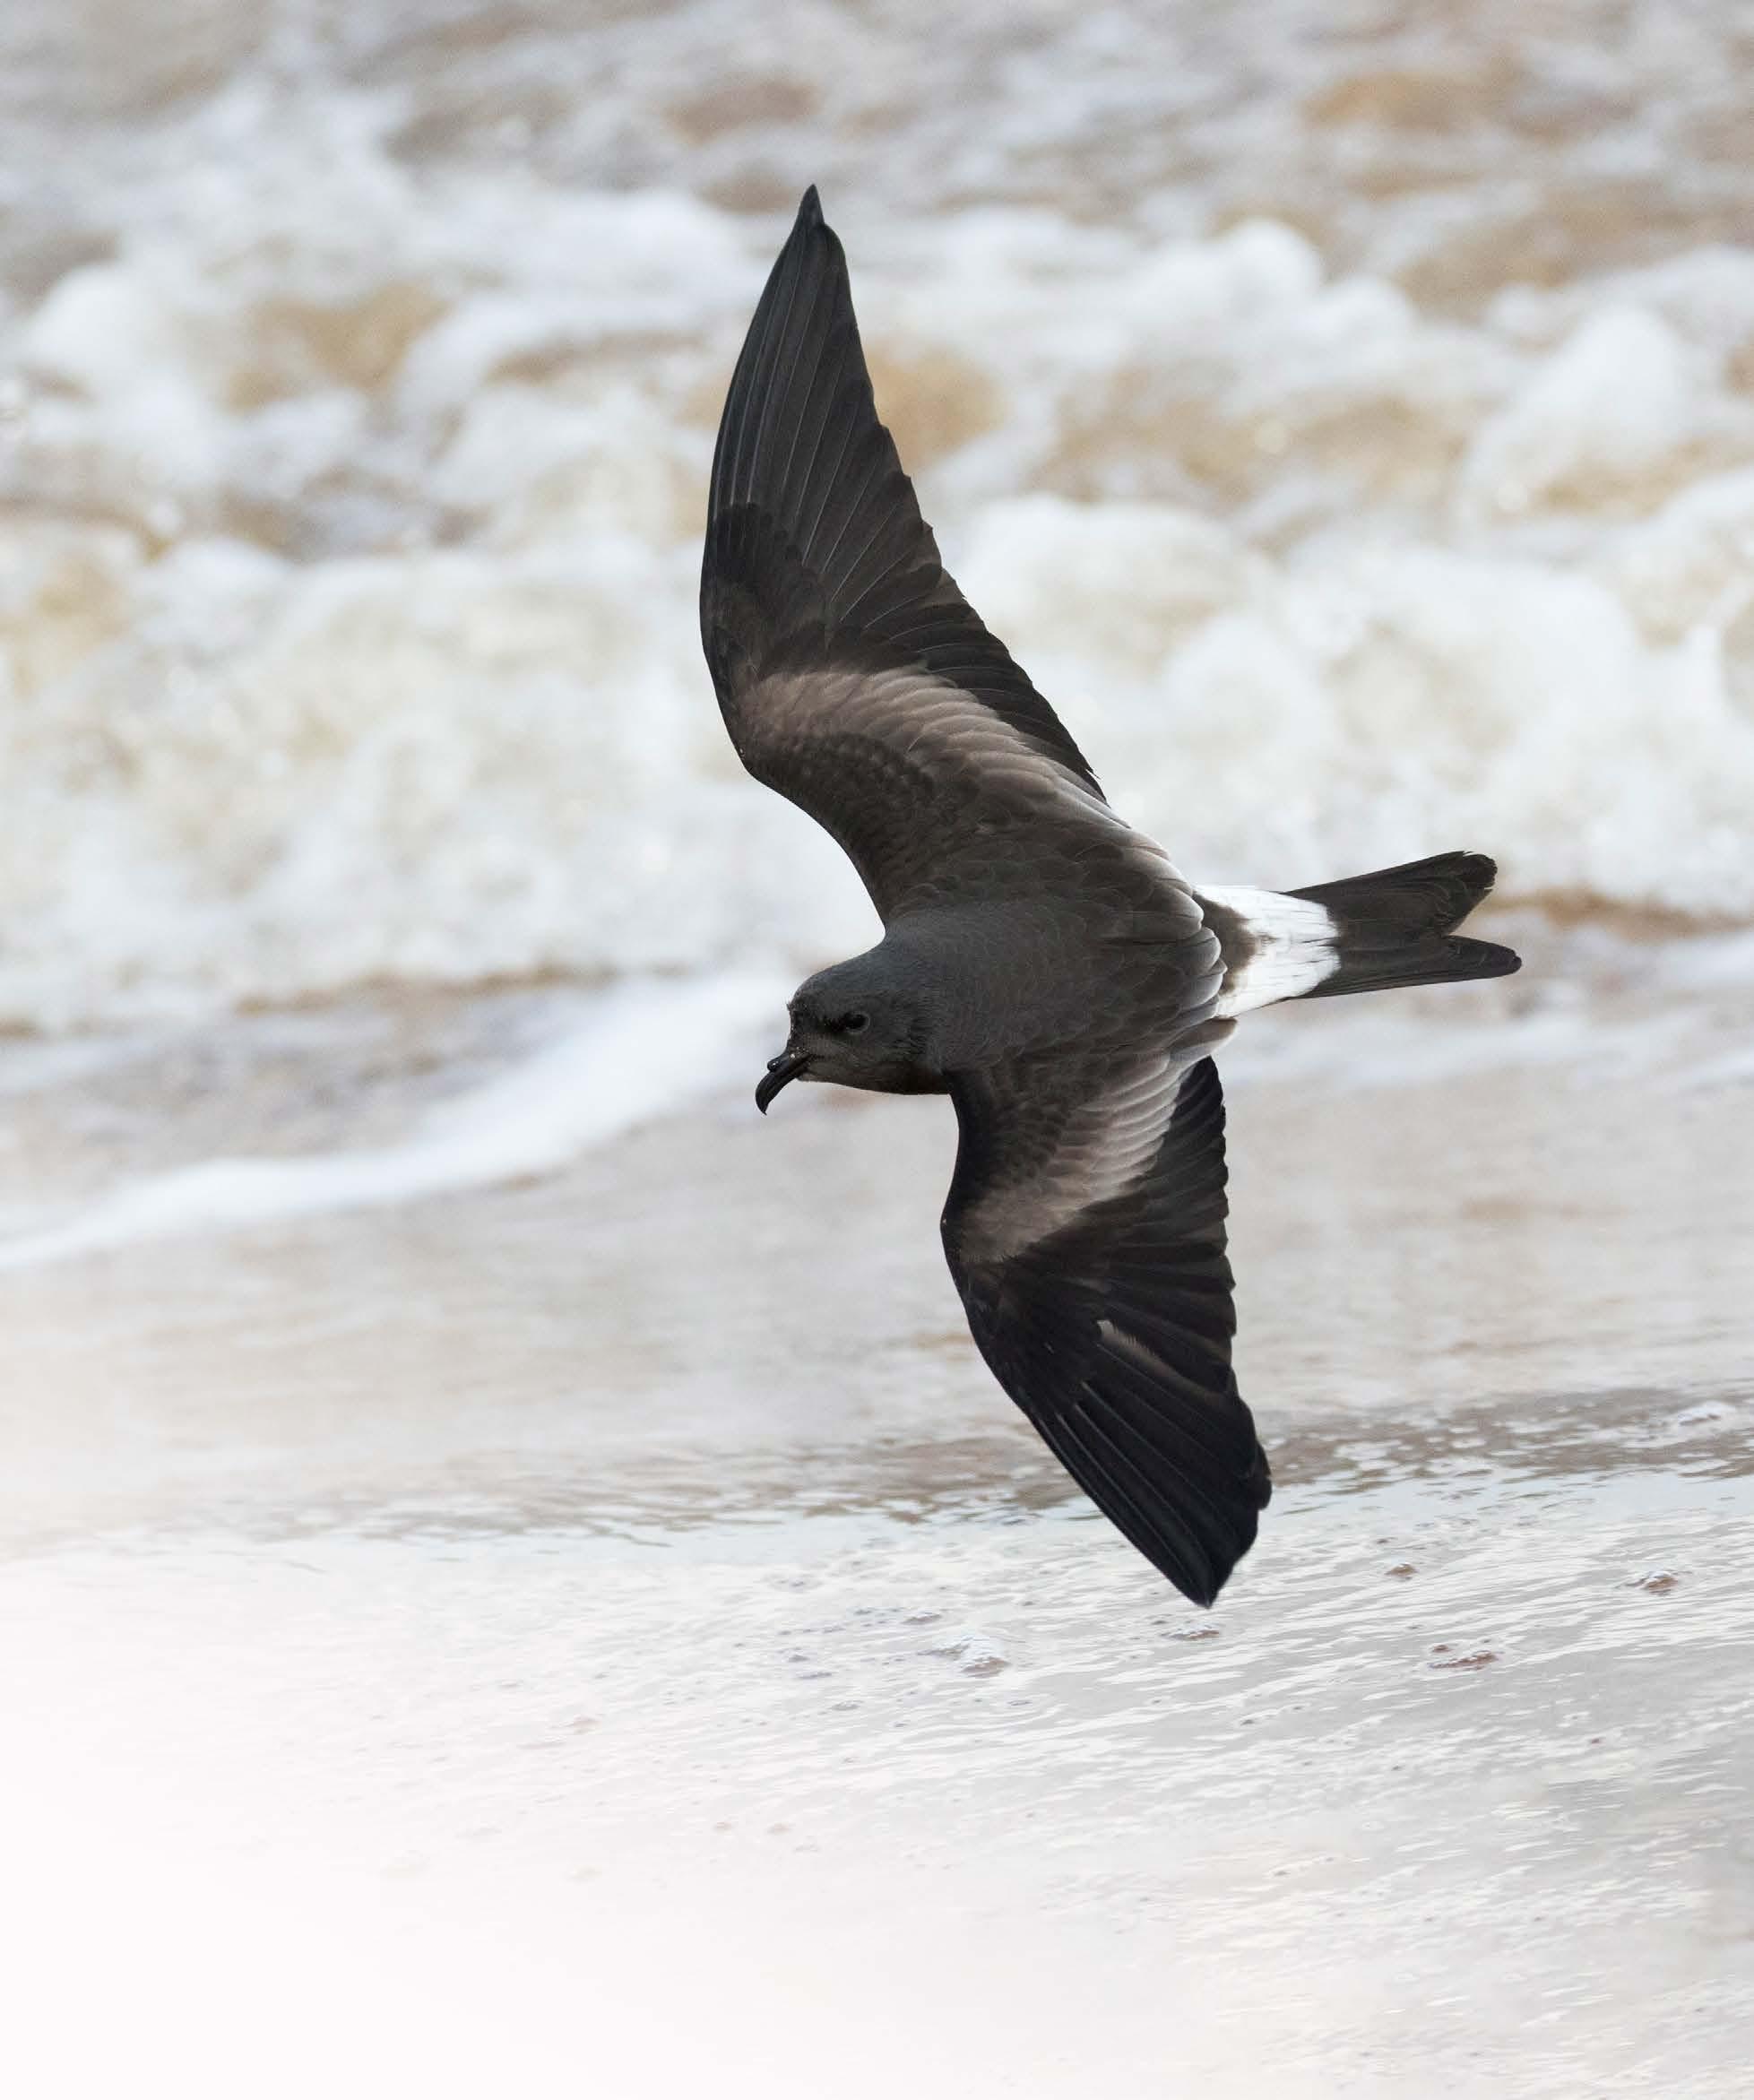
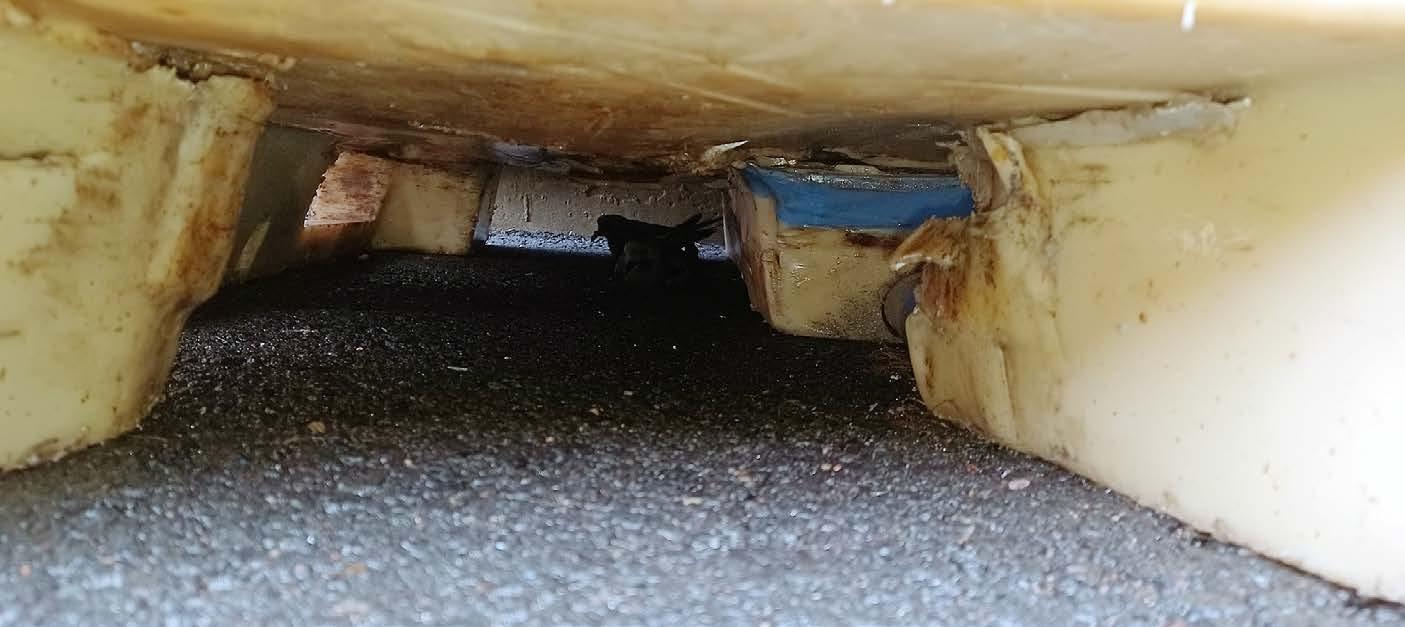
Anthropogenic light at night (also known as ALAN) has a profound attractive effect on avian wildlife. At night, offshore oil and gas structures and vessels are well lit and conspicuous in a relatively flat and dark marine environment. The light field from offshore production structures in Atlantic Canada varies from tens to hundreds of kilometres wide. Seabirds attracted and disoriented by lights from offshore platforms and vessels may collide with structures, resulting in direct injury and mortality. Seabirds may also become stranded on the structure and subject to secondary adverse effects such as predation, starvation, and dehydration.
The species most commonly attracted to and stranded on offshore platforms and vessels in the Eastern Canada region is the Leach’s StormPetrel (Hydrobates leucorhous), a small robinsized, tube-nosed seabird that has garnered increased conservation interest in recent years due to dramatic population declines in the North Atlantic. These stranding events are episodic in nature, and typically occur nocturnally, during periods of time with reduced visibility (e.g., fog, rain, low levels of lunar illumination), and during the fledging period in September and October, with the vast majority of impacted birds being recently fledged juveniles.
At present, the monitoring of seabirds on offshore structures and ships is mainly done by human observers following standardized federal guidelines for conducting daytime visual observations and daily stranded seabird searches. Daytime visual observations are used to monitor the area around the ship or platform at regular intervals during daylight hours. In stranded seabird surveys, personnel walk a pre-determined route, typically at dawn, around the vessel or platform to find stranded birds. The number of stranded seabirds may be underreported as some carcasses can become lost to the sea following collisions with infrastructure or lost to predation. Storm-Petrels also have an innate tendency to hide in crevices, which may impede detection following stranding on a platform or vessel (Figure 1). It is pertinent to implement detection programs to augment observer efforts with technologies that are capable of 24/7 monitoring and viable in the harsh conditions associated with Eastern Canada. In this essay, we discuss various types of technology that may be applicable for detecting birds in the offshore oil and gas industry of Eastern Canada.
Implementing detection programs offshore must account for species-specific behaviours
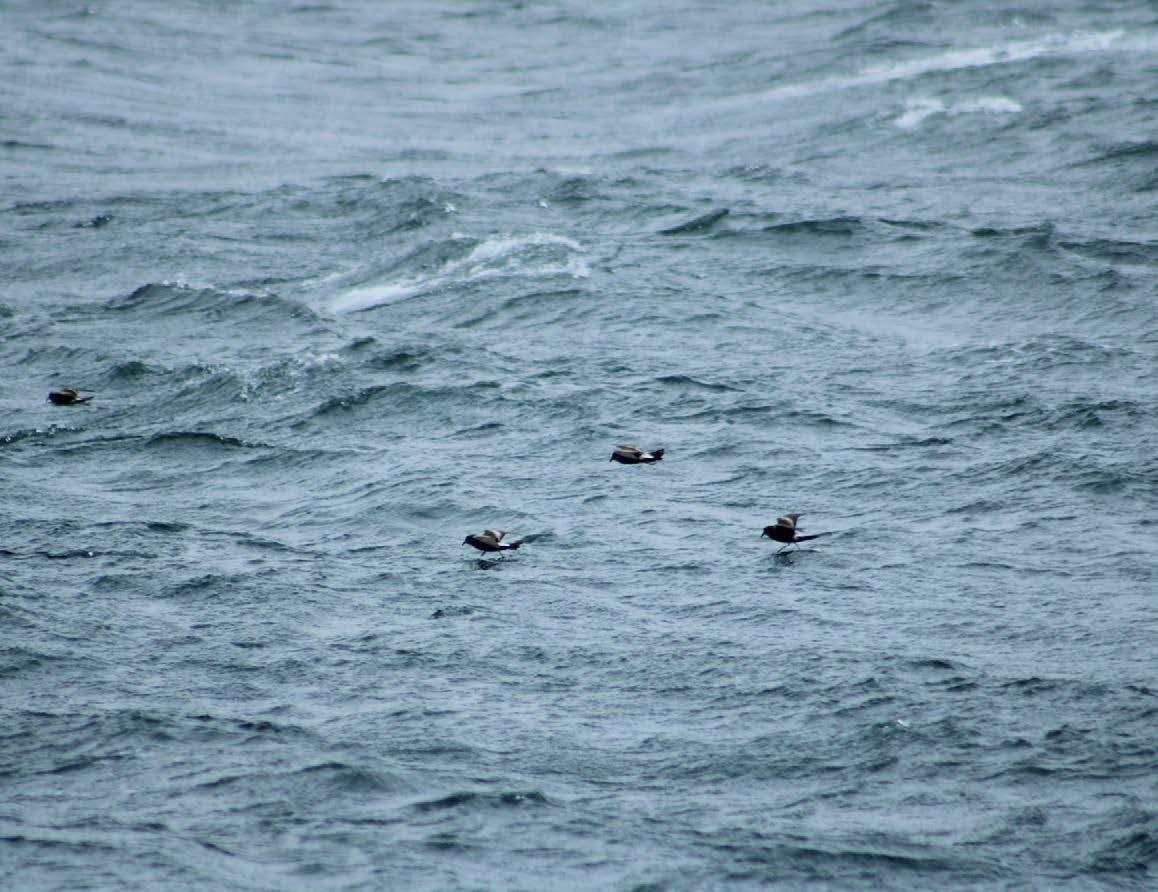
and environmental factors. Repeated counts of the same individuals circling structures can occur, and flight heights differ greatly among and within species due to varying local weather conditions. Northwest Atlantic seabird species employ a variety of different foraging strategies, which can also complicate broad application of detection technologies. For example, alcids (e.g., puffins, murres) often rest on the sea surface, potentially eluding flight-focused monitoring. Larger, more conspicuous birds such as gulls and gannets pose fewer detection challenges owing to their size and tendency to occur at greater heights. Storm-Petrels are perhaps the most difficult seabirds to detect at sea, as they are by far the smallest seabirds that occur in the North Atlantic, are dark in colouration, and forage by pattering along the ocean’s surface amid swells (Figure 2).
Offshore oil infrastructure complicates seabird detection due to infrastructure size, numerous hiding spots, and operational factors like bright lights, noise, and intense heat sources (e.g., flares) that hinder technology effectiveness.
These aspects are crucial when developing monitoring programs for seabirds interacting with offshore oil infrastructure.
Radar
Radar has been used extensively for ornithological studies for decades and represents a valuable technology for monitoring bird behaviour and migratory patterns. Radar emits a pulse of radio waves that are reflected back when they encounter an object (i.e., a bird). The distance to the object can be determined by the characteristics of the returned energy. The size and shape of the bird can have effects on the strength of the reflected signal. Radar can be used to monitor for birds during adverse weather conditions, at night, and other periods of reduced visibility. For species identification, the radar data can be complemented by other methods such as visual and acoustic monitoring.
There are many available radar solutions for detection of birds; however, they have
limitations in offshore environments due to the different detection probabilities of birds, detection capabilities at various distances, and trade-offs in coverage or information collected (e.g., flight height estimation, bird movements). There may also be platform specific logistical constraints. For example, radar was deemed not viable for seabird monitoring on the Hebron Production Platform offshore Newfoundland and Labrador in 2017, as maintenance and data processing of the system requires onsite personnel, which is not always possible due to limited space on the platform. The significant number of structures on the platform would require a narrow radar beam that would not provide robust data on seabird behaviour. Finally, the height of the platform was such that the radar beam would have been too high to detect most seabirds in the immediate vicinity. Due to these constraints, trained observers were favoured over radar for seabird monitoring.
With advances in radar technology and increased focus on assessing bird interactions with offshore wind turbines, there are now high-performance radars for tracking seabirds that allow for 3D tracking and efficient filtering of background clutter such as waves. For detection of a small seabird such as the Leach’s Storm-Petrel, a high signal-to-noise ratio in the receiver is required. This means that the strength of the reflected signal from the target should be greater than the background noise level. Therefore, radars deployed for the purpose of assessing interactions with this species should be of high power, high resolution, and capable of advanced filtering and tracking capability.
Video and time-lapse cameras can be used for passive detection and monitoring of seabirds in a variety of conditions and habitats. The distance at which birds can be detected and identified down to species or species groups depends on the focal length of cameras and subsequent image resolution.
Time-lapse cameras are typically used to monitor seabirds where they are consistently known to occur or an area of interest where they might occur (i.e., monitoring of breeding success at colonies). Time-lapse cameras can record an image at a set interval or record when there is any movement within its detection radius. Setting a camera to capture images at regular intervals extends battery life but may result in missed bird sightings. Motion sensor settings at high sensitivity can deplete batteries quickly by capturing all movement, including waves and wind-induced camera motion.
Video cameras are preferable for constant field measurements, such as continuous monitoring of seabird interactions with flare stacks and/ or anthropogenic lighting. Most applications of seabird detection using video cameras have been at colony sites, though they have been applied to industrial sites. For example, closedcircuit television (CCTV) cameras have been deployed by Equinor on offshore wind turbines in the North Sea for automated bird monitoring and species characterization near wind turbines.
Thermal imaging cameras can be used to detect the heat or infrared radiation and are particularly useful for wildlife detection at night or in limited visibility, such as the offshore environment. Objects such as wildlife emit radiation in the mid to long wavelength infrared radiation spectrum (3-14 um). This wavelength is not visible but can be detected and converted by thermal cameras into video or images. Thermal cameras are available as handheld or fixed on structures or UAV systems. Overlapped images can be used to show flight paths and to assess bird presence and behaviour. However, species identification may be unclear with thermal imaging alone. Detection ranges span from hundreds of metres to kilometres, varying by species, conditions, and terrain, with spatial resolution diminishing over distance.
Thermal cameras are being utilized for bird monitoring, including density and behaviour analysis, and in industry to assess interactions
with artificial light and wind turbines. In offshore settings, particularly for observing birds and bats near turbines, they complement radar, acoustic sensors, and cameras to verify detections.
Acoustic monitoring has been used as a passive monitoring detection technology for various avian species, both terrestrial and marine. Automated Recording Units (ARUs) can be deployed for extended periods of time to collect acoustic data in remote areas and/or areas which cannot be monitored directly by humans at all hours. Limitations of acoustic monitoring include the muffling of bird calls by high levels of background noise (e.g., operations on vessels and infrastructure, wind, and rain) and that some individuals may not vocalize when they pass by ARUs. There may also be detection bias with flight heights or distance of birds away from the ARUs. Low densities of birds within the study area would also require a larger number of ARUs to detect species presence.
Bio-logging, the act of monitoring the behaviour of animals using small recorder devices, such as GPS tags, VHF/radio tags (e.g., the Motus network) or geolocators (GLS), has vast applications for determining the movement behaviour and space use of wild animals. Miniaturized tracking devices have allowed deeper insight on the migratory and foraging behaviour of a vast array of avian species.
GPS tagging work has been conducted on adult Leach’s Storm-Petrels ranging from their colony on Gull Island in Witless Bay, Newfoundland, using miniaturized GPS devices to determine the proximity to oil platforms while individuals are embarking on foraging trips. GPS tracks from this study found that adult Storm-Petrels often transit past oil production platforms on the Grand Banks during the breeding season (e.g., MayAugust), but mainly during daylight hours, and as such, may not be at great risk to becoming light attracted and stranding. However, further
research is required to determine proximity of recently fledged juveniles to oil platforms during the migratory period (i.e., September to October) following dispersal from their colonies, as this age class is most frequently stranded. It should be noted that deployment of GPS/GLS devices on Storm-Petrels can be costly as it requires a large number of individuals to be tagged.
Remote sensing involves gathering information regarding objects at and/or near the Earth’s surface, typically in the form of image data captured at a distance from above (e.g., highresolution satellite data). Remote sensing has been used for various applications in the remote detection of seabirds, either directly or indirectly. A common direct detection use of this technology has been to assess population numbers of seabirds nesting on remote and inaccessible islands. Direct remote sensing has typically been used for detection of larger, more conspicuous seabird species. It is likely that a high enough resolution for detection of small species (i.e., Storm-Petrels and small alcids such as Dovekie and Atlantic Puffins), which may blend in with their environment, cannot be obtained. For example, a pixel size of 0.1 m would be required to detect a bird with a wingspan of 0.5 m, a resolution that is currently only achievable by US military surveillance satellites and is not currently available to the public.
Unmanned aerial vehicles (UAVs) or drones have been increasingly used to monitor seabird populations in the past decade as well as conducting a range of inspection and monitoring activities for oil and gas projects. UAVs commonly used in wildlife monitoring studies can be divided into two different classes, those being fixed-wing UAVs and multi-rotor UAVs. These vehicles may be piloted remotely or autonomously and carry a range of sensors (e.g., cameras, thermalinfrared sensors) depending on the intended use. UAVs may be piloted with a hybrid
approach where the pilot controls take off and landing while the rest of the mission is guided by the autopilot system. UAVs allow for monitoring of seabirds in remote areas and at times when observations by field biologists may be impossible or unsafe to undertake (e.g., harsh terrain, nocturnal observations). There are many potential advantages to using UAVs for seabird monitoring for offshore oil and gas projects including data consistency and quality, improved worker safety, and frequency of inspections. UAVs are currently being used for physical inspection of structures in offshore Eastern Canada. The use of UAVs for monitoring offshore oil and gas structures would be limited by weather conditions (e.g., precipitation, cold temperatures, low visibility from fog, high winds) and helicopter operations. Thermal sensors could operate during the day or night and are not impeded by atmospheric conditions (e.g., fog, haze, smoke); however, UAVs would not necessarily be able to be flown during low-visibility conditions as the pilot would need to retain line of sight with the UAV.
Many detection technologies produce large quantities of data that would be time and personnel intensive to manually analyze. Artificial intelligence can be used in conjunction with other detection technologies to facilitate analysis. For example, the use of neural networks (e.g., a complex mathematical model that assesses data and makes conclusions) can automate detection of birds in images derived from UAV surveys and can dramatically decrease the time needed for analysis, with a similar detection rate as analysis done by manually identifying birds by hand/eye. The primary limitation is that large, annotated datasets (for both audio and imagerybased data) of target species would be required to train the AI models in species detection.
Production platforms for oil and gas extraction
must follow health and safety guidelines and practical constraints associated with operation of the platform. Stable production platforms are better for systematic monitoring and collection of data compared to moving vessels. The largest constraint with installing new equipment is meeting Offshore Installations Project Specifications. Electrical equipment would have to carry a certification from an approved certifying body (CSA, cUL, ATEX, IECEx, etc.). Equipment placement is limited by platform design (e.g., exclusion zones where technology could not be deployed), and optimal detection areas may not align with available installation areas. Specific certifications may be required depending on platform zones. Many commercial detection technologies are purpose-built and not necessarily certified by an approved certifying body, limiting their installation locations. Particular zones on platforms require equipment to be explosion proof due to reservoir gas risks, and systems with their own power sources face limitations. In the event of emergency where there is a risk of explosion, there are automatic and manual power shut offs of all electrical devices by zone to minimize any sources of ignition. Any detection technology would need to be subject to the same safety systems. Equipment certifications and requirements are lower for temporary equipment relative to permanent installations while still conforming to hazardous area classifications. Short-term seabird detection programs may therefore be easier for implementation in the near-term rather than a program designed for the life of the production project. Data collected may be stored within the detection technology, on platform storage, or sent back to shore via platform internet or satellite transfer. Platform stored data may need to be manually downloaded by onboard personnel.
Off-platform Installation
Detection systems off-platform (e.g., deployments on moored buoys) are subject to fewer regulatory hurdles relative to installation on board platforms. Existing
production platforms and exploration drilling programs are required to do wave and current monitoring that are typically conducted with custom designed metocean mooring systems. Exploration drilling programs have also used moorings equipped with hydrophones for underwater sound monitoring programs and telemetry devices for tracking tagged salmon. Moorings would need to comply with health and safety mitigations and exclusion zones associated with the specific project. Exploration drilling programs have less subsea infrastructure than production platforms and, therefore, monitoring moorings can be placed hundreds of metres to kilometres away from the drilling installation. For production platforms and FPSOs that have relatively higher ship activity and subsea infrastructure, metocean moorings are typically placed a minimum of two to three kilometres away. It is likely for any offshore program that there would be exclusion zones for moorings to minimize interactions with infrastructure and ships. As the mooring is a stand-alone system, there is always a risk of loss from interaction with vessels or the environment.
Monitoring moorings would need to be designed for the specific environment where depth and oceanographic conditions are considered. The size of monitoring equipment, power requirements (e.g., battery size), and methodology for data storage and potential satellite-linked data upload would dictate the size of buoy(s), floatation, anchor size, and maintenance interval needed. Moorings are subject to horizontal movement from currents, waves, and wind, and may regularly change orientation. Therefore, the system may require gyro-positioning and geopositioning equipment to maintain stability and directionality of detection equipment.
Installation of detection technology on ships would need to consider engineering and company requirements. Supply vessels are typically third-party subcontractors, with multiple companies involved. Depending on
the nature of the detection technology and required field of view, there may need to be multiple points of installation. For example, multiple cameras that face outward may be needed considering the vessel can frequently change orientation. Like platforms, supply vessels also have radars and exclusion zones for installing additional equipment that must be considered during the design phase.
All of the detection technologies described above are available commercially for quantifying the seabird interactions with offshore oil and gas projects and activities in Eastern Canada. Each detection technology has limitations for use that are minimized when combining systems and merits for different detection scenarios. For this region a combination of thermal and video camera systems with bird surveillance radar would likely be the most successful at the identification of species and assessment of seabird interactions with infrastructure. This combination of technologies would also be appropriate for monitoring Leach’s StormPetrels at night. Machine learning will likely be needed to improve the speed at which the vast amount of data collected by these detection technologies are processed. To further assess the effectiveness of these technologies for offshore oil and gas, seabird detection programs should be validated with seabird monitoring by human observers. Due to the variety of logistical constraints and challenging offshore conditions, it is likely that these detection technologies will be used to augment existing seabird observation programs rather than replace human observers. u
Study of seabird attraction to the Hebron Production Platform: a proposed study approach, Project No. SA1190. Report prepared by LGL Environmental Research Associates for ExxonMobil Canada Properties.
Gjerdrum, C.; Ronconi, R.A.; Turner, K.L.; Hamer, T.E. [2021]. Bird strandings and bright lights at coastal and offshore industrial sites in Atlantic Canada. ACE 16, art22. https://doi.org/10.5751/ACE-01860-160122.
Montevecchi, W.A.; d’Entremont, K.J.N.; Henry, S.; Aikens, M.; McFarlane-Tranquilla, L.; So, J.J. [2024] Seabird attraction to anthropogenic light with special emphasis on offshore platforms, vessels, and Leach’s Storm-Petrels. Environmental Studies Research Fund Report No. 2021-02S. Ronconi, R.A.; Allard, K.A.; Taylor, P.D. [2015]. Bird interactions with offshore oil and gas platforms: review of impacts and monitoring techniques. Journal of Environmental Management 147, 34-45.

Justin So is a marine biologist with WSP Canada Inc. involved in evaluating the environmental impacts of natural resource and infrastructure projects on marine ecosystems. He specializes in underwater video surveys, benthic ecology, and marine characterization. His work is mainly in environmental assessments and environmental effects monitoring for the oil and gas, energy, mining, and tourism industries.
Kyle d’Entremont is an ornithologist at WSP Canada Inc. with six-plus years of experience working with various seabird species of the Northwest Atlantic, including the Northern Gannet, Common Murre, Black-legged Kittiwake, Atlantic Puffin, and Leach’s Storm-Petrel, among others. He holds a master of science in cognitive and behavioural ecology from Memorial University of Newfoundland and Labrador. He specializes in the movement ecology, foraging behaviour, and breeding biology of seabirds.
Andrew Peddle is a Newfoundlandregistered professional instrumentation technologist with WSP Canada Inc. with a specialization in atmospheric and marine sensing instrumentation. He is actively involved in the design, installation, and maintenance of meteorological and oceanographic systems. He has led and supervised numerous projects deploying oceanographic monitoring equipment across the Grand Banks, Orphan Basin, the Strait of Belle Isle, and various coastal locations in Newfoundland.

Autonomous, Fixed-focus, High-resolution Deep-sea Camera Systems
Aaron Steiner, Mark Olsson, Stacey Church, Eli Perrone, Jon Clouter, Daniel Fornari, Victoria Preston, and Mae Lubetkin
Implementing Underwater Image Enhancement Algorithms on Resource Constrained Devices
Arun M., Visvaja K., and Vidhya A.
Role of Onshore Operation Centre and Operator in Remote Controlled Autonomous Vessels Operation
Muhammad Adnan, Yufei Wang, and Lokukaluge Prasad Perera


Marine scientists and engineers who use imaging as part of their oceanographic data collection process will benefit from reading this paper. Those interested in deep-sea imaging and its applications in oceanographic field studies will also find it of value. Subsea imaging has been used to document the deep ocean since the early 1950s, and today represents a key method for conducting oceanographic research. The camera system described in this paper not only provides high-resolution imaging at depth, but is fully autonomous and selfcontained, permitting its use across a range of deep-sea vehicles and platforms for oceanographic studies. The camera’s optics have been designed to correct for image distortion typically encountered with dome port optics, permitting a wide field of view with minimal vignetting, enabling researchers to visually document and inspect the seafloor and water column with minimal intervention.
The camera system described here was developed over many years as a collaborative effort between DeepSea Power & Light, Woods Hole Oceanographic Institution’s MISO Facility, EP Oceanographic and Ocean Imaging Systems, and Back-Bone Gear. The camera uses a unique optical design consisting of two lens elements and a high pressure-corrected dome port, which are specially configured to correct for distortion while enabling operations to depths of 6,500 m and 11,000 m. The camera’s self-contained power provides >24 hours of operation for still imaging at fast repetition rates or ~18 hours for 4K or 5.3K video for continuous monitoring of deep ocean life and processes. The result is an innovative, versatile camera system that has been used on numerous research expeditions.
High-resolution imaging is a critical component of many oceanographic research initiatives happening today. Imagery captured by the camera system described in this paper has contributed to dozens of peer-reviewed publications and is a key component of ongoing oceanographic research. Furthermore, photos and videos of the deep sea engage and educate students and the public about its mysteries, fostering dialog about the ocean’s importance and spurring informed decision-making.
The system is currently available and in routine use on WHOI’s National Deep Submergence Facility vehicles: HOV Alvin, ROV Jason, and AUV Sentry. It has also been used extensively on multicorers and box corers and towed camera systems. Requests for information should be directed to D.J. Fornari at WHOI (dfornari@whoi.edu).
Aaron Steiner is an electrical engineer by training and currently serves as the director of engineering and general manager of oceanographic products at DeepSea. Since joining DeepSea in 2010, he has developed many technologies and products focused on deep-sea imaging from LED lighting to 4K cinematographic cameras that can reach the deepest points in the world’s ocean.
Mark Olsson is the founder and CEO of SeeScan, Inc., of which DeepSea is a business division representing its oceanographic product segment. In 1983, after the successful development of a pressure-compensated deep-sea battery, he founded DeepSea Power & Light to engineer and manufacture products that serve the subsea industry. Since then, he has designed numerous deepocean optical and lighting solutions that are used across the globe in subsea research and exploration.
Stacey Church is the communications manager at SeeScan, Inc., an original equipment manufacturer of plumbing diagnostic, electromagnetic utility location, and DeepSea oceanographic products. She joined the SeeScan/ DeepSea team in 2015 as a technical writer, with a focus on creating product documentation for end users. Since then, she has authored and contributed to several articles for various industry publications on innovative technologies.
Eli Perrone was raised in West Virginia and graduated from Cornell University with a BS in science of Earth systems, with a concentration in ocean science. He spent a decade working in the commercial oceanographic survey and autonomous underwater vehicle industries before starting EP Oceanographic LLC, based in Pocasset, MA, in 2014. He focuses on the Ocean Imaging Systems underwater imaging and lighting product lines, among other pursuits.
Jon Clouter was born in Newfoundland and is a graduate of Memorial University (BFA). He has years of experience in specialized photography and 3D imaging for the visual effects industry. He is co-founder and vice president of the camera company Back-Bone in Ottawa, Canada.
Dr. Dan Fornari is a marine geologist and an emeritus research scholar in the Geology and Geophysics Department at the Woods Hole Oceanographic Institution (WHOI), and co-manager of the MISO (Multidisciplinary Instrumentation in Support of Oceanography) Facility at WHOI that specializes in development and operation of deep-sea imaging and sampling systems. His research for the past ~50 years has focused on seafloor volcanic and hydrothermal processes at mid-ocean ridges, seamounts and oceanic islands, high-resolution mapping, and sampling. He has participated in and led more than 150 research expeditions, and much of his field research has involved diving in research submersibles such as Alvin
Dr. Victoria Preston is a field roboticist and assistant professor of engineering at Olin College in Needham, Massachusetts. She holds a BS degree in engineering from Olin College, and SM and PhD degrees in autonomous systems from the Massachusetts Institute of Technology and Woods Hole Oceanographic Institution Joint Program. Her research, at the intersection of autonomy and spatiotemporal modelling in marine environments, focuses on developing robots as perceptive intelligent partners for performing scientific ocean exploration.
Mae Lubetkin is an independent researcher with expertise in marine geosciences, subsea imaging, and critical media studies.

Aaron Steiner1, Mark Olsson1, Stacey Church1, Eli Perrone2, Jon Clouter3, Daniel Fornari4, Victoria Preston5, and Mae Lubetkin6
1DeepSea Power & Light, San Diego, CA, USA
2EP Oceanographic, LLC and Ocean Imaging Systems, Pocasset, MA, USA
3Back-Bone Gear Inc., Kanata, Ontario, Canada
4Woods Hole Oceanographic Institution, Geology and Geophysics Department and MISO Facility, Woods Hole, MA, USA; dfornari@whoi.edu
5Northeastern University, Department of Electrical and Computer Engineering, Boston, MA USA
6Independent researcher, Paris, France
ABSTRACT
The development and design of versatile, autonomous, fixed-focused deep-sea cameras capable of operation to depths of 6,000 m and 11,000 m, that have been deployed on numerous research submersibles and deep-sea platforms since 2016, is presented. The optical assembly of the cameras consists of two lens elements and a high pressure-corrected dome port, optimized to correct for image distortion, produce minimal vignetting, and yield a depth of field which extends from ~0.5 m to infinity within the subsea environment. Three configurations of deep-sea housing are integrated with these optics, such that the internal chassis designs permit GoPro HERO4™ and HERO11™ camera modules to be axially aligned with the corrector and dome optics. The GoPro cameras are fitted with a 5.4 mm non-distortion lens and 1TB microSD memory cards; and are connected to a high-capacity USB-C battery or custom Li-battery pack to provide selfcontained power. The supplemental power and recording media storage permit operations for >24 hours for 27MP still imaging at a high (~5 second) repetition rate, or ~18 hours for 4K or 5.3K cinematic video acquisition at 30 fps. The self-contained power and autonomous design of these cameras allow a wide range of installation options for deep-sea vehicles, towed systems, and seafloor sampling devices to document oceanographic processes. In addition to their use for highresolution documentation of Earth-ocean phenomena and life, they have been used in numerous outreach efforts to educate and engage students and the public about the importance of continued exploration and study of “inner space” – the global ocean and seafloor.
Keywords: Deep-sea cameras; Fixed-focus; Deep-submergence research; Versatility in subsea imaging systems; Subsea depth of field
The first underwater camera was developed by British engineer William Thompson in the mid-1800s, and the first underwater filming was accomplished in 1896 by French biologist Louis Boutan. In the early 1950s, Harold Edgerton, an engineering professor at MIT, developed the first deep-sea strobe light, providing triggered, high-intensity lighting required to take photographs of the deep ocean and seafloor for the first time [1]. That development led to the first generation of deepsea cameras through the engineering efforts of Maurice “Doc” Ewing and Lamar Worzel at the Lamont Geological Observatory as well as J. Brackett Hersey, Allyn Vine, and David Owen at Woods Hole Oceanographic Institution (WHOI) [2], [3]. Those early deep-sea camera systems were rudimentary but provided key photographic evidence of animals and seafloor features over small areas in the deep ocean. This imagery significantly expanded the knowledge of features, processes, and causal links between geological, biological, and chemical phenomena on the seafloor (e.g., see discussion and references in [4]). Early deepsea camera systems were also crucial for deepsea search and/or recovery missions associated with strategic operations.
From the 1960s to the 1980s, marine geological, chemical, and especially biological investigations of deep-ocean terrains relied heavily on traditional optical cameras and deepsea strobe lighting to photograph the abyssal seafloor, providing some of the first visual documentation of the abundance and diversity
of life in the deep ocean, morphology and geology of volcanic terrains on the mid-ocean ridge crest, and evidence for hydrothermal venting [5], [6], [7], [8], [9]. Bruce Heezen and Charles Hollister, in their seminal 1971 book The Face of the Deep [5], provided the first grand compilation of deep-sea imaging taken with the newly developed underwater cameras and strobes, and discussed the scientific implications and insights that those images provided (see also Discovering the Deep [4] for an updated compilation of deepsea imagery focusing on seafloor geology and hydrothermal features). During the latter part of the 20th century, subsea imaging also played a prominent role in resource development with the advent of offshore oil and gas drilling that involve seafloor completions and pipelines, all of which required visual inspections and monitoring of the production equipment to prevent and identify potential pollution from the offshore resource extraction, transmission, and delivery processes. Today, direct visual observations of the ocean floor enabled by deep-water to full-ocean depth-capable camera systems are intimately tied to understanding the dynamic and interactive physical, chemical, and biological processes occurring there. Photographic documentation of those phenomena is crucial to quantifying those processes and understanding their impacts. Today, documentation of this type plays a key role in developing environmental guidelines and mitigating impacts from 21st century energy resource projects such as offshore wind farms.
Equally important to the development of deepsea camera systems in the late 20th century were improvements to the quality and capacity of lighting for seafloor imaging.
Prior to the 1980s, light attenuation in water of available lighting sources generally limited deep-ocean photography to objects less than 20 m from the camera, creating a significant roadblock to large-area imaging of the seafloor [10]. In the 1980s and 1990s, new towed cameras with higher capacity strobe lighting and large film magazines were deployed for both basic seafloor geological and biological mapping along the mid-ocean ridge crest and other terrains, as well as for archaeological and search missions, such as the mission that discovered the wreck of the RMS Titanic [11]. These systems (e.g., ANGUS and ARGO operated by WHOI’s Deep Submergence Laboratory [12], and the DeepTow system developed by Fred Spiess and colleagues at the Scripps Institution of Oceanography’s Marine Physical Laboratory [6]) relied on electronic controls to trigger the cameras and strobes at specific intervals and also provided acoustic telemetry to transmit basic information such as bottom water temperature, depth, and altitude along the survey track.
The next generation of deep-sea cameras began to be developed in the mid-1990s as professional and consumer digital cameras became available, and the size of digital electronics and controls were miniaturized. The development of high-precision optics that could be manufactured to withstand the extreme pressures at seafloor depths to ~6,000 m and 11,000 m was another key technological leap. Funding agencies and oceanographic facilities of many nations recognized the need for developing functional deep-sea camera systems to further oceanographic research within their territorial waters as well as for broader investigations of global
ocean and seafloor processes. In the US, the Multidisciplinary Instrumentation in Support of Oceanography (MISO) Facility was established at WHOI in the early 2000s with US National Science Foundation (NSF) support to develop and implement a wide range of seafloor and deep-ocean imaging capabilities for ocean scientists to document observations and optimize seafloor sampling [13], [14].
The MISO Facility is the only academic, community-wide-accessible deep-sea imaging facility available to US oceanographers for cost-effective and diverse suites of field investigations requiring deepsea digital imaging capabilities. The primary service function of the MISO Facility (www. whoi.edu/miso) at WHOI’s Shipboard Scientific Services Group (WHOI-SSSG) is to assist US investigators requiring deep-sea digital imaging and sampling capabilities for seafloor experiments and surveys conducted from research vessels in the US academic research fleet, coordinated through the University-National Oceanographic Laboratories System (UNOLS). For more than two decades, the MISO Facility has been supported by the NSF through fiveyear “Facility” grants as well as research grants from a variety of US federal agencies, US universities, and foreign universities and agencies. MISO focuses on providing excellent, high-resolution oceanographic data sets – primarily deep-sea digital photographic and sampling equipment with real-time imaging capabilities and subsea telemetry for serial data sensors – to a wide spectrum
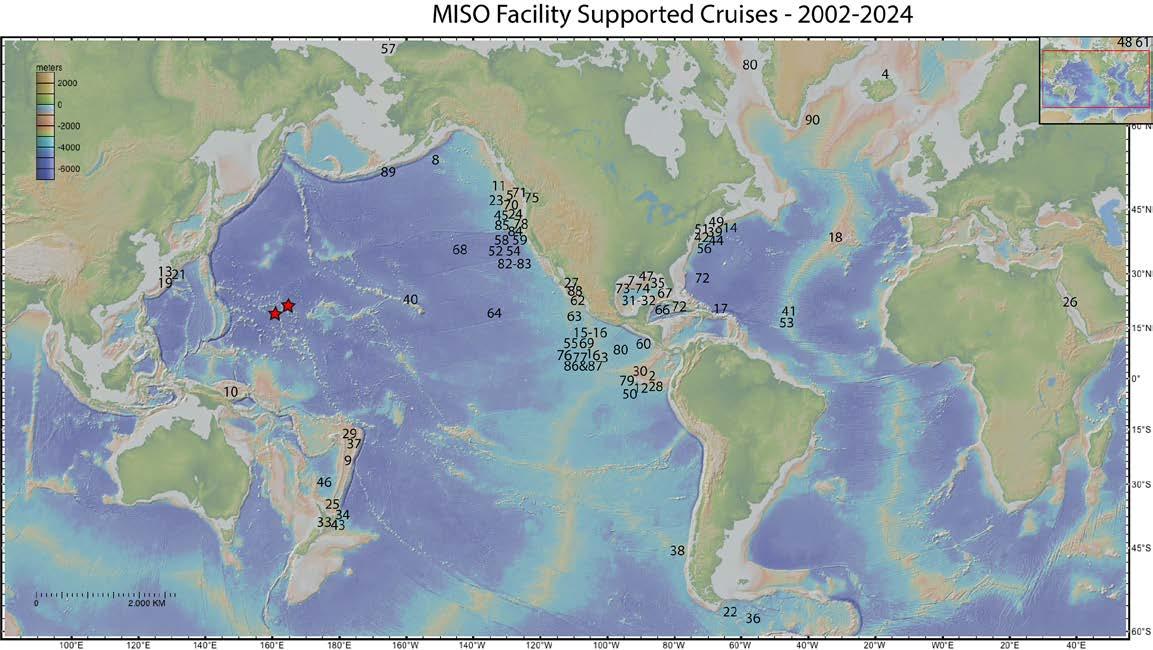
Figure 1: WHOI-MISO Facility instrumentation supported cruises (90) conducted during the period from 2002 to 2024. The cruise ID numbers are keyed to listings detailed in Table 1 that provide general location, ship name, type of deep submergence platform, official cruise ID (when known), and month/year of the expedition. Note that research cruises from approximately 2002 to 2015 utilized the DeepSea Digi SeaCam® housing with Nikon995 internal module providing 3.3MP still images using a 300-600 watt/s strobe triggered by an intervalometer in the camera electronics. Between 2015-2022, the Digi SeaCam housings have been used with a GoPro™ HERO4 internal camera module designed at WHOI-MISO, which provided 10MP still images and up to 4K video imagery at 24 fps. Since 2022, the Digi SeaCam housings have been modified with a new internal chassis to accommodate GoPro™ HERO11 cameras providing the ability to collect 27MP still images and 5.3K cinematic video at 30 fps. Since April 2024, a DeepSea Optim 11K rated housing has been modified to accommodate a HERO11 camera module that was reconfigured by Back-Bone and EP Oceanographic/Ocean Imaging Systems to provide the ability to collect 27MP still images and 5.3K cinematic video at 30 fps to full ocean depth (11,000 m), and for use with the Alvin research submarine to 6,500 m, its maximum operational depth. The two red stars are MISO TowCam surveys in the western Pacific that used deep-towed magnetometers for near-bottom geophysical surveys.
of US and foreign investigators conducting geological, biological, and chemical studies throughout the global ocean. To date, MISO has supported 90 field expeditions focused on deep-sea coral studies, benthic biology traverses and time-lapse experiments, hydrothermal vent research, mid-ocean ridge and seamount volcanism, time-series experiments in various seafloor environments, and studies of gas hydrates and related seep sites in different tectonic settings (Figure 1 and Table 1; and see Supplementary Materials).
In 2018, the MISO Facility was integrated into WHOI-SSSG, and since 2022-2023, that collaboration has expanded to include substantial interaction and joint seagoing
operational efforts with Oregon State University’s (OSU) Marine Rock and Sediment Sampling (MARSSAM) coring and dredging facility (M. Walzack – MARSSAM Manager). From 2022-2023, there were several opportunities for training UNOLS tech pool shipboard technicians, as well as WHOISSSG and OSU-MARSSAM technicians in at-sea operation and maintenance of MISO imaging and data systems. Further, MISO offers important and enabling imaging capabilities to WHOI’s National Deep Submergence Facility (NDSF) vehicles (HOV Alvin, ROV Jason, and AUV Sentry) to improve and expand imaging capabilities for deep submergence science. Additional efforts to expand the reach and application of MISO
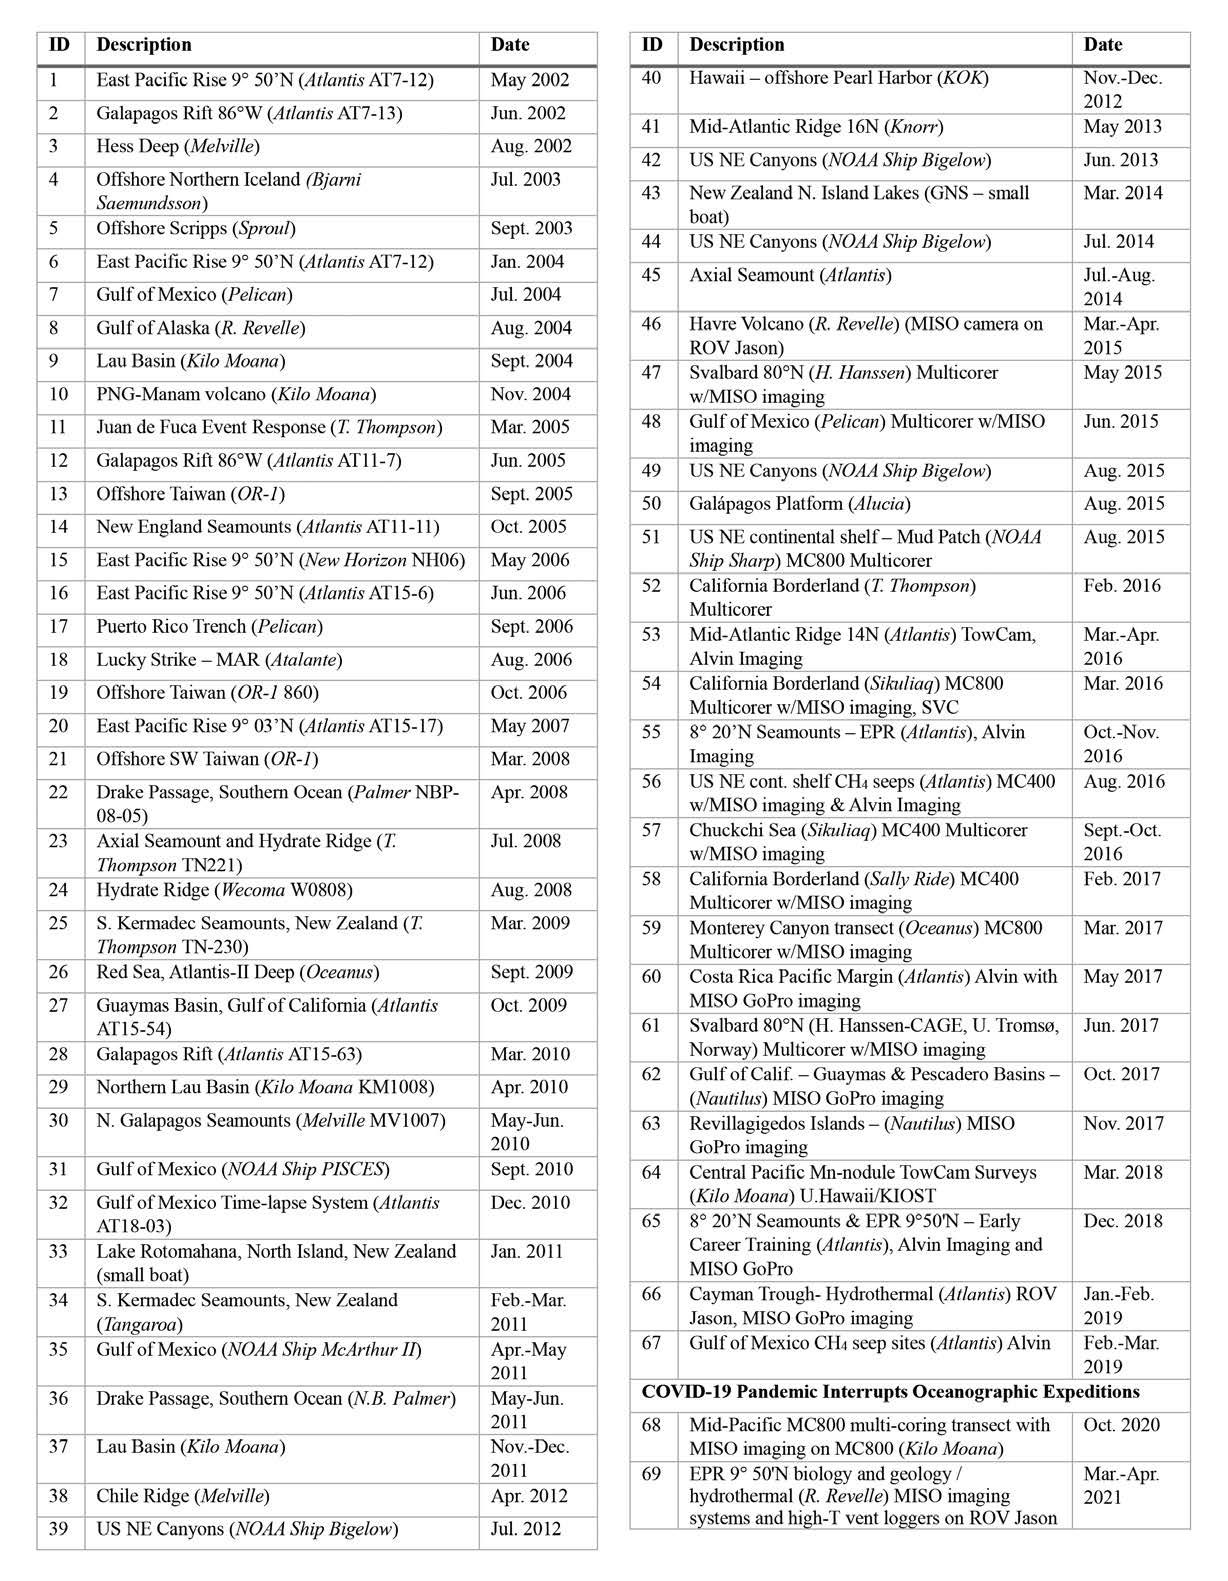
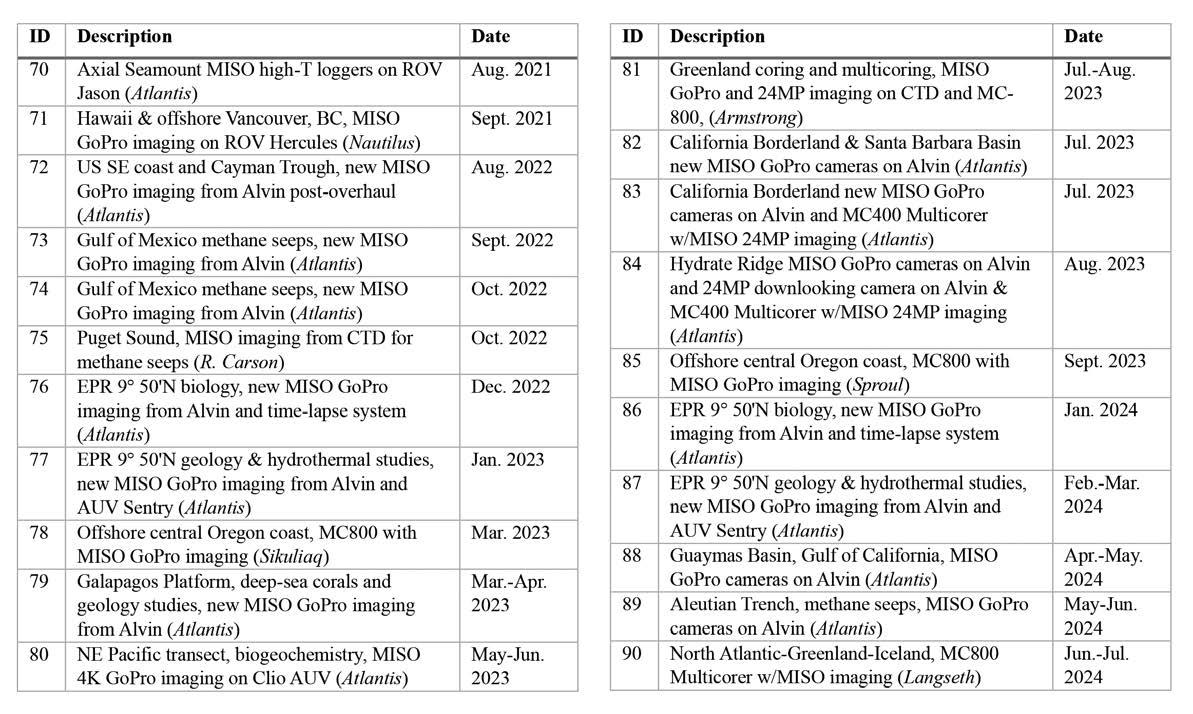
Table 1: Listing of WHOI-MISO Facility Supported Cruises that utilized various deep-sea towed camera (TowCam) and sampling systems, and fixed focus cameras on a wide range of deep submergence vehicles between 2002 and 2024 (90 expeditions total). The cruise ID numbers are keyed to global bathymetry map shown in Figure 1. General location is provided first and then ship name in italics and official cruise ID (when known), and month/year of the expedition. Research cruises from approximately 2002 to 2015 utilized the DSPL Digi SeaCam housing with Nikon995™ internal module providing 3.3MP still images using a 300-600 watt/s strobe triggered by an intervalometer in the camera electronics. Between 2015-2022, the Digi SeaCam housings have been used with a GoPro HERO4™ internal camera module designed at WHOI-MISO, which provided 10MP still images and up to 4K video imagery at 24 fps. Since 2022, the Digi SeaCam housings have been modified with a new internal chassis to accommodate a HERO11™ camera providing the ability to collect 27MP still images and 5.3K cinematic video at 30 fps. Since 2024, a DSPL Optim 11K rated housing has been modified to accommodate a HERO11™ camera module that was reconfigured by Back-Bone and EP Oceanographic/Ocean Imaging Systems to provide the ability to collect 27MP still images and 5.3K cinematic video at 30 fps to full ocean depth (11,000 m), and for use with the Alvin research submarine to 6,500 m, its maximum operational depth. (Note that two cruises, TN272 in 2011 and SKQ2014S2 in 2014-2015, used a MISO TowCam frame and telemetry system to carry out near-bottom magnetics surveys in the far western Pacific between Hawaii and Japan {red star symbols}.)
instrumentation and capabilities to other deep submergence vehicle operators have been ongoing and successful over the past ~five years (e.g., NOAA-Ocean Exploration (NOAA-OE); Ocean Exploration Trust (OET); and Schmidt Ocean Institute (SOI)).
Scientists from the following institutions have used the WHOI MISO Towed Camera System (TowCam) and related MISO deepsea imaging instrumentation over the past two decades (Figure 1 and Figure 2): Penn State U.; U. Washington; U. Hawaii; Georgia Tech.; George Mason U.; W. Washington State U.; Temple U.; Harvard U.; Lehigh U.; U. Bergen, Norway; NOAA; Smithsonian Institution; U. Tromsø, Norway; National Taiwan U.; Oregon State U.; IPGP U. Paris; KAUST; Duke U.; Navy Research Lab.; SIO; GNS New Zealand; U. New Hampshire; U. Rhode Island; UCSanta Cruz; USGS; Stanford U.; Cal. Tech.; NOAA-OE; OET; and WHOI. Funding for these activities is provided by US federal agency grants, WHOI internal grants, and occasionally foreign research institutions and funding agencies to support science activities, technology development, and shipboard technical support.
In collaboration with DeepSea Power & Light (DeepSea) (San Diego, CA), EP Oceanographic and Ocean Imaging Systems (EPO and OIS) (Pocassett, MA), and Back-Bone Canada, the MISO Facility has developed an excellent suite of autonomous, fixed focus, very high-resolution deep-sea cameras (6,000 m to 11,000 m rated) that can
take >24 hrs. of 10-27MP digital still images or ~18 hrs. of 4K or 5.3K cinematic video (Figure 3). The MISO GoPro™ camera can be used on a wide range of deep-sea vehicles and sampling systems, providing an important capability to simultaneously document water column measurements, seafloor samples, and seafloor observations. The following section describes the various generations of MISO deep-sea camera systems and the ongoing collaborative efforts to produce the autonomous, high-quality system in use today.
The current iteration of the MISO deep-sea camera was developed over the past ~10 years using ~20-year-old DeepSea Digi SeaCam® camera housings originally developed to support the original MISO TowCam system. The TowCam system has provided both imaging and sampling capabilities across many seafloor environments since the early 2000s (Figure 2, Table 1) [13]. Today, the TowCam system primarily uses a higher resolution OIS digital still camera, which replaced the Digi SeaCam housings and the cameras they contained (3.3MP Nikon Coolpix imaging modules) in ~2012. The TowCam system continues to provide high-resolution (24MP) seafloor imaging using lighting provided by 300 or 600 watt/sec strobes synchronized to the camera’s shutter.
In 2015, the WHOI-MISO team used off-theshelf GoPro HERO4™ consumer cameras, with a special 5.4 mm non-distortion lens and a newly designed internal chassis that fit the older Digi SeaCam housings, including a USB-C battery pack for supplemental power, to implement a new, self-contained/autonomous deep-sea camera that could be used on a wide
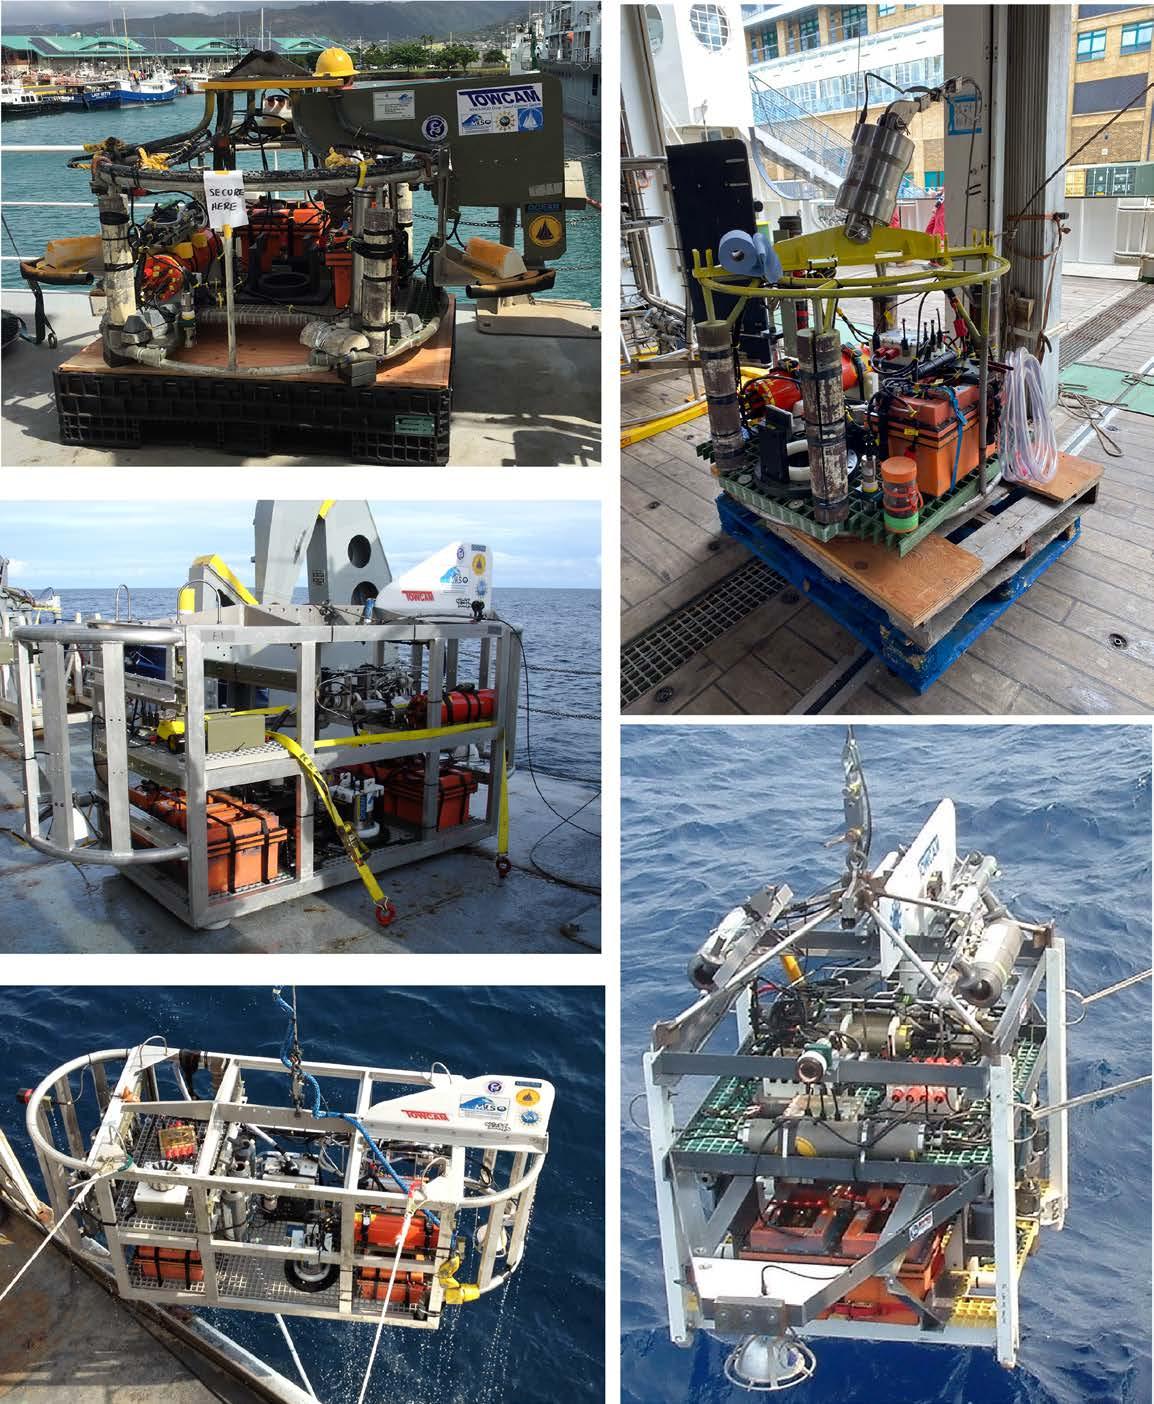
Figure 2: Examples of various configurations of the WHOI-MISO TowCam system capable of deep-sea imaging and sampling to 6,000 m depth (see Figure 1 and Table 1; http://www.whoi.edu/miso). TowCam comprises an internally recording digital deep-sea camera system (24-megapixel Ocean Imaging Systems (OIS) cameras synched to high-intensity strobes (300 or 600 watt/s). When required TowCam can trigger 5 litre Niskin bottles in conjunction with CTD water properties data. The TowCam is towed at ~1/4-1/2 knots on a standard UNOLS 0.322” coaxial CTD sea cable or coaxial cable, often with a USBL beacon to provide accurate subsea navigation, while taking photographs every ~5-10 sec. Real-time acquisition of digital depth and altitude data at 1 Hz is made possible using a Valeport 500P altimeter/depth sensor. Those data are used to help “fly” the camera using winch pay-out at ~4-5 m altitude during the tow and quantify objects in the digital images and make near-bottom profiles. Obstacle avoidance is done using a forward-looking altimeter. Two high-intensity green lasers are used to provide scale (20 cm) within the image area to help quantify the size of seafloor features. A high-speed “Data Link” system permits real-time transmission of the low-resolution video grabs from the camera display up the CTD cable to allow real-time observations of the seafloor during each bottom traverse and to help guide imaging and sampling. Full resolution images are downloaded from the camera after each dive and provided to the science team. All system components operate at 24 VDC, with power supplied by two DeepSea SeaBatteries rated at ~40 amp/hr.
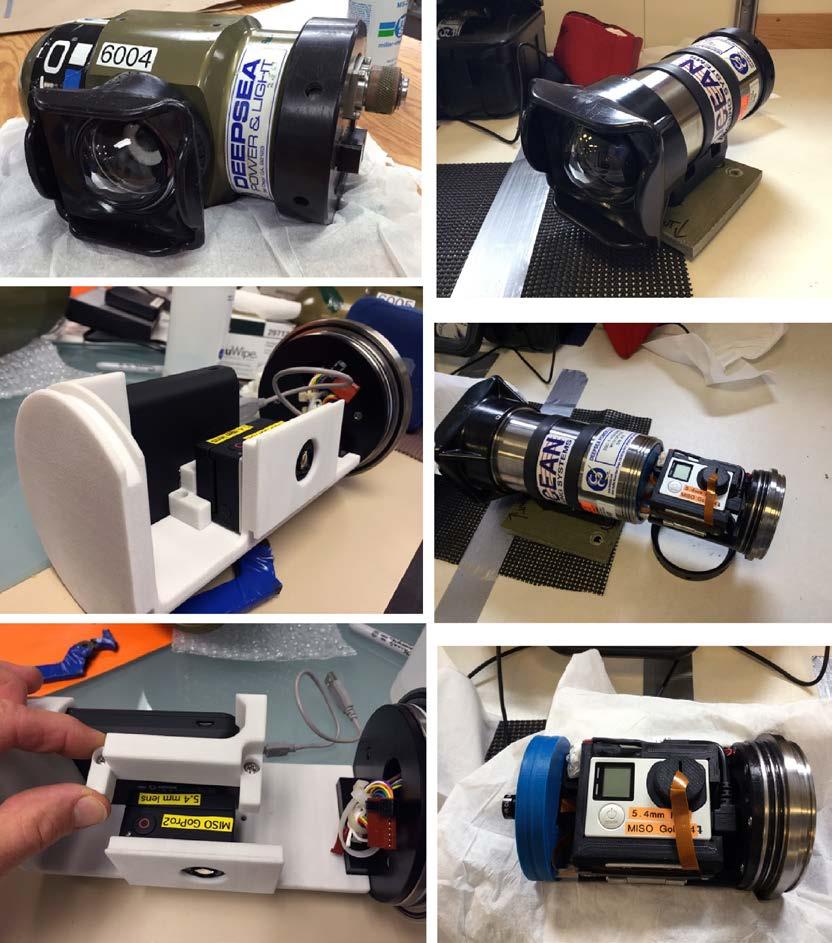
range of deep-sea vehicles and sampling systems to document observations, samples, and vehicle operations when used on MISO designed imaging seafloor landers. Since 2015, these MISO GoPro deep-sea cameras have provided superb imaging capabilities on 30 research cruises using deep-submergence vehicles, TowCam, box corers and multicorers, and seafloor landers (Figure 3).
In 2018, because of the advanced age and limited availability of only three of the original MISO Digi SeaCam housings manufactured in 2002, three new DeepSea Super SeaCam housings, made out of Titanium (Ti), were purchased with National Science Foundation – Ocean Instrumentation Program funding. A
collaboration between MISO and OIS led to the design and successful use of the new Super SeaCam housings with HERO4™ cameras as a “2nd generation” MISO GoPro deep-sea camera system. The Super SeaCam housing uses the exact dome and internal corrector optics as the original DeepSea Digi SeaCam housing. However, because of the internal dimensions of the Super SeaCam housing, the HERO4™ camera orientation and lens configuration required a re-design of the internal camera chassis using lens relocation hardware designed by Back-Bone Canada. OIS designed and assembled the internal chassis using HERO4™ cameras with the special 5.4 mm non-distortion lens. OIS also designed and provided an internal Li-ion battery pack
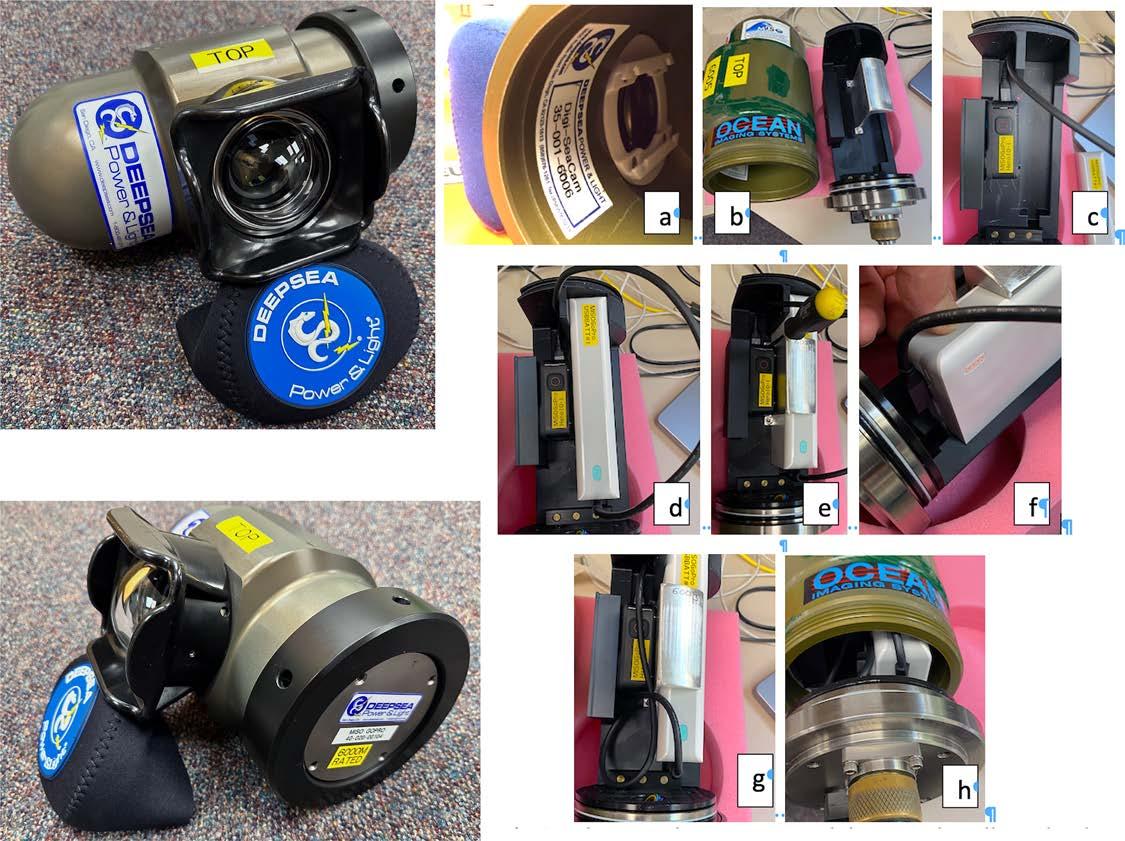
and DC/DC converter to match the HERO4’s power requirement for extended duration image acquisition (Figure 3).
The MISO-OIS GoPro™ 2nd generation deepsea cameras in the MISO Facility continue to be used for a wide range of seafloor imaging and are requested routinely by many investigators; however, the HERO4™ cameras are no longer manufactured or supported by GoPro™, and the lens conversion kits required to support the OISdesign for the GoPro to function in the Super SeaCam housing are also not available. While the MISO facility has several spare internal chassis for this 2nd generation MISO GoPro camera, it was clear that a transition to the newer,
more capable GoPro HERO11™ camera modules was needed. This upgrade in camera capabilities would continue to provide autonomous, self-contained high-resolution imaging capacity for the broad spectrum of seafloor sampling and documentation of observations required when using NDSF and other deep-submergence vehicles as well as to provide correlative seafloor images during bottom sampling using box corers and multicorers.
The 3rd generation MISO GoPro™ deepsea cameras that utilize GoPro HERO11™ camera modules have now been used continuously on >80 Alvin dives since August 2022 (Figure 4). These cameras provide
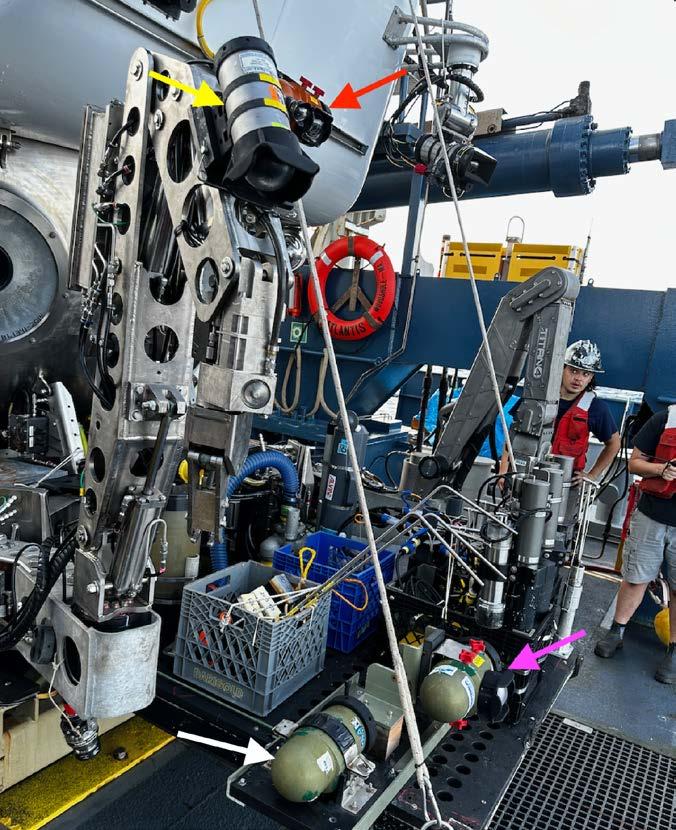
A C B
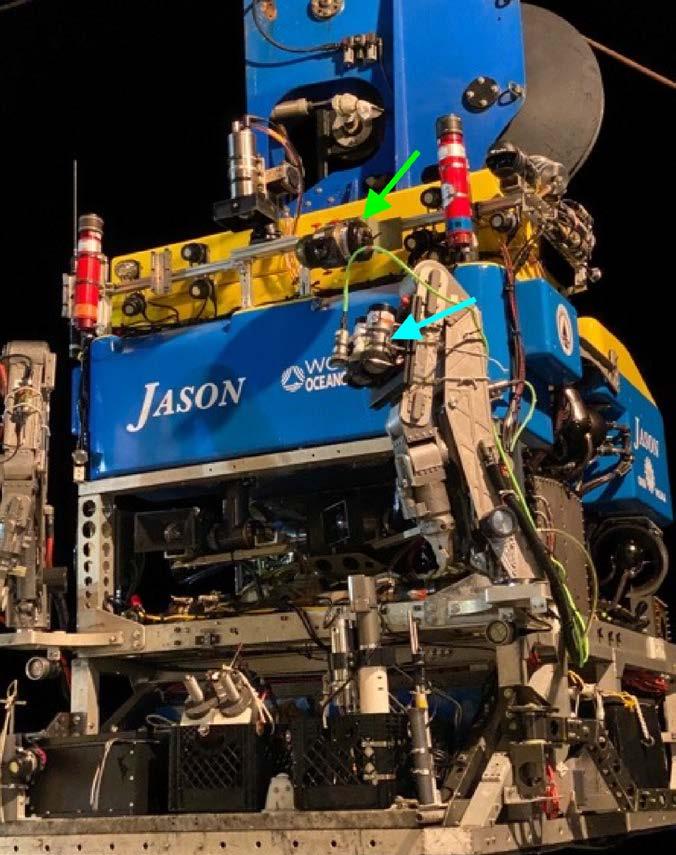
D. FORNARI, WHOI
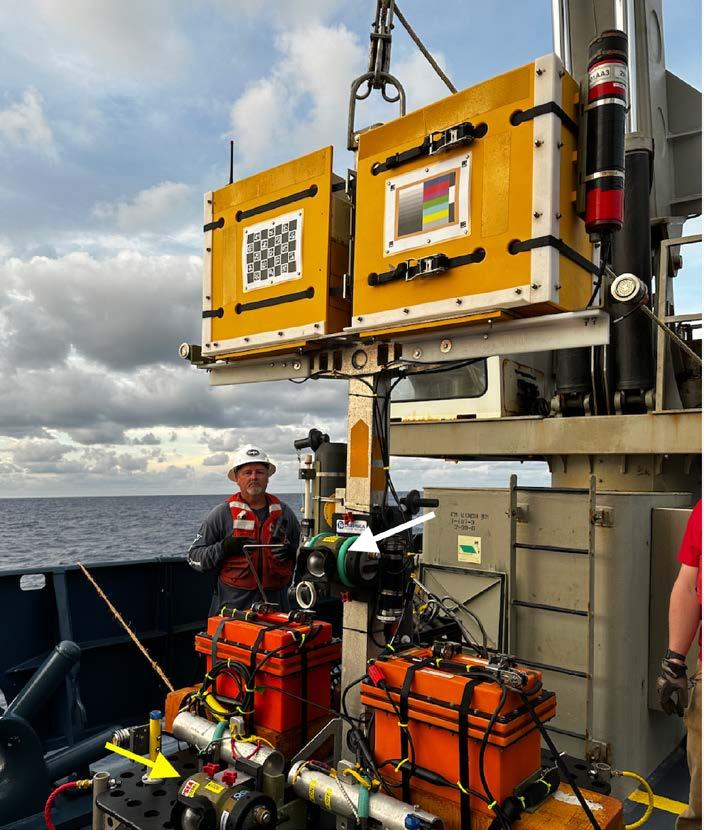
Figure 5: MISO GoPro deep-sea camera systems on Alvin (A), a MISO/ NDSF imaging lander (B), and ROV Jason (C). (A) shows four MISO GoPro cameras in various mounting positions. Red arrow shows Digi SeaCam with a HERO11™ camera module shooting 27MP still images every 5 sec for the duration of the dive’s ~8-10 hrs. total operational time – deck to deck. Yellow arrow points to a MISO-OIS Super SeaCam camera with a HERO4™ camera shooting 4K video at 24 fps for the entire dive duration. White arrow shows a Digi SeaCam with a HERO11™ camera module shooting 5.3K cinematic video at 30 fps shooting vertically down from the front of Alvin’s sample basket. Lighting for this camera is provided by three DeepSea LED SeaLite (~9,000 lumens each) lights positioned behind and across from the camera mount position. Purple arrow shows a HERO11™ camera module shooting 5.3K cinematic video at 30 fps oriented to capture the terrain from a low, forward position as the submersible traverses the seafloor. Lighting for all forward-pointing cameras on Alvin is provided by 8-10 DeepSea LED lights. (B) shows the MISO/NDSF imaging lander as configured on an expedition in February 2024 (AT50-21) to the East Pacific Rise near 9° 50'N. Yellow arrow points to a MISO GoPro™ Digi SeaCam housing with a HERO11 module shooting 5.3K cinematic video at 30 fps, capturing vehicle operations. White arrow points to a MISO GoPro™ Digi SeaCam housing with a HERO11™ module shooting 27MP still images every 5 sec. Power for the lighting system consists of two 24 VDC DeepSea SeaBattery® power modules (orange housings) each with ~40 amp-hour capacity coupled to MISO deep-sea switches (silver cylinders above yellow arrow) that controls four DeepSea LED lights. Each switch is activated by Alvin’s manipulator when it moves a slide fixture with a magnetic reed switch. (C) shows the front of ROV Jason with two MISO-OIS Super SeaCam GoPro cameras mounted on the port manipulator (blue arrow) and a MISO Digi SeaCam GoPro camera for 27MP still imaging on the upper port light-bar of the vehicle (green arrow).
the best still images (27MP) of the work area in front of Alvin at sites in the Gulf of Mexico, Blake Outer Ridge, East Pacific Rise 9° 50'N, and Guaymas Basin, Gulf of California expeditions (AT50-04, AT50-05, AT50-06, and AT50-07, AT50-20, AT50-21, AT50-22), as well as 5.3K cinematic video imagery in various forward and down-looking orientations on Alvin’s front basket (Figure 5). It is important to note that these cameras require no tasking from observers or pilots during dives; they are set to record 27MP images every 5 sec, or continuous 5.3K cinematic video at 30 fps, and use Alvin’s LED lighting from DeepSea for illumination. The cameras have also been used to provide exceptional video and still imagery of Alvin and ROV Jason working at the seafloor study sites using the MISO GoPro™ camera systems on deep-sea landers positioned by the submersibles at several study areas (Figure 5).
During 2023-2024, DeepSea produced ten additional Digi SeaCam housings in an upgrade effort funded by NSF and DeepSea so that the MISO Facility can continue to support NSF-funded oceanographic research and provide deep-sea cameras to other deep submergence facility operators, both in the US and internationally (Figure 4).
MISO GoPro™ CAMERA SYSTEM COMPONENTS
The underwater optical design used in the MISO GoPro deep-sea camera systems has a long history at DeepSea. Its development started in the late 1990s in an effort to improve
the underwater imaging performance of an analog zoom camera based on Sony block camera modules from that time. Up to that point, camera optics in DeepSea products, such as those found in the Multi SeaCam 1000, SeaCam 1001, and SeaCam 3400 (all from the early 1990s), either relied on simple flat ports or used dome ports with correctors based on off-the-shelf diopter lenses sometimes paired with wide-angle adapters (Figures 6-7).
Compared to flat ports, dome ports offer significant advantages to an underwater camera designed to operate at the high hydrostatic pressures of deep-sea environments. This is due to the geometry of a dome, which provides more uniform stresses throughout the material under compression. Compression favours materials like glass and sapphire, which have a compressive strength many orders of magnitude higher than their tensile strength. In contrast, flat ports, by their nature, support high tensile stress on the inside surface due to the bending moment imparted on the port by the external pressure and the housing (Figure 6). Additionally, a flat port will introduce spherical distortion, chromatic aberration, and reduce the field of view of the lens system by close to the ratio of the index of refraction from air to water [15]. Much of this can be avoided with a dome port optical system. However, dome ports, too, pose some unique imaging challenges.
When looking through a dome underwater, a camera is presented with a virtual image where the entire field of view is pulled close to the camera. The virtual image is created by the negative meniscus lens formed by the refractive differences in air and water on either side of the dome port. Parallel rays entering the
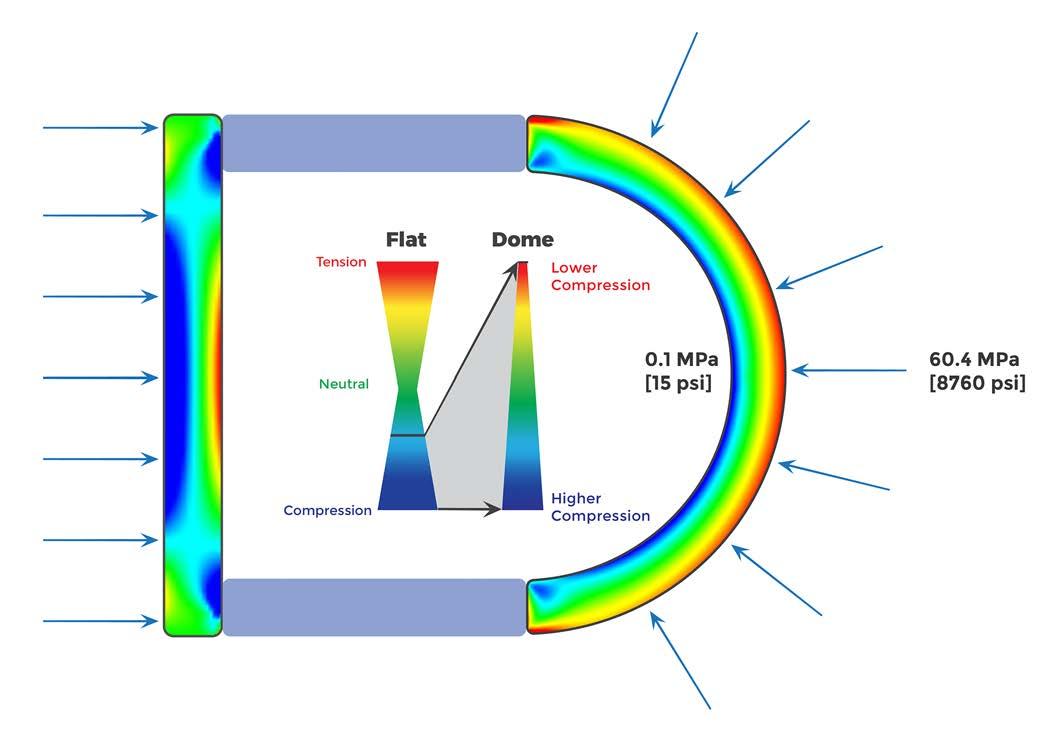
Figure 6: Finite Element Analysis simulation comparing the stress in a flat versus dome port made from borosilicate glass subject to external hydrostatic pressure equivalent to 6,000 m in seawater. Note the different scales where the glass dome is only subjected to compressive stress whereas the flat port has significant tensile stress on the inside surface.
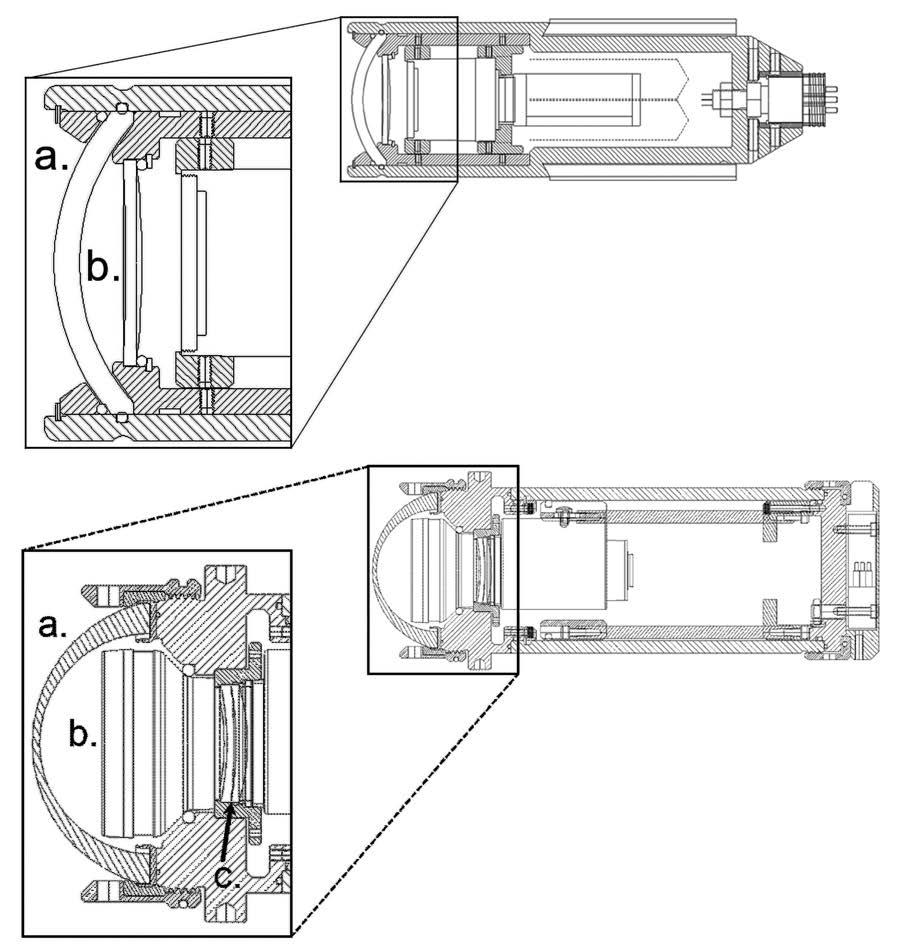
Figure 7a: Cross section of the SeaCam 1001 from the early 1990s showing the dome port (a) and a diopter lens (b) that enabled the camera to focus on the virtual image created by the dome port and flattened the field curvature caused by the dome port. Pairing of the port and corrector lens was an iterative process of trial and error, not based on simulation or modelling.
Figure 7b: Cross section of the SeaCam 3001 detailing the dome port and corrector arrangement. This design used a variable thickness dome (a), effectively a strong meniscus lens, instead of a constant thickness dome. It utilized a commercial off-the-shelf wide field adapter (b) but with a pair of diopters (c) between the adapter and zoom camera lens to correct for the field curvature of the dome and to allow the camera to focus on the close-in virtual image. This combination of port, wide-angle adapter, and diopters were all selected by trial and error without the aid of optical simulation tools.
dome appear to converge from a point much closer than infinity [16]. The consequence is that an object normally in focus at 2 m, 5 m, or 100 m will appear to be at a distance of ~4 times the radius of the dome relative to the dome’s centre of curvature [17]. This can be well inside the minimum focus distance of many lenses designed for use in air, especially so with long telephoto zoom lenses, making it impossible for the camera to focus on the virtual image. The virtual image appears at approximately four times the dome radius if an infinitesimally thin dome is assumed. However, in practice for a dome with realistic thicknesses suitable for withstanding hydrostatic pressures found in the deep sea, this limit is brought in closer than 4 radii. (For a detailed derivation of the calculate of the virtual image distance for underwater domes, see [17].)
Diopters and other close-up lens adapters used in macro-photography work like a magnifying glass, allowing the camera to focus on this virtual image, effectively making the camera near-sighted [15a,b]. By matching the strength of the diopter to the distance of the negative dome-lens of the virtual image from the dome centre, infinity focus can be pushed back out. This is why dome port camera housing manufacturers such as Ikelite recommend a 4+ diopter when paired with a 6”-diameter dome port. The optical magnification of the diopter is close to the inverse of the virtual image location from the centre of curvature of the dome (in metres).
Wide-angle adapters, or focal reducers, shorten the focal length of the lens (a smaller focal length yields a wider field of view), which helps in two main ways:
1. Since the focal length is smaller but the aperture remains the same, the effective focal ratio, or F-number, also decreases. A smaller F-number means the optics gather more light and operate better in lower illumination conditions, which is a universal system design challenge at hadal depths.
2. Wide-angle adapters reduce the spatial resolution of the optics, which can hide chromatic aberration and distortion introduced by the dome port and diopter, effectively compressing them below the resolving power of the imaging system. The apparent size of the imaging artifacts become smaller and harder to resolve in the final image.
Some early DeepSea cameras successfully employed diopters and wide-angle adapters to correct the dome virtual image problem. Using a simple diopter and focal reducer in this way works sufficiently for large-radius optical dome ports where the ratio of the dome radius to the sensor diagonal or film frame diagonal is around 10:1. Small dome-to-sensor ratios are harder to design for when developing an optical dome system for high pressure, deepocean applications. For these uses, thicker glass walls are needed to withstand the external hydrostatic pressures, and the engineering and manufacturing difficulties increase exponentially with the size of the dome port.
Diffraction inside the thicker dome also plays a more significant role in the overall complexity of the optical design, as does proper optical alignment [15a,b] and stray light mitigation. In practice, diopters also introduce chromatic aberration and other forms of optical distortion that reduce image quality, especially at the extreme angles of the field of view.
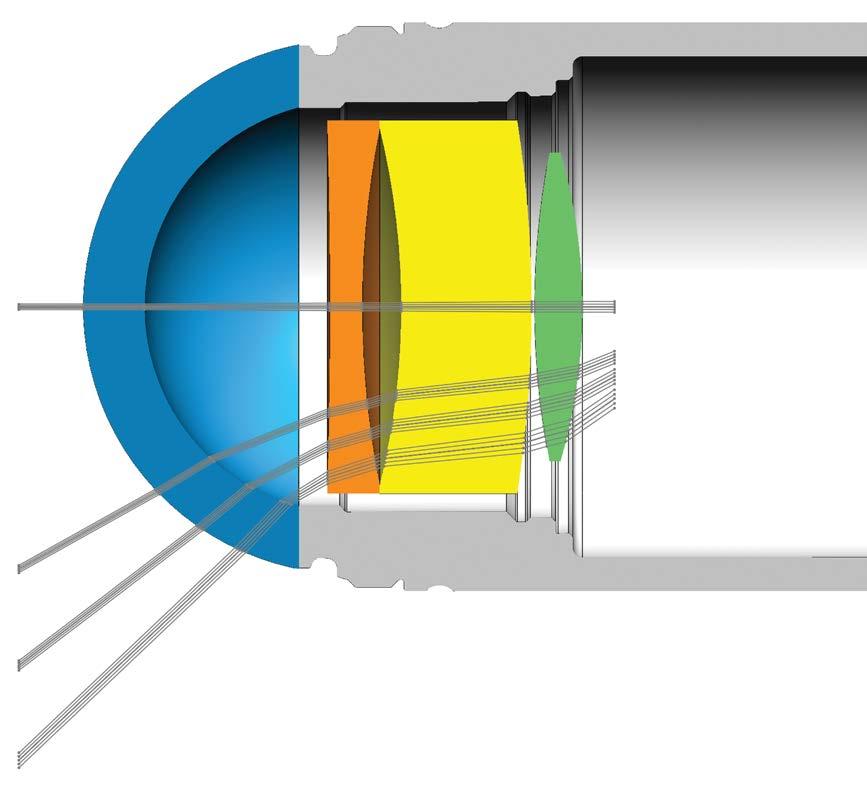
The dome port also introduces distortion into the focal plane on the sensor or film area, often making it difficult to get proper focus across the entire field of view at large apertures. Instead of the sharp focus area of the projected image being uniform across the image area, it is spherical. This increases in severity as the dome radius shrinks, making it an even harder problem on smaller high-pressure domes. Testing and iteration with dome dimensions, diopter strength, and different focal reducers would produce a viable solution in many cases, but not all. Nor could it adequately address the various chromatic and geometric distortion and optical aberrations that degrade imaging performance. DeepSea engineers decided to take a more scientific approach to solving the problem. Designing a custom optical corrector was the key that would enable sharp, fast, and low-distortion imaging across a wide range of focal lengths (Figure 8).
Figure 8: Ray trace diagram showing the refracted light rays through a dome port and the custom lens elements of an example three element corrector design. The rays entering the dome are wider than the rays entering the camera objective that would be located behind the green lens element showing how this grouping provides field widening in addition to correcting for the field curvature and virtual image produced by the dome.
DeepSea engineers compiled data about wide-range varifocal lenses used in the block cameras of interest from published patents [18] and from lab measurements in order to build a digital model of the optical system – a paraxial approximation that preserves the first order relationship between rays entering and exiting a lens. After setting up these models at different focal lengths and different focus positions, the models could be used to simulate the performance of different corrector and dome port designs. Optical design software Zemax OpticStudio served as the design simulation and optimization tool for this task (https://www.ansys.com/ products/optics/ansys-zemax-opticstudio).
A skilled optical designer can use Zemax to find promising local minima throughout the possible configuration space to further develop and optimize. This search is constrained by limiting parameters like the number of optical
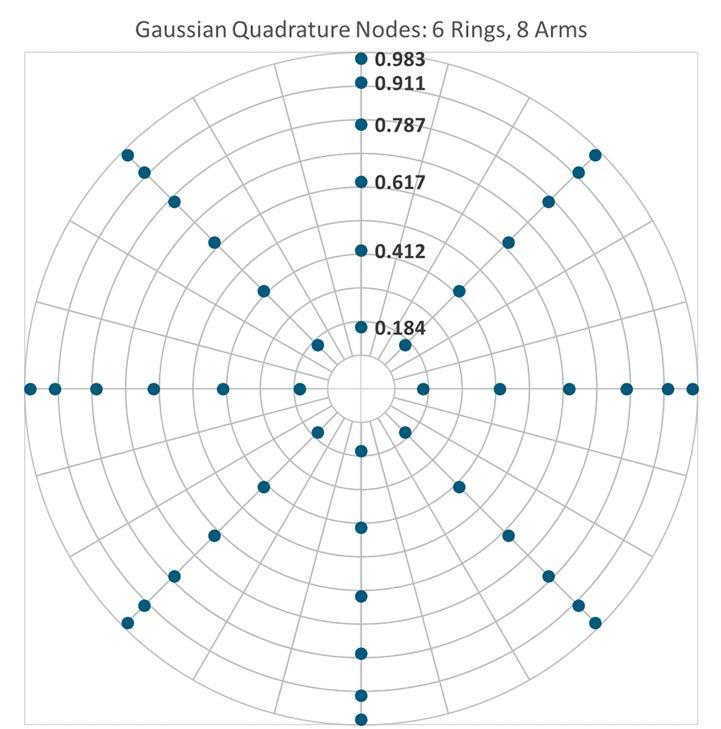
Figure 9 (left): Polar plot showing the distribution of node locations used by the Zemax merit function to evaluate the wavefront error of a simulated optical corrector during optimization. Rays of light at different wavelengths at these nodes are launched through the optics and the resulting projections produce a spot diagram. The Zemax merit function yields a weighted sum of the RMS radii of these projected spots as feedback to the optimizer to minimize the spot sizes across all of the nodes.
Figure 10 (below): Example spot diagram from Zemax showing the spread and shift of three different wavelengths of light launched from simulated point sources into the dome and corrector optics. Each grouping of red, green, and blue points represents the projected image on the camera sensor from a point source at a particular distance from the camera. The shape, size, and distribution of these groupings will show the effects of different kinds of distortion such as astigmatism, coma, chromatic aberration, lateral colour shift, and spherical aberration. In this case the RMS radius of each grouping is less than 3μm, smaller than the pixel size of the imager.
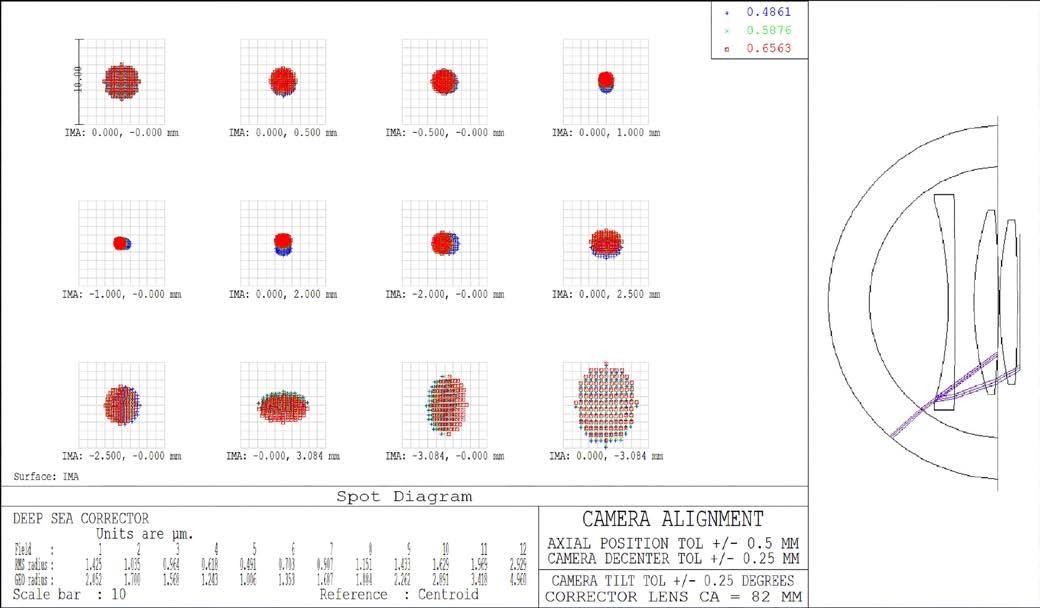
elements, lens sizes, glass types, and the optical bandwidth of the target design.
For this design, the merit function calculated the error between the target performance and a specific design candidate by simulating an array of points of light in the image space and tracing the path they take through the
optics to the exit pupil of the candidate lens design. Zemax uses the Gaussian Quadrature numerical method [19] to integrate the error between the spots formed by these rays and the ideal spot sizes. In Figure 9, an array of nodes at the intersection of six rings and eight arms defined the location of the simulated point sources (Figures 9-10).
For the design of the Super SeaCam corrector used in the Digi SeaCam, the dome size and dimensions were fixed based on the mechanical constraints of designing a dome port to withstand high external hydrostatic pressure. The paraxial approximations of the zoom camera lens at different focal lengths and object distances were all used in parallel to optimize the corrector lens prescription. The role of the optics designer is to use knowledge of lens design and experience to set a starting point for the optimizer to build from. Here a two-element corrector was set as the starting condition. The Zemax optimizer was able to vary the diameter and curvature of the lens surfaces, the types of glass, the air gaps between elements, and the thickness of the lenses and through thousands of iterations arrived at an optimal solution. The result of this effort was a three-element high pressure corrected dome port optic (two lens elements plus the dome), which:
• provided precise magnification matched to the virtual image formed by the dome;
• reduced the focal length to improve sensitivity and widen the field of view;
• flattened the focal plane, in order to produce a sharp image across the imaging area;
• corrected geometric and chromatic aberration introduced by the dome;
• compressed the field of view, making it easier to keep foreground and background objects in focus at the same time; and
• worked across a wide range of imaging lens configurations and focal lengths.
In essence, this solution had all the benefits of the diopter-plus-focal-reducer solution while reducing the optical aberrations created by the
dome instead of amplifying them. The result was a corrector that greatly improved imaging performance across use cases, including in challenging deep-ocean environments.
The DeepSea optical corrector was first introduced in the Super SeaCam in 2000. Soon after, DeepSea worked with the WHOI MISO Facility to adapt the same optical solution to work with a 3.3MP Nikon Coolpix 995 (https:// en.wikipedia.org/wiki/Nikon_Coolpix_995) still image camera, resulting in the unusual side-port configured 6,000 m rated Digi SeaCam (https://www2.whoi.edu/site/miso/ miso-instrumentation/deep-sea-cameras-andstrobes) in 2002. As previously noted, the Digi SeaCam was a key component of the MISO TowCam systems and used for numerous research expeditions providing data for dozens of research publications and student theses (see Figure 1 and Table 1).
DeepSea continues to use this versatile optical corrector solution in the modern Optim® SeaCam 4K subsea camera family, which, with a maximum 11,000 m operating depth, has unrestricted access to all corners of the ocean.
As noted above, in 2014, the GoPro HERO4 Black™ camera was initially chosen as a candidate for upgrading MISO deep-sea imaging capabilities due to the camera’s small form factor, ease of operation, and high-end specifications.
However, integrating the camera into the DeepSea housing required thoughtful
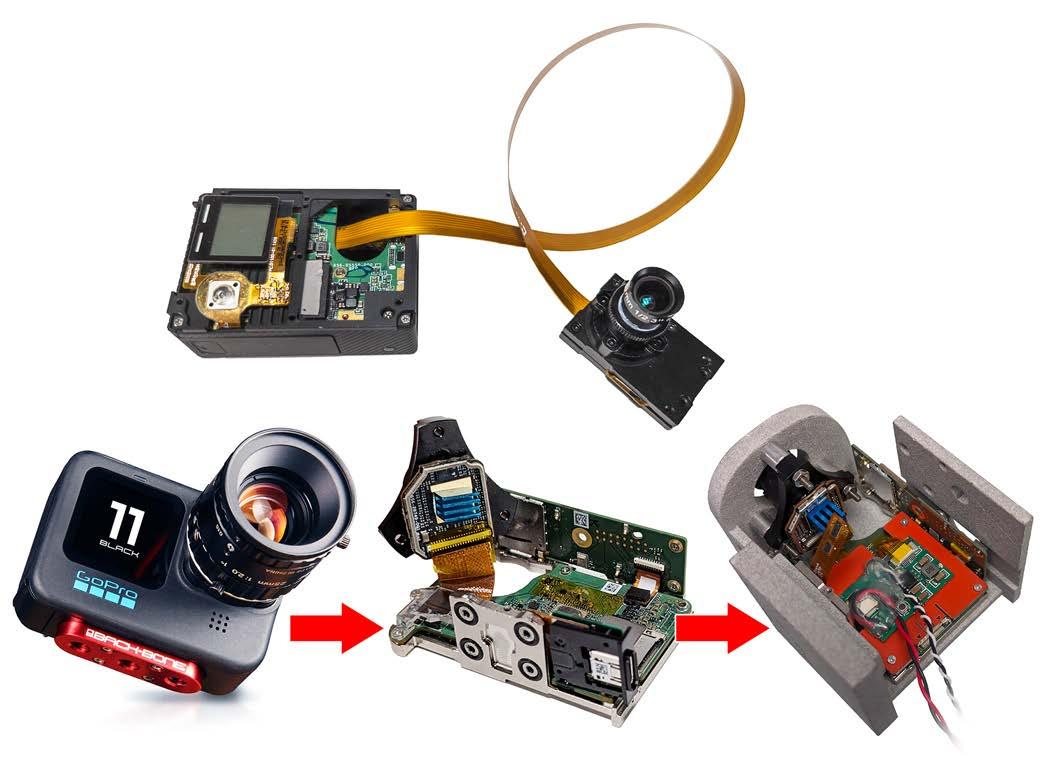
Figure 11: (Top) Back-Bone HERO4™ lens relocation modification system. (Bottom) Back-Bone HERO11™ reconfiguration used in the DeepSea Optim 11 km housing, which was configured for the Alvin submersible as a GoPro-based 27MP still camera for routine operations down to the submersibles’ 6,500 m rated operational depth (note that Alvin safety protocols as prescribed by the US Navy requires a pressure certification procedure that includes nine 10-minute cycles to ~1.5x the vehicle-rated operational depth and a final tenth cycle where that pressure is held for 1 hour). The Back-Bone and EPO-OIS collaboration to integrate the HERO11™ module into the Optim SeaCam 11 km-rated housing resulted in a routinely operable, very high-resolution camera for enhanced science capabilities to Alvin’s maximum operating depth of 6,500 m.
engineering changes to the camera formfactor. Though the original camera is physically small, it features an offset lens, making it difficult to centre in the optimal position behind the existing DeepSea corrector optics. In fact, the offset lens makes it impossible to mount in the existing DeepSea housings rated for 6,000 m. In 2014, the only available housing other than the Digi SeaCam housing with this corrector was the Super SeaCam, which had a max depth rating of 6,000 m. The 11,000 m depth rating would not be realized until the newer DeepSea Optim SeaCam housing was released in 2019. Furthermore, the wide-angle fisheye lens built into the original camera is not well suited for combination with the DeepSea optical system; when paired with the corrector optics, its wide-angle field of view resulted in increased
chromatic aberration towards the edges, and interior views of the dome were visible.
By 2014, Back-Bone had already developed interchangeable lens modifications for both the GoPro HERO3 and HERO4 cameras. The MISO project coincided with an internal Back-Bone project named “Modulus,” which expanded on these modifications. As part of that project, the HERO4’s 1/2.3” CMOS sensor was detached from the camera body and extended up to 30 cm via a customdesigned flex ribbon. The CMOS sensor was housed in its own aluminum shell complete with lens mounts for M12, CS-Mount, and C-Mount lens types (Figure 11). That configuration allowed the camera body to fit lengthwise into even the smallest pressure vessels while the CMOS sensor and lens were
precisely positioned and centred behind the previously developed corrector optics.
With the form factor and lens mount issues addressed, the optics needed to be selected. The M12 (S-mount) lens type was chosen given the format’s extremely small size and high resolution. A rectilinear 1/2.3” 5.4 mm lens provided excellent results in a variety of tests and provides an image with none of the “fisheye” distortion that is often associated with GoPro™ cameras. Its fixed focus design has a depth of field ranging from 0.5 m to infinity as well as having an optimal field of view while not capturing interior views of the dome.
In 2022, Back-Bone’s standard H11PRO modified HERO11™ camera paired with the same 5.4 mm lens began service in DeepSea camera housings used by the MISO Facility (Figures 3-5 and 11-12). The new, larger 1/1.9” image sensor features significant image quality and resolution improvements over the HERO4™ but still features an offset lens, so the challenge of mounting the camera inside the newer 11,000 m rated housings needed to be addressed. Given the time window needed for a rapid deployment, the development of a new CMOS flex ribbon extension was not viable. Instead, a stripped-down version of the camera was developed with a dedicated M12 lens mount attached. In collaboration with EPO, this version of the camera was developed so that the CMOS and lens are securely mounted at a 90-degree angle to the main camera body. That configuration allows the assembly to fit into the DeepSea Optim SeaCam housing and slide forward into the proper position behind the dome’s corrector optics (Figures 12-13).
Scientific expeditions utilizing the MISO GoPro™ camera systems have captured fundamental seafloor processes at mesophotic reefs, spreading centres, seamounts, seeps, canyons, and hydrothermal vents (Figures 1425). Access to high-resolution, infinite-focus imagery at these sites has been transformative for performing modern analyses on 1) seafloor habitat classification and mapping, 2) counting individuals of different fauna, 3) non-invasive computation of fluid fluxes, and 4) creating 3D renderings of complex structures. This section provides some exemplar imagery from NSFfunded expeditions from 2022 through 2024, using 2nd and 3rd generation MISO GoPro cameras in both the DeepSea Digi SeaCam and Super SeaCam housings.
High resolution still and video imagery produced by the MISO Facility deep-sea cameras, and especially the new MISO GoPro cameras, have contributed to dozens of peer-reviewed scientific publications as well as numerous educational and outreach activities that highlight multi-disciplinary oceanographic research to the public and stimulate students at all levels, from K-12 to undergraduate and graduate students (see references listed in Supplementary Material). Imagery from MISO camera systems have also been used in artistic projects as a visual portal for the lay public to the largely inaccessible environments of the deep ocean. Images and
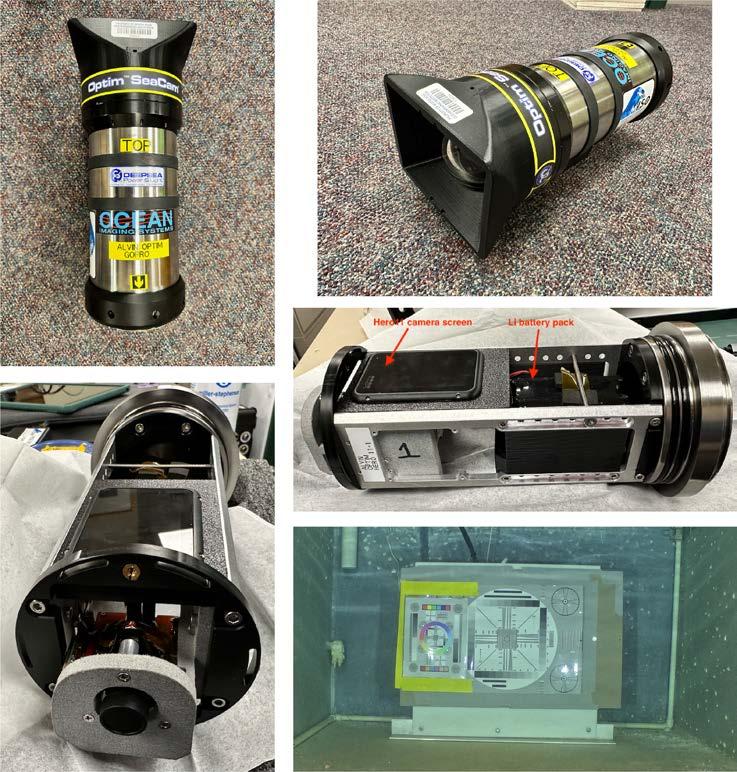
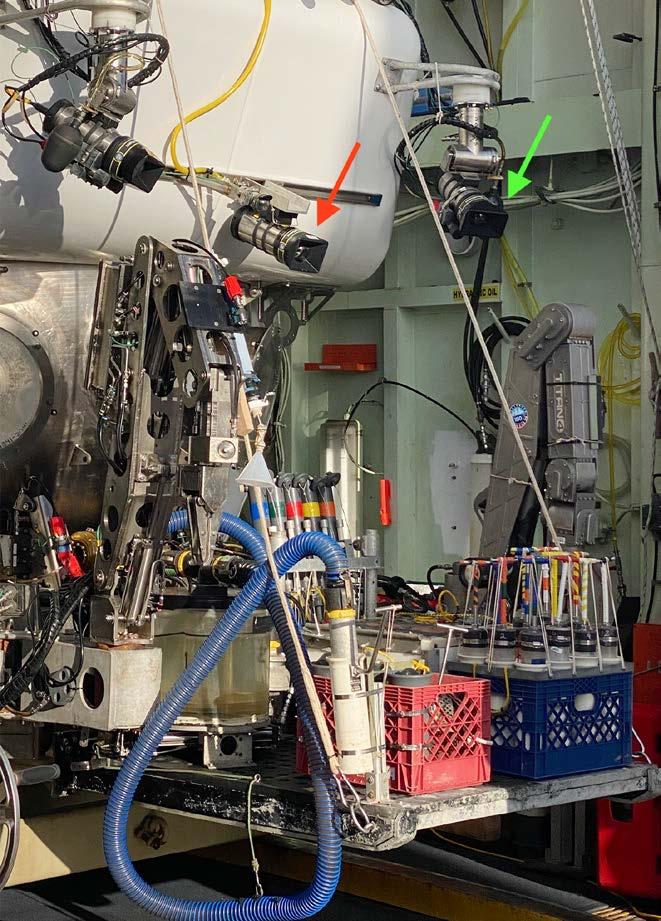
Figure 12: 11 km-rated DeepSea Optim SeaCam camera housing for Alvin’s GoPro HERO11™ still and video camera system resulting from the collaboration between DeepSea, EPO-OIS, Back-Bone, and the WHOI-MISO Facility. The three-element high pressure corrected dome port optic (two lens elements plus the dome) is the same design as the one used in the DeepSea Digi SeaCam and Super SeaCam housings (see Figures 3-5).
Figure 13: Alvin’s imaging and sampling equipment configured for deep (~5,000 m) dives in the Aleutian Trench in June 2024. Red arrow shows DeepSea Optim 11 km housing with integrated HERO11 imaging module resulting from collaboration between DeepSea, EPO-OIS, Back-Bone, and WHOI-MISO Facility used on Alvin for 27MP still imaging at 5 second intervals for deep dives to 6,500 m depth. Camera is mounted above pilot’s viewport next to a DeepSea HD Multi Seacam HD video camera (centre). Camera at upper right and left on panand-tilt units are two DeepSea 4K Optim SeaCam video cameras (green arrow) used for 4K, user-controlled, video imagery acquisition as part of the standard data package on every dive.
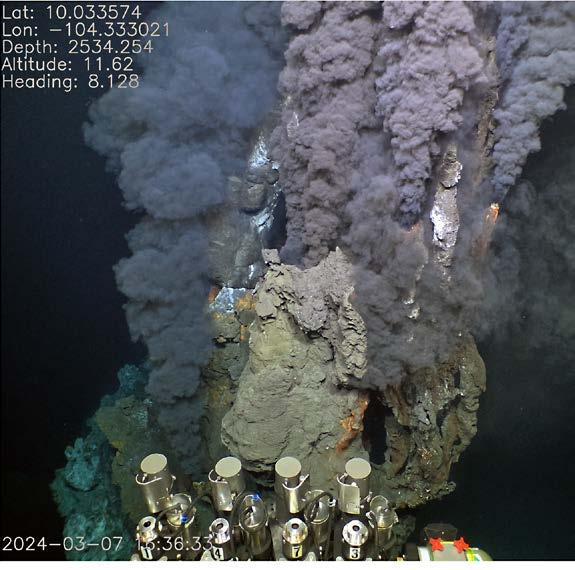
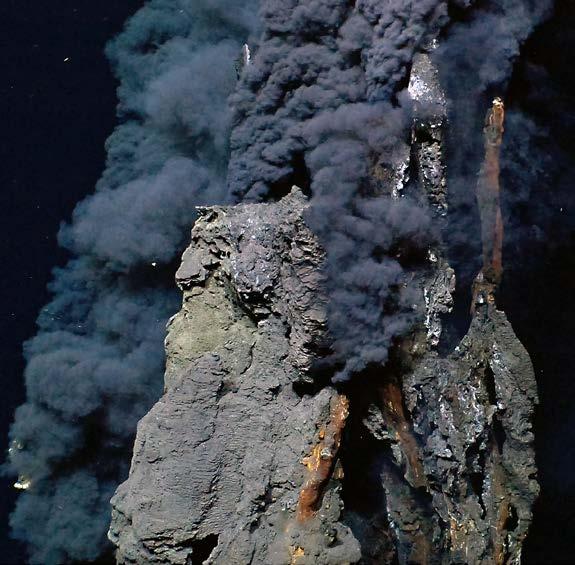
Figure 14: (Left) 27MP image of newly discovered hydrothermal vent at 2,534 m depth on the axis of the East Pacific Rise near 10°N acquired with the 3rd generation MISO Digi SeaCam system using a GoPro HERO11™ camera on Alvin’s “brow” (above pilot’s viewport); notations in the image are metadata from Alvin’s data system synchronized (in UTC) to the image “creation” date/time. (Right) Digital screengrab of the 5.3K cinematic video at the same vent acquired simultaneously at 30 fps, by the basket-mounted, forward-looking MISO Digi SeaCam system on Alvin during Dive 5245 in March 2024.
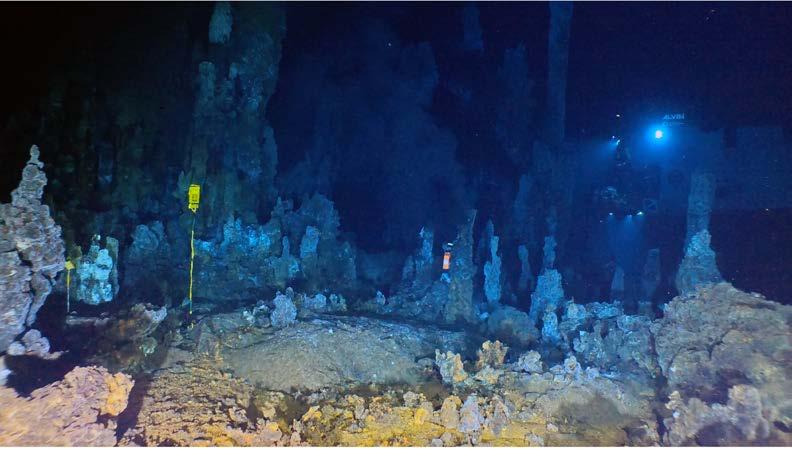
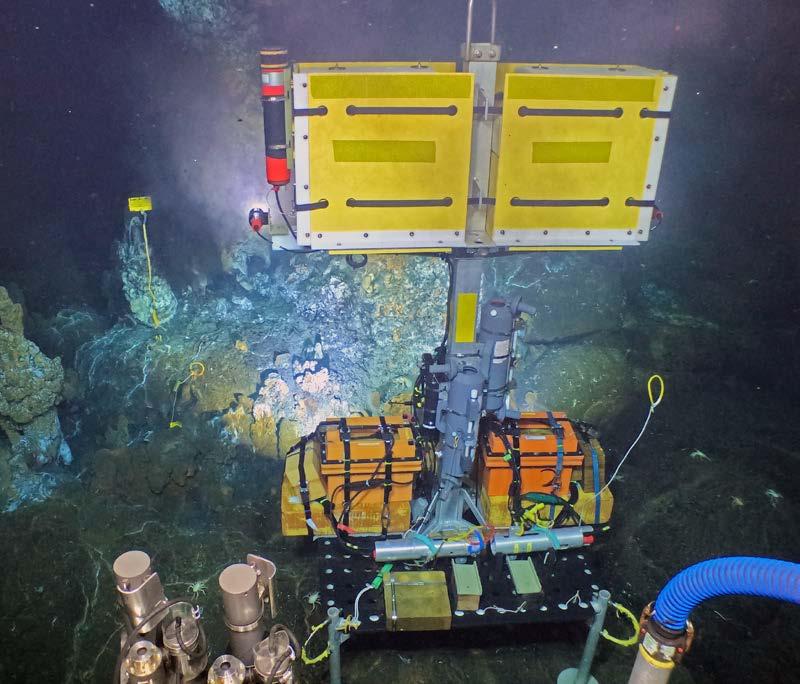
Figure 15: (Top) Digital screengrab of the 5.3K cinematic video acquired at 30 fps by the lander-mounted, forward-looking 3rd generation MISO Digi SeaCam system deployed during Alvin Dive 5249 in March 2024 at the YBW-Sentry hydrothermal field at 2,540 m depth, near 9° 54'N [20]. (Bottom) 27MP image of the MISO-NDSF imaging lander with the 3rd generation MISO Digi SeaCam system using a GoPro HERO11™ camera on Alvin’s “brow” (above pilot’s viewport).
V. PRESTON AND MCDERMOTT,
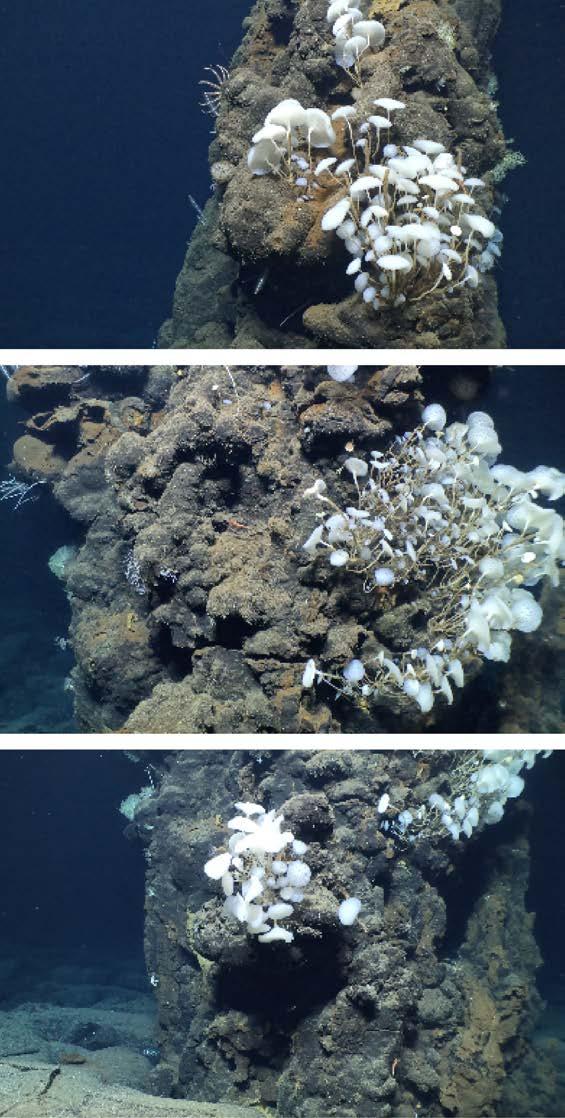
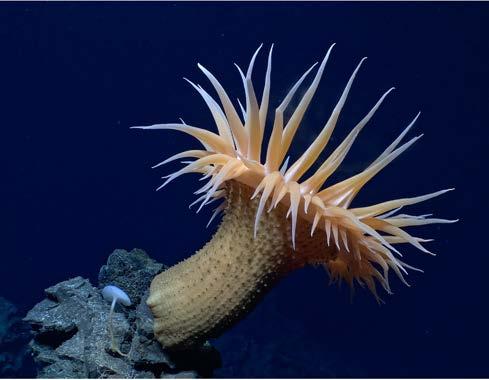
Figure 17: Framegrabs of 5.3K video from 3rd generation MISO GoPro camera system using a HERO11™ camera module and special 5.4 mm non-distortion lens in a DeepSea Digi SeaCam housing mounted on Alvin’s basket. The feature is a lava pillar that serves as the host for a large anemone and smaller brisgnid sea stars and a small sponge near the base of the anemone. The left image was acquired when the pilot drove close to the top of the lava pillar, filling the video frame with the anemone during Alvin Dive 5247 in March 2024.
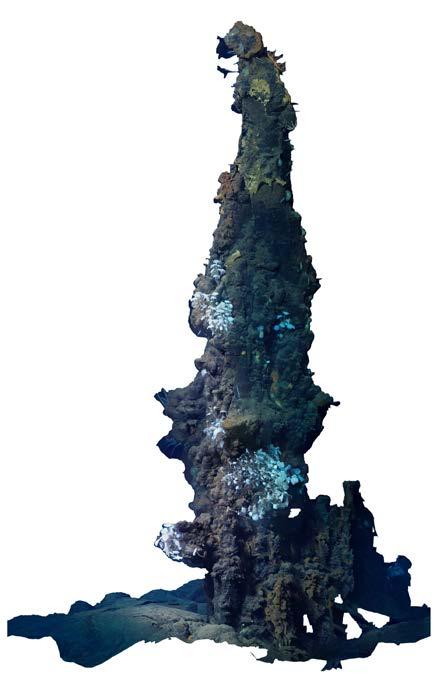
Figure 16: (Left) Sequence of digital screengrabs of an inactive hydrothermal vent colonized by a variety of sessile and mobile fauna, surrounded by lava likely erupted in ~2005-2006 at the East Pacific Rise near 9° 47'N west of the axis. Imagery is from 4K video acquired at 24 fps using a GoPro HERO4™ camera module in the 2nd generation MISO-OIS Super SeaCam housing. The camera was mounted on Alvin’s starboard arm during Dive 5236 in March 2024. (Right) The orthomosaic was assembled from a 3D reconstruction of 531 images extracted from the 4K video. The spire was imaged by moving the submersible up and down the structure in a scanning pattern. Agisoft Metashape (https://www.agisoft.com/) was used to compute the 3D reconstruction and orthomosaic. No other postprocessing has been performed on the imagery.
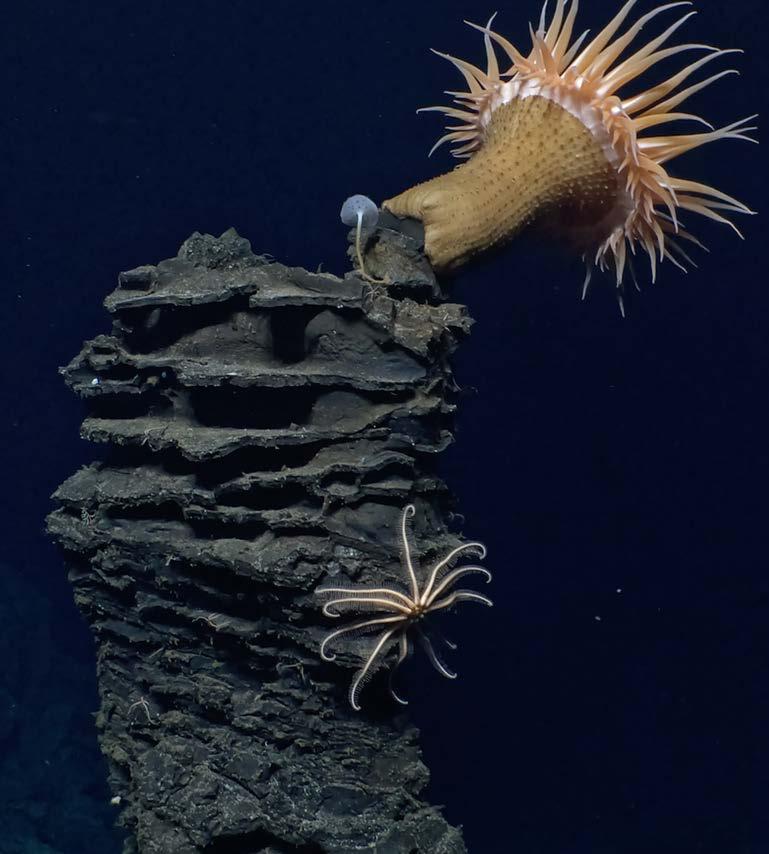
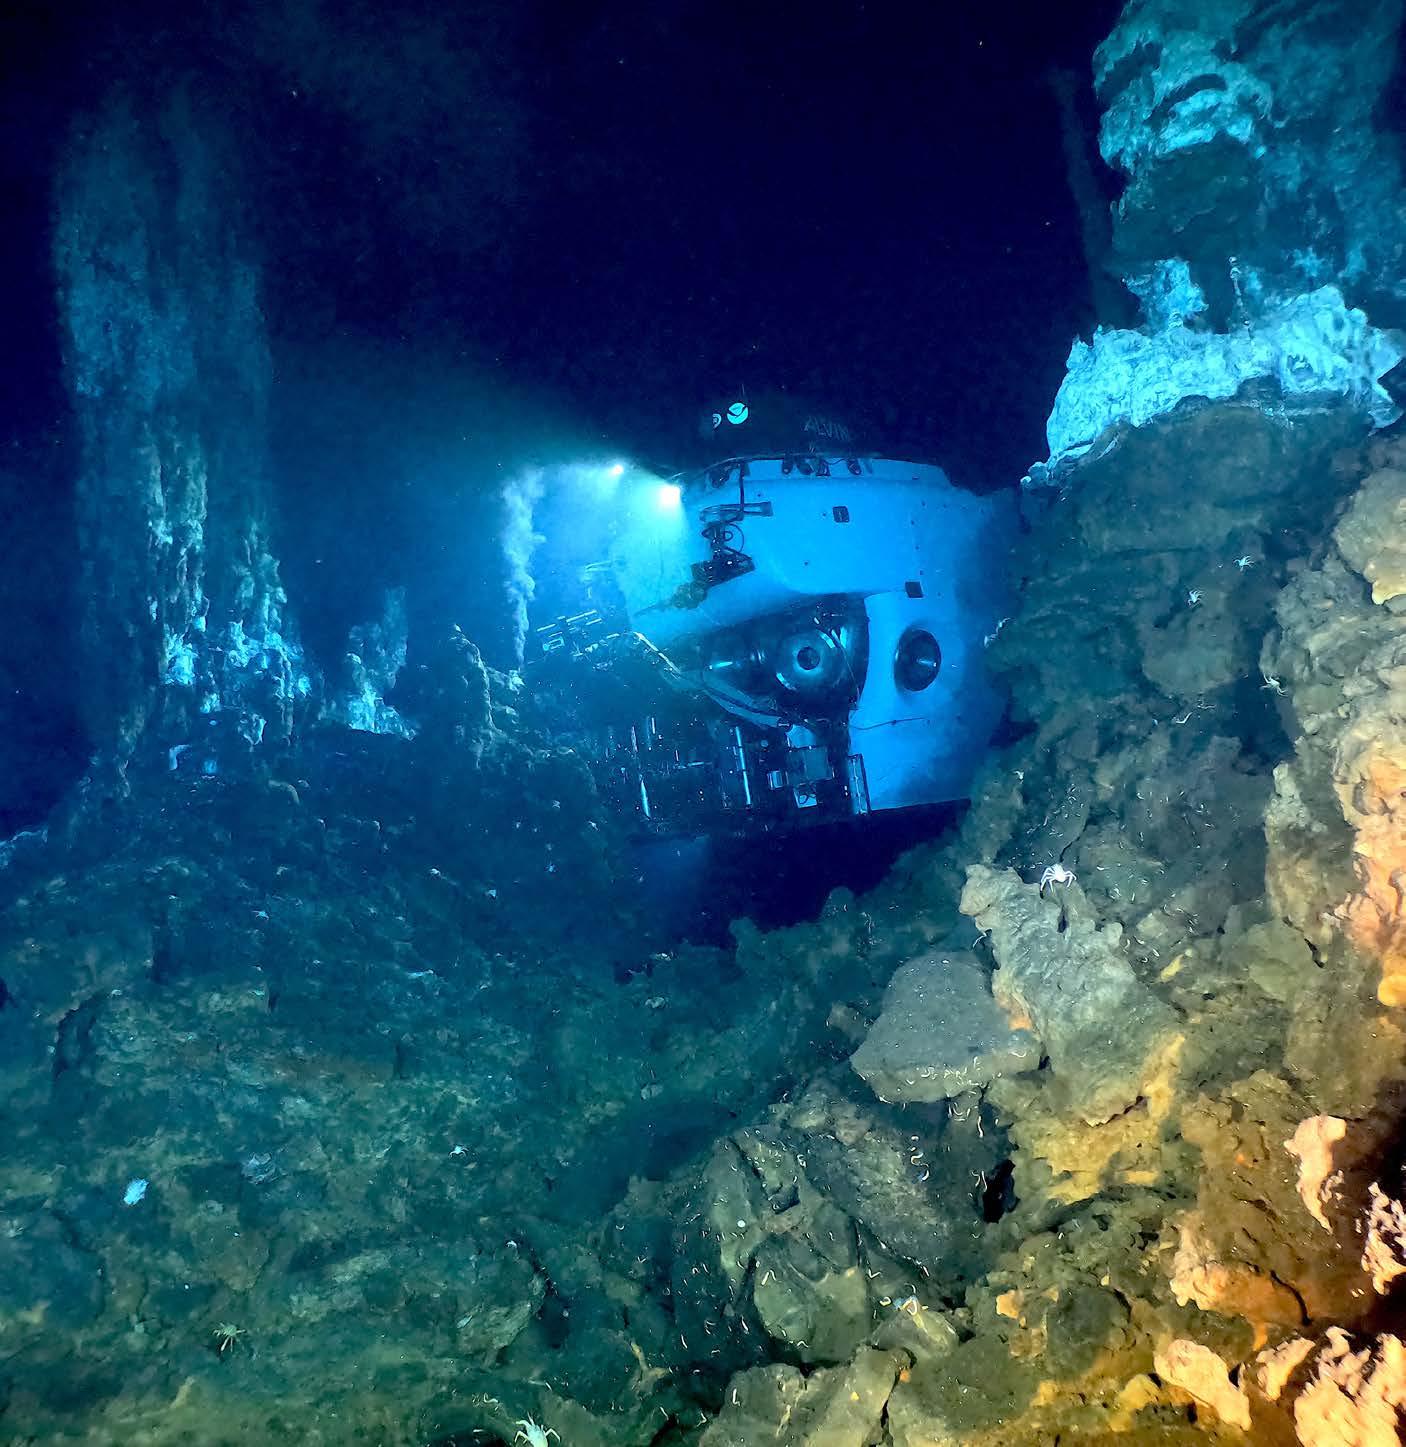
Figure 18: 27MP image from a 3rd generation MISO GoPro camera system using a HERO11™ camera module and special 5.4 mm nondistortion lens, shooting at 5 s intervals, in a DeepSea Digi SeaCam housing mounted on the MISO-NDSF imaging lander near the Bio9 hydrothermal vent at 2,510 m depth on the axis of the East Pacific Rise near 9° 50'N. The instrument inserted in the hydrothermal vent is a MISO-OIS designed high-temperature logger measuring exit-fluid temperature at the vent every 10 min for a ~two-year period [21].
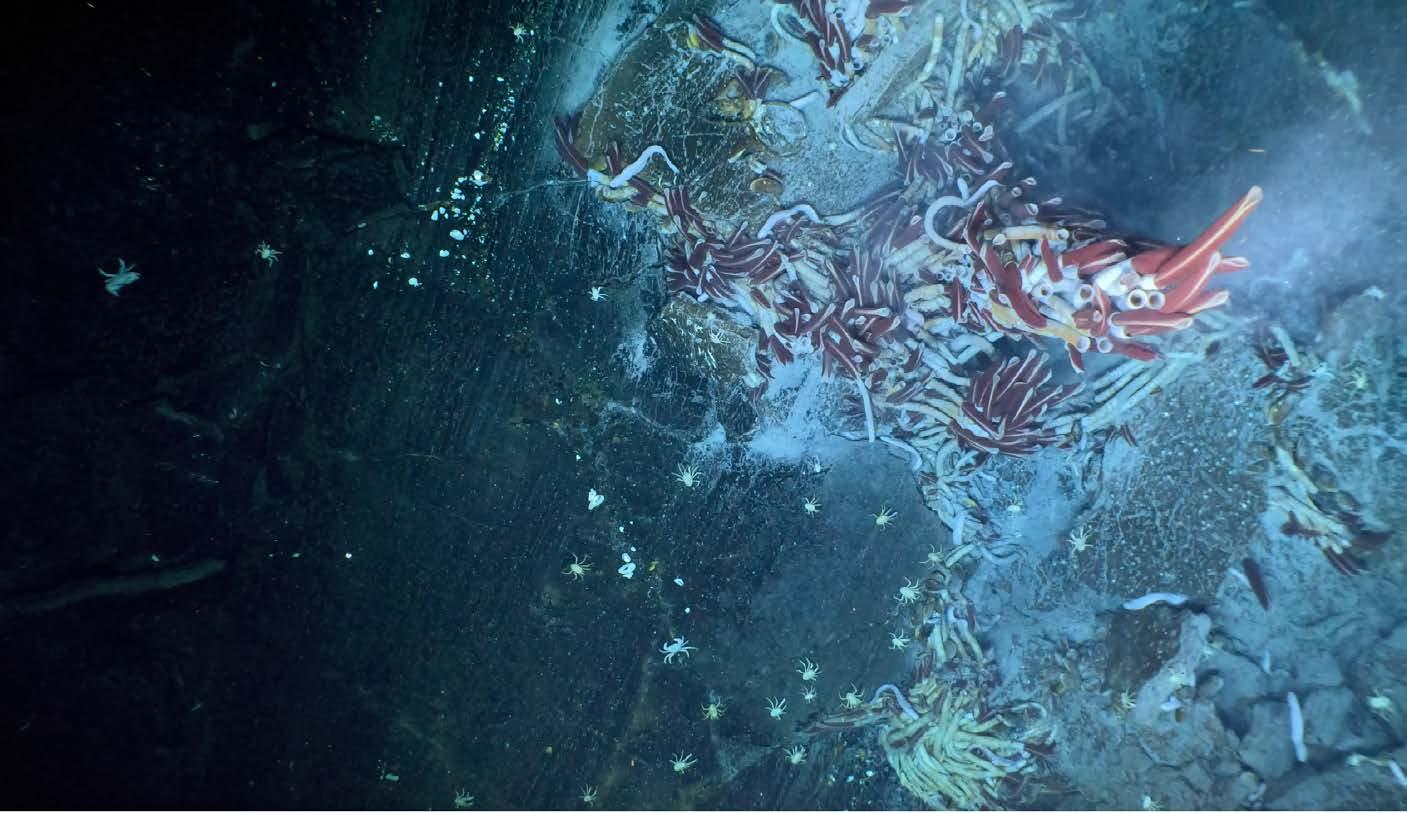
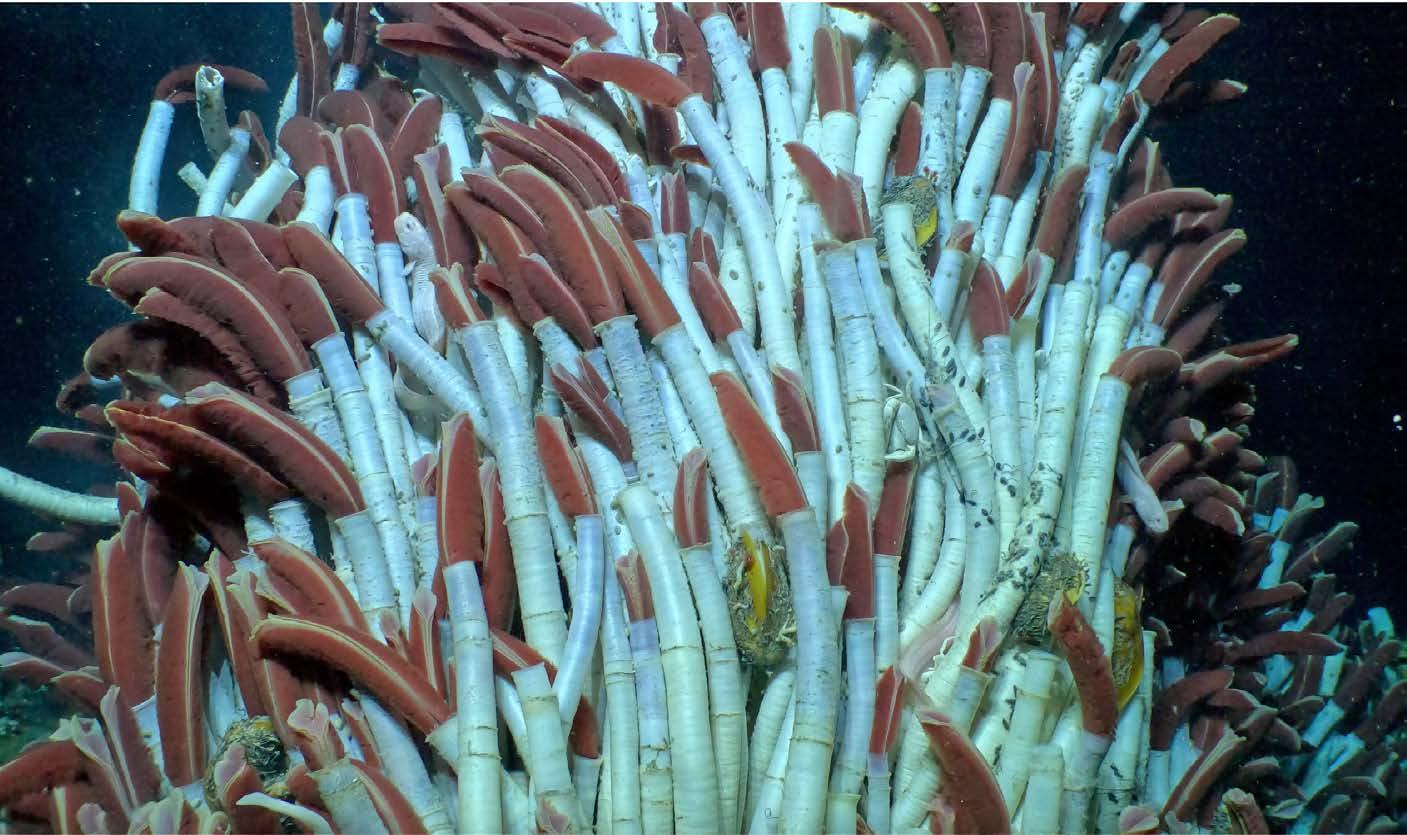
Figure 19: Framegrabs of 5.3K video from 3rd generation MISO GoPro™ camera system using a HERO11™ camera module and special 5.4 mm non-distortion lens in a DeepSea Digi SeaCam housing mounted on Alvin’s basket oriented looking down (top image) and looking forward (bottom image). Giant “Riftia” tubeworms at Biovent hydrothermal vent near 9° 51'N along the axis of the East Pacific Rise near 9° 51'N. Imagery was acquired during Alvin Dives 5244 (top) and 5243 (bottom).
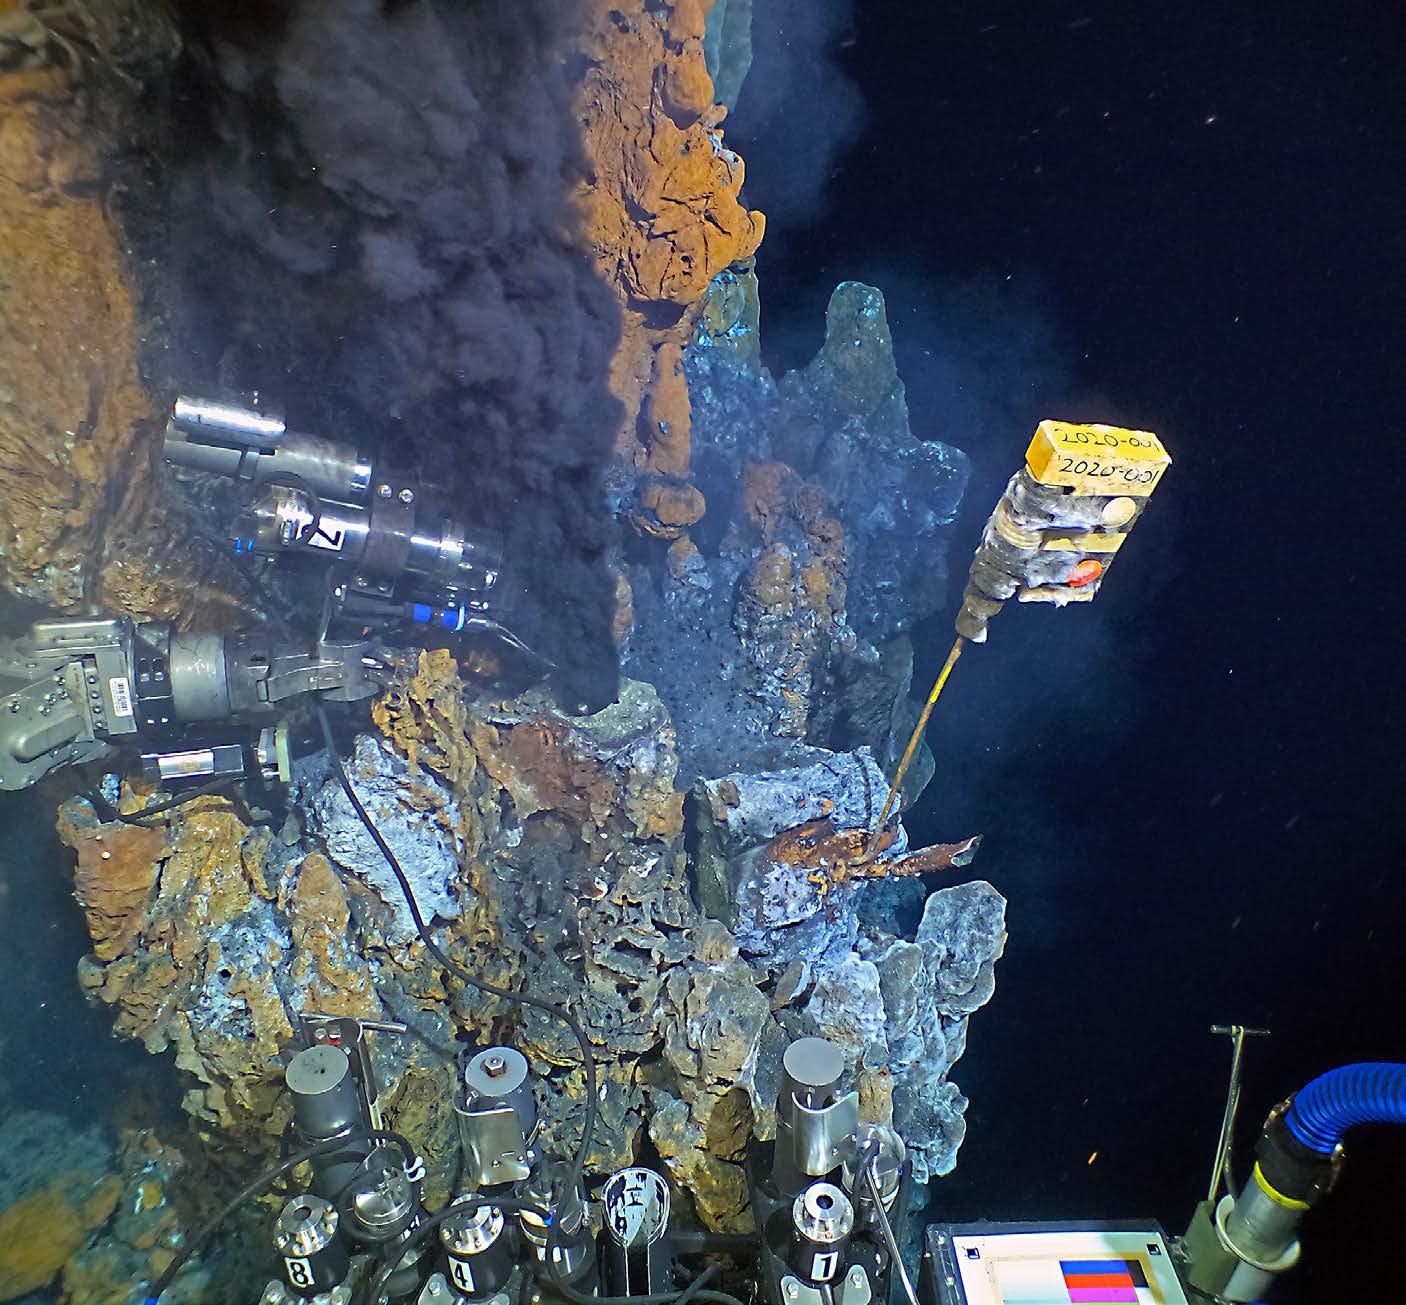
Figure 20: 27MP image of hydrothermal fluid sampling at “Nick’s” vent during Dive 5235 at the YBW-Sentry hydrothermal vent ~700 m east of the axis of the East Pacific Rise near 9° 54'N in February 2024. Image was shot using a 3rd generation MISO Digi SeaCam system using a GoPro HERO11™ camera on Alvin’s “brow” (above pilot’s viewport). Instrument to the right of the vent orifice is a EPO-MISO high-temperature vent fluid logger [21] that was imbedded in the chimney top that was broken off the structure to allow the fluid sample to be collected.
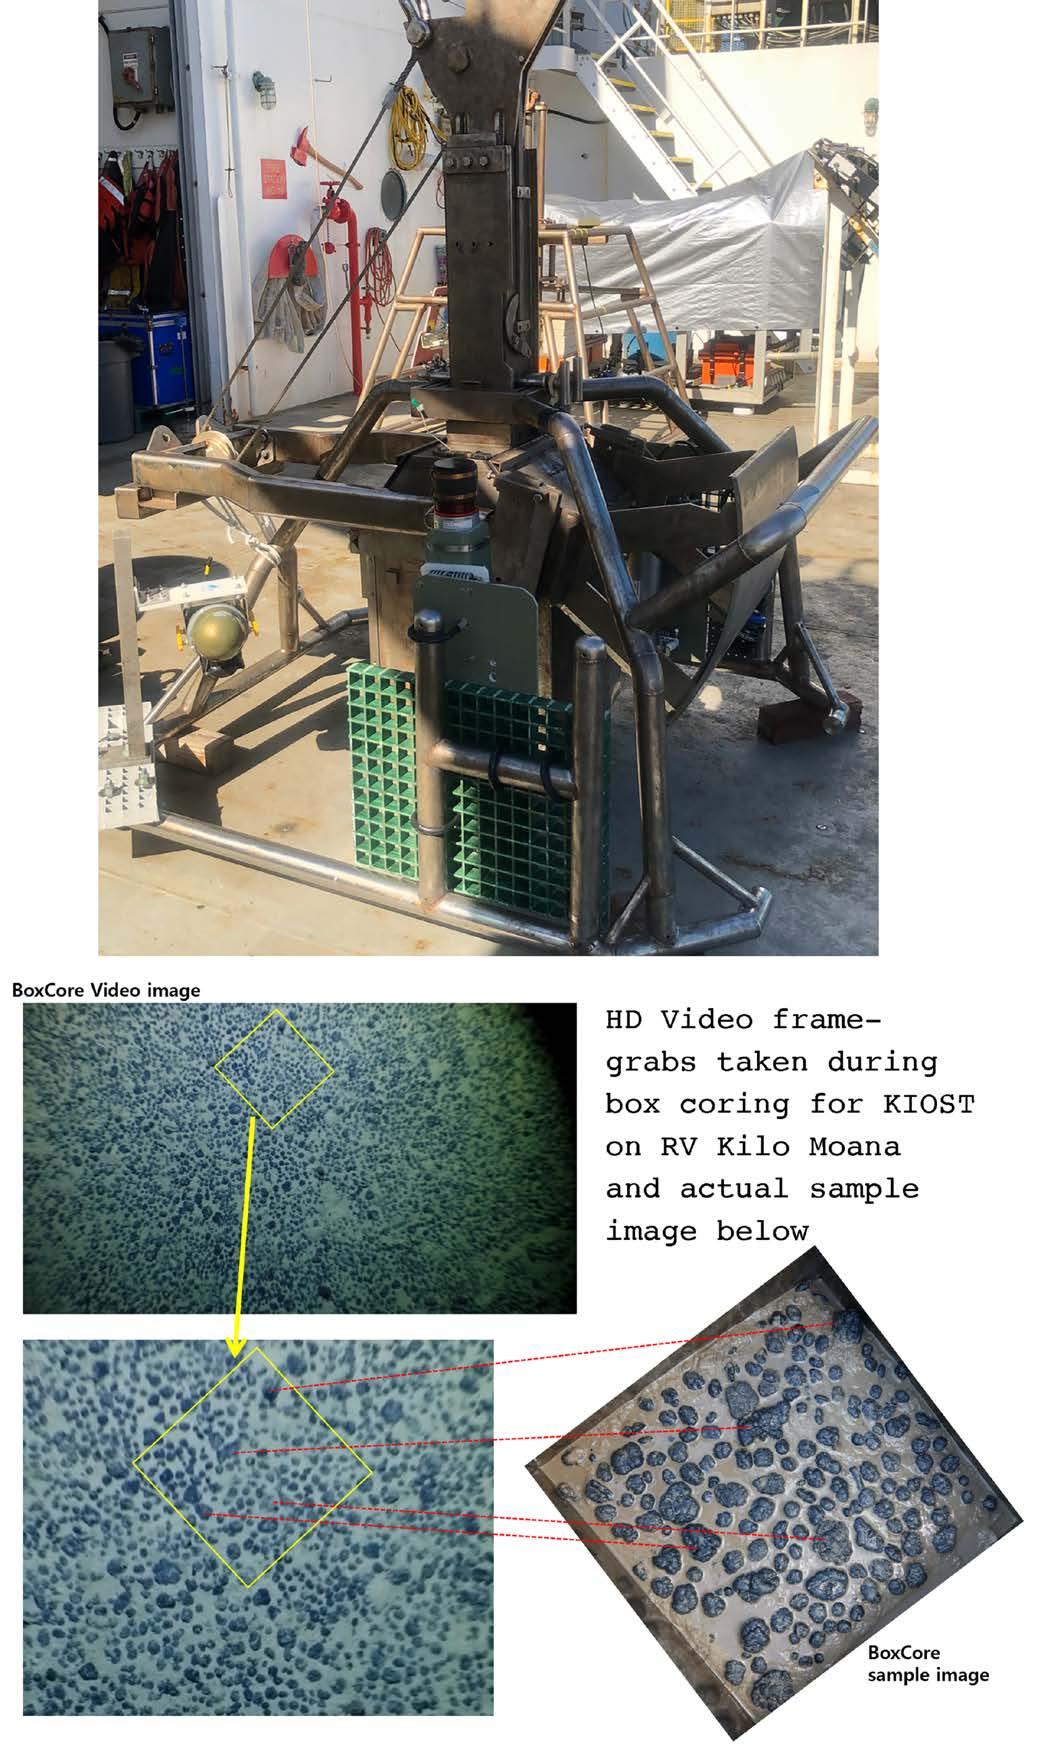
21: (Top) Box corer rigged with a 1st generation MISO GoPro camera used to take seafloor samples at ~5,000 m depth from the Clipperton-Clarion Mn-nodule field near 10°N. (Bottom) Framegrabs of 1080P video shot using a HERO4™ camera during bottom approach (~5 m altitude) and landing (~2 m altitude), and photograph (right-bottom) of the top surface of the box core on recovery and correlation of nodules shown in the imagery with actual recovered samples.
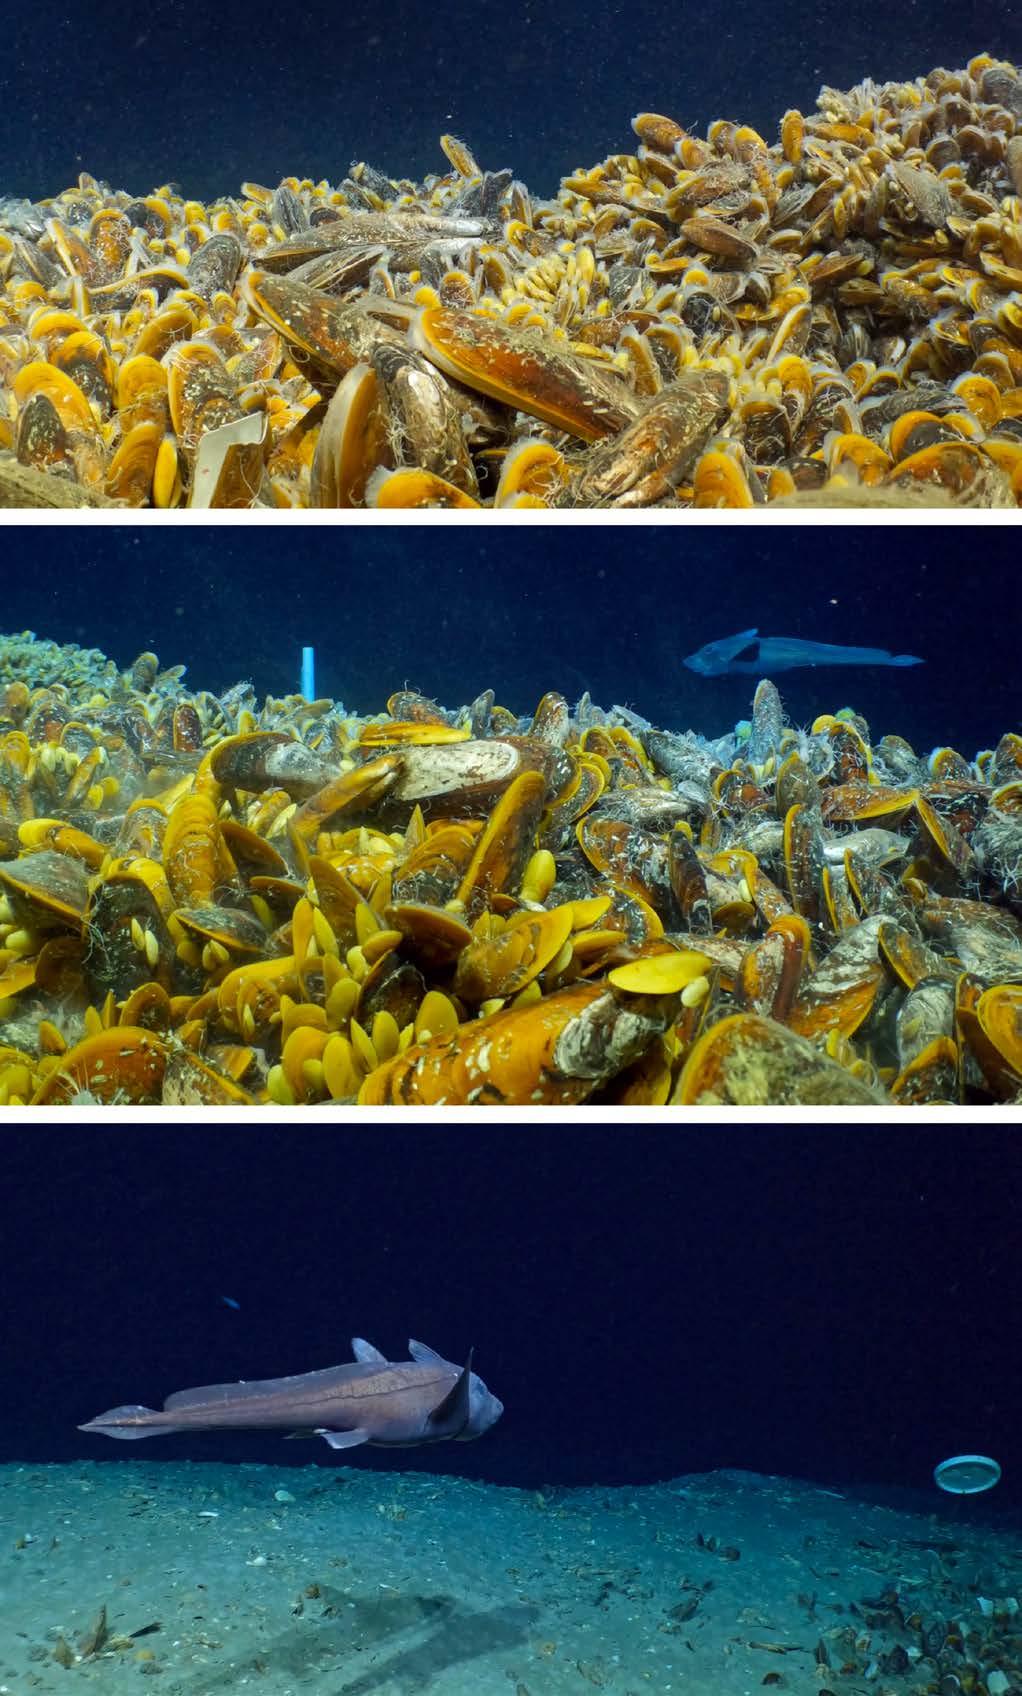
Figure 22: Sequence of framegrabs of 5.3K video from 3rd generation MISO GoPro™ camera system using a HERO11™ camera module and special 5.4 mm non-distortion lens in a DeepSea Digi SeaCam housing mounted on Alvin’s basket oriented looking forward. Superb depth of field is apparent in the middle image especially, given the close, in focus subject matter of the vent mussels very close (~<0.25 m) to the camera dome and far field focus of the fish and white cylindrical TCM-3 current meter instrument in mid-left centre of image. Imagery from a seafloor seep site in the Gulf of Mexico acquired during expedition AT50-04 (Courtesy of Prof. Craig Young, Institute of Marine Biology, University of Oregon).
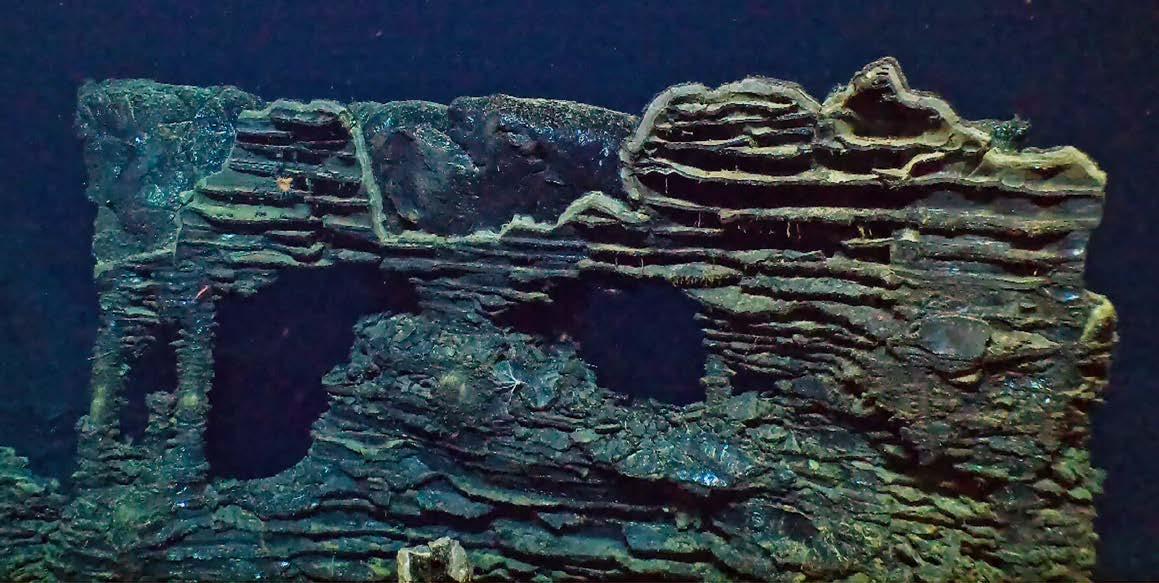
Figure 23: Lava pillars supporting a rampart formed during the 2005-2006 volcanic eruption at the East Pacific Rise near 9° 50'N. Image is a framegrab of 5.3K video from a 3rd generation MISO GoPro™ camera system using a HERO11™ camera module and special 5.4 mm nondistortion lens in a DeepSea Digi SeaCam housing mounted on Alvin’s basket oriented looking forward during Dive 5236. Image width is ~4 m.
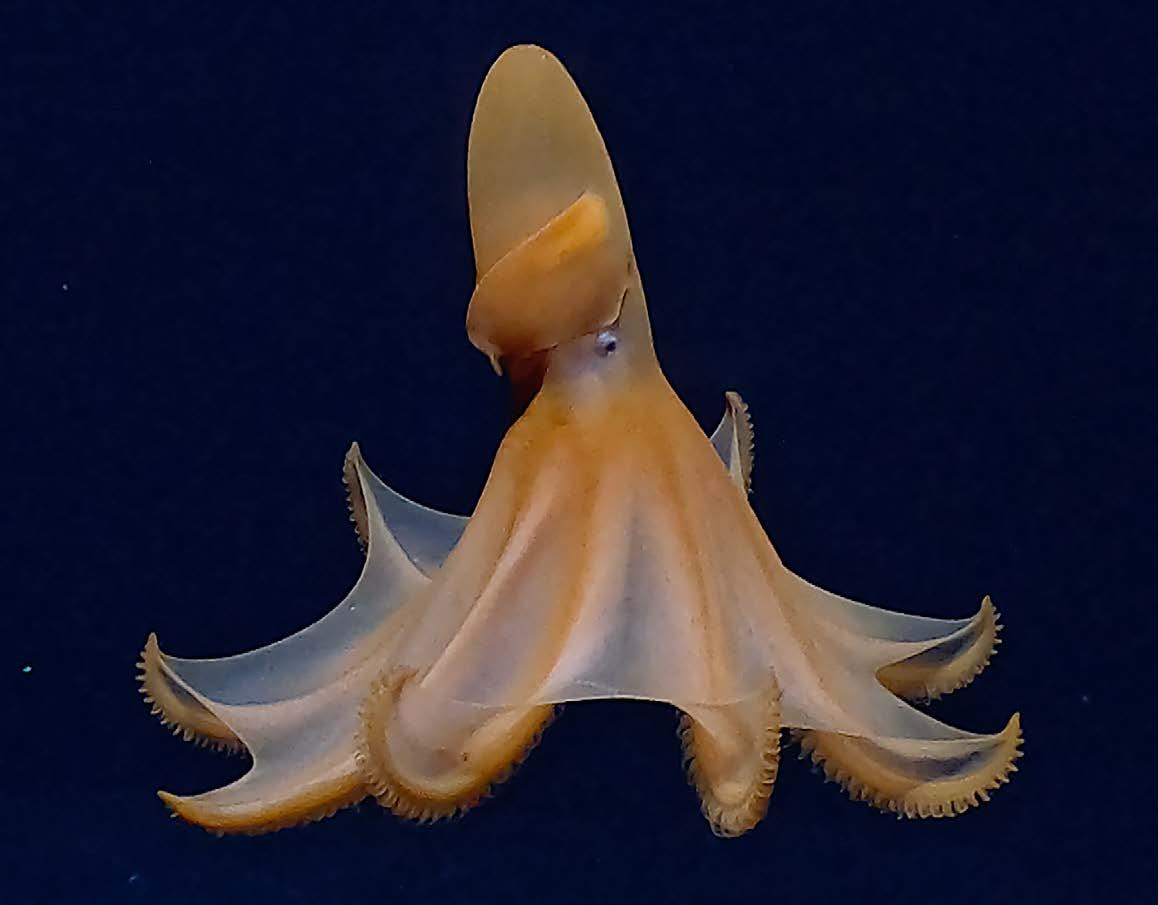
24: Framegrab of a Dumbo octopus (likely Cirrothauma cf. murrayi) at ~2,530 m depth on the axis of the East Pacific Rise from acquisition of 5.3K video in a 3rd generation MISO GoPro™ camera system using a HERO11™ camera module and special 5.4 mm nondistortion lens in a DeepSea Digi SeaCam housing mounted on Alvin’s basket oriented looking forward. Image width is ~1 m.
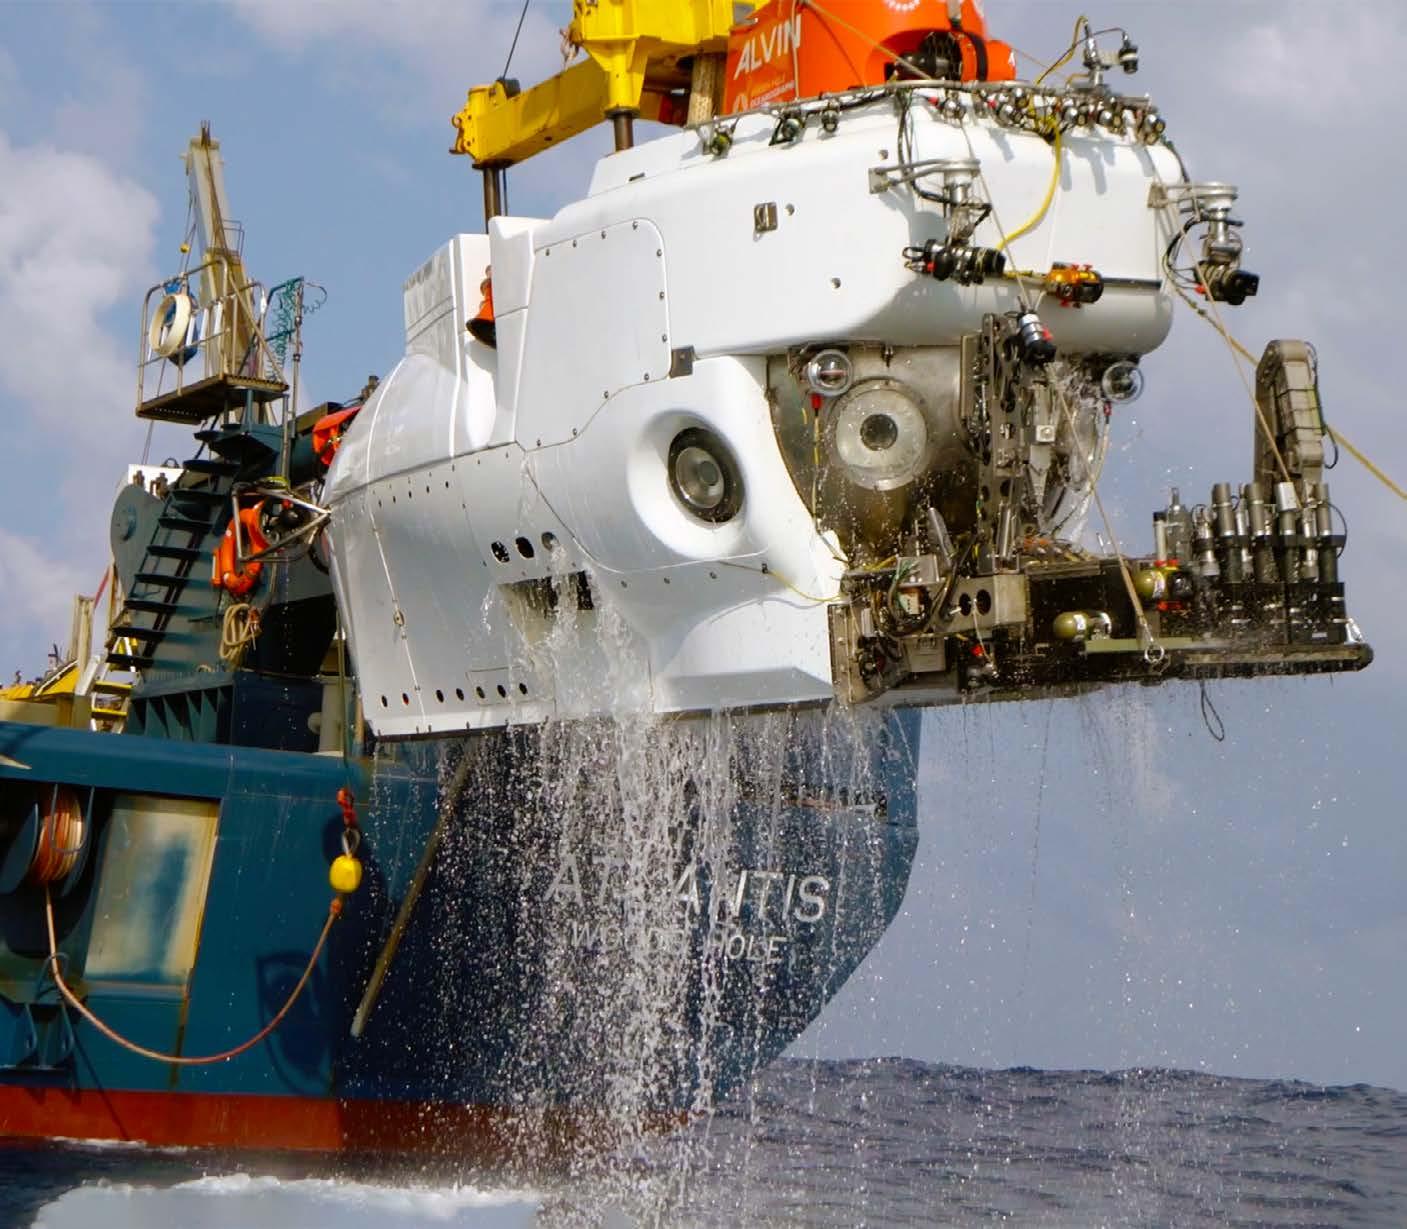
video from MISO cameras have contributed to academic websites, have been used to support research documented in peerreviewed publications, are used to highlight technology improvements in industry/ technical publications, and are being used for several high-profile filming projects. These latter projects include: 1) a 3D IMAX
film (tentative title: Born in the Abyss, based on research by C. Young (Institute of Marine Biology, University of Oregon) being produced with NSF funding by Stephen and Alex Low (NSF OCE-1851313, plus supplement OCE-2234492) Collaborative research: dispersal depth and the transport of larvae around a biogeographic barrier, and
OCE-2215612 Using media and technology to advance public awareness of research on microscopic larvae in the deep ocean; 2) a BBC production series Planet Earth III where filming of Alvin supporting research at mid-ocean ridge hydrothermal vents at the East Pacific Rise near 9° 50’N has been highlighted (aired in November 2023); and 3) a future BBC production, Blue Planet III, expected to air in 2026.
The authors wish to thank colleagues in the DeepSea and WHOI-MISO teams who have helped through the years to foster improvement in camera and instrumentation designs. The DeepSea authors would like to acknowledge their colleagues: Brian Braden, Hector Duran, Bruce McDermott, and Hooman Zarrabian for their extensive efforts in making these imaging systems possible and contributing to their ongoing success, as well as Amy Doria for her support throughout the creation of this article. DJF would like to acknowledge the following members of the WHOI-MISO team and research colleagues who have been instrumental to the success of the MISO Facility and the development of the deep-sea camera systems operated for the academic community: Bill Ryan, Adam Soule, Tim Shank, Marshall Swartz, Chris Lumping, Mark St. Pierre, Tim Smith, Don Collasius, Bruce Strickrott, Anthony Tarantino, Rick Sanger, Lane Abrams, Steve Liberatore, Rod Catanach, Andy Billings, Eric Hayden, Terry Hammar, Rhian Waller, Will Ridgeon, Jon Howland, Dana Yoerger, Hanu Singh, Greg Kurras, Allison Fundis, Sean Kelley, Matt Silvia, Justin Fuji, Nick
Matthews, Ben Freiberg, Thibaut Barreyre, Jill McDermott, and Ross Parnell-Turner. In addition, James Holik, a facilities program manager recently retired from the National Science Foundation’s Ocean Instrumentation Program, provided essential support for operation of the MISO Facility and development of new camera systems over the past 12 years, including the numerous MISO GoPro cameras now widely used in the US academic research community. This work has been supported by the following US National Science Foundation research grants to DJF at WHOI: OCE-1824508, OCE-1949485, and OCE-2313521.
1. Edgerton, H.E. [1963]. Underwater photography. In: The sea, ideas, and observations on progress in the study of the seas Vol. 3, edited by M.N. Hill, pp. 473-475, John Wiley & Sons, New York.
2. Ewing, M.A.; Vine, A.C.; and Worzel, J.L. [1946]. Photography of the ocean bottom. Journal of the Optical Society of America, 36, 307.
3. Hersey, J.B. (ed.) [1967]. Deep-sea photography Baltimore: The Johns Hopkins University Press.
4. Karson, J.; Kelley, D.; Fornari, D.; Perfit, M.; and Shank, T. [2015]. Discovering the deep: a photographic atlas of the seafloor and ocean crust Cambridge U. Press.
5. Heezen, B.C. and Hollister, C.D. [1971]. The face of the deep. New York: Oxford University Press.
6. Spiess, F.N. and Tyce, R.C. [1973]. Marine Physical Laboratory Deep Tow Instrumentation System. Ref. 73-4, Scripps Inst. Oceanogr., Lab Jolla, Calif.
7. Ballard, R.D. and Moore, J.G. [1977]. Photographic atlas of the Mid-Atlantic Ridge Rift Valley, 114 pp., Springer-Verlag, New York.
8. Grassle, J.F.; Berg, C.J.; Childress, J.J.; et al. [1979]. Galápagos ’79: initial findings of a deep-sea biological quest. Oceanus, 22(2), 2-10.
9. Lonsdale, P. and Spiess, F.N. [1980]. Deep-tow observations at the East Pacific Rise, 8˚45’N, and some interpretations. Initial Rep. Deep Sea Drill. Proj., 54, 43.
10. Benthos Inc. [1984]. Underwater photography, scientific and engineering applications. New York: Van Nostrand Reinhold.
11. Ballard, R.D. [1985]. The Titanic: lost and found –introduction. Oceanus, 28, 4.
12. ARGO Rise Group [1988]. Geological mapping of the East Pacific Rise axis (10°19’-11°53’N) using the ARGO and ANGUS image systems. Can. Mineralogist, 26, 467-486.
13. Fornari, D.J. [2003]. A new deep-sea towed digital camera and multi-rock coring system. Eos, Trans. Am. Geophys. Union, 84, 69 & 73.
14. Fornari et al. [2019]. Quiescent imaging article. In Ocean News and Technology, August, www. oceannews.com.
15a. Menna, F.; Nocerino, E.; and Remondino, F. [2017a]. Optical aberrations in underwater photogrammetry with flat and hemispherical dome ports. In Videometrics, Range Imaging, and Applications XIV (Vol. 10332, pp. 28-41). SPIE.
15b. Menna, F.; Nocerino, E.; and Remondino, F. [2017b]. Flat versus hemispherical dome ports in underwater photogrammetry. The International Archives of the Photogrammetry, Remote Sensing and Spatial Information Sciences, 42, 481-487.
16. Menna, F.; Nocerino, E.; Fassi, F.; and Remondino, F. [2016]. Geometric and optic characterization of a hemispherical dome port for underwater photogrammetry. Sensors, 16(1), 48.
17. Knight, D. [2012]. Dome port theory. G3YNH. (https://g3ynh.info/photography/ articles/dp_theory.html).
18. Kondo, T.; Kikuchi, A.; Kohashi, T.; Kato, F.; and Hirota, K. [1992]. Digital color video camera with auto-focus, auto-exposure and auto-white balance, and an auto exposure system therefore which compensates for abnormal lighting (U.S. Patent No. 5,093,716). U.S. Patent and Trade-mark Office. https://ppubs.uspto.gov/dirsearch-public/print/ downloadPdf/5093716.
19. Forbes, G.W. [1988]. Optical system assessment for design: numerical ray tracing in the Gaussian pupil. JOSA A, 5(11), 1943-1956.
20. McDermott, J.M.; Parnell-turner, R.; Barreyre, T.; Herrera, S.; Downing, C.C.; Pittoors, N.C.; et al. [2022]. Discovery of active off-axis hydrothermal vents at 9 ° 54 0 N East Pacific Rise. Proceedings of the National Academy of Sciences of the United States of America, 119(31), 1-8. https://doi. org/10.1073/pnas.2205602119/-/DCSupplemental. Published.
21. Barreyre, T.; Parnell-Turner, R.; Wu, J.-N.; and Fornari, D. J. [2022]. Tracking crustal permeability and hydrothermal response during seafloor eruptions at the East Pacific Rise, 9°50’N. Geophysical Research Letters, 49, e2021GL095459. https://doi.org/10.1029/2021GL095459.
Peer-reviewed references using deep-sea photography and MISO camera and instrument systems.
ARGO Rise Group [1988]. Geological mapping of the East Pacific Rise axis (1019’-1153’N) using the ARGO and ANGUS image systems. Can. Mineralogist, 26, 467-486.
Ballard, R.D. and Moore, J.G. [1977]. Photographic atlas of the Mid-Atlantic Ridge Rift Valley. 114 pp., Springer-Verlag, New York.
Barreyre, T.; Parnell-Turner, R.; Wu, J.-N.; and Fornari, D. J. [2022]. Tracking crustal permeability and hydrothermal response during seafloor eruptions at the East Pacific Rise, 9°50’N. Geophysical Research Letters, 49, e2021GL095459. https://doi. org/10.1029/2021GL095459.
Cowen, J.; Fornari, D.J.; Shank, T.M. [n.d.]. Rapid response to a volcanic eruption at the East Pacific Rise Crest near 9° 50’N. Eos, Trans. American Geophys. Union.
Delaney, J.R.; Kelley, D.S.; Lilley, M.D.; et al. [1998]. The quantum event of oceanic crustal accretion: impacts of diking at Mid-Ocean Ridges. Science, 281, 222-230.
Edgerton, H.E. [1963]. Underwater photography in the sea. Ideas and Observations on Progress in the Study of the Seas, Vol. 3, edited by M.N. Hill, pp. 473-475, John Wiley & Sons, New York.
Edwards, M.H.; Smith, M.O.; and Fornari, D.J. [1992]. CCD digital camera maps the East Pacific Rise. Eos Trans. AGU, 73, 329.
Ewing, M.A.; Vine, A.C.; and Worzel, J.L. [1946]. Photography of the ocean bottom. J. Opt. Soc. Am., 36, 307.
Ferrini, V.L.; Fornari, D.J.; Shank, T.M.; Kinsey, J.C.; Tivey, M.A.; Carbotte, S.M.; Soule, S.A.; Whitcomb, L.L.; Yoerger, D.; and Howland, J. [in press]. Submeter bathymetric mapping of the East Pacific Rise crest at 9°50'N: Linking volcanic and hydrothermal processes. Geochem. Geophys. Geosyst.
Fornari, D.J.; Humphris, S.E.; Parson, L.M.; Blondel, P.; and German, C.R. [1996]. Detailed Structure of Lucky Strike Seamount Based on DSL-120 kHz Sonar, ARGO-II and ROV Jason Studies. Eos Trans. AGU, 77, 699.
Fornari, D.J.; Humphris, S.E.; and Perfit, M.R. [1997]. Deep submergence science takes a new approach. Eos Trans. AGU, 78, 402&408.
Fornari, D.; Kurras, G.; Edwards, M.; Spencer, W.; and Hersey, W. [1998]. Mapping volcanic morphology on the crest of the East Pacific Rise 9° 49’-52’N using the WHOI towed camera system: a versatile new
digital camera sled for seafloor mapping, BRIDGE Newsletter, 14, 4-12.
Fornari, D.J. [2003]. A new deep-sea towed digital camera and multi-rock coring System. Eos, Trans. Am. Geophys. Union, 84, 69&73.
Fornari, D.J.; Tivey, M.A.; Schouten, H.; et al. [2004]. Submarine Lava Flow Emplacement at the East Pacific Rise 9° 50´N: Implications for Uppermost Ocean Crust Stratigraphy and Hydrothermal Fluid Circulation. In: The Subsurface Biosphere at MidOcean Ridges, AGU monograph RIDGE Theoretical Institute), W. Wilcock et al., eds., in press, 2004.
Fornari, D.J.; Voegeli, F.; and Olsson, M. [1996].
Improved low-cost, time-lapse temperature loggers for deep ocean and sea floor observatory monitoring. RIDGE Events, 7, 13-16.
Fornari, D.J.; Shank, T.M.; Von Damm, K.L.; Gregg, T.K.P.; Lilley, M.; Levai, G.; Bray, A.; Haymon, R.M.; Perfit, M.R.; and Lutz, R.A. Lutz [1998]. Timeseries temperature measurements at high-temperature hydrothermal vents: East Pacific Rise 9°49'N to 9°51'N: monitoring dike intrusion and crustal cracking events. Earth and Planet. Sci. Lett., 160, 419-431.
Fornari, D.J. and Shank, T.M. [1999]. Summary of highand low-T time-series vent fluid temperature experiments East Pacific Rise Vents 9° 49’-51’N. EXTREME-1 Cruise, May 1999, R/V Atlantis Cruise 03-34, July 1 (cruise report).
Fox, C.G.; Murphy, K.M.; and Embley, R.W. [1988]. Automated display and statistical analysis of deepsea bottom photography. Mar. Geol., 78, 199.
Garry, W.B.; Gregg, T.K.P.; et al. [2006]. Formation of submarine lava channel textures: insights from laboratory simulations. Jour. Geophys. Res., 111: doi10.10292005JB003796.
Grassle, J.F.; Berg, C.G.; Childress, J.J.; Grassle, J.P.; Hessler, R.R.; Jannasch, H.J.; Karl, D.M.; Lutz, R.A.; Mickel, T.J.; Rhoads, D.C.; Sanders, H.L.; Smith, K.L.; Somero, G.N.; Turner, R.D.; Tuttle, J.H.; Walsh, P.J.; and Williams, A.J. [1979]. Galapagos ’79 initial findings of a deep-sea biological quest. Oceanus, 22, 2. Heezen, B.C. and Hollister, C.D. [1971]. The face of the deep. 659 pp., Oxford University Press, New York. Hey, R.N.; Kleinrock, M.C.; Martinez, F.; et al. [1998]. High-resolution mapping and imaging of the fastest seafloor spreading system. Eos, Am. Geophys. U. Hey, R.; Baker E.; et al. [2004]. Tectonic/volcanic segmentation and controls on hydrothermal venting along Earth’s fastest seafloor spreading system, EPR 27°–32°S. Geochem. Geophys. Geosyst., 5, Q12007, doi:10.1029/2004GC000764.
Howland, J.C. [1998]. Imagery collection and mosaicking, Derbyshire Survey 1997. Proceedings MTS/Ocean Community Conference '98, Vol. 2, pp. 1104-1108, Baltimore, Maryland, November.
Howland, J.C.; Singh, H.; Marra, M.; and Potter, D. [1999]. Digital mosaicking of underwater imagery.
Sea Technology, pp. 65-69, June.
Humphris, S.E. and Kleinrock, M.C. [1996]. Detailed morphology of the TAG active hydrothermal mound: Insights into its formation and growth. Geophys. Res. Lett., 23: 3443-3446.
Humphris, S.E.; Fornari, D.J.; and Scheirer, D.S. [2002]. Geotectonic setting of hydrothermal activity on the summit of Lucky Strike Seamount (37° 17’N, MidAtlantic Ridge). Geochem. Geophys. Geosyst., 3, 10.1029/2001GC000284.
Karson, J.A.; Klein, E.M.; Hurst, S.D.; et al. [1999]. Hess Deep ‘99- A DSL-120, ARGO II, and Alvin study of upper crustal structure at the Hess Deep Rift: a new look at fast-spread crust of the EPR. Cruise Report.
Karson, J.; Kelley, D.; Fornari, D.; Perfit, M.; and Shank, T. [2015]. Discovering the deep: a photographic atlas of the seafloor and ocean crust. Cambridge U. Press.
Kim, S.L. and Mullineaux, L.S. [1998]. Distribution and near-bottom transport of larvae and other plankton at hydrothermal vents. Deep-Sea Research II, 45: 423-440.
Kleinrock, M.C. and Humphris, S.E. [1996]. Structural controls on the localization of hydrothermalism at the TAG active mound, Mid-Atlantic Ridge 26˚N. Nature, 382, 149-153.
Kurras, G.; Fornari, D.J.; and Edwards, M.H. [2000]. Volcanic morphology of the East Pacific Rise crest 9°49’-52’N: implications for extrusion at fast spreading mid-ocean ridges. Mar. Geophys. Res., 21, 23-41.
Langmuir, C.H.; Humphris, S.E.; Fornari, D.; Van Dover, C.L.; Von Damm, K.; Tivey, M.K.; Colodner, D.; Charlou, J.L.; Desonie, D.; Wilson, C.; Fouquet, Y.; Klinkhammer, G.; and Bougault, H. [1995]. Description and significance of hydrothermal vents near a mantle hot spot: the Lucky Strike vent field at 37°N, Mid-Atlantic Ridge. Earth Planet. Sci. Lett., 148, 69-91.
Lerner, S.; Howland, J.; Humphris, S.; and Lange, W. [1996]. Interactive inspection and analysis of multisensor data from the TAG hydrothermal vent site. Eos, Trans. of the Am. Geophys. Union, 77, p. 768. Lonsdale, P. and Spiess, F.N. [1980]. Deep-tow observations at the East Pacific Rise, 8˚45’N, and some interpretations. Initial Rep. Deep Sea Drill. Proj., 54, 43.
McDermott, J.M.; Parnell-Turner, R.; Barreyre, T.; Herrera, S.; Downing, C.; Pittors, N.; Vohsen, S.; Dowd, W.; Wu, J-N.; Marjanovic, M.; and Fornari, D.J. [2022]. Discovery of active off-axis hydrothermal vents at 9° 54’N East Pacific Rise. PNAS, 119 (30), e2205602119 https://doi.org/10.1073/pnas.220560 2119.
Mullineaux, L.S.; Mills, S.W.; and Goldman, E. [1998]. Recruitment variation during a pilot colonization study of hydrothermal vents (9°50’N, East Pacific Rise). Deep-Sea Research II 45:441-464.
RIDGE2000 Program Plan [2004]. Available at: http:// ridge2000.org.
Sarrazin, J.; Robigou, V.; Juniper, S.K.; and Delaney, J.R. [1997]. Biological and geological dynamics over four years on a high-temperature sulfide structure at the Juan de Fuca Ridge hydrothermal observatory. Mar. Ecol. Prog. Ser., 153, 5-24.
Sarrazin, J. and Juniper, S.K. [1999]. Biological characteristics of a hydrothermal edifice mosaic community. Mar. Ecol. Prog. Ser.
Scheirer, D.S.; Fornari, D.J.; Humpris, S.E.; and Lerner, S. [2000]. High-resolution seafloor mapping using the DSL-120 sonar system: quantitative assessment of sidescan and phase-bathymetry data from the Lucky Strike segment of the Mid-Atlantic Ridge. Mar. Geophys. Res., 21, 121-142.
Scheirer, D.S.; Shank, T.M.; and Fornari, D.J. [2006]. Temperature variations at diffuse and focused flow hydrothermal vent sites along the Northern East Pacific Rise, 7, 3, Q03002. Geochem. Geophys. Geosyst., doi:10.1029/2005GC001094.
Shank, T.M.; Scheirer, D.S.; and Fornari, D. [2001]. Time series studies of faunal colonization and temperature variations at diffuse-flow hydrothermal vent sites near 9°50'N, EPR. Eos Trans. AGU, 82, 196.
Shank, T.M.; Fornari, D.J.; Von Damm, K.L.; Lilley, M.D.; Haymon, R.M.; and Lutz, R.A. [1998]. Temporal and spatial patterns of biological community development at nascent deep-sea hydrothermal vents along the East Pacific Rise, 9° 49.6'N - 9° 50.4'N. Deep Sea Research, II, 45, 465-515.
Shank, T.M.; Fornari, D.J.; et al. [2003]. Deep submergence synergy: Alvin and ABE explore the Galapagos Rift at 86°W. Eos, Trans. American Geophys. Union, 84, 425, 432-433.
Singh, H.; Howland, J.; Duester, A.; Bradley, A.; and Yoerger, D. [1996]. Quantitative stereo imaging from the autonomous benthic explorer (ABE). Presented at the Symposium on Autonomous Underwater Vehicle Technology, Monterey, California.
Singh, H.; Howland, J.; Yoerger, D.; and Whitcomb, L. [1998]. Quantitative photomosaicking of underwater imagery. Proceedings Oceans ‘98, IEEE/ OES Conference, Nice, France, Vol. 1, pp. 263-266, September/October.
Singh, H.; et al. [2004]. Seabed AUV offers new platform for high-resolution imaging. Eos, Trans. American Geophys. Union, 85, 289, 294-295.
Sinton, J.; Bergmanis, E.; Rubin, K.H.; et al. [2002]. Volcanic eruptions on mid-ocean ridges: new evidence from the superfast spreading East Pacific Rise 17˚-19˚S. Jour. Geophys. Res., 107(B6): 21.
Sohn, R.A.; Fornari, D.; Von Damm, K.L.; Hildebrand, J.A.; and Webb, S.C. [1998]. Seismic and hydrothermal evidence for a cracking event on the East Pacific Rise crest at 9°50'N. Nature, 396, 159-161.
Sohn, R.A.; Hildebrand, J.A.; and Webb, S.C. [1999]. A microearthquake survey of the high-temperature
vent fields on the volcanically active East Pacific Rise. J. Geophys. Res., 104 (11), 25,367-25,378.
Sohn, R.A.; Humphris, S.A.; and Canales, J. [2005]. Stochastic analysis of exit-fluid temperature timeseries data from the TAG hydrothermal mound: events, states, and hidden Markov models. Am. Geophys. Union, Eos, 86(52), OS22A-06.
Soule, S.A.; Fornari, D.J; et al. [2005]. Channelized lava flows at the East Pacific Rise crest 9-10˚N: the importance of off-axis lava transport in developing the architecture of young oceanic crust. Geochem. Geophys. Geosyst., 6(8): doi:10.1029/2005GC000912.
Spiess, F.N. and Tyce, R.C. [1973]. Marine Physical Laboratory deep tow instrumentation system, ref. 734. Scripps Inst. Oceanogr., Lab Jolla, Calif.
Sulanowska, M.M.; Humprhis, S.E.; Howland, J.C.; and Kleinrock, M.C. [1996]. Detailed analysis of the surface morphology of the active TAG hydrothermal mound by mosaicking of digital images. Eos, Trans. of the American Geophysical Union, Eos, 77, 768.
Tolstoy, M.; Cowen, J.P.; Baker, E.T.; Fornari, D.J.; Rubin, K.H.; Shank, T.M.; Waldhauser, F.; Bohnenstiehl, D.R.; Forsyth, D.W.; Holmes, R.C.; Love, B.; Perfit, M.R.; and Weekly, R.T. [2006]. A seafloor spreading event captured by seismometers: forecasting and characterizing an eruption. Science, DOI: 10.1126/science.1133950.
Trask, J. and Van Dover, C.L. [1999]. Site-specific and ontogenetic variations in nutrition of mussels (Bathymodiolus sp.) from the Lucky Strike hydrothermal vent field, Mid-Atlantic Ridge. Limnology and Oceanography, 44, 334-343.
Van Dover, C.L.; Trask, J.; Gross, J.; and Knowlton, A. [1999]. Reproductive biology of free-living and commensal polynoid polychaetes at the Lucky Strike hydrothermal vent field (Mid-Atlantic Ridge). Marine Ecology Progress Series.
Wu, J.; Parnell-Turner, R.E.; Fornari, D.J.; Kurras, G.; Berrios‐Rivera, N.; Barreyre, T.; and McDermott, J.M. [2022]. Extent and volume of lava flows erupted at 9°50′N, East Pacific Rise in 20052006 from autonomous underwater vehicle surveys. Geochemistry, Geophysics, Geosystems, 23(3), 1-35. https://doi.org/10.1029/2021gc010213.
Yoerger, D.; Singh, H.; Whitcomb, L.; Mindell, D.; Adams, J.; Foley, B.; and Catteati, J. [1988]. Precise optical and acoustic mapping of the Skerki Bank Wrecks using the Jason ROV. Society for Historical Archaeology – Conference on Historical and Underwater Archaeology, Atlanta, Georgia, January.
Yoerger, D.R.; Bradley, A.M.; Cormier, M-H.; Ryan, W.B.F.; and Walden, B.B. [1999]. High resolution mapping of a fast spreading Mid Ocean Ridge with the autonomous benthic Explorer. 11th International Symposium on Unmanned Untethered Submersible Technology (UUST99), Durham, New Hampshire, August.
Yoerger, D.R.; Kelley, D.S.; and Delaney, J.R. [1999]. Fine-scale three-dimensional mapping of a deepsea hydrothermal vent site using the Jason ROV system. International Conference on Field and Service Robotics (FSR ’99), Pittsburgh, Pennsylvania, August.
YouTube links
Compiled video footage from Expedition AT50-21 in 2024 at the East Pacific Rise 9° 46’-54’N showing primarily MISO GoPro 5.3K video as well as DeepSea 4K video from Alvin’s Optim cameras https://www.youtube.com/watch?v=VlLYU25VfII
Compiled video footage from Expedition AT50-09 in 2023 in the Galápagos Marine Reserve showing primarily MISO GoPro 5.3K video as well as DeepSea 4K video from Alvin’s Optim cameras https://www.youtube.com/watch?v=sa3J-0sMUjo
Compiled video footage from Expedition AT42-06 in 2018 at the East Pacific Rise 9° 50’N showing primarily MISO GoPro 4K video as well as DeepSea 4K video from Alvin’s Optim cameras https://www.youtube.com/watch?v=7dYVPtFCWQ4
Researchers investigate traditional image enhancement algorithms and analyze their deployment on resource constrained devices.
This paper is of interest to marine researchers and professionals who work on underwater robotics and navigation. Also, engineers and designers working on edge computing devices for marine applications can obtain valuable insights on implementing image enhancement algorithms on resource constrained devices such as Raspberry Pi 3 and Raspberry Pi 4. For marine biologists, this paper gives good insight about the basic image processing techniques that are available for image enhancement.
Underwater visibility is often poor due to low contrast and colour distortion. Enhancing the quality of underwater images is crucial for marine researchers and divers, and for applications such as underwater robotics and navigation. This work compares the efficiency of traditional methods on the Enhancing Underwater Visual Perception dataset. The main objective of this work is to analyze the feasibility of the real-time implementation of traditional image enhancement algorithms on low resource devices to improve the underwater visibility for marine research and exploration.
Dr. M. Arun is currently working as an assistant professor in the Department of Electronics and Communication Engineering, Mepco Schlenk Engineering College, Sivakasi, Tamilnadu, India. He received his B.E. (electronics and communication engineering) in 2008, M.E. (embedded system technologies) in 2010, and PhD in 2024 from Anna University. His main research interests include image processing, character recognition, and machine learning.
K. Visvaja received her B.E. in electronics and communication engineering from Mepco Schlenk Engineering College, Sivakasi, in 2024. She is currently employed at SmartDV Technologies, Bangalore. Her research areas include image processing, circuit design, and very large-scale integration technology.
A. Vidhya holds a B.E. in electronics and communication engineering from Mepco Schlenk Engineering College, Sivakasi, which she completed in 2024. She is currently employed as an information security analyst at Net Access India Ltd., Chennai. Her research interests include computer networking and image processing.
Arun
M., Visvaja K., and Vidhya A.
Department of Electronics and Communication Engineering, Mepco Schlenk Engineering College, Tamil Nadu, India; arun@mepcoeng.ac.in; nithiyaja@gmail.com; vidhyaarun225@gmail.com
ABSTRACT
Underwater visibility is often very poor due to low contrast and colour distortion due to the absorption and scattering of light in water. Enhancing the quality of these underwater images is crucial for marine researchers and divers, and for applications such as underwater robotics and navigation. However, implementing advanced image enhancement algorithms on resourceconstrained devices can be challenging due to limited computational power and memory. This research presents an investigation of traditional image enhancement algorithms – such as gamma cor, Gamma Correction, Histogram Equalization, Contrast Limited Adaptive Histogram Equalization (CLAHE), and Unsupervised Colour Correction Model (UCM) – applied to the Enhancing Underwater Visual Perception (EUVP) dataset and analyzes the feasibility of deploying these algorithms on resource constrained devices such as Raspberry Pi 3 and Raspberry Pi 4, which can be used to build a real-time edge device for underwater workers to enhance their visibility.
Keywords: Underwater; Image enhancement; Histogram equalization; CLAHE; UCM
Earth is often referred to as “the water planet” due to its vast ocean and seas, which cover approximately 71% of the planet’s surface; these water structures account for 96.5% of the water source on this planet. The underwater world is packed with aquatic life and diverse landscapes, from swaying kelp forests and one-metre-long sharks to sandy deserts and vibrant coral reefs. This diversity makes underwater imaging and research particularly fascinating. To capture the beauty of the underwater environment, it is essential to be properly equipped and underwater cameras are crucial for various applications, including underwater survey operations conducted using remotely operated vehicles (ROVs) and autonomous underwater vehicles (AUVs). These vehicles are equipped with cameras and high-performance embedded technologies for scanning and data collection.
However, exploring and developing the ocean’s undersea ecosystem is a tedious task and has many challenges. One significant challenge is the rapid decay of light energy with increasing water depth, which causes underwater images to predominantly appear blue or green. This is because different light wavelengths fade at varying rates in water. Also, underwater images often suffer from several quality issues, including light dispersion and absorption, low contrast, colour distortion, blurry details, and uneven illumination. Another common problem is “marine snow,” which consists of light backscattering from microscopic particles like sand and floating organic matter. These light spots vary in shape and size, introducing noise into the images.
Capturing clear images of the underwater ecosystem is challenging due to the presence of tiny debris and dust particles. Improving underwater images is a complex task because of the environment’s unique lighting conditions and the effects of wavelength-dependent absorption and scattering, such as forward and backward scattering. To address these problems, one approach involves using costly, specialized image-capturing technology. Another approach employs image processing techniques for image restoration and enhancement, which improves the resultant image’s display quality across a range of applications. These techniques aim to mitigate the various quality degradations that affect underwater images, making them more visually appealing and useful for various purposes. Figure 1 illustrates the process of capturing an underwater image.
Many research works have explored different methods to enhance underwater images.
For instance, Aguirre-Castro et al. [1] evaluated three different Retinex-based algorithms for image enhancement and implemented them on five different high performance embedded systems, concluding that the Multi-Scale Retinex with Colour Restoration (MSRCR) algorithm on the Jetson TX2 provided the best results. Another study by Kaichuan Sun et al. [2] proposed a Progressive Multi-Branch Embedding Fusion Network, which uses a triple attention module to focus on noisy regions and a two-branch hybrid encoderdecoder module to learn contextualized features. This significantly improved image
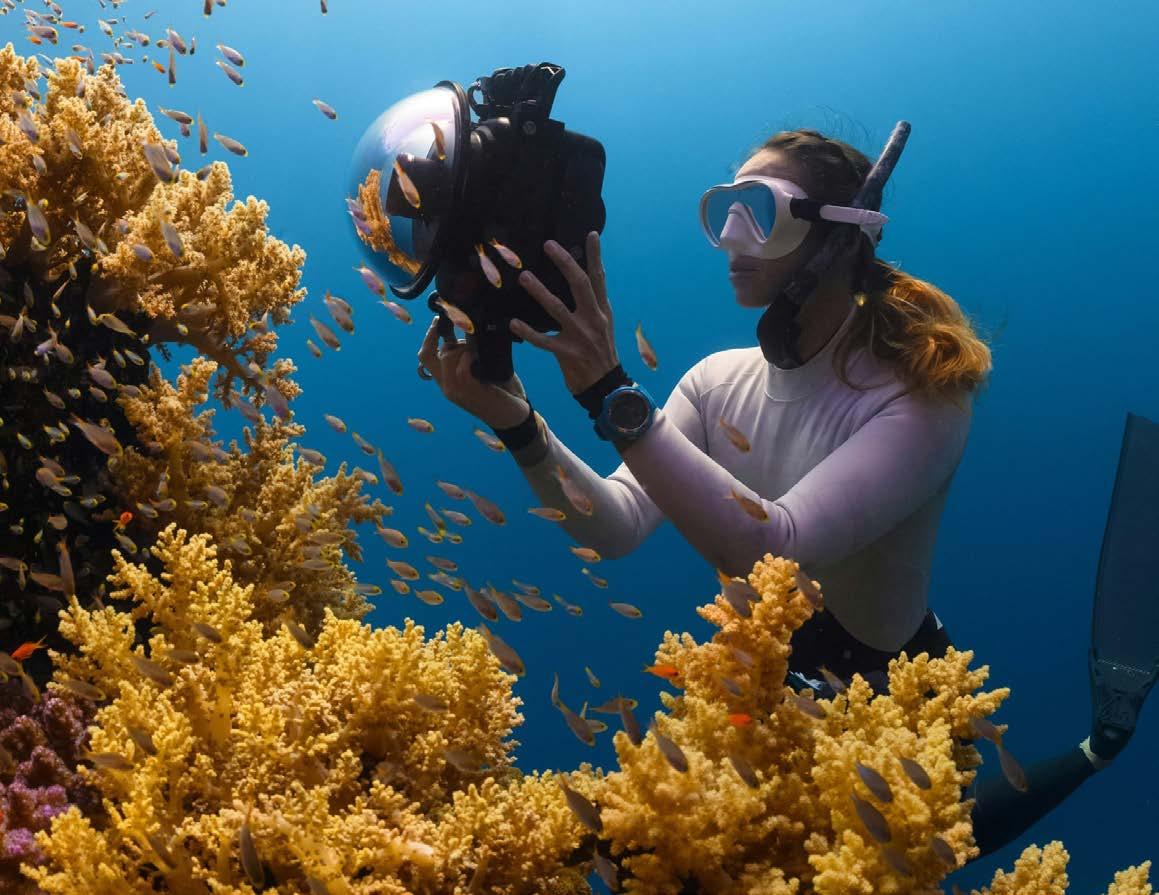
@AUTHORS
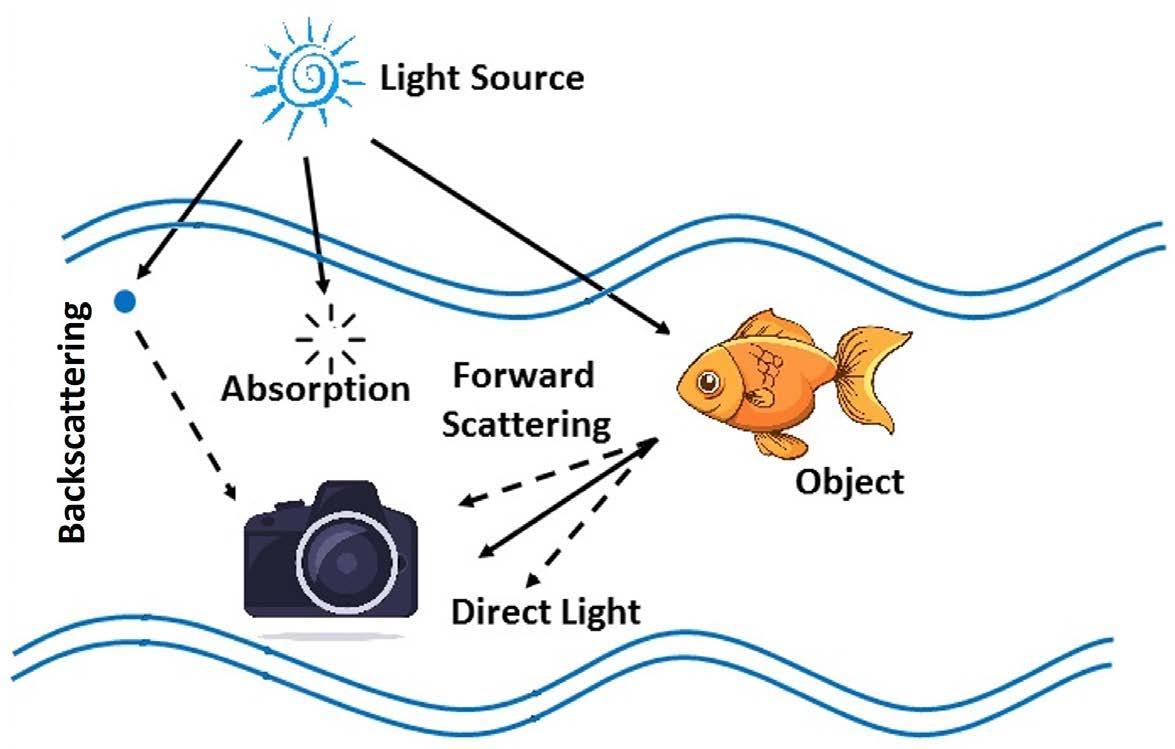
quality by addressing noise and distortion through a multi-stage refining framework.
Zhang et al. [3] introduced a colour correction and multi-scale fusion method that combines different characteristics to improve the overall visual quality of underwater images. Xiang et al. [4] developed a straightforward algorithm that considers the attenuation properties of different wavelengths, resulting in restored images with natural colour and contrast, and can process video in real time after Computer Unified Device Architecture acceleration. Indragandhi and Jawahar [5] have used efficient thread level parallelism for image processing applications by parallelizing the task efficiently and executing it on low power embedded devices.
Mohan et al. [6] proposed a technique that starts with a single input image and applies various operations like white balancing, gamma correction, sharpening, and weight map manipulation, followed by multi-scale image fusion to obtain the enhanced output. Lei et al. [7] focused on addressing blurring, low contrast, and colour distortion by combining MSRCR and Contrast Limited Adaptive Histogram Equalization (CLAHE), but their method has limitations in complexity and augmentation capabilities. Ding et al. [8] introduced a unified total variation method based on an extended underwater imaging model to eliminate dual-path light attenuation. They divided the enhancement process into two sub-problems with different optimization functions, aiming to remove light attenuation along the scene-sensor and surface-scene paths. Song et al. [9] developed a hierarchical probabilistic model combined with UNet to
generate multiple candidate images representing the uncertainty in enhancement. They also proposed an unsupervised reinforcement learning, fine-tuning framework to adapt the pre-trained model to changing underwater environments. Zhang et al. [10] introduced the Cascaded Network with Multi-level Subnetworks, which selectively cascades multiple sub-networks through triple attention modules to extract distinct features from underwater images, improving the network’s robustness and generalization capability. Priyadharshini et al. [11] used colour correction, contrast enhancement, homomorphic filtering, fusion, and contrast stretching techniques for underwater image enhancement.
Desai et al. [12] proposed AquaGAN, a generative model that uses attenuation coefficients as a clue for restoring degraded underwater images. They estimate the attenuation coefficients using learning-based techniques and combine content and style loss functions for effective restoration. Awan and Mahmood [13] introduced a method involving colour correction of the red and blue channels using the green channel, followed by feature extraction with Discrete Wavelet Transform and processing through a neural network called UW-Net for underwater image restoration. Song et al. [14] proposed a dual-model approach for underwater image enhancement, consisting of the Visual Perception Correction model and the Revised Imaging Network model. This dual-model outperformed seven state-of-the-art techniques, including multiple lines and levels of evidence, Haze-Lines, Hyper-Laplacian Reference Prior (HLRP), underwater convolutional neural
network, FUnIE-GAN, and Water-Net, in both qualitative and quantitative assessments.
Li et al. [15] highlighted the capabilities and limitations of cutting-edge algorithms through the proposed Water-Net and benchmark assessments, providing insights for future research in underwater image enhancement. Hu et al. [16] utilized a two-stage generative network structure to improve details and compensate for information loss during the enhancement process. Their algorithm demonstrated superiority in both subjective and aesthetic evaluations through various comparison and ablation tests. Lu et al. [17] significantly enhanced underwater image quality using the underwater denoising diffusion probabilistic model, which was trained on paired datasets and employed two U-Net networks for image denoising and distribution transformation. Fu and Cao [18] suggested using compressed-histogram equalization and global-local networks for additional enhancement and information compensation. Hu et al. [19] developed a threedimensional convolutional neural network for underwater colour image restoration, preserving the correlation of polarization information among various polarization channel images. Hu et al. [20] proposed a texture-aware and colour-consistent network that improves visual quality and shows high competitiveness in picture enhancement. Yi et al. [21] focused on extracting quality-conscious features related to colourfulness, contrast, and visibility, linking them to subjective scores for improved underwater images through a quality regression model. Shena et al. [22] introduced UUIE, a fully unsupervised convolutional neural network-based method using pseudo-
Retinex decomposition, which can be extended to image dehazing and low-light improvement. Ji et al. [23] proposed a multi-level pyramid integration approach to enhance underwater crab images, combining CLAHE for contrast improvement and underwater dark channel prior (UDCP) for fog removal, along with a crab target detection method based on the Mobile Center Net model. Zhou et al. [24] developed ULENet, which uses a new underwater visual cognition loss function and an iterative enhancement framework to improve visual quality through iterative training, supported by a newly built underwater dataset. Recently, Priyadharshini et al. [25] uses a method which employs a multi-scale weighted fusion technique that integrates colour compensation, homomorphic filtering, and L-channel histogram equalization to address common issues such as blurring and colour distortion in underwater images.
Based on the literature review, there are not many research works that discuss using embedded systems to improve underwater images, which also highlights the time taken for image enhancement using the device. This makes a research path for researchers to benchmark and optimize the performance of image enhancement algorithms across various edge devices. This paper’s main objective is to benchmark basic image enhancement techniques on resource constrained embedded systems for the creation of underwater exploration vehicles. Basic image processing algorithms have been used while machine learning methodologies have not been used as these algorithms will be simple and computationally efficient to implement them on a resource constraint edge device.
This section describes about the datasets used for this work and explains the basic image processing techniques for image enhancement.
Materials
The Enhancing Underwater Visual Perception (EUVP) dataset [26] is a popular benchmark dataset for the evaluation of underwater image enhancement algorithms. It contains paired and unpaired collections of underwater images. Paired datasets have been used which includes corresponding pairs of degraded and highquality (ground truth) images, which are useful for supervised learning tasks. This dataset captures a wide range of underwater scenes and conditions, making it suitable for generalizing enhancement models to diverse underwater environments. This dataset has three subdivisions; namely, Underwater Scenes, Underwater Imagenet, and Underwater Dark (pixel size of the images are different). This research work extensively uses all the three subdivisions. The dataset images are captured using seven different cameras, which include multiple GoPros, Aqua AUV’s uEye cameras, low-light USB cameras, and Trident ROV’s HD camera. Some sample images of the three subdivisional datasets are shown in Figure 2. Moreover, Table 1 shows the number of images present in the subdivisions of the paired dataset. Table 2 provides the specifications of the devices utilized in this study for calculating real-time processing times.
Images can be made lighter or darker, have contrast, or have undesirable features like colour cast removed using image
enhancement techniques [23]. Contrast stretching, gamma correction, histogram equalization, CLAHE, and Unsupervised Colour Correction Model (UCM) have been used in this research work and the following sections describes the methods.
Contrast stretching, also known as normalization, is a straightforward image enhancement technique designed to improve the contrast of an image. This method works by “stretching” the intensity values of the image to span the entire range of allowable pixel values for the given image type. By doing so, it enhances the visibility of features within the image, making it easier to distinguish between different elements. Equation (1) denotes the contrast stretching. (1)
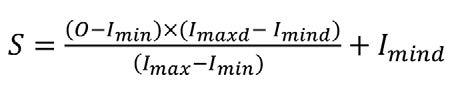
where S is the stretched pixel value, O is the original pixel value, Imin and Imax denote the minimum and the maximum intensity of an image, and Imind and Imaxd denote minimum and maximum desired intensity of an image. To preserve the proper colour ratio, the contrast stretching algorithm applies the same scaling to every channel in colour images.
Gamma correction adjusts the brightness of images to align with the nonlinear way human eyes perceive light and colour. Gamma encoding and decoding optimizes the use of bits by compressing the range of brightness values, ensuring that more bits are allocated to the darker tones and expands these values back to their original range for display
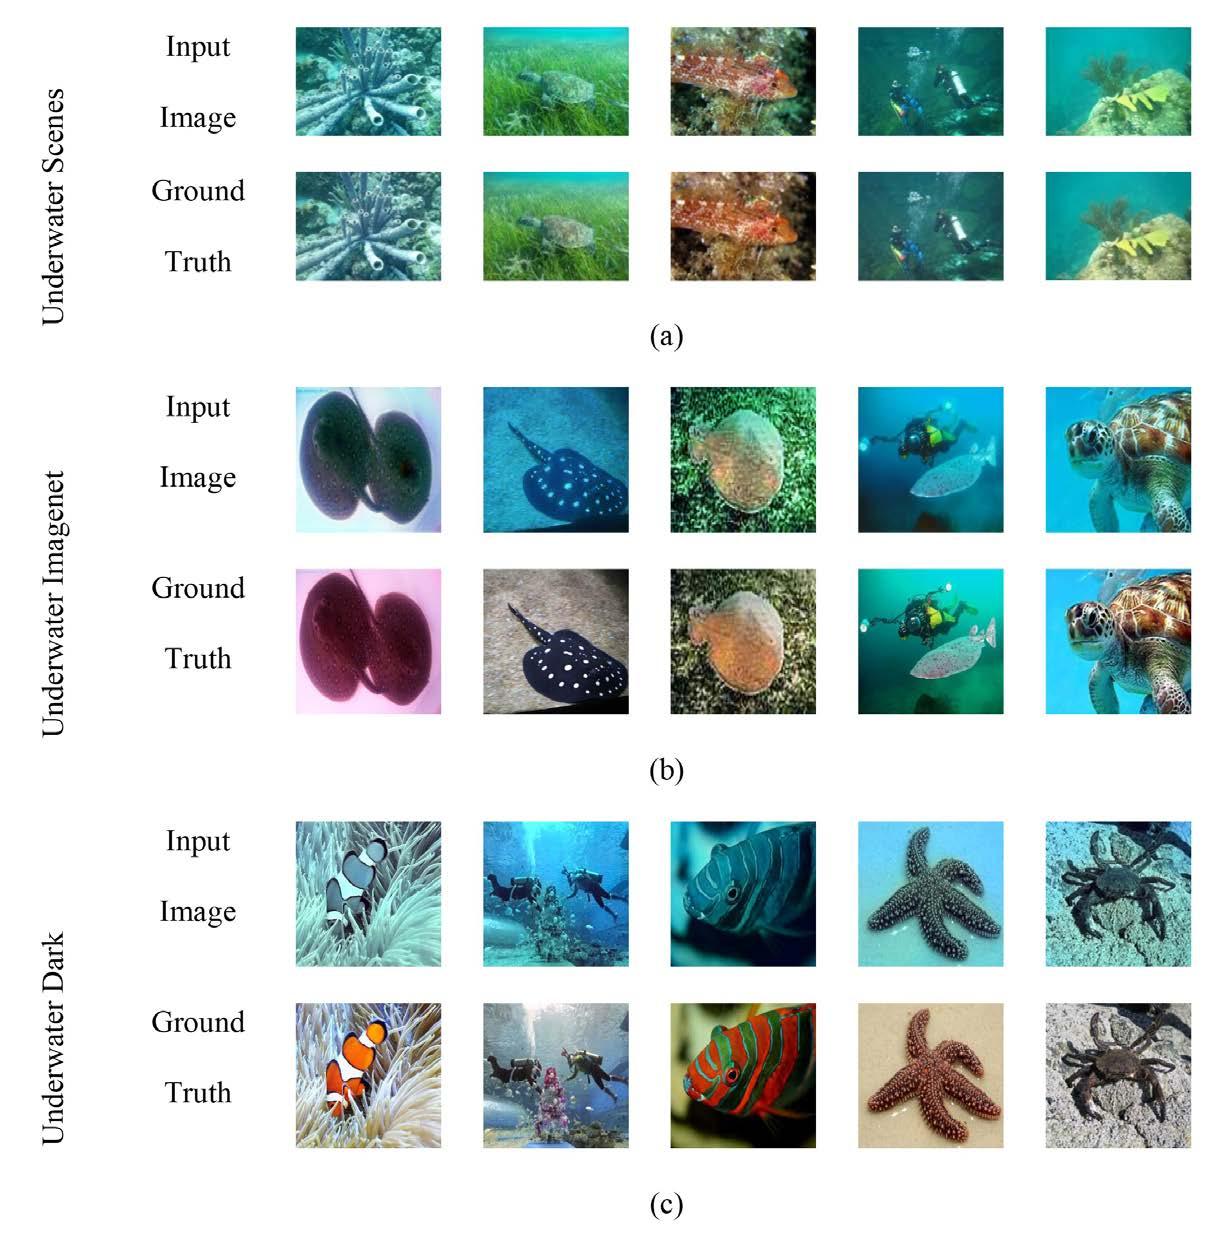

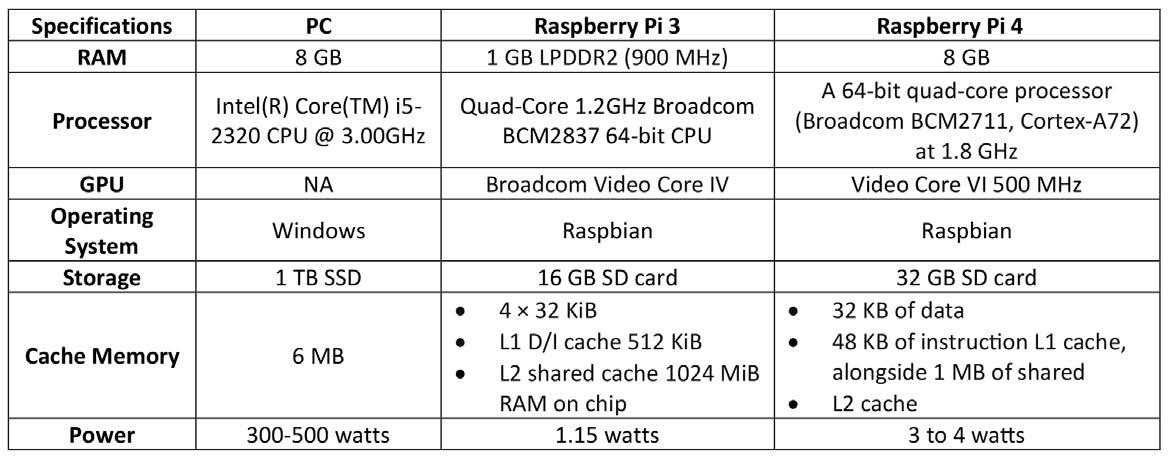
purposes, ensuring that the image appears natural to the human eye. It is expressed as in Equation (2).
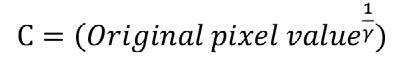
Where C = corrected pixel value and γ = gamma value.
Gamma value denotes the brightness of the image. When its value is greater than 1 it darkens the image; when its value is lesser than 1 it lightens the image.
Histogram Equalization
This technique entails adjusting pixel values over the whole intensity spectrum to improve the contrast of an image. In image processing, histogram equalization is a widely used contrast-enhancement technique due to its high efficiency and user-friendliness. This is a very sophisticated method that adjusts an image’s contrast and dynamic range by reshaping it to fit the intensity histogram’s proper structure. It may be separated into two branches based on the transformation function that is used.
Local Histogram Equalization (LHE)
LHE is more effective in enhancing the overall
contrast. The steps involved in this process are Histogram Calculation, Cumulative Distribution Function (CDF), and histogram equalization. The steps for calculating the LHE are shown in Figure 3.
Contrast Limited Adaptive Histogram Equalization
Another technique in image equalization is called Contrast Limited Adaptive Histogram Equalization, or CLAHE, and the process is mentioned in Figure 4. There are two parameters used in CLAHE.
• ClipLimit: Prior to reaching a contrast limit, it determines the maximum amount of contrast amplification that can be used in each area.
• tileGridSize: This determines how many tiles there are in each row and column. It is utilized when the image is separated into tiles.
The major parts involved here are Tile Crafting, Histogram Equalization, and Bilinear Interpolation. First the blurred image that is given as input is partitioned into segments called tile. Various clip limit and tile grid size is given to perform histogram equalization on each tile. The CDF that is calculated for
OUTPUT IMAGE
CONTRAST COLOUR OF GREEN COLOUR
CONTRAST CORRECTION OF SATURATION AND INTENSITY COMPONENTS (DARK AND LIGHT SIDES)
histogram values for each tile are scaled and mapped using the input image pixel values. Finally, bilinear interpolation is performed to produce improved contrast output.
Unsupervised Colour Correction Model (UCM)
Colour balancing, RGB, and hue-saturationintensity colour model contrast correction, and colour balancing form the basis of this technique. They effectively eliminate blue colour cast, enhance low red, and address low light issues to provide high-quality images suitable for scientific use. The flow representation is shown in Figure 5.
Performance metrics are essential instruments for assessing object detection models’ effectiveness and accuracy. These are calculated for the obtained output image and
CONTRAST CORRECTION OF
HSI MODEL CONTRAST CORRECTION
the corresponding ground truth image present in the dataset.
Peak-Signal-to-Noise-Ratio (PSNR)
PSNR is the relationship between a signal’s maximum value and the distortion noise power. A higher PSNR number indicates a better outcome. These could miss some kinds of artifacts since they are insensitive to even the smallest variations. They assess the produced image’s correctness.
(SSIM)
SSIM indicates how well the brightness, contrast, and structure of the output and reference picture match. A higher SSIM score indicates a better outcome. It has a value between 0 and 1. A score of 1 indicates the highest degree of resemblance between
the images, while a value of less than 0.7 indicates a lesser level of similarity.
These are used as a metric to quantify the amount of information. The higher the entropy value, the better the result.
Universal Image Quality Index (UIQI)
UIQI takes into account luminance, contrast, and structural similarity between original and enhanced images. The higher the UIQI value, the better the result. It is sensitive to large errors. Its value ranges from -1 to 1.
Mean Square Error (MSE)
MSE provides the quantitative measure of the average squared difference between pixel intensities in original and enhanced images. The lower the MSE value, the better the result.
The main aim of these underwater image enhancement methods is to determine which of the basic algorithms best enhances the underwater images even though many complex and advanced techniques are available. The five algorithms mentioned above are used to enhance the images and the different performance metrics are calculated for the obtained output image and the average value is mentioned in this research work.
The contrast stretching is executed in two distinct methods. In the first method, the minimum and maximum pixel values are determined individually for each image, and these unique values are used to perform
contrast stretching on that specific image. In the second method, the minimum and maximum pixel values are calculated across all images collectively, and these common values are then applied to perform contrast stretching uniformly across all images. Table 3 shows the average of performance metrics calculated for the EUVP dataset using contrast stretching.
We may conclude from the findings of contrast stretching that, even though both the methods yield similar kind of results, the performance metrics computed for the images in the dataset by considering the minimum and maximum pixel intensity for every image individually produces superior results. Considering the image enhancement using gamma correction, the performance measure is taken for various gamma values to choose the optimal gamma value for underwater image enhancement. Table 4 shows the performance metrics calculated for the EUVP dataset using gamma correction. From the findings, it is observed that gamma value ranges from 1.1 to 1.2 produces better results and the performance is better than that of the contrast stretching considering PSNR.
Table 5 shows the average of all the image performance metrics calculated for the EUVP dataset using histogram equalization.
The drawback of histogram equalization is when the image is divided into three channels – namely red, green, and blue – one of the colours becomes dominant and gives an unclear visual. In CLAHE, clip limit and grid size are varied to choose which output is clear both visually and theoretically. Both the clip limit and tile grid size values are chosen in a random way. Table 6 shows the average of all
Table 3: Performance metrics for contrast stretching algorithm. PSNR=peak signal-to-noise ratio. SSIM=structural similarity index measurement. UIQI=universal image quality index.
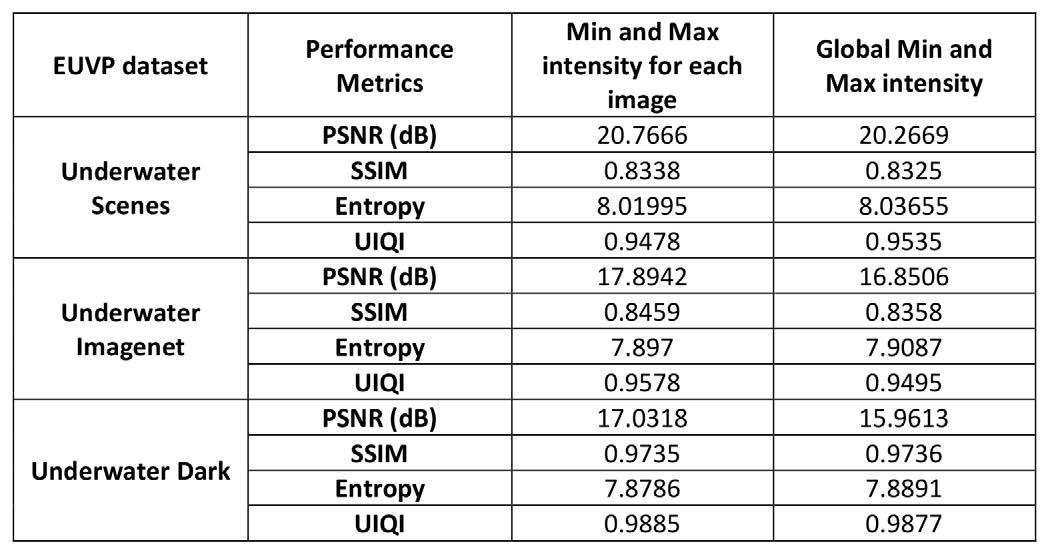
Table 4: Performance metrics for gamma correction algorithm. PSNR=peak signal-to-noise ratio. SSIM=structural similarity index measurement. UIQI=universal image quality index.
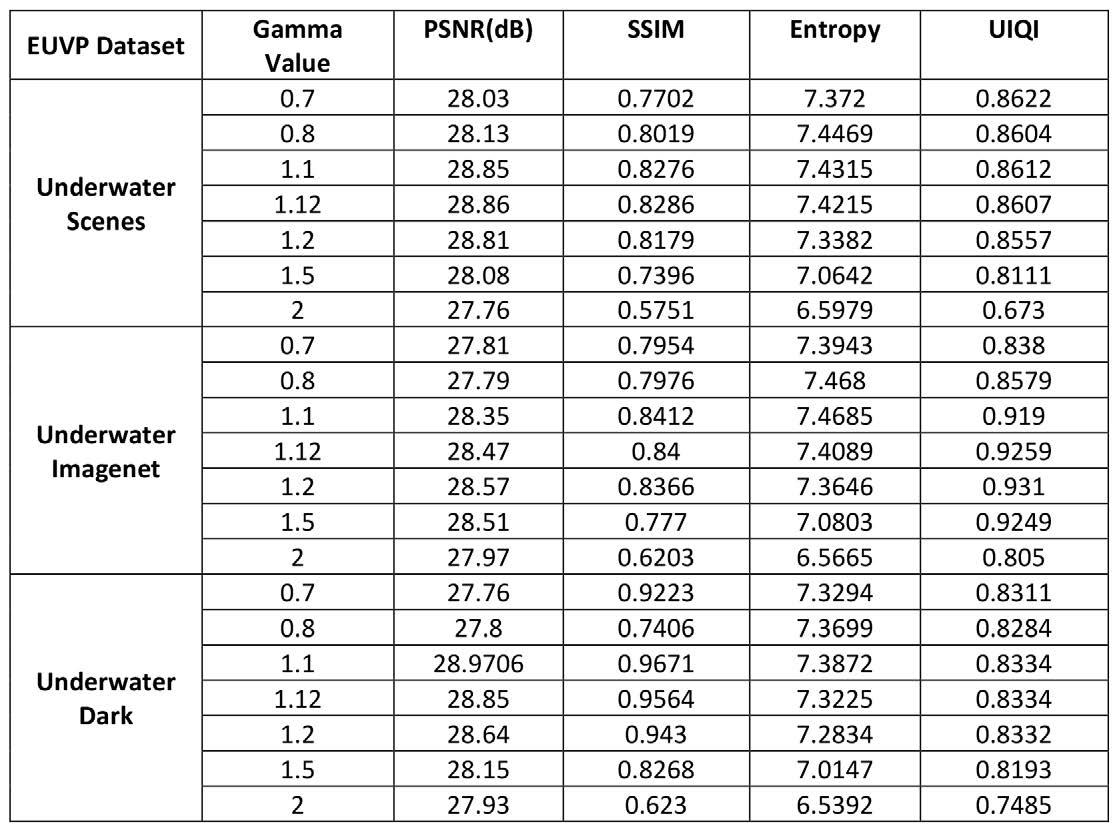
Table 5: Performance metrics for histogram equalization algorithm. PSNR=peak signal-to-noise ratio. SSIM=structural similarity index measurement. UIQI=universal image quality index.
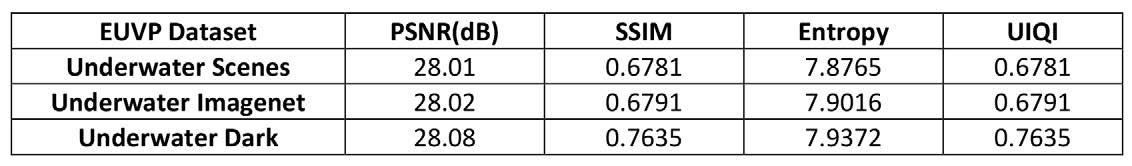
Table 6: Performance metrics for Contrast Limited Adaptive Histogram Equalization (CLAHE) algorithm. PSNR=peak signal-to-noise ratio. SSIM=structural similarity index measurement. UIQI=universal image quality index.
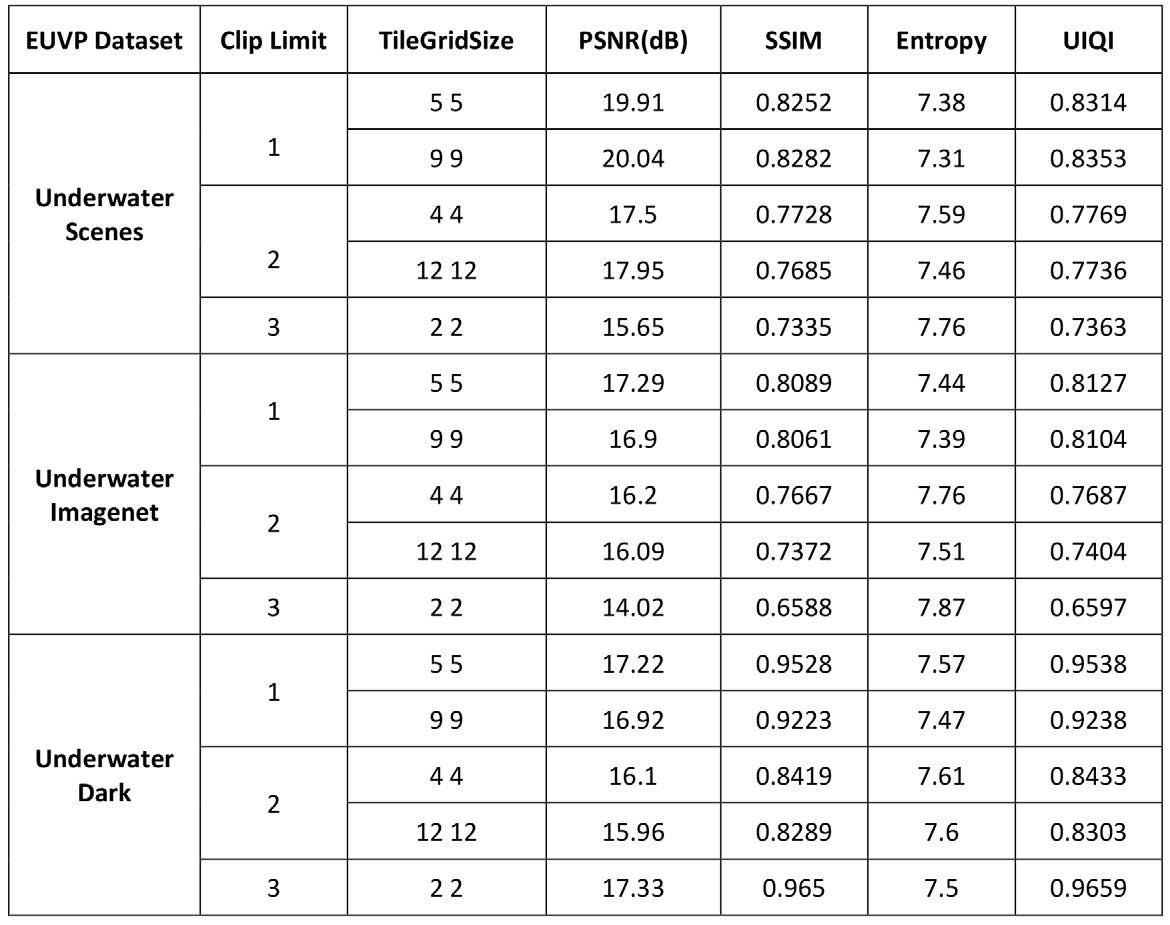
Table 7: Performance metrics for unsupervised colour correction model algorithm. PSNR=peak signal-to-noise ratio. SSIM=structural similarity index measurement. UIQI=universal image quality index.
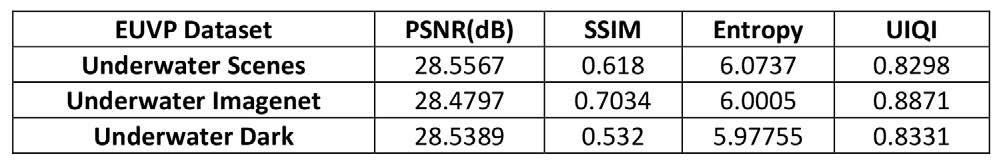
the image performance metrics calculated for the Underwater Scenes dataset using CLAHE.
From the above-mentioned performance metrics for CLAHE, we can say that, when clip limit is nearly equal to 1 and the grid size is small, the output will be better even though it is not very clear. Table 7 shows the average of all the image performance metrics calculated for Underwater Scenes dataset using UCM. Figure 6 shows the sample output images
obtained for Underwater Scenes dataset, Imagenet dataset, and Dark dataset for the optimized settings of the algorithms.
In all the enhanced images, the colour component restoration is not considered since the main objective of this project is enhancement rather than restoration.
Considering the processing time taken on the resource unconstrained and constrained
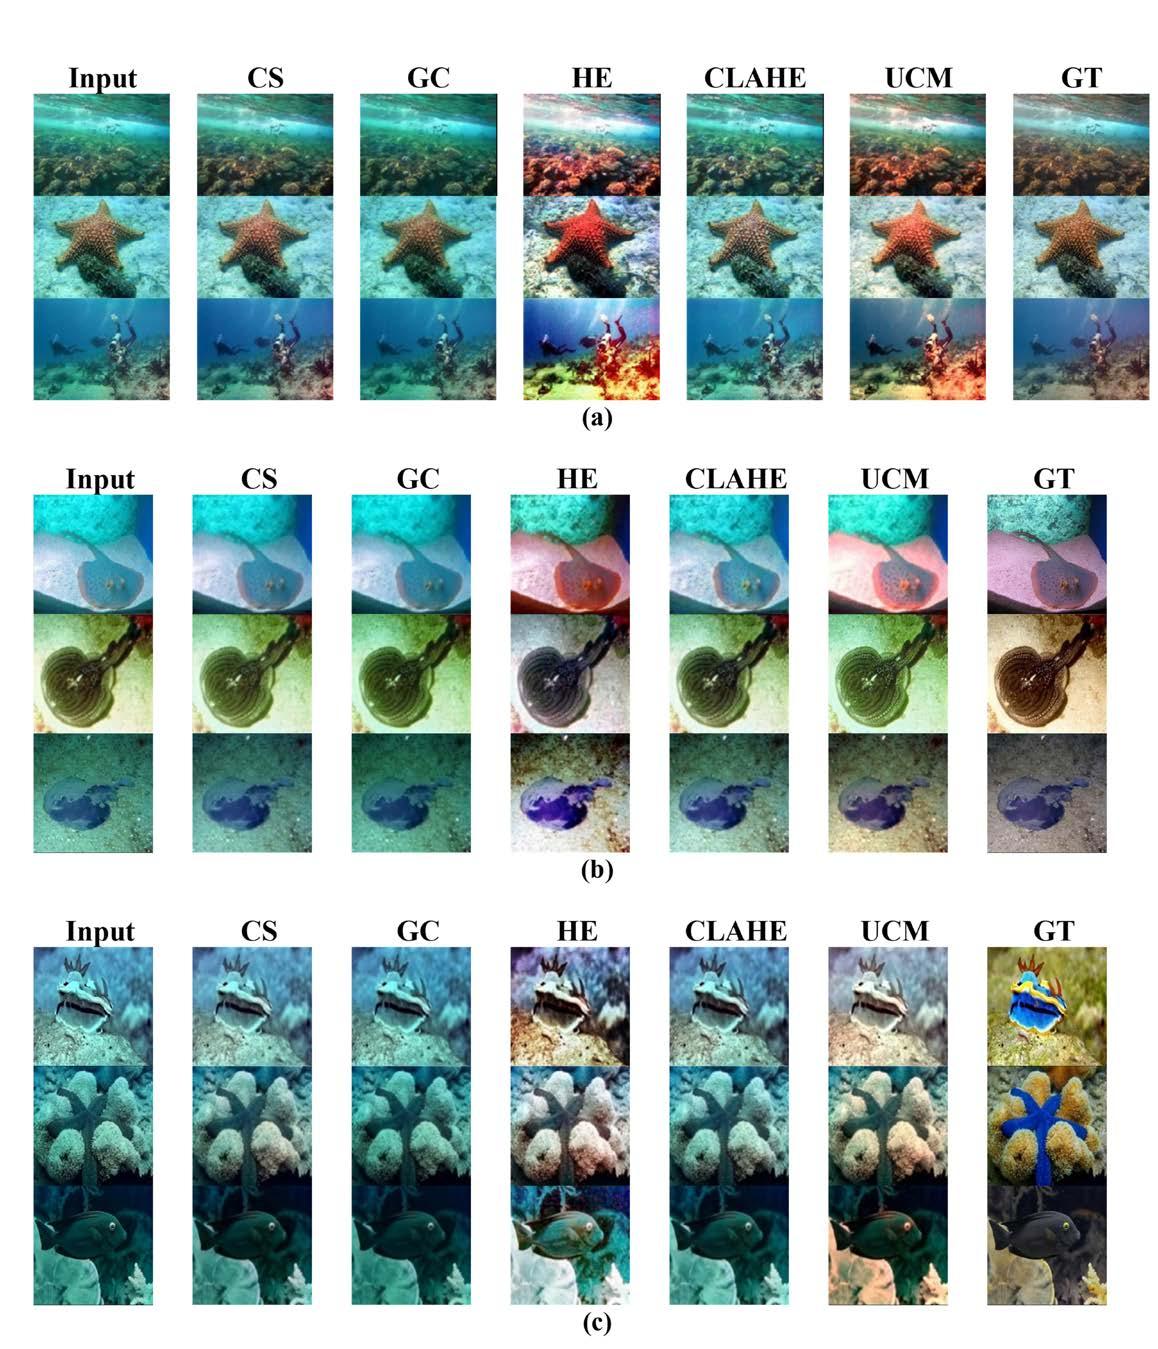
devices, two different times have been clocked on these devices. T1 is the average time taken to read one input image, enhance it, and save it back in the file system. T2 is the average time taken for enhancement of a single image. The saving time is also considered as it will have effects on real-time image processing. For all the experimentations, the highest PSNR
setting from every algorithm is taken as the image enhancement method. Table 8 shows the average time taken in different devices to enhance a single image using the five different basic image enhancement algorithms.
From Table 8, it can be understood that the execution time of the algorithms is dependent
Table 8: Average time taken in different devices using different basic image enhancement methods. CS=Contrast Stretching. GC=Gamma Correction. HE=Histogram Equalization. CLAHE=Contrast Limited Adaptive Histogram Equalization. UCM=Unsupervised Colour Correction Model.
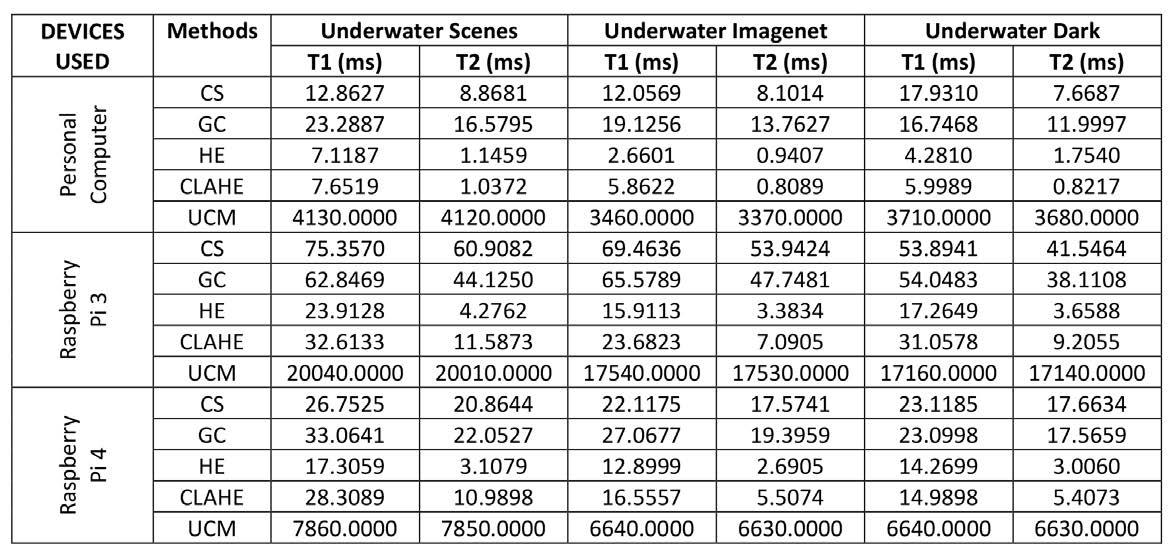
on the image size as the time taken for Underwater Scenes are slightly higher than that of the other two datasets. Also, it is noted that contrast stretching and gamma correction takes nearly the same amount of time whereas histogram equalization and CLAHE take similar amounts of time. But the execution time of UCM is high even on a personal computer (PC). It nearly takes 3-4 seconds for a single image on PC whereas on the resource constrained devices it takes 17-20 seconds on Raspberry Pi 3 and 6-8 seconds on Raspberry Pi 4. So, it can be determined that, to work in real time, the low-cost resource constraint devices can be deployed using gamma correction and contrast stretching. UCM cannot be used as this algorithm requires a lot of resources.
In this work, the performance of five different traditional image processing algorithms is tested on the entire EUVP dataset and different analyses are done. It is noted that
the PSNR of all the algorithms, except the CLAHE algorithm, is more or less equal. The timings for the image enhancement are also calculated on three different devices and it is noted that UCM requires a lot of time for the enhancement of images. Also, it is noted that none of the image processing algorithms in this work restores the colour of the image.
For divers, when an edge device is designed in the future, it is possible to improve their vision by implementing image enhancement by histogram equivalization algorithm in Raspberry Pi 3 or Raspberry Pi 4 as the timing of image enhancement is less and can be implemented on videos of 30 frames per second. But it is also noted that implementation of UCM algorithm on an edge device using Raspberry Pi is time consuming. Also, traditional image processing techniques may not be suitable for underwater image capturing embedded devices. In the future, advanced deep learning techniques can be implemented in multicore resource constrained devices to get clear images in real time.
1. Aguirre-Castro, O.A.; García-Guerrero, E.E.; LópezBonilla, O.R.; Tlelo-Cuautle, E.; López-Mancilla, D.; Cárdenas-Valdez, J.R.; Olguín-Tiznado, J.E.; and Inzunza-González, E. [2022]. Evaluation of underwater image enhancement algorithms based on Retinex and its implementation on embedded systems. Neurocomputing, Vol. 494, pp. 148-159. https://doi.org/10.1016/j.neucom.2022.04.074.
2. Sun, K.; Meng, F.; and Tian, Y. [2022]. Progressive multi-branch embedding fusion network for underwater image enhancement. Journal of Visual Communication and Image Representation, Vol. 87, 103587. https://doi.org/10.1016/j.jvcir.2022.103587.
3. Zhang, D.; He, Z.; Zhang, X.; Wang, Z.; Ge, W.; Shi, T.; and Lin, Y. [2023]. Underwater image enhancement via multi-scale fusion and adaptive color-gamma correction in low-light conditions Engineering Applications of Artificial Intelligence, Vol. 126, 106972. https://doi.org/10.1016/j.enga ppai.2023.106972.
4. Xiang, W.; Yang, P.; Wang, S.; Xu, B.; and Liu, H. [2018]. Underwater image enhancement based on red channel weighted compensation and gamma correction model. Opto-Electronic Advances, Vol. 1, No. 10, pp. 1800 2401-18002409. https://doi. org/10.29026/oea.2018.180024.
5. Indragandhi, K. and Jawahar, P.K. [2020]. An application based efficient thread level parallelism scheme on heterogeneous multicore embedded system for real time image processing. Scalable Computing: Practice and Experience, Vol. 21, No. 1, pp. 47-56. https://doi. org/10.12694/scpe.v21i1.1611.
6. Mohan, S. and Simon, P. [2020]. Underwater image enhancement based on histogram manipulation and multiscale fusion. Procedia Computer Science, Vol. 171, pp. 941-950. https://doi.org/10.1016/j.procs.202 0.04.102.
7. Lei, X.; Wang, H.; Shen, J.; Chen, Z.; and Zhang, W. [2024]. A novel intelligent underwater image enhancement method via color correction and contrast stretching. Microprocessors and Microsystems, Vol. 107, 104040. https://doiorg/10.1016/j.micpro.2021.104040.
8. Ding, X.; Wang, Y.; Liang, Z.; and Fu, X. [2022]. A unified total variation method for underwater image enhancement. Knowledge-Based Systems, Vol. 255, 109751. https://doi.org/10.1016/j.knosys.2022.109 751.
9. Song, W.; Shen, Z.; Zhang, M.; Wang, Y.; and Liotta, A. [2024]. A hierarchical probabilistic underwater image enhancement model with reinforcement tuning. Journal of Visual Communication and Image Representation, Vol. 98, 104052. https://doi.org/10. 1016/j.jvcir.2024.104052.
10. Zhang, D.; Wu, C.; Zhou, J.; Zhang, W.; Lin, Z.; Polat, K.; and Alenezi, F. [2024]. Robust underwater image enhancement with cascaded multi-level sub-networks and triple attention mechanism. Neural Networks, Vol. 169, pp. 685-697. https://doi.org/10.1016/j. neunet.2023.11.008.
11. Ahila Priyadharshini, R. and Ramajeyam, K. [2023]. A combined approach of color correction and homomorphic filtering for enhancing underwater images. Computational Intelligence in Pattern Recognition, pp. 475-487. https://doi.org/10.1007/ 978-981-99-3734-9_39.
12. Desai, C.; Reddy, B.S.; Tabib, R.A.; Patil, U.; and Mudenagudi, U. [2022]. Aquagan: restoration of underwater images. IEEE/CVF Conference on Computer Vision and Pattern Recognition Workshops (CVPRW). https://doi.org/10.1109/cvprw56347. 2022.00044.
13. Awan, H.S. and Mahmood, M.T. [2024]. Underwater image restoration through color correction and UW-net. Electronics, Vol. 13, No. 1, 199. https://doi. org/10.3390/electronics13010199.
14. Song, H.; Chang, L.; Wang, H.; and Ren, P. [2023]. Dual-model: revised imaging network and visual perception correction for underwater image enhancement. Engineering Applications of Artificial Intelligence, Vol. 125, 106731. https://doi.org/10. 1016/j.engappai.2023.106731.
15. Li, C.; Guo, C.; Ren, W.; Cong, R.; Hou, J.; Kwong, S.; and Tao, D. [2020]. An underwater image enhancement benchmark dataset and beyond. IEEE Transactions on Image Processing, Vol. 29, pp. 43764389. https://doi.org/10.1109/tip.2019.2955241.
16. Hu, K.; Weng, C.; Shen, C.; Wang, T.; Weng, L.; and Xia, M. [2023]. A multi-stage underwater image aesthetic enhancement algorithm based on a generative adversarial network. Engineering Applications of Artificial Intelligence, Vol. 123, 106196. https://doi.org/10.1016/j.engappai.2023. 106196.
17. Lu, S.; Guan, F.; Zhang, H.; and Lai, H. [2023]. Underwater image enhancement method based on denoising diffusion probabilistic model. Journal of Visual Communication and Image Representation, Vol. 96, 103926. https://doi.org/10.1016/j.jvcir.20 23.103926.
18. Fu, X. and Cao, X. [2020]. Underwater image enhancement with global-local networks and compressed-histogram equalization. Signal Processing: Image Communication, Vol. 86, 115892. https://doi.org/10.1016/j.image.2020.115892.
19. Hu, H.; Huang, Y.; Li, X.; Jiang, L.; Che, L.; Liu, T.; and Zhai, J. [2022]. UCRNet: underwater color image restoration via a polarization-guided convolutional neural network. Frontiers in Marine Science, Vol. 9. https://doi.org/10.3389/fmars. 2022.1031549.
20. Hu, S.; Cheng, Z.; Fan, G.; Gan, M.; and Chen, C.L.P. [2024]. Texture-aware and color-consistent learning for underwater image enhancement. Journal of Visual Communication and Image Representation, Vol. 98, 104051. https://doi.org/10.1016/j.jvcir.2024.104051.
21. Yi, X.; Jiang, Q.; and Zhou, W. [2024]. No-reference quality assessment of underwater image enhancement. Displays, Vol. 81, 102586. https://doi.org/10.1016/j. displa.2023.102586.
22. Shen, Z.; Xu, H.; Jiang, G.; Yu, M.; Du, B.; Luo, T.; and Zhu, Z. [2023]. Pseudo-retinex decompositionbased unsupervised underwater image enhancement and beyond. Digital Signal Processing, Vol. 137, 103993. https://doi.org/10.1016/j.dsp.2023.103993.
23. Ji, W.; Peng, J.; Xu, B.; and Zhang, T. [2023]. Realtime detection of underwater river crab based on multi-scale pyramid fusion image enhancement and mobilecenternet model. Computers and Electronics in Agriculture, Vol. 204, 107522. https://doi.org/10.1 016/j.compag.2022.107522.
24. Zhou, W.-H.; Zhu, D.-M.; Shi, M.; Li, Z.-X.; Duan, M.; Wang, Z.-Q.; Zhao, G.-L.; and Zheng, C.-D. [2022]. Deep images enhancement for turbid underwater images based on unsupervised learning. Computers and Electronics in Agriculture, Vol. 202, 107372. https://doi.org/10.1016/j.compag.2022.107372.
25. Priyadharshini, R.A.; Arivazhagan, S.; Pavithra, K.A.; and Sowmya, S. [2024]. An ensemble deep learning approach for underwater image enhancement. E-Prime – Advances in Electrical Engineering, Electronics and Energy, Vol. 9, 100634. https://doi. org/10.1016/j.prime.2024.100634.
26. Islam, M.J.; Xia, Y.; and Sattar, J. [2020]. Fast underwater image enhancement for improved visual perception. IEEE Robotics and Automation Letters, Vol. 5, No. 2, pp. 3227-3234. https://doi.org/10.1109/ lra.2020.2974710.
by Victoria Preston, Pushyami Kaveti, Dennis Giaya, Aniket Gupta, Mae Lubetkin, Timothy M. Shank, Hanumant Singh, and Daniel J. Fornari
High-resolution imagery of seafloor hydrothermal systems contains information about diverse benthic geological and geochemical processes, biological and microbial community structure, and high- and low-temperature fluid circulation through the upper oceanic crust. Hydrothermal vent fluid flux creates distinct features on the seafloor that evolve over time through growth and collapse of massive sulfide rich deposits influencing habitat development, biodiversity, and temporal changes in vent chemistry. Images converted into interactive 3D reconstructions have been used to provide qualitative assessment of seafloor vent sites and complementary insights about the spatial distribution and textures of sulfides, basalts, sediments, faunal communities, and fluids that can be correlated to physical sample collections at the site. Performing quantitative analyses, such as computing volume, rugosity, and surface area of distinct habitats, requires access to high-quality reconstructions that are scale- and colour-consistent within some bounded certainty.
Modern underwater imaging systems consist of camera(s) capable of capturing still imagery at approximately 5-10 second intervals or video at 4K or better resolutions in full colour, illuminated with constellations of low-power highintensity light-emitting diode (LED) lighting, or high-intensity (300-600 W) strobes synchronized to the camera’s shutter. For automated processing of imagery into scientifically viable 3D reconstructions using these systems, several key operational practices need to be adopted: camera calibration, documenting imaging system configuration, and comprehensive data collection techniques in the field.
Collecting images of calibration targets (e.g., checkerboards) with the imaging system prior to field operations is a key requirement. Calibration imagery allows for intrinsic properties of cameras, such as the lens and sensor characteristics, to be computed. This information can subsequently be used to correct geometric distortions in images and recover metric scale. As the light spectrum is attenuated significantly and nonlinearly underwater, recovering
*Non-peer-reviewed
metric scale is critical for correcting false-colour bias and inconsistency in imagery collected at different distances between a camera and target.
Implicit in collecting useful calibration data is the need for fixed and documented camera settings, including focal length, exposure, and zoom. Imaging systems deployed on remotely operated or human occupied vehicles are often manually adjusted throughout a dive mission; however, without matching calibration data for the camera settings used, the images will be of limited utility for reconstruction work. Documenting deployment configurations of camera(s) and light(s) – relative distances/angles between assets, camera and housing specifications, and light specifications – provides information that modern reconstruction methods can utilize for colour correction, scale recovery, and multi-view image blending.
Images suitable for 3D reconstruction will contain overlapping views of structural features at a resolution commensurate with scientific queries and provide a basis for computing a well-defined projective transformation between camera locations and a seafloor feature. Systematic “scanning,” that is, performing planar transects at a seafloor site as illustrated in Figure 1, is
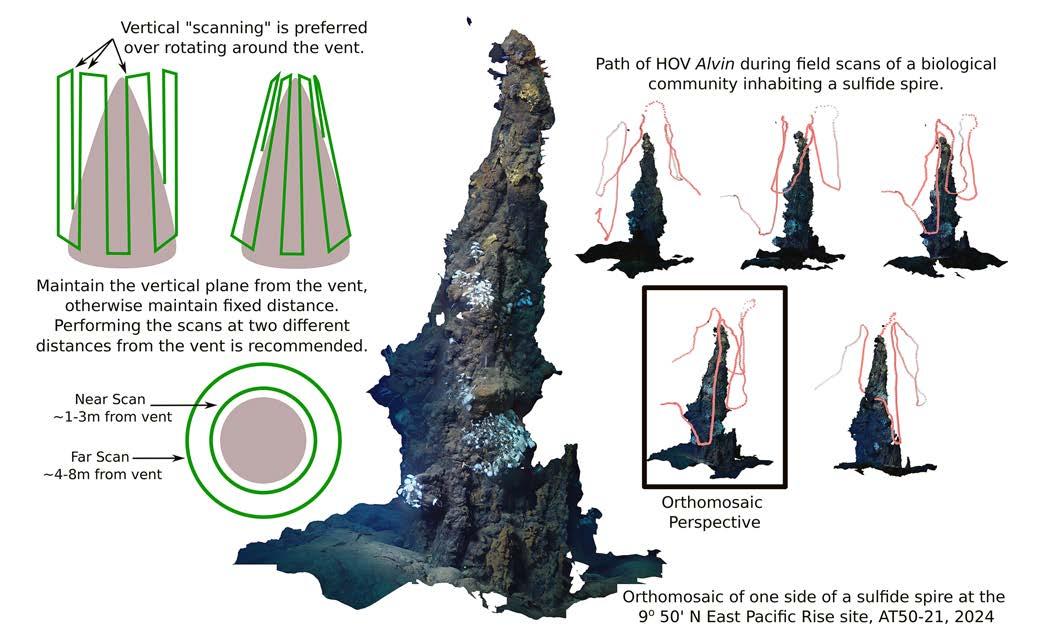
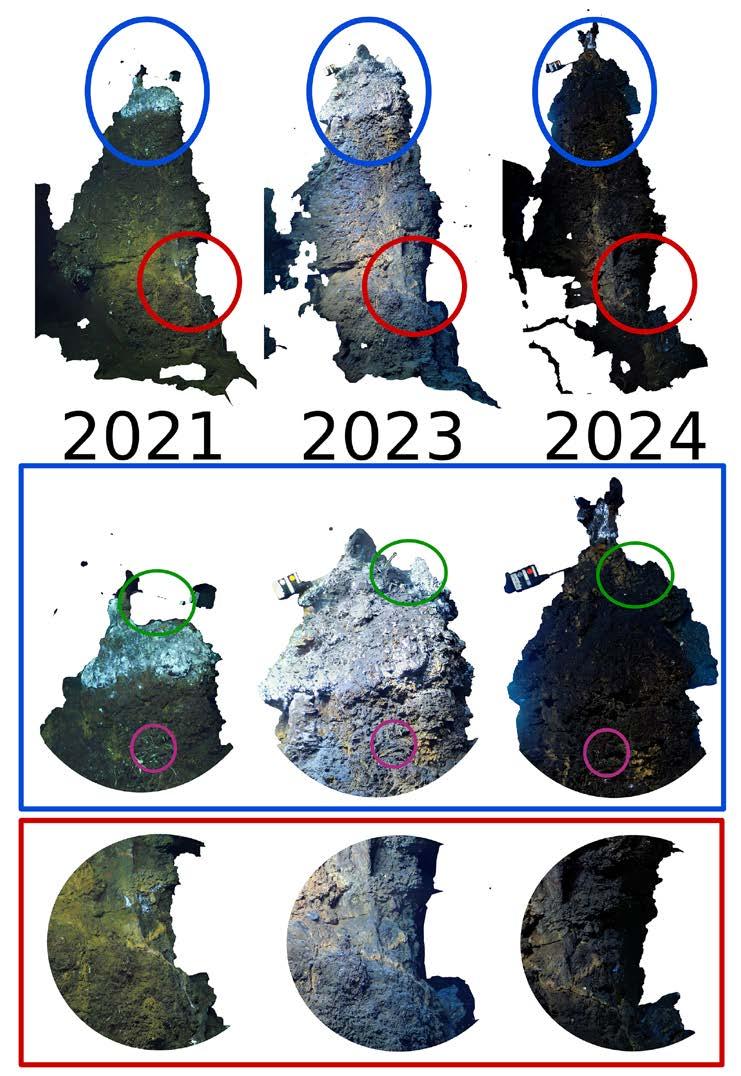
Figure 2: Imagery of V Vent, 9°50’N East Pacific Rise, as collected in 2021 (RR2102), 2023 (AT50-07), and 2024 (AT50-21) using MISO cameras mounted on HOV Alvin and ROV Jason. Reconstructions are computed using Agisoft Metashape and orthomosaics of one face of the vent are provided in the top row. Excerpts from each mosaic are circled in blue and red, and highlighted in matching boxes. In blue, the top of the vent structure over time is shown, with corresponding sites between each mosaic highlighted in purple and green. The top of the vent structure has changed in volume, shape, and surface composition over time. In red, a lower region of the vent with distinctive colour pattern is shown between the mosaics, illustrating both how lighting and collection differences between years yields different colour character and reconstruction detail.
recommended to meet both of these criteria. Scanning yields imagery from which a unique geometric relationship between points on a structure can be computed, improving reconstruction quality and confidence. In contrast, a common aesthetic filming strategy of panning a stationary camera to view a structure creates a set of images with ambiguous feature relationships, leading to a suboptimal 3D projection. In addition to scanning technique, placing markers of known size in the field of view is good practice. Manually measuring natural features directly is also helpful for recovering or confirming calibrated metric scale, especially if utilizing only monocular camera systems.
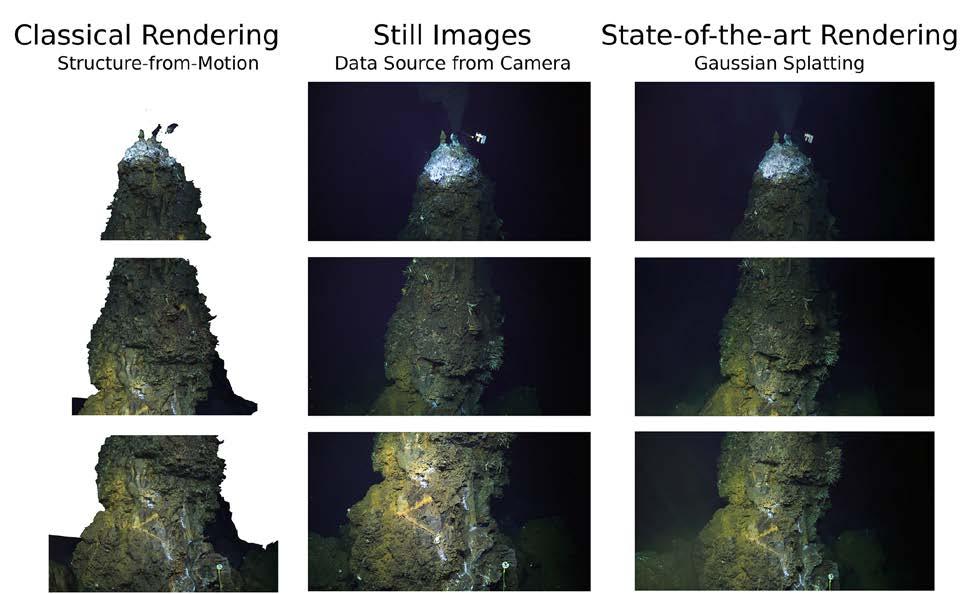
3: Still images from a MISO camera mounted on ROV Jason during R2102 (2021) of V Vent, 9°50’N East Pacific Rise (centre) are compared to a classical structure-from-motion technique (left) and a state-of-the-art rendering technique for 3D reconstructions (right). The state-of-the-art technique is able to capture finer, photorealistic detail than the classical method; in particular, the fine structure of the vent tag, friable chimney and ventilating smoke, and fauna is sharply rendered and free-standing, as opposed to smoothed away or interpolated onto the main vent structure.
As a consequence of access to reconstructions with high-quality metric and colour consistency, evolving morphological changes to the seafloor over different temporal scales (e.g., single field campaign, over multiple expeditions) can be measured. Habitat colonization and succession, hydrothermal vent growth and collapse, and boundaries of diffuse flow can be tracked to enhance understanding of causal links between physical, chemical, and biological phenomena. In illustration of tracking evolving changes, selected imagery of V Vent at the East Pacific Rise axis between 9°47’50’N from 2021, 2023, and 2024 were used to create 3D reconstructions and orthomosaics as shown in Figure 2. The history of this vent, reconstructed in these snapshots, shows structural collapse and growth, changes to orifice character, and evolution of surface habitat and colour distribution.
Temporal change detection in 3D reconstructions is a nascent field in computer vision, and state-of-the-art reconstruction techniques have largely been developed for in-air systems and contexts. Innovating these techniques for underwater scenes is a promising emergent research path to study mesh alignment, calibration of uncertainty, and space-time morphological modelling. In Figure 3, imagery of V Vent collected during a 2021 field campaign is used to compute both a classical structure-from-motion (SfM) 3D model and a 3D rendering using a modern technique called Gaussian splatting (GS). SfM techniques use discrete elements, like vertices and polygons, to
form meshes. As a result, these methods tend to “smooth” fine textures. In contrast, methods like GS use continuous implicit surface representations, such as many overlapping Gaussian distributions, to represent complex geometries and are designed to iteratively optimize the position, number, and size of elements to capture fine details and render coherent photorealistic views of a reconstructed model.
Adoption and improvement of modern methods for underwater imagery promises to enhance the quality of analytical measurements that can be computed from field imagery. For deep ocean sciences, the ability to use cameras as analytical sensors for long-term monitoring will provide access to unique information that is challenging or impossible to collect using other common instrumentation, yielding new insights about biogeochemical cycling and geological events at dynamic seafloor sites such as hydrothermal vents along the global mid-ocean ridges.
Dr. Victoria Preston is an assistant professor of engineering at Olin College, with an expertise in field robotics and spatiotemporal modelling in deep ocean systems. Dr. Pushyami Kaveti is a postdoctoral researcher at Northeastern University, with an expertise in field robotics and computer vision. Dennis Giaya is a graduate student at Northeastern University, specializing in field robotics. Aniket Gupta is a graduate student at Northeastern University, specializing in the intersection of computer vision, machine learning, and robotics. Mae Lubetkin is an independent researcher with expertise in marine geosciences, deep ocean sensing, and critical media studies. Dr. Timothy M. Shank is an associate scientist with tenure in the Biology Department at the Woods Hole Oceanographic Institution with expertise in deep-sea faunal ecology and evolution. Prof. Hanumant Singh leads the Field Robotics Laboratory at Northeastern University and has expertise in field robotics with an emphasis on localization, mapping, and imaging in the marine, polar, and aerial domains. Dr. Daniel J. Fornari is an emeritus research scholar in the Geology and Geophysics Department at the Woods Hole Oceanographic Institution, with expertise in volcanic and hydrothermal processes at mid-ocean ridges, structure and magmatic processes occurring in oceanic transforms and at oceanic islands, and in deep-sea imaging.
by Dennis Giaya, Victoria Preston, Pushyami Kaveti, Aniket Gupta, Jasen Levoy, Daniel J. Fornari, and Hanumant Singh
Marine robotic platforms equipped with advanced camera and lighting systems have become essential tools for exploration of the deep ocean. The terabytes of high-resolution imagery that these platforms acquire of the seafloor and water column provide rich documentation of processes that are relevant to the fields of marine archaeology, biology, chemistry, geology, and their intersections. Modern computer vision techniques can synthesize a 3D structure of a scene from a sequence of images, subsequently supporting quantitative investigation of study sites. Scientific queries about the volume, area, texture, and colour of target substrates or habitats can be computed using 3D models, but are only meaningful when the model accuracy can be quantified and uncertainties constrained. For time-series analyses of a site, model formation consistency becomes equally important to model accuracy. The pre-requisite and principal contributor to the quality of a reconstructed scene is an accurate calibration of the camera and lighting systems on board the imaging platform. This article discusses the calibration procedure and the relevant considerations for a monocular camera system, a stereo camera system, and the lighting system of an underwater imaging platform to optimize documentation protocols and utilization of the imagery.
The camera model relates 3D world points to their 2D image counterparts, a prerequisite to extract quantitative measurements from field images. It consists of both the intrinsic matrix – focal length, principal point, and lens distortion coefficients – and the extrinsic matrix – geometric position and orientation of the camera. A typical procedure for calibration involves imaging multiple views of a planar calibration target with easily detectable points of known dimensions. For underwater cameras, this imaging procedure must be conducted underwater. Examples of targets and calibration set-up are shown in Figure 1. As the target is planar and its dimensions are known, nonlinear optimization methods such as Levenberg-Marquardt can be used to solve for the camera matrix that relates them to their corresponding detections in the 2D image.
*Non-peer-reviewed
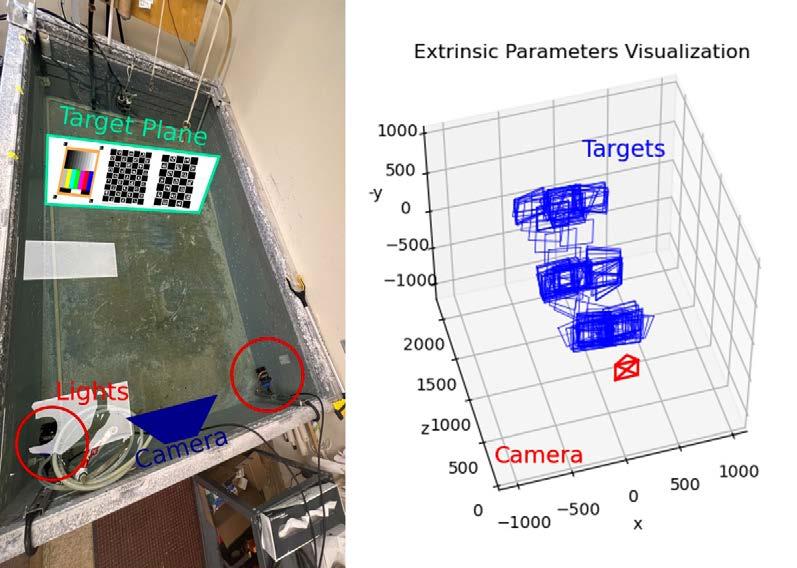
Underwater cameras, composed of a camera and external housing, pose a unique field calibration challenge as common operational servicing of a camera that involves opening the housing will change the camera-housing configuration and require an updated calibration. To illustrate, a controlled experiment collecting calibration imagery before and after a camera was removed and then reseated within its housing was conducted. Small but significant changes in the calibration parameters were computed; further, by applying the calibration parameters computed before opening the housing to the images collected after the camera was serviced, the reprojection error increased by an order of magnitude compared to using the correctly matched parameters (Figure 2). While performing calibrations whenever a camera is removed from its housing is preferred, this may not be operationally feasible. An imperfect, but suitable, alternative would be to allow the optimization process responsible for the scene reconstruction to also refine an initial estimate of the intrinsic parameters from a previous calibration.
A monocular camera system consists of a single camera on the imaging platform. Marine robotics platforms may carry multiple cameras that are all operated independently and asynchronously, each of which can then be treated as a monocular camera. With a proper intrinsic calibration, images from a single camera can be used to reconstruct a scene up to an arbitrary scale factor, allowing relative sizes of objects to be compared within the reconstruction. However, if reconstructions of the same scene are built
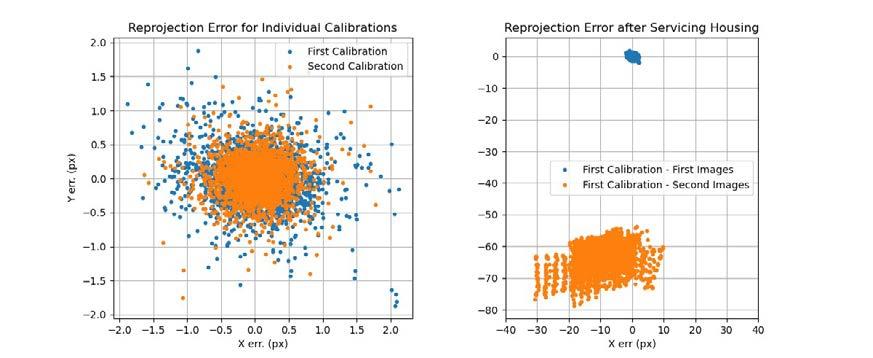
Figure 2: Calibration results of an underwater camera in a housing with a non-planar lens before and after servicing the housing, where each plotted point represents a single corresponding point in an image in the dataset. The plot on the left indicates that each calibration is individually good with reprojection errors <1px. The plot on the right highlights how trying to process imagery acquired after opening the housing with the previously obtained calibration data will lead to increased error due to the slight changes that occur when the camera is relocated in the housing after it is opened. Here, we see two forms of error are present: the translation of the centre of the reprojection error indicates a baseline decrease in performance, and the greater variance in error indicates the effect of small rotational misalignment between camera and hemispherical lens of the housing after servicing.
independently from different cameras, the scale ambiguity associated with each camera will be different, making comparing results across the reconstructions challenging. By placing calibration markers of known size in a scene, a scale correction factor can be computed for each reconstruction, allowing comparison of reconstruction results from different cameras even though they are not synchronized.
A stereo camera system consists of a pair of cameras mechanically rigidly coupled together, with time synchronized image capture. Physically, the position and orientation values that relate the cameras’ optical centres, known as the extrinsic calibration, must be computed in their installed configuration on the platform. By virtue of knowing the geometric configuration of the two cameras, metric depth can be computed from stereo imagery and therefore produce a reconstruction that is true to scale. This allows extraction of absolute measurements of distances, areas, and volumes in the scene. Time synchronization is critical, and allows the cameras to capture images simultaneously, avoiding motion artifacts from dynamic objects in the scene that can distort depth perception and thus the 3D reconstruction.
Light attenuation in seawater is a function of both the distance travelled and the wavelength. This causes a spatially varying colour distortion. With an accurate 3D representation of the scene, as well as enough information about the light sources (e.g., the beam pattern of the lights, positions, orientations, colour, and intensity), the light attenuation coefficients for a scene can
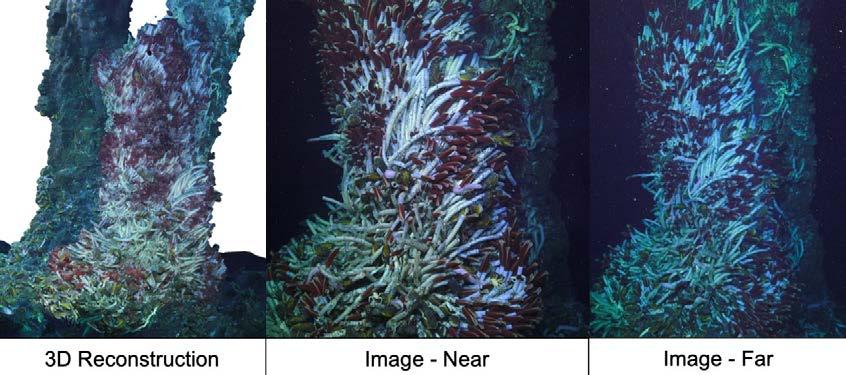
Figure 3: Metashape reconstruction of the Bio-Vent hydrothermal vent biological community structure located near 9°51’N East Pacific Rise at ~2,520 m depth. Reconstructed from imagery collected in 2021 (RR2102) using Multidisciplinary Instrumentation in Support of Oceanography (MISO) Facility GoPro cameras mounted on HOV Alvin. The reconstruction has difficulty recreating the moving biology on the vent. Also, the colours of the tube worms in the reconstruction are different hues of red and white because the source images vary in distance, which changes their perceived colour.
be computed and used to correct the imagery for colour consistency (Figure 3). To make use of state-of-the-art methods, the lighting of a scene must be well-known and characterized, requiring that standard practice in marine operations introduce documentation for this information on underwater platforms.
In summary, by placing an emphasis on computing and disseminating the calibration parameters for the cameras and light sources of a marine imaging platform, the community will maximize the utility of the latest image processing techniques to answer future scientific queries.
Dennis Giaya is a graduate student at Northeastern University, specializing in field robotics. Dr. Victoria Preston is an assistant professor of engineering at Olin College, with an expertise in field robotics and spatiotemporal modelling in deep ocean systems. Dr. Pushyami Kaveti is a postdoctoral researcher at Northeastern University, with an expertise in field robotics and computer vision. Aniket Gupta is a graduate student at Northeastern University, specializing in the intersection of computer vision, machine learning, and robotics. Jasen Levoy is a graduate student at Northeastern University, specializing in field robotics and mechanical systems for robotic applications. Dr. Daniel J. Fornari is an emeritus research scholar in the Geology and Geophysics Department at the Woods Hole Oceanographic Institution, with expertise in volcanic and hydrothermal processes at mid-ocean ridges, structure and magmatic processes occurring in oceanic transforms and at oceanic islands, and in deep-sea imaging. Prof. Hanumant Singh leads the Field Robotics Laboratory at Northeastern University and has expertise in field robotics with an emphasis on localization, mapping, and imaging in the marine, polar, and aerial domains.
TECHNICAL SALES - OFFSHORE ENERGY
VOYIS IMAGING INC.
ST. JOHn'S, NL, CANADA
While others have looked to the stars for new discoveries and inspiration, Petros Mathioudakis has always been looking towards the ocean, wondering what is below the waves. He got hooked on ocean technology as a young teen, when a school program gave him the opportunity to learn about underwater robotics. That led him to help his school participate in the MATE ROV competition for the first time, designing, building, and flying an ROV of their own. Determined to build a career out of his interest and passion, Petros enrolled in the ROV Technician program at the Marine Institute right after high school. He went on to join the university-level MATE ROV team, Eastern Edge, where he competed internationally five times, three of which he was the pilot.
Since graduating, Petros has held many jobs in the marine technology industry that have taken him all over the world. He has built, repaired, and deployed underwater cameras, laser scanners, and launch and recovery systems. He has been a part of many survey campaigns, for commercial, defence, and research purposes, in salt water and fresh. He has even worked on submersibles. Petros has a drive to solve problems and is now using that drive and his technical experience in a new role in sales for Canada’s own Voyis Imaging. Using the lessons he has learned through his career in building and operating systems, he helps clients solve problems, but now before a job instead of in the middle of one. Voyis’
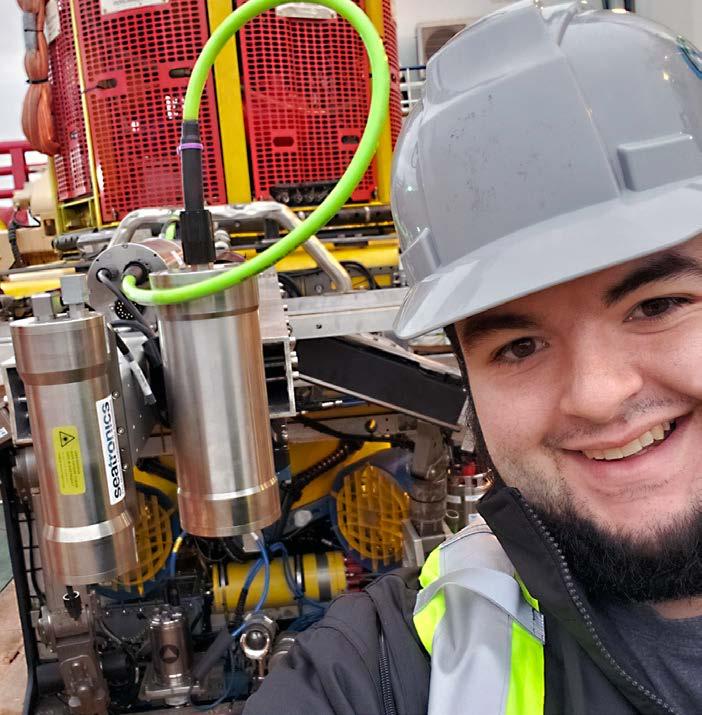
photogrammetry solutions are currently his focus, helping clients accomplish their goals of increasing accuracy, reducing time, and increasing safety by deploying the systems on micro ROVs instead of having divers enter potentially dangerous situations. With the high detail results, some clients are building digital twins of their assets.
Petros strongly believes it is important to study and understand the ocean because it has such an immense and direct impact on the world, especially in his home province of Newfoundland and Labrador. He is excited to see where his new role takes him and is eager to meet the next opportunity in ocean technology.
https://voyis.com petros@voyis.com
Rylan Command is passionate about conservation and protecting the ocean and its marine life. In 2022, he graduated from the Marine Institute with a master’s degree in fisheries science and technology where he used cameras and sensors on cabled seafloor observatories to study changes in benthic populations over time.
Today, Rylan works with Fisheries and Oceans Canada where he analyzes underwater video to support monitoring of Marine Protected Areas and Marine Refuges in the Newfoundland and Labrador region. The goal of this work is to determine the abundance, diversity, and distribution of benthic fauna within conservation areas, with a particular focus on corals and sponges. It helps inform whether these areas are meeting their conservation objectives and conserving biodiversity for the long term.
Seafloor video is collected using drop cameras and remotely operated vehicles to monitor and observe these vulnerable habitat-forming animals and their associates in their natural environment. The large amounts of seafloor imagery data generated as part of the program (~5TB/year) requires special care.
For Rylan, that means poring over the imagery collected by the field team to identify the important habitats and fauna present at the
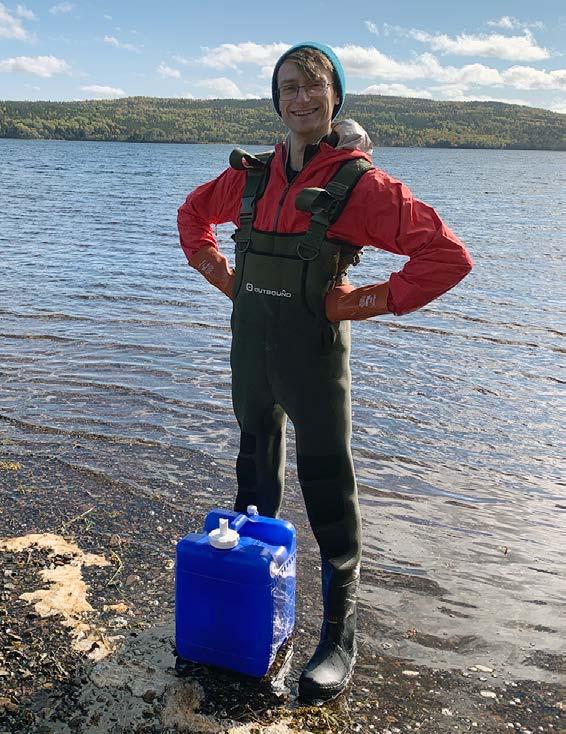
surveyed sites. A single two-hour ROV dive could have tens of thousands of animals, all of which need to be identified by Rylan. Using video annotation, he draws boxes around all of the animals he finds in the seafloor imagery. To draw the last box and look back over a completed dive with 100,000 annotations is a very satisfying feeling for him – which lasts until he starts the next dive.
With so many areas of the ocean not yet explored and Rylan’s fascination of marine life, he is excited about future surveys and what might be discovered.
www.dfo-mpo.gc.ca https://storymaps.arcgis.com/stories/69c1 b225c5bc4b28b3e46376bf392839 rylancommand95@gmail.com
Researchers from UiT The Arctic University of Norway discuss distinct levels of autonomy in ships, the role of onshore operation centres, and the role of remote operators.
This paper is intended for persons who are engaged in researching and developing remote control technologies for autonomous ship operations. This research proposes a framework to offer developers insights into onshore operation centre (OOC) system design. Additionally, the case study provided in this paper helps developers understand the potential real-world applications of remotely controlled ships.
The ocean community needs to be equipped with supportive infrastructures such as an OOC to support autonomous vessel operations. This study provides in-depth details about the role of OOCs and operators in remote controlled autonomous vessel operations. This research study serves as a guideline to researchers and policy-makers for OOC design and development. This will be helpful for the robust design of future OOC development to support autonomous vessel operations.
Dr. Muhammad Adnan works as a postdoc researcher in the autonomous shipping domain at the Department of Technology and Safety, UiT The Arctic University of Norway. His research interests include AI, autonomous shipping, shipping 4.0, computer vision, data science, and intelligent manufacturing.
Yufei Wang received a B.E. degree in aerospace engineering from Nagoya University, Japan, in 2015, and an M.S. in simulation science from RWTH Aachen University, Germany, in 2019. He is affiliated with UiT The Arctic University of Norway, and is conducting doctoral studies on developing advanced ship predictors to support situational awareness for autonomous ship navigation.
Prof. Lokukaluge Prasad Perera is a professor in maritime technology at UiT The Arctic University of Norway and also a senior research scientist in smart data at SINTEF Digital, with research interests in maritime and offshore systems/technologies, instrumentation, extreme data, advanced-data analytics and life cycle cost analysis, digital twin and blockchains, energy efficiency, emission reduction, renewable energy, autonomous navigation, safety, risk, and trustworthiness.
Muhammad Adnan1, Yufei Wang1, and Lokukaluge Prasad Perera1,2
1Department of Technology and Safety, UiT The Arctic University of Norway, Tromsø, Norway; muhammad.adnan@uit.no
2SINTEF Digital, SINTEF AS, Oslo, Norway
The need for more skilled human resources and higher operational costs in conventional shipping will create the need for autonomous shipping. To make autonomous shipping a reality, the shipping industry will require building supportive infrastructure and facilities to ensure the safe operations of future autonomous vessels. To provide necessary support functions in autonomous vessel operations is the primary goal of an onshore operation centre (OOC). This paper discusses distinct levels of autonomy in ships, the role of OOCs, and the role of remote operators from an operational support and control perspective. The current study also highlights OOC design and its major functions, including the primary function performed by the operators and their workflow, which is usually missing in the literature. A simulation-based case study is presented, which demonstrates that operators may not make optimal decisions in complex navigation environments due to limited available situational awareness (SA). The case study concluded that the OOC should provide situational awareness related support to the operators for better navigational safety.
Keywords: Onshore operation centre (OOC); OOC operator; Remotely controlled vessels; Autonomous vessels; Control system; Operator action loop; Operational support; Navigational support; Situational awareness
Autonomous transportation is already used in multiple commercial sectors, usually for land and air transport systems such as Uber taxi, Amazon Air delivery, Rio Tinto autonomous trains in Australia, etc. [1]. Maritime transportation systems still lag in utilizing autonomous navigation and operation technology. Simultaneously, the maritime sector also faces severe problems of workforce shortage, and the lack of skilled personnel [2]. In the maritime industry, working hours are long, and workers need to spend long durations away from shore due to the nature of their work. Such a working environment has reduced the interest of skilled people working in this sector. Autonomous technology can help to overcome the workforce shortage problem by utilizing advanced automation technology. It is possible to automate the standard operational tasks where human operators are usually needed, such as navigation and mooring operations, etc. [3]. Hence, the maritime industry can improve efficiency and create more efficient transportation solutions by implementing advanced digital technology as discussed previously [4].
The maritime sector is one of the most important transport sectors, covering roughly 90% of goods transportation [5]. In short-sea shipping, autonomous ships operating through an OOC will be a suitable option due to the high operating costs linked with traditional ship operations, such as crew member costs. Research shows that autonomous ship operations controlled through remote operations can reduce operational costs significantly, especially when an OOC operator is capable of managing a fleet
of vessels [6]. Extended time at sea makes working on ships an undesirable job for many, especially in transportation and surveillance. The cold, wind, waves, and salt spray can lead to physical health-related problems, such as seasickness, and the long duration can lead to mental fatigue [7]. Extended stays for tertiary area security and capturing potential hostile vessels can be much more dangerous tasks for the onboard military crew. These factors make uncrewed ships more attractive for both commercial and military purposes [8].
Autonomous vessels have gained significant attention in academic, research, and industrial sectors in the last few decades. Multiple research and development projects have been started to find the feasibility of autonomous vessels in terms of safe operations and cost-effectiveness in the current and future supply chain [9]. A challenge is continuing maintenance activities in these autonomous vessels during sea operation. The available AI applications and advanced sensor technology should support the development of autonomous shipping [10]. However, more effort in research and development (R&D) activities is required from an operational support perspective, such as managing ship condition monitoring and condition-based maintenance [11].
Several autonomous ship projects have been developed to test and verify the concept over the last few decades. Norway, China, Finland, and the United States have done substantial research work in the autonomous ship domain [12]. Several prototypes of autonomous vessels have been designed for research and civilian use purposes, such as the fishing trawler-like vehicle ARTEMIS, the
catamarans ACES and AutoCat, and the kayak SCOUT (Surface Craft for Oceanographic and Undersea Testing) [13], [14]. These vessels can operate on automated navigation systems. Furthermore, autonomous vessels have been developed in several research studies in Europe, such as the autonomous catamaran Delfim by the Dynamical Systems and Ocean Robotics lab of the University of Lisbon [15]; the autonomous catamaran Charlie by Natural Resource Council of Italy’s Institute of Intelligent Systems for Autonomation [16]; and the autonomous catamaran Springer, which has been industrialized by the University of Plymouth (UK) for finding contaminants [17].
The projects mentioned above utilize distinctive designs and methods for development based on their specific purpose. Both industry and research communities are working on large-scale autonomous systems involving full-size vessel operations at sea. The level of vessel operations varies significantly from platform to platform, i.e., from remote control to fully autonomous prototype vessels. However, the maritime community and regulatory authorities raise multiple questions of autonomous and crewed vessels operating in the same region, such as threats, safety and security, and control levels [18].
It is observed from the literature and survey data that around 71% of accidents in the maritime sector involve human negligence factors [19]. Autonomous ship manoeuvres based on sensors and advanced AI algorithms can reduce the risk of accidents due to irrelevant human negligence and navigation error factors [20], [21]. This means autonomous vessels will have a better
competency in terms of safe operation in the future than traditional crewed ships.
Curriculum design for OOC operator training is still challenging due to a lack of identified/ required skills for training. Some initial research studies were conducted to categorize the key competencies required for OOC operators, such as system understanding, communication, technical knowledge, and maritime competencies [22]. Still, there is a need for additional research and development activities concerning autonomous vessel operations as the critical competence required for future OOC operators. A significant knowledge gap exists between current and future skills due to technology variations, and auxiliary investigation studies are essential to finding actual competence in OOC operators of autonomous vessels [23]. Some available studies show that each remote operator will first require the skills and experience of a seafarer. However, OOC operators do not require the same navigation competence as conventional vessels in some situations. But OOC operators still need some general good seamanship skills like anchoring, knowing how a ship will drift with winds and currents, and additional knowledge and experience of environmental circumstances that can be utilized to manoeuvre vessels remotely [24]. Some of the required skills are identified in the AUTOSHIP project and revealed in the autonomous ships document, Training Framework for Crew, Operators, and Designers [25].
In recent decades, the maritime industry has shifted most of its manual operations into digital mode, which may help to quickly adopt and accept required autonomous technologies
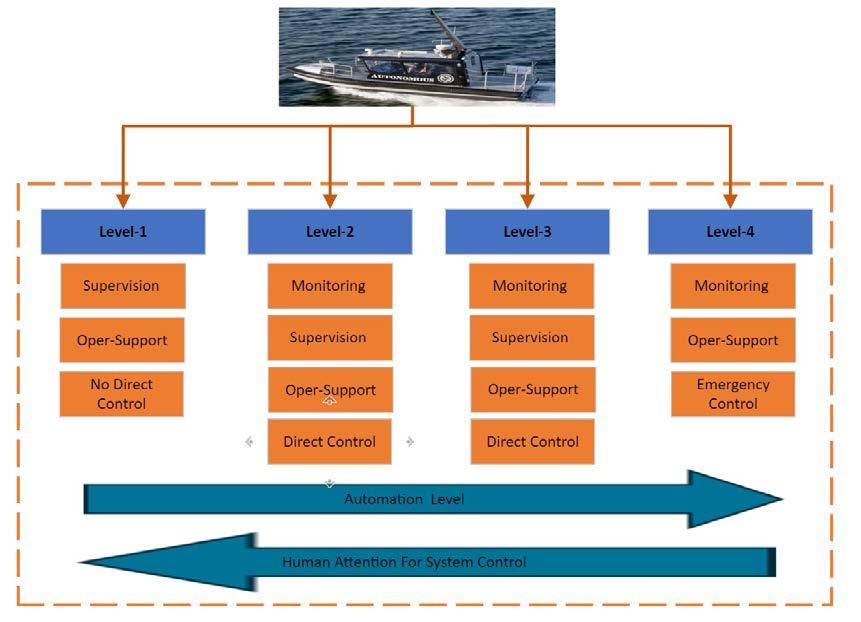
in the maritime sector [26], [27]. However, before using it commercially, the maritime industry’s trustworthiness in autonomous technology should be established, especially with regard to safety standards. Safety and security-related concerns are still challenging for autonomous vessels due to a lack of R&D in this domain. It is expected that the proposed OOC concept will solve most of the industry’s concerns by providing online support and guidance to vessel operations through OOC operators. Optimistically, the human-in-theloop approach through an OOC will solve most of the autonomous vessel safety and securityrelated concerns raised by the maritime industry and regulatory authorities.
In the literature, the definitions of autonomous navigation levels vary in a greater context. As a result, various organizations define autonomous navigation levels differently based on their perceptions [28], [29]. Different researchers still categorized uncrewed vessels in the classification levels, usually at level 0 or level 1 in most autonomous
classification categories [29]. An autonomous system means that the same entity can work without human interference. The International Maritime Organization completed its scoping exercise regarding regulatory measures for maritime autonomous surface ships. It formed classifications for the degrees of autonomy, which are now somewhat recognized and accepted in the marine autonomy domain [30]. The autonomous vessels are classified into four distinct categories based on the operational functionality performed by such vessels, listed below and shown in Figure 1.
Level-1: Seafarers on board to operate and control the vessels.
Level-2: Remotely operated vessels with onboard crews for supervision or emergency control.
Level-3: Remotely operated vessels without seafarers on board.
Level-4: Fully autonomous vessels without human supervision.
In the level-1 system, the onboard operator handles most operation-related functions of the vessel. The OOC will provide the necessary guidelines and support to the onboard crew
if needed. No control functions are available for the level-1 vessels through the OOC control. At the autonomous level-2 system, the OOC operators will operate the vessels remotely. Still, onboard crew members are available to operate and maintain the vessel, such as emergency control, hardware and communications failure situations, equipment malfunctions, etc. The onboard operator can take control of the ship whenever necessary. The autonomous system will generate alarm signals for any OOC control command failures. If such situations occur, the ship system will transfer vessel control from the OOC to the onboard operator. The operator will supervise and monitor vessel operations, as required. In case of any navigation complexity, the onboard operator will communicate with the OOC operator for guidelines concerning specific issues. In level-2, the OOC will support the following functions: supervise onboard crew regarding situations wherever needed, such as guidelines concerning the operational point of view and international maritime laws, and operational support in vessel maintenance or failure, part replacement, if required.
The level-3 system works with advanced automation control capability and performs its functions as per pre-defined criteria. At this level, there is no onboard crew member to operate the vessels; the remote operator will supervise the vessel’s system remotely whenever needed. The OOC operators continuously monitor the vessel’s operations remotely. The autonomous vessel will connect with the OOC during its entire operation through a communication channel. Remote operators can take control of vessels whenever necessary, mainly if any abnormality occurs
during operation, such as a system response failure situation. The OOC operator will interact with the system’s planning and decision-making processes to ensure optimization, such as navigational path planning, schedule, speed, etc. The remote operator needs to oversee and approve or modify system-generated plans based on factors like weather conditions or unavoidable situations in the operating area, such as war or path blockage. The system will give higher priority to the command signal received from the remote operator than the autonomous system-generated command signal. The OOC remote operator can take control of the vessel at any time, whenever necessary, for safe operation assurance.
In a level-4 system, vessels can operate without human intervention. In level-4, the role of the OOC is to monitor and provide operational support in ship repair and maintenance phases. The OOC operator has limited interference with ship systems, such as emergency control capabilities. It is expected that many functions related to vessel operations will be handled by the intelligent systems without any inference from the human operators of the OOC. To reach this level-4, extensive research and development efforts are required. Only after the feasibility evaluations, covering all complex navigation situations and operating environments so that their operation is proven reliable and robust, the shift towards fully autonomous vessels can be feasible.
Autonomous vessels still face many technical challenges regarding acceptance from society
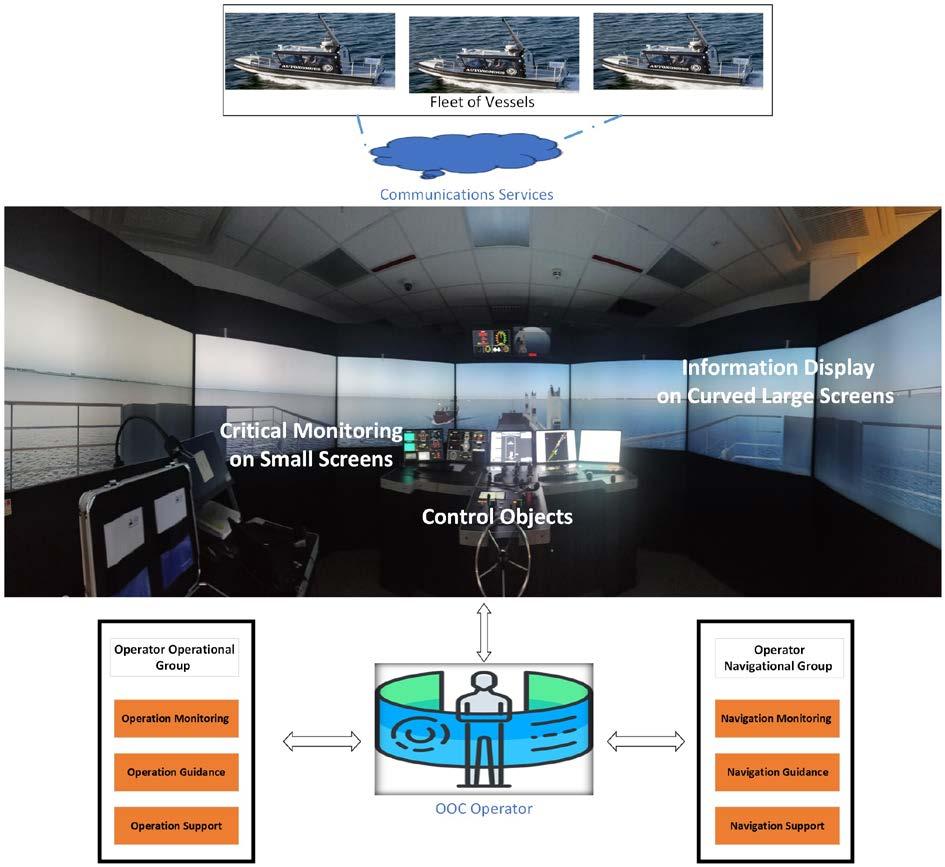
and regulatory authorities. Recently, the concept of an OOC to support the operations of autonomous ships more effectively and securely has received considerable attention. The UiT Arctic University of Norway (uit.no/autoship) is working on the same concept of an OOC development project, as shown in Figure 2, to fulfill the shipping industry’s needs and support its future autonomous vessel operations. The OOC concept may solve most of the safety-related concerns raised by regulatory authorities by providing necessary support to operating vessels whenever required, such as help in emergency situations and system failure situations. This way, the OOC will play a key role by providing the required infrastructure to enhance the safety of autonomous vessel operations. The OOC infrastructure must be designed carefully to support the autonomous
vessel operations at all levels, i.e., level-1 to level-4. The OOC will be responsible for data collection, communication, analysis, and other support functions related to navigation and operation requirements. The OOC should also be equipped with advanced data analytics tools, which will be helpful for the operators in their planning and decision-making activities. The generated knowledge will be utilized for course curricula design to train future OOC operators. These OOCs will provide advanced support and expertise to the shipping industry, which will be helpful in decision-making on optimized resource management. The proposed OOC is equipped with the following essential functions:
• Operation monitoring
• Operation guidance
• Operation support
• Navigation monitoring
• Navigation guidance
• Navigation support
The OOC will play a vital role at all levels of autonomy in autonomous vessel operations. The OOC plays the role of the ship navigation system, with the difference that it is located onshore rather than on board vessels. The OOC operator will play the same role as the onboard crew in monitoring, supervising, and providing operational and navigational support in autonomous vessel operations. The OOC operator will utilize the commandbased controller for the ship’s operations. The commands from remote operators will have a high priority compared to autonomous system-generated decisions. The OOC is an essential part of these advanced, nextgeneration maritime systems to provide the necessary support for their operations, especially in complex situations such as harsh weather, emergencies, system response failure, narrow passages, operational and navigational support, and guidelines.
The functional overview of the OOC shows that it will support autonomous vessel operations at all levels of autonomy, as shown in Figure 1. Autonomous ships will be controlled by the remote OOC operators working onshore, whose jobs might diverge from monitoring and supervision to remote control. The main goal of the OOC is to facilitate remote operations of autonomous vessels in a well-organized, protected, and safe way in all scenarios. The idea can be expanded to support autonomous fleets through the OOC in the future. The proposed automatic alarm scheme will inform or alert
remote operators in the OOC if any predefined variation occurs during regular vessel operations, such as planned path deviations, speed variations, or abnormality in onboard sensors or control systems.
Figure 2 shows an overview of the OOC environment and comprises three significant elements, which are described and listed below consecutively.
The field of augmented reality (AR) is presently undergoing significant advancement as a possible information display method. According to the definition in [31], AR is characterized by three main features: integrating the real world, real-time interaction, and accurate 3D registration of real objects. It has the potential to change human perception of the real-world environment profoundly. Information display is a crucial element in AR systems, with head-mounted displays typically being the primary choice. These displays are frequently utilized in developing remotely operated land vehicles [32], [33], [34] and vessels [35]. However, there are still some issues that remain to be solved with head-mounted displays, such as limitations of environment lighting on optical see-through headmounted displays [36] and eye fatigue [37]. Since vessel manoeuvring is considerably more complex than land vehicles, requiring substantial teamwork and cooperation, often extending over longer durations, large flat and curved screens are used as the display in the proposed OOC design.
Implementing large flat and curved screens can enhance several visual factors, such as field of view, depth perception, and natural viewing angles. The critical information related to vessels, such as engine power system status, health conditions of mechanical parts, planned ship route, environment conditions, possible collision risk, vessel locations, vessel speed, emission levels, etc., needs to be transferred to the OOC and displayed on a large screen continuously for safe operation monitoring, support, and guidance purposes. The advanced Internet of Things (IoT) systems make it easier to share this information with remote OOCs. The large screen displays information that will enable the remote operator to make optimal decisions concerning safe operations of these autonomous vessels.
The large amount of information that will be collected from the IoT devices provide another challenge for the user-interface design of the OOC. The OOC user interface must be designed carefully, with the information of all relevant stakeholders, to decide which data needs to be displayed on large screens for continuous monitoring purposes. This area still needs more research and development activities to identify the critical information required for continuous monitoring related to vessel operations. Another challenge that OOC operators might face is an information overflow problem, which may occur not only in autonomous vessels but traditional vessels as well; crewed vessels may also have similar situations. Undoubtedly, the OOC operators will be more overloaded with such information from autonomous vessels compared to crewed ships [38]. The absence of a visual aspect of the operating environment in autonomous ships can be addressed by using
IoT sensors, which may cause the information overflow problem in some situations.
During the OOC design phase, it must be ensured that remote operators will receive all required information, at least as onboard navigators, during regular operations. The information related to operating environments, such as wave spectrum information, including vessel motions (slamming, rolling, and pitching), can be useful in some situations [39]. Only necessary information will be displayed on the OOC operator screen to avoid the information overflow problem. Hence, an appropriate human-machine interface needs to be designed to reduce information overload and to avoid any operator confusion. One solution to this problem is to reserve a specific area in the curved screen for vessels with critical risks. An alarm system should be developed based on the critical situation order, as shown in Figure 3. The proposed alarm signals can be further classified into three types – red, yellow, and green – based on their critical situation order, as shown in Figure 3. The red alarm signal needs more attention from the OOC operator than the yellow and green alarm signals. The operator action plan scheme design will enhance the working efficiency of OOC operators. The design of such functions for managing a critical risk vessel situation still needs to be investigated further. The action plan should be designed based on the domain expert’s recommendations. The operators can only focus on those vessels that need urgent support or guidance based on the priority of critical situations, such as red alarm situations first, then yellow and green alarm situations
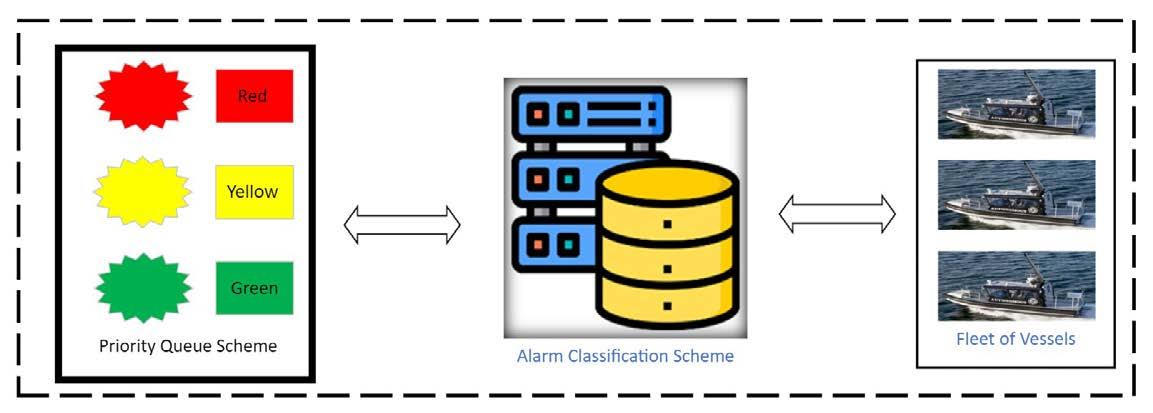
consecutively. The priority queue scheme will substantially reduce the operator’s workload and optimize their work routine. It will be easy for operators to work on the most critical situations first based on the priority order shown in the reserved area.
On additional screens, the operator can check the detailed information about the critical vessels before taking actions or providing guidelines depending upon the vessel’s autonomy level. Such screens can provide OOC operators with additional required information. This detailed information can help OOC operators devise a better solution for vessel navigators during ship operation.
The OOC environment must be designed carefully to support the operators. The OOC design should be as close to a ship bridge environment as possible so that the OOC operators will feel like they are navigating a vessel. The control chair will make it easy to get an overview of the overall OOC operational environment, such as monitoring, and remote control functions. The OOC can also be equipped with a joystick for control functions of vessels with an appropriate user interface. It may also be fitted with augmented reality and virtual
reality-like equipment for more appropriate control during ship handling and monitoring.
The onshore operation centre teams can be comprised of ship operators, supervisors, captains, marine engineers, IT engineers, and others as necessary. The ship operators are the backbone of the OOC; other people are specialized experts in their respective domains who will provide the operators with help, supervision, and guidelines as requested by the operator. Some frequent questions about remote operator capabilities include how many ships one OOC operator can manage simultaneously. It is possible that one operator can control multiple ships at a time; however, that may depend on the navigation situation. The concept behind the development of an OOC is to operate a fleet of vessels by each operator. Additional research and development activities are required to identify an appropriate number of ships that each operator can control in various situations. Most probably, with matured technology in system intelligence, the number of vessels handled simultaneously by each operator can increase. However, multiple ship management may be an issue for OOC operators in the early stage due to the need for more experience and system testing in all circumstances.
To achieve the operator goal of simultaneously handling several ships, one key factor is the intelligent operational scheduling of these vessels. All vessels handled by each operator should not reach critical situations simultaneously, such as port entry and exit, narrow passages, high traffic areas, cargo handling, loading and unloading phases, etc., because the vessel needs more attention from the OOC operator during these critical situations due to the severe accident risks involved.
The OOC can play a vital role in monitoring and controlling the future autonomous fleet of vessels, specifically in port entry and exit. Due to the lack of supportive infrastructure for autonomous vessels in port handling stations, remote operators may need localized communication connection with the port operators in some situations. This will make the autonomous system integration more accessible and reliable. Port entry and exit time are the most crucial operation segments and most accidents occur during this period due to multiple factors such as high traffic and narrow passages. The role of a remote OOC operator is also fundamental in monitoring the structural health of the vessel and the cargo loading and unloading phases of goods from the vessel.
The role of the operator is crucial in these states:
• Entry into the port terminal (a lot of vessels are waiting for a schedule or signal from the port entry operator)
• Cargo handling phase
• Maintenance phase
• Exiting the port
• Narrow passage areas or linked canals
• High-traffic zones
During these states, the operators have the following tasks:
• Check the power and emergency backup resources before the vessels leave port.
• Check the health status of engine parts.
• Update the navigation plan of vessels, based on the weather forecast.
• Communicate with the local authority regarding the needs of the vessels.
The OOC operators are responsible for operating autonomous vessels safely. However, OOC supervisors can monitor the overall OOC operations and assist operators in handling and complex navigation situations. The operator and supervisor must have the relevant knowledge, skills, and experience to conduct efficient ship operations. Ship navigation knowledge is required for the OOC operators. The OOC operators must be familiar with vessel inspection requirements, such as safety certificates and machinery health assessments, to maintain the vessel’s suitability for operation. OOC operators must deliver support whenever it is essential.
The OOC operators are divided into two groups in the proposed operator working scheme – operational and navigational [40], [41], [42] – as shown in Figure 2. The idea behind the division is to handle the tasks more effectively based on crew competence and expertise. The operator functions can be further divided into monitoring, guidance, and support tasks, as shown in Figure 2.
The OOC operator can perform the following
tasks related to autonomous vessel operations. Figure 1 provides an overview of the tasks performed by the OOC operators of autonomous ship operations.
1. Monitoring: The OOC operators can monitor the operational and navigational aspects of autonomous ships. Continuous monitoring ensures safe operation during the sea journey and provides the necessary guidelines and support to autonomous vessels whenever required, depending upon the vessel’s autonomy level.
2. Supervision: The operator can supervise the onboard crew and control system in all levels of the autonomous ship whenever necessary. Especially in the early trial of level-2 and level-3 of autonomous vessels, both onboard crew and the systems need continuous supervision from the OOC operator regarding the operational aspect of the vessel. The control system needs supervision from the remote OOC operators until the autonomous vessel system reaches its robustness level.
3. Intervention: Operators can intervene with autonomous systems at any time for safe operation. The priority of the operator command signal should always be higher than the autonomous control system. During the planning phase, remote OOCs must monitor and sometimes interfere for optimization purposes depending upon the level of autonomy. Multiple factors are challenging to model or adopt in an autonomous system, such as weather conditions, accidents in the planned path, war zones, etc.
4. Direct control: Appropriate navigation tools should be considered in the OOC platforms
to enhance operator performance. For instance, advanced ship predictors can provide trajectory predictions at both local and global scales [43], [44], which can help avoid collisions essential for navigation safety. Additionally, related tools designed for path planning [45] and cost analysis [46] can be employed to design optimal sea routes and minimize operational costs. As the OOC is designed to handle and analyze large volumes of navigation data, it is feasible to utilize newly developed AIdriven tools such as advanced predictors and optimized voyage planning. The OOC operator can take control of the vessel if the autonomous system fails to handle disaster situations, such as response failure situations, sensor malfunction, etc.
Operation monitoring is a critical element of the OOC operator’s job during the entire journey of the autonomous vessel operation, regardless of their autonomy level. As the first step, any alarm or event will require more attention and monitoring from the remote OOC operator. Based on the pre-defined rules, the operator will monitor the event closely and wait for the system to configure the solution itself with a pre-defined time threshold. If the system reconfigures itself, the event will go to the end state. Otherwise, the operator will analyze the event based on the available data and try to find a possible solution. During this process, it is recommended that the group supervisor be in the loop if the event belongs to a critical class. Involving their supervisors will help operators find the best and most optimized action to solve a particular event or problem. The operator will trigger the action
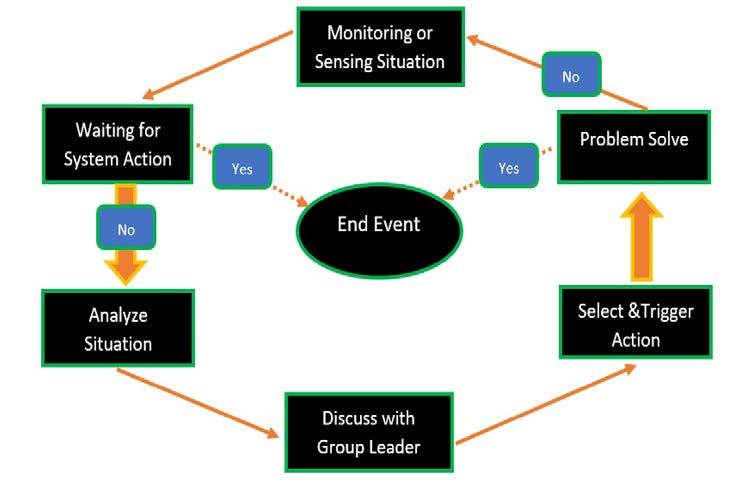
based on their decision and discussion with the supervisor. After triggering the action, if the problem is solved, the event will go to the end state; otherwise, it will go to the loop again until the problem is solved. The OOC operator will follow the decision loop to ensure safe operation, as shown in Figure 4.
In contrast to conventional navigation, vessel manoeuvring from an onshore location, such as the designed OOC (Figure 2), can introduce potential challenges as discussed. Numerous factors must be carefully considered in such vessel navigation conditions, including the availability of navigation datasets, transmission security of the data, reliability of remote control systems, and limited vision of OOC operators. Therefore, decisions made by OOC operators may diverge from those made in conventional navigation due to the difference in understanding the respective situational awareness (SA) in the OOC. This paper presents a case study that emphasizes the factors mentioned above when manoeuvring a ship from the designed OOC. As depicted in Figure 2, the visual data displayed on the screens serves as an important resource for maintaining SA. It is
thus reasonable to assume that the acquisition of this visual data is impeded by system or transmission errors. The objective of the case study is to investigate how decisionmaking varies under different conditions of SA acquisition in the OOC. The findings can provide feedback for the OOC design so that the related functionalities can be optimized.
SA is a critical concept in maritime safety. It is formally defined in three steps [47]: the perception of the elements in the environment within a volume of time and space; the comprehension of their meaning; and the projection of their status. In modern navigation, ship bridges are equipped with various advanced electronic equipment, including GNSS systems, gyroscopes, radars, and automatic identification system receivers. However, the view from the navigator’s eyes still plays a fundamental role in observing the respective environment. Rule 5 of the International Regulations for Preventing Collisions at Sea (COLREGs) explicitly mandates that “every vessel shall at all times maintain a proper look-out by sight and hearing as well as by all available means appropriate in the prevailing circumstances and conditions to make a full appraisal of the navigation
situation and the associated risk of collision” [48]. In conventional shipping, the view from navigators’ eyes is mainly from the ship bridge, where the rudder and propulsion control systems are located (also known as first-person perspective). In addition, shipboard automatic radar plotting aid (ARPA)/radar systems offer navigators a comprehensive global perspective, and this global perspective is indispensable when first-person perspective information is limited, such as during navigation at night or in harsh weather conditions. It is worth noting some highly skilled navigators have a good sense of situational awareness based on their experience. Consequently, decisions made by onboard navigators benefit significantly from both first-person and global perspective information sources.
As for power-driven vessels, which are applicable in most ship encounter scenarios, the COLREGs include distinct regulations for three general encounter situations: overtaking (Rule 13), head-on (Rule 14), and crossing (Rule 15). Furthermore, Rules 16 to 19 also incorporate regulations that promote proactive measures to reduce collision risk. However, it is essential to note that these three general encounter situations only address scenarios involving two ships. With the introduction of remotely controlled and autonomous ships, the encounter situation among different types of ships can become more complicated [49]. Therefore, it is recommended that the manoeuvring strategies remain adaptable and responsive to the evolving circumstances [50].
In the design of the OOC, large screens are incorporated to display information captured by onboard equipment. While these screens
can offer operators first-person perspectives of the navigation situation, it is essential to recognize that this view is purely an indirect representation of the bridge view. In more challenging scenarios, image transmission may experience considerable time delays, and that can affect the information displayed. Additionally, in adverse weather conditions, the image quality captured by onboard sensors can deteriorate and that can also introduce additional challenges in remote navigation. With diverse sources and types of navigation information, operators in the OOC may make different decisions regarding the same ship encounter situation. For navigation safety, it is thus informative to explore the diversity of decisions made by OOC operators provided with different sources and types of information. For example, decisions regarding navigation through high-traffic waters may differ depending on whether the OOC operators have clear visibility or rely solely on radar.
As remotely operated vessels are still in the developmental phase, there is a shortage of sea-trial experiments and research studies in this field. Therefore, a simulation experiment was designed and conducted to assess how OOC operators respond to complex ship encounter situations. The UiT bridge simulator serves as the OOC working platform in this experiment. The bridge simulator has a panoramic curved scene and control modules (Figure 5). As stated before, the OOC should have a similar view and control units as on board a vessel. A ship’s steering on the bridge can be viewed as a scenario in which the ship has no crew members on board but is remotely operated.
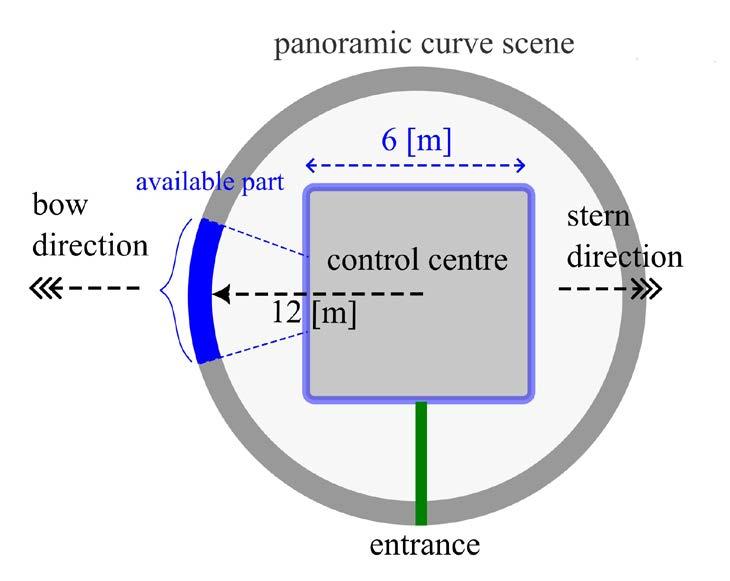
AFigure 5: (a) The crosssection of the UiT bridge simulator; (b) simulator appearance from outside; (c) detail of the control centre.
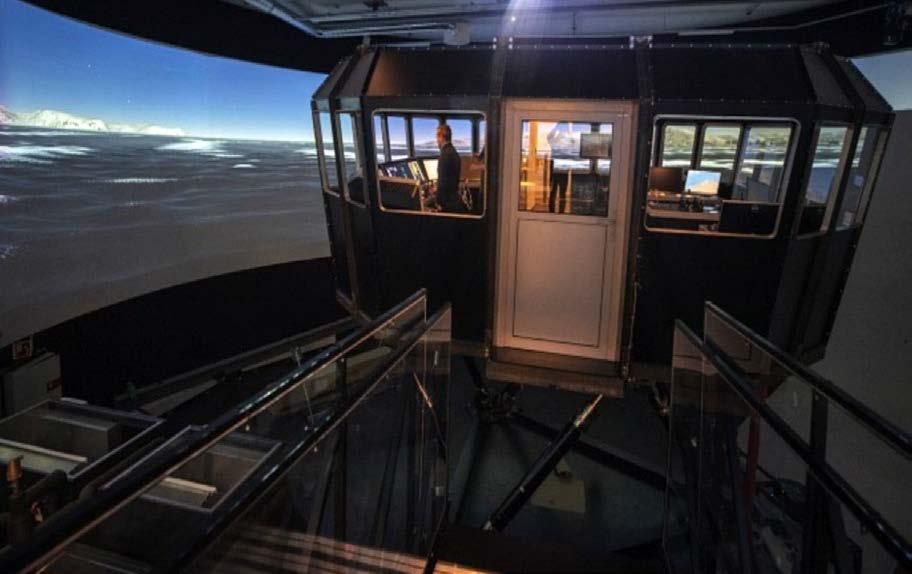
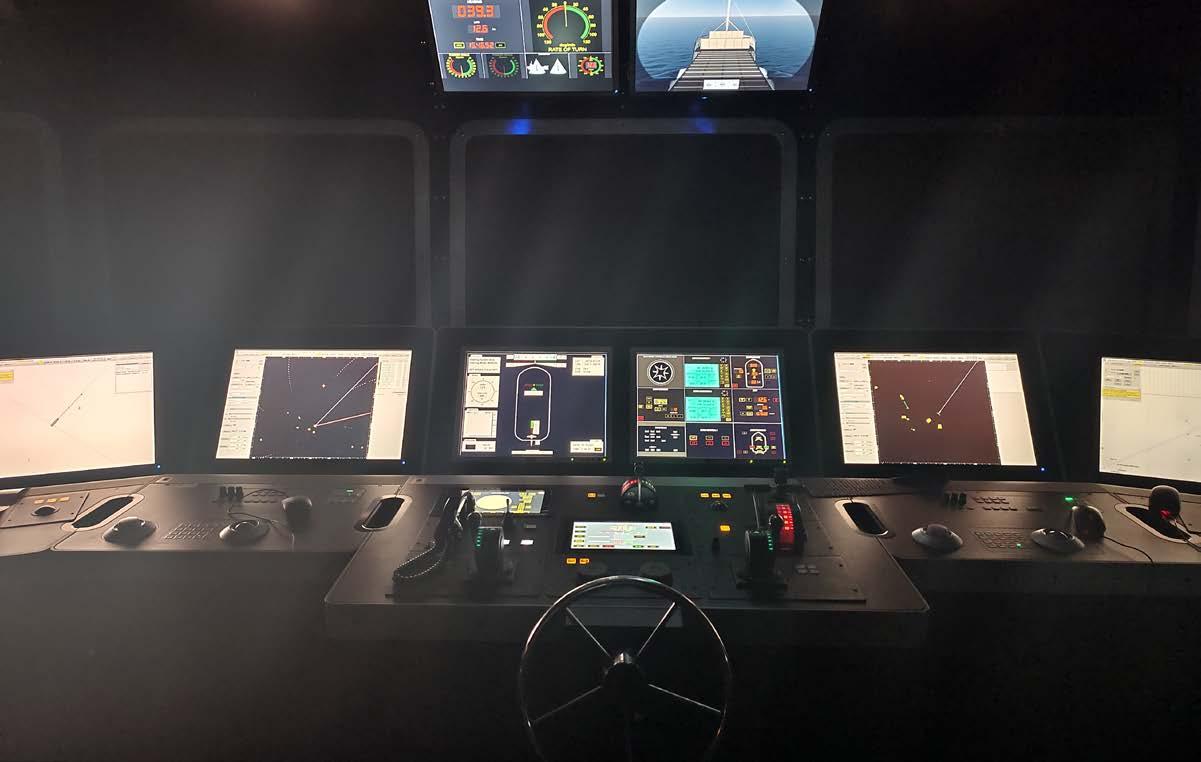
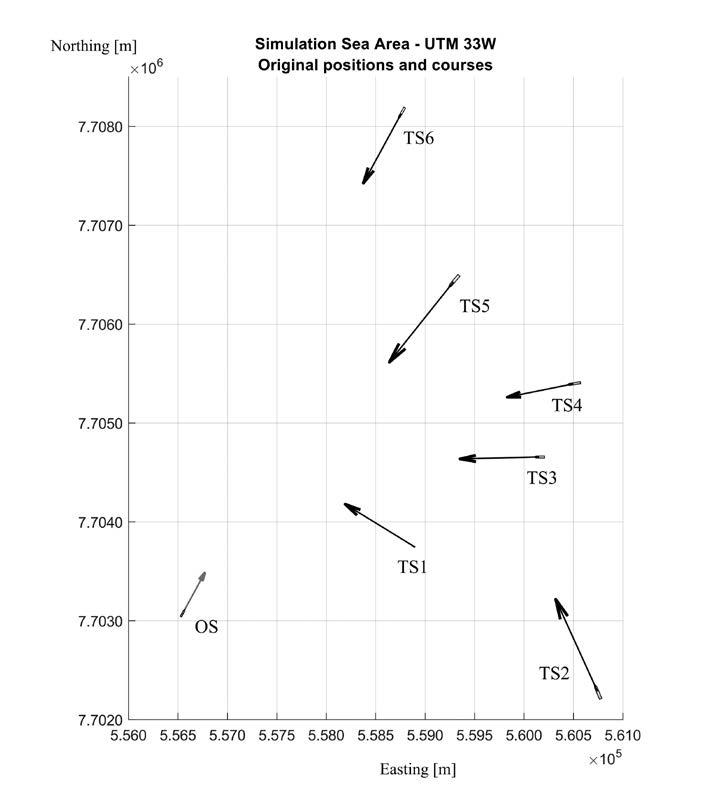
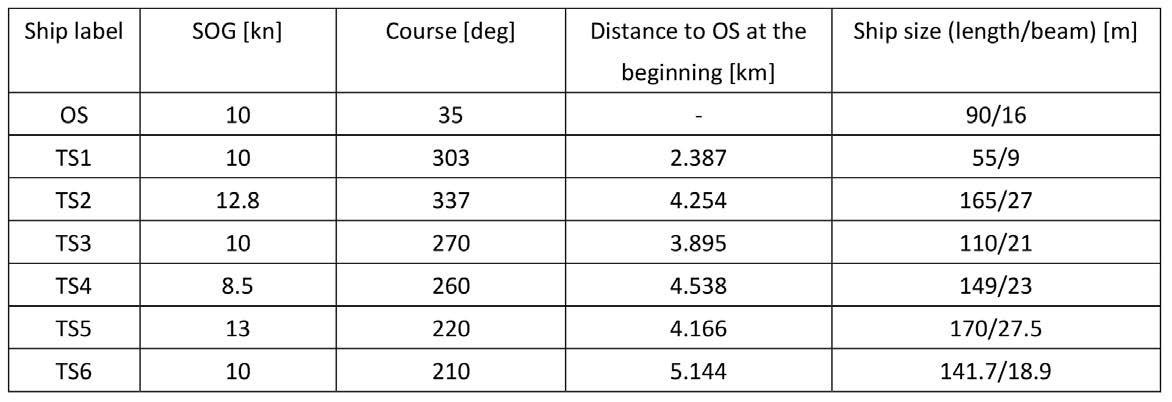
A complex ship encounter scenario is created within the simulator (Figure 6). This scenario involves seven ships sharing the same maritime area, with their initial conditions detailed in Table 1. The operator’s task is to navigate their own ship (OS) safely through this area. Meanwhile, OOC operators are encouraged to consider minor course adjustments, as making significant changes in the course may lead to speed reduction, which is less economically efficient.
Two operators (A and B) with experienced navigation expertise are invited to manoeuvre the own ship (OS) in the designed scenario separately (Cases 1 and 2). Case 1 is designed so that Operator A can only obtain the nearby ship information provided by the APRA (Figure 7). In Case 2, Operator B has access to view data from both the ARPA system and a camera. However, the camera’s view is limited to a small portion of the panoramic curved scene and has a restricted angle,
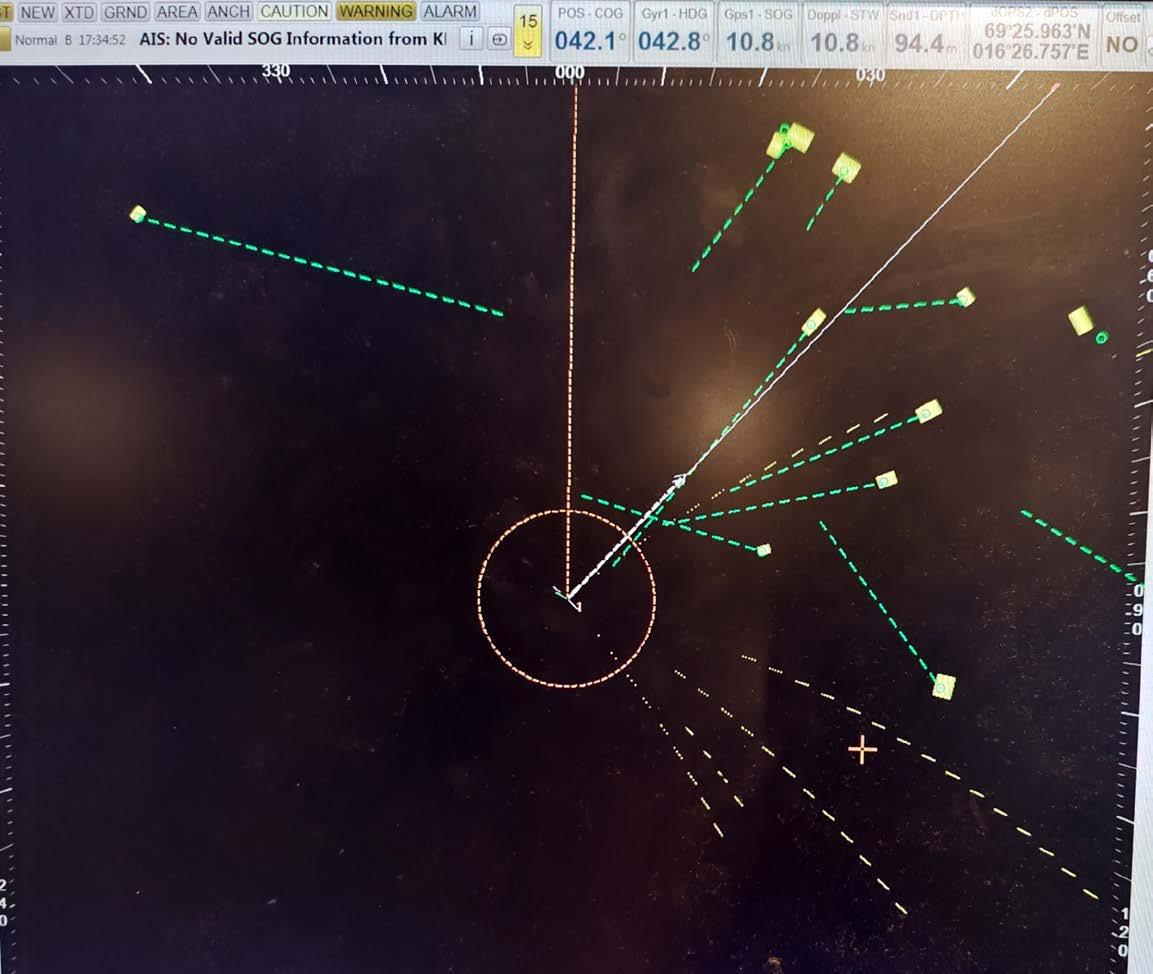
covering only the OS’s beam (Figures 5(a) and Figure 8).
In Case 1, Operator A soon realizes the collision risk with target ship 1 (TS1). Instead of making a starboard turn, Operator A reduces speed and lets TS1 pass first. Meanwhile, Operator A also detects that there is another threat from TS5 ahead; a minor change of course to the port side is thus executed (Figure 9(a) and (b)). However, although these decisions allow OS to avoid conflicts with TS1 and TS5, Operator A does not realize proactively that these decisions increase the
risk of OS colliding with TS3 (see Figure 9(c)). After realizing TS3 is coming from the starboard side, Operator A neutralizes the rudder and accelerates. While a collision is successfully prevented, the proximity between the two ships indicates a high-risk situation (see Figure 9(d)). This is particularly concerning for OS, as its starboard is exposed to TS3’s route, increasing the risk of capsizing in the event of a collision.
In Case 2, Operator B notices a significant difference in the view information compared to conventional shipping. As a result, more cautious manoeuvring is taken. After
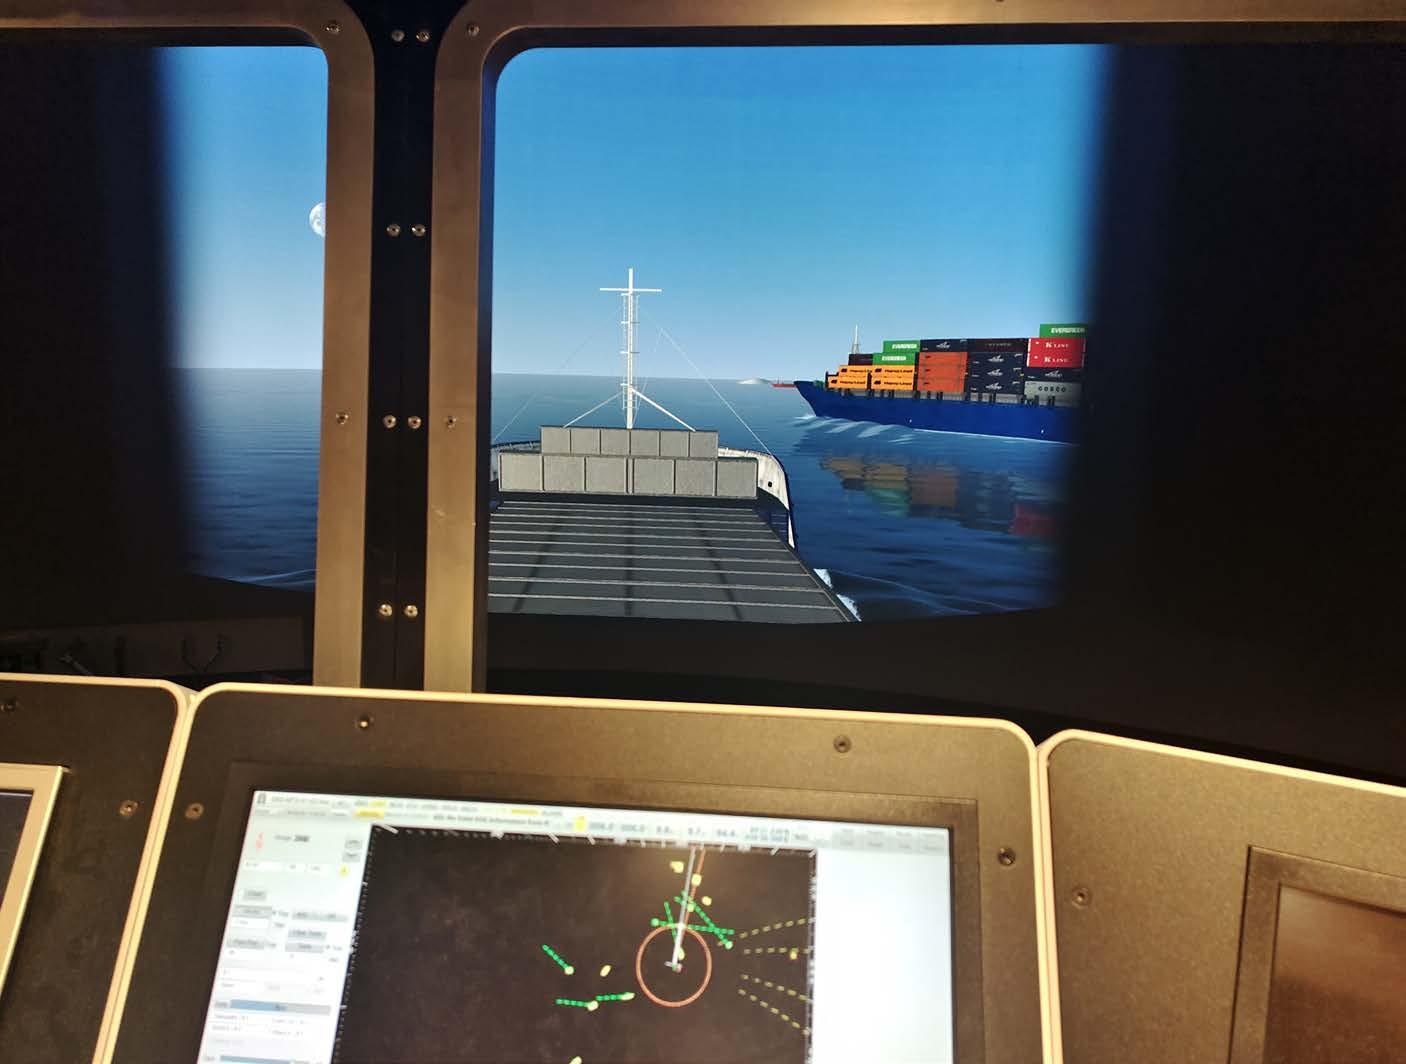
recognizing the collision risk with TS1, Operator B reduces the vessel’s speed and makes a major change of course to the starboard side (Figure 10(a)). This decision allows OS to safely pass TS1. However, as TS3 approaches directly in front of OS (Figure 10(b)), despite the ARPA providing an excellent global perspective, the limited range of the first-person view makes it challenging for the operator to confirm whether OS can safely navigate past TS3 (Figure 10(c) and (d)). It is acknowledged by Operator B that if a full bridge view were available, overseeing such encounter situations would be easier.
When comparing the manoeuvring trajectories of these two operators within 800 seconds after
the start (Figure 11), it is clear that the change of course in Case 2 is quite substantial. While the manoeuvring of Operator B in Case 2 has no obvious moments of danger, it is still worth noting that there is a loss of time and possible increased fuel consumption.
The case study conducted in the UiT bridge simulator offers valuable insights into potential issues that may arise when employing remote operation platforms like the designed OOC for future remotely controlled vessels. As demonstrated in the case study, both cases present challenges in the first step of SA – the perception of relevant information in the sea environment. The source of
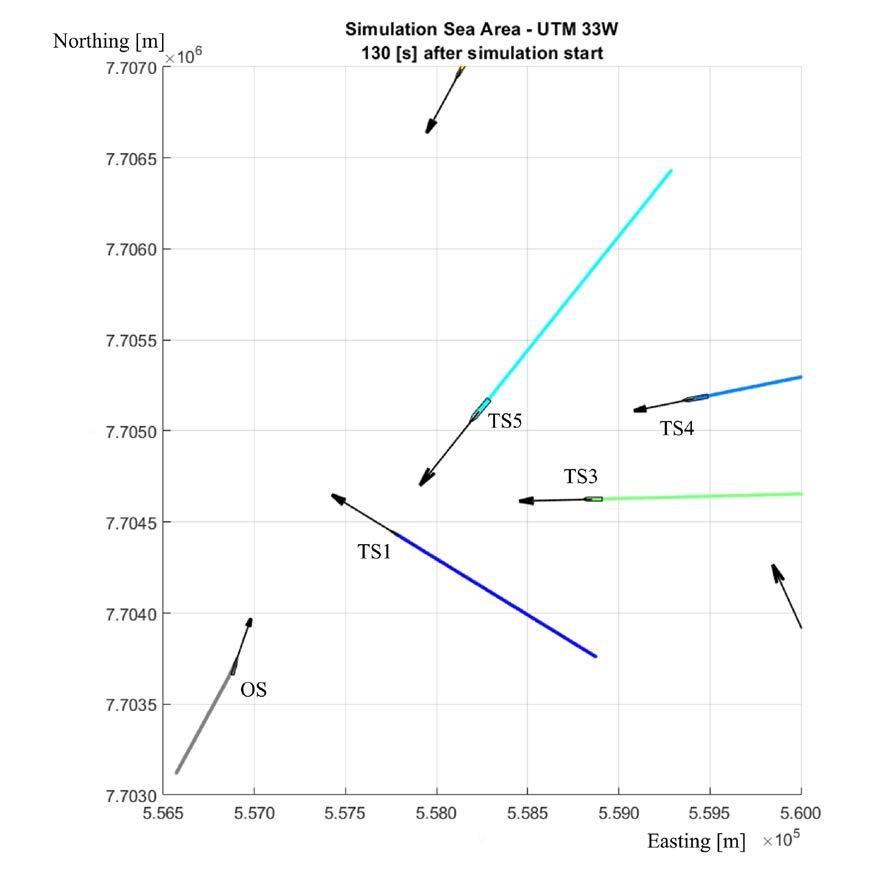
Aview information from automatic radar plotting aid.
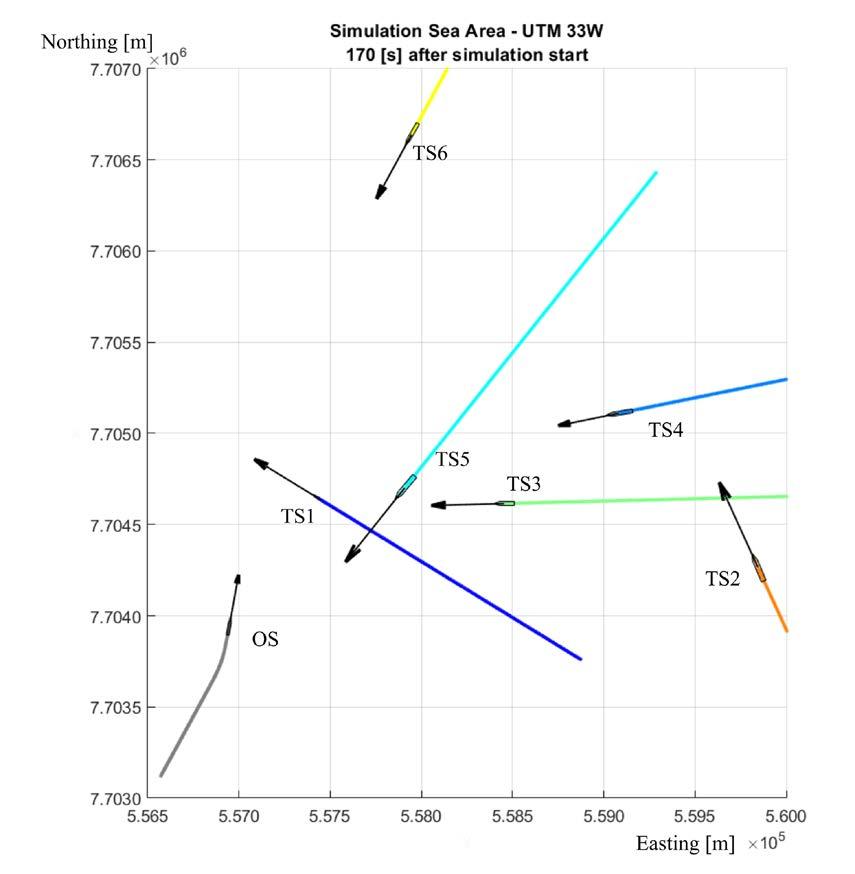
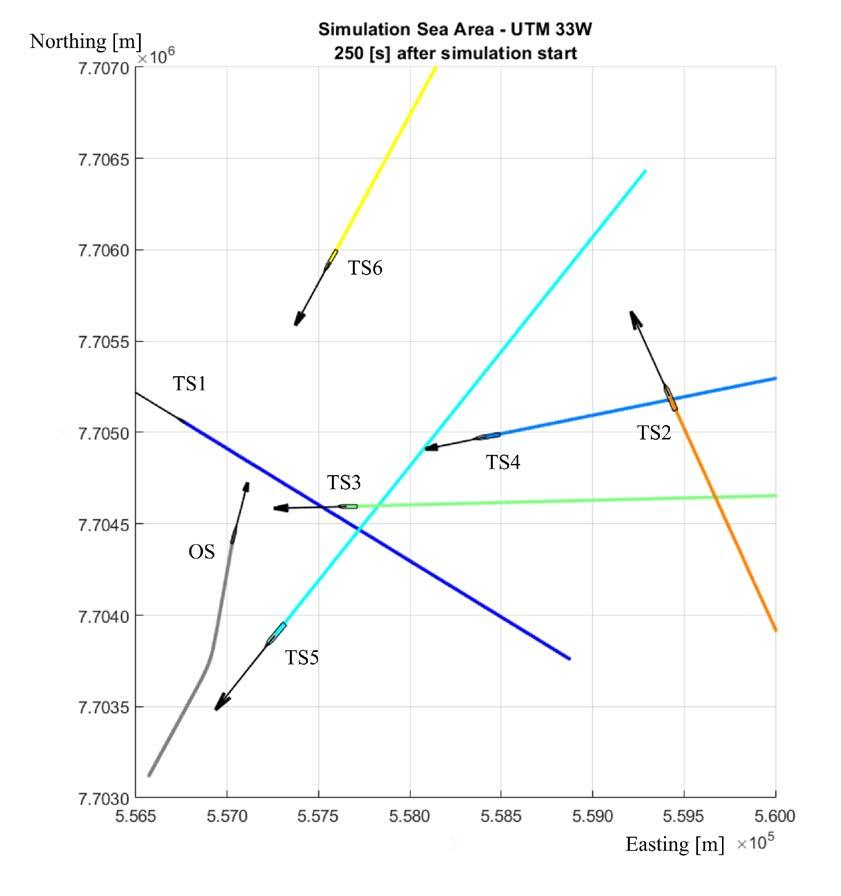
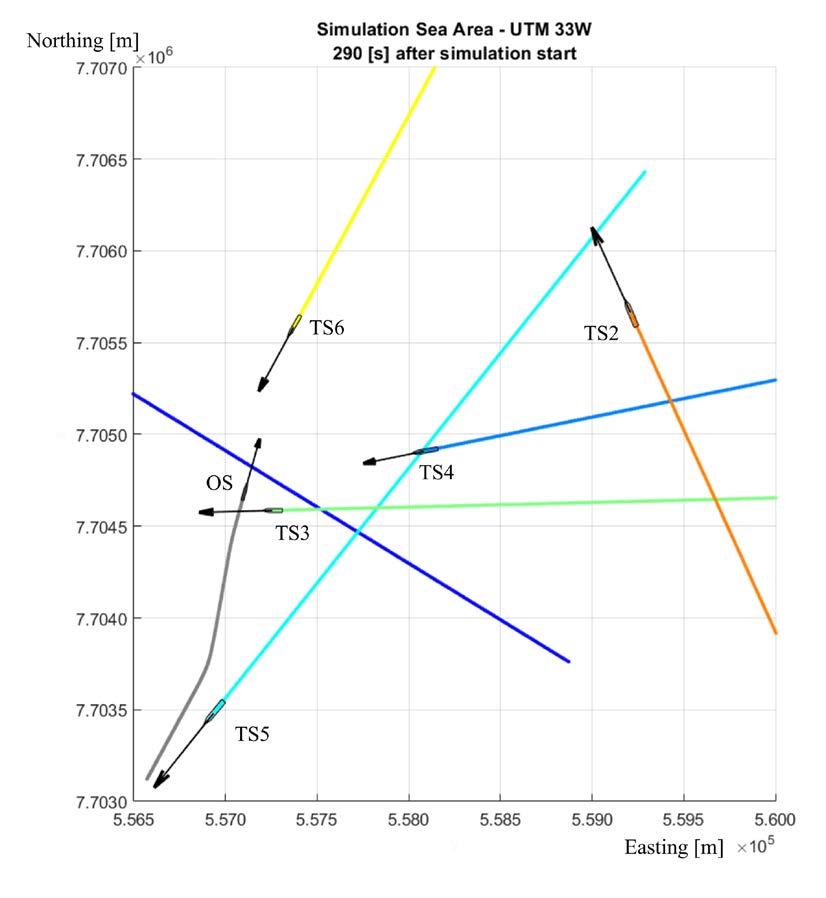
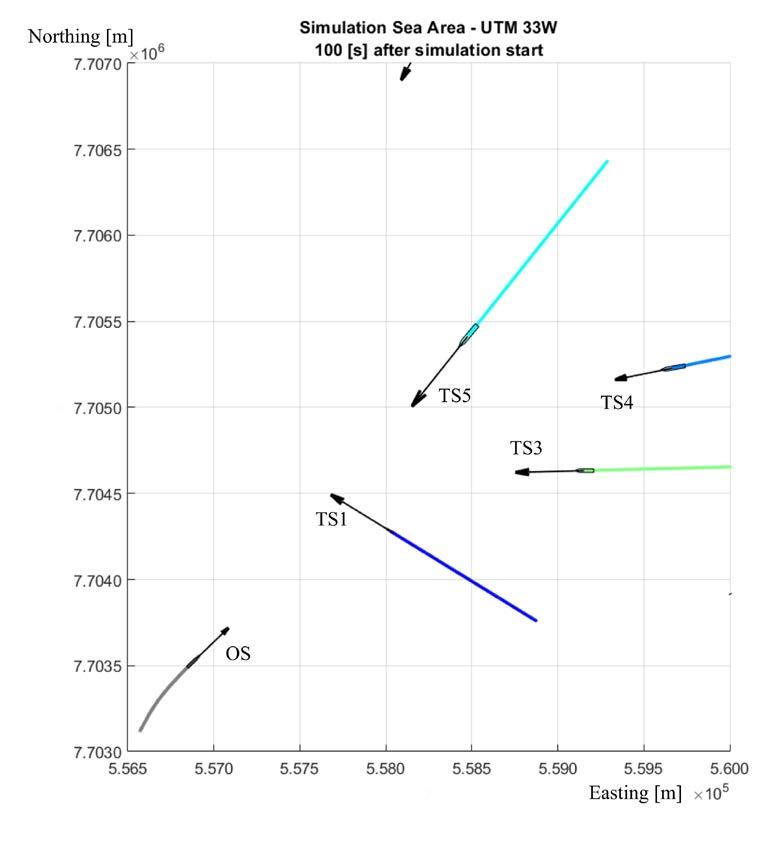
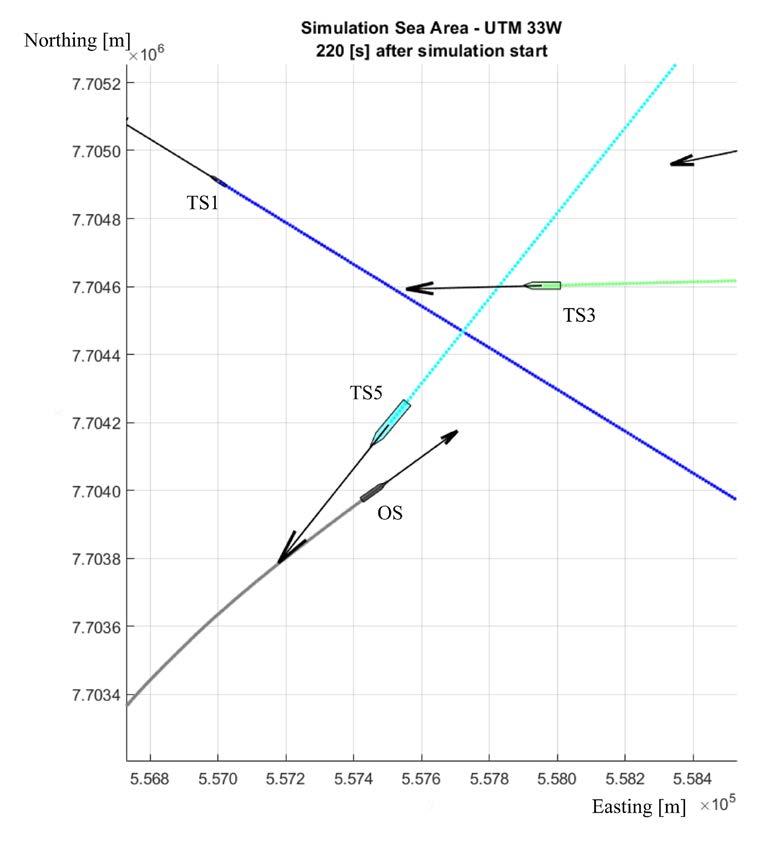
Ainformation from both automatic radar plotting aid and limited camera.
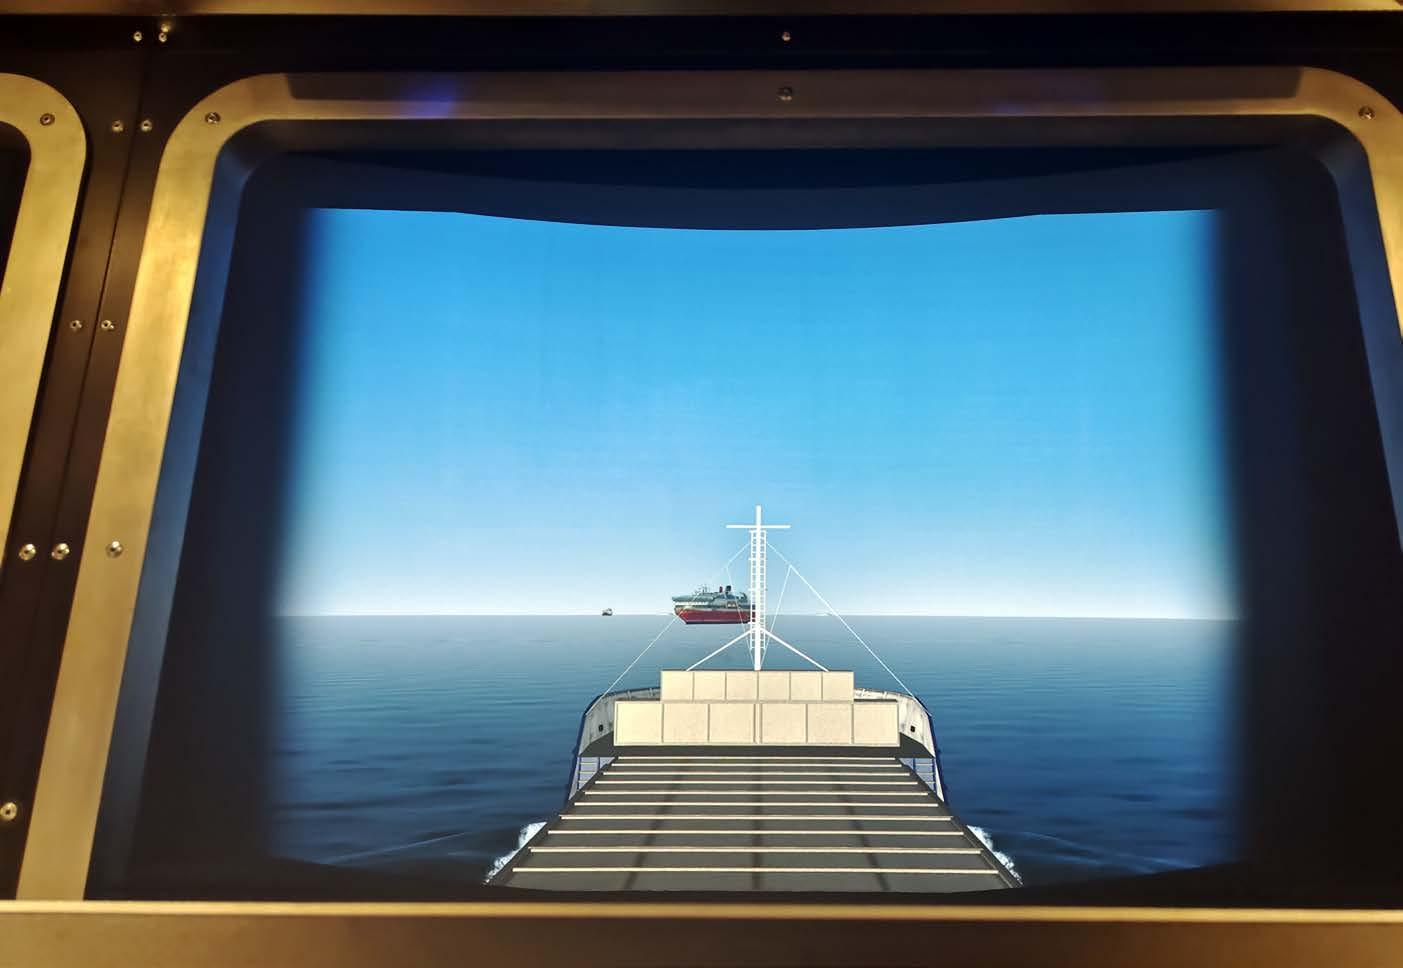
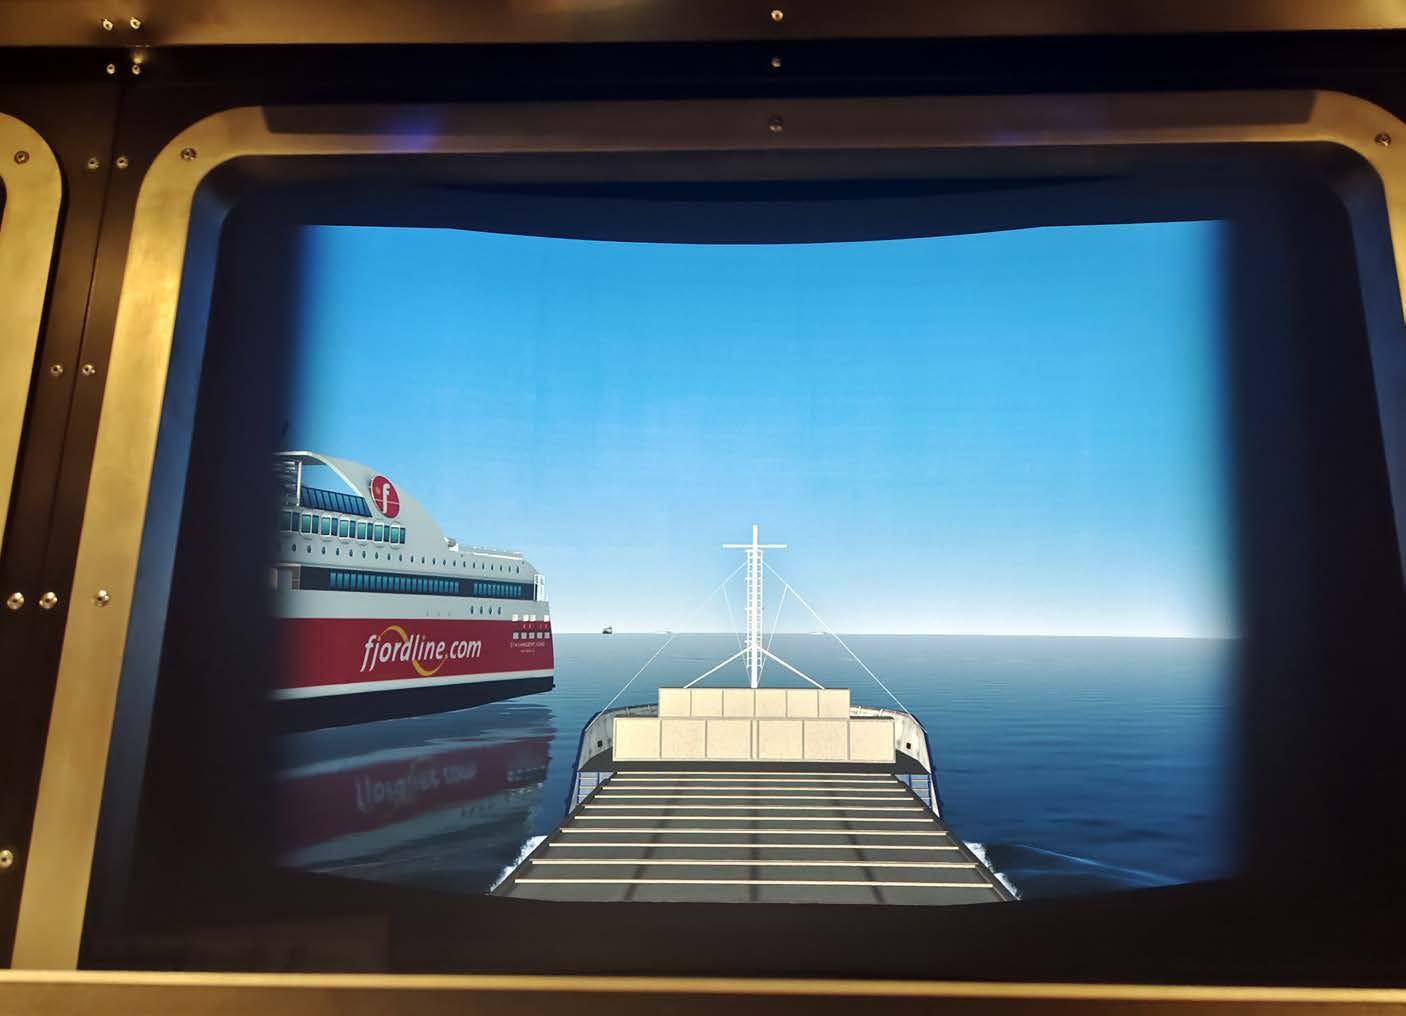
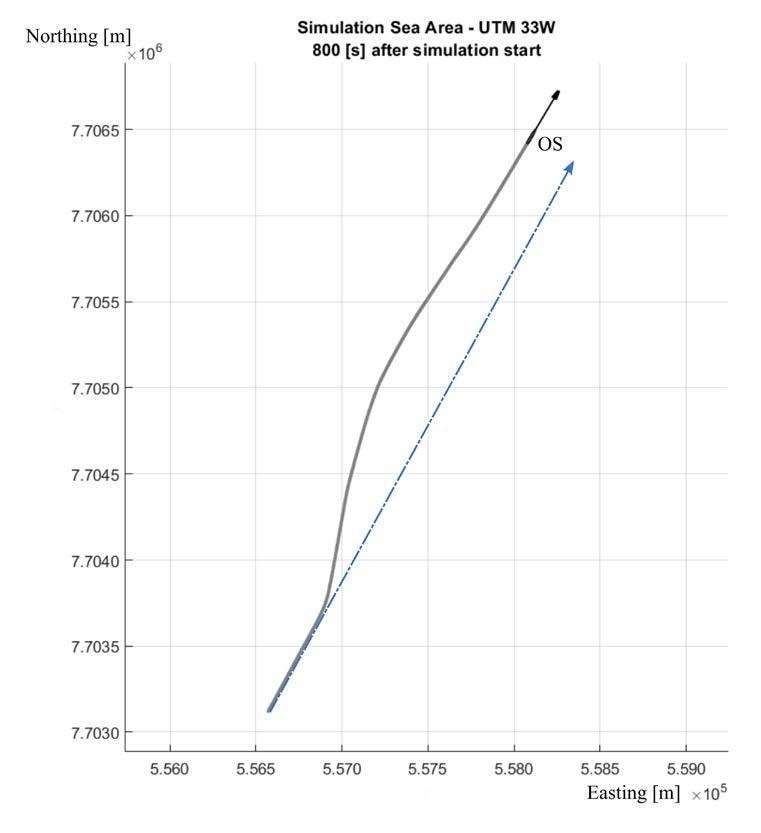
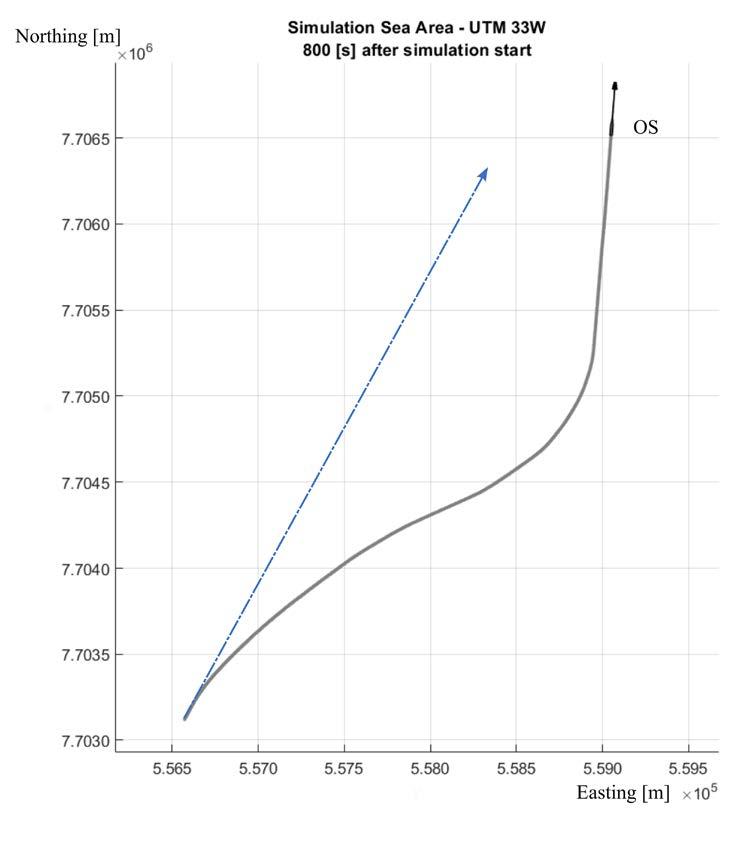
A11: Comparison of manoeuvres from the beginning to 800 seconds. (The original course is shown with a blue dash arrow.)
(a) Own ship (OS) trajectory in Case 1 from Operator A; (b) OS trajectory in Case 2 from Operator B.
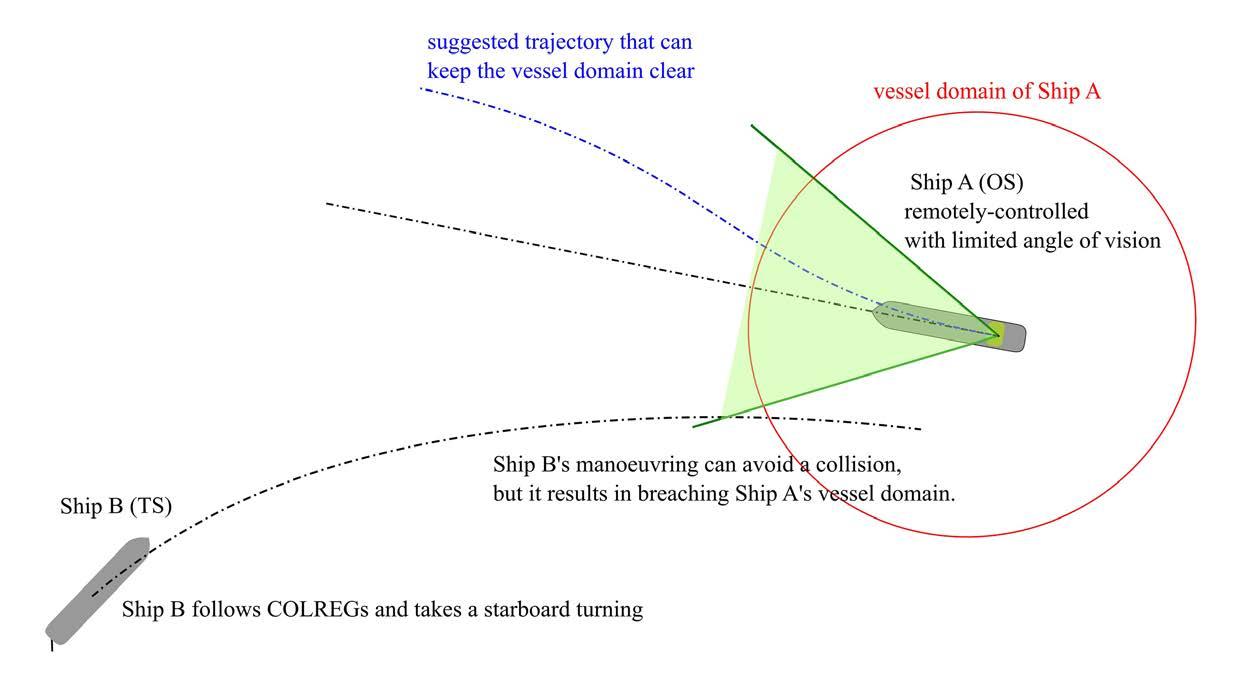
information is solely from radar systems or combined with limited vision, which differs significantly from the navigators’ onboard visual perception. These variations in perceiving target ships in a sea environment may result in diverse understandings of the current situation and potential predictions made by operators in the OOC.
The simulated manoeuvring in Case 1 highlights the unique aspects of maritime navigation. If OS strictly adheres to COLREGs, it should function as the give-way vessel and execute a starboard turn. However, it is crucial to acknowledge that the decisionmaking process in maritime navigation is often more intricate and occasionally ambiguous compared to land transportation, which is regulated by roads and traffic signals. In practical terms, conventional navigation usually involves ship-to-ship communication before implementing avoidance strategies. Crewed ships can communicate swiftly via radio, flares, or sirens. However, no
established communication standard exists in cases involving remote controlled ships. Since operator staff are not physically present on board in remotely operated ships, communication with other target ships is significantly different from the conventional scenarios. Case 1 illustrates a scenario where the operator of the remotely operated ship makes decisions independently without communicating with the target ships. Such behaviour has the potential to confuse nearby TS and result in misunderstandings. The close encounter situations resulting in Case 1 also suggest the necessity of considering a relevant vessel emergency plan (VEP) for remotely operated ships. Given the absence of personnel on board, the OOC should be able to activate and execute the VEP. This also poses a challenge to the development of autonomous ships.
This case study recommends establishing a vessel domain for remotely controlled ships, mainly when operators in the OOC
have limited visibility. As demonstrated in Figure 12, despite Ship B following the COLREGs and executing a starboard turn, it is predictable that when Ship B passes to the port side of Ship A, it falls directly within the blind spot of limited vision. Ship A’s inability to spot Ship B at close range visually can potentially threaten both ships. Under such circumstances, Ship A could make a slight starboard adjustment to uphold a clear vessel domain, guaranteeing sufficient space and a more considerable time frame to respond to unexpected occurrences.
The existence of vessel domains can cause navigational constraints that may surpass human empirical computation abilities. Therefore, assistance from the OOC can become crucial in addressing this aspect. One possible supportive function is the advanced ship predictors, which can precisely predict ship trajectories locally and globally [43], [44], and that can be used to detect trajectory intersections of vessel domain situations as possible collision risk ship encounters. Such predictions not only ensure safety but also positively impact economics and costs. In Case 2, despite choosing a safer route and making careful manoeuvres, it resulted in greater mileage and notable alterations to the course. A frequent occurrence of such scenarios can escalate overall costs. Therefore, while prioritizing safety during navigation, the OOC should also aim to optimize routes as much as possible.
The current study provides an overview of autonomous shipping technology and its needs from an OOC operational perspective. Furthermore, this study elaborates on the role
of an OOC and operators in adopting required autonomous technology into the shipping industry. The OOC will be developed from a functional support perspective to monitor and ensure safe operation of autonomous vessels according to international laws and human-in-the-loop-like applications. The proposed working scheme and operator action loop provide future direction for R&D in this domain. For adopting such an approach, this study also provides direction on future maritime workforce training requirements according to future autonomous vessel technology. The case study simulates vessels remotely operated by the OOC operators using a bridge simulator environment. Results indicate the advantages and drawbacks of utilizing different system information to operate ships in a simulated environment. This will help to design a more robust and feasible future OOC. The OOC may solve most of the maritime industry’s challenges and regulatory authorities’ concerns at all autonomy levels. The main contribution of this research study can be defined as the knowledge and competence development on the role of the OOC and operators.
This work is supported by the Norwegian Ministry of Education and Research under the MARKOM II project, Onshore Operation Center for Remotely Controlled Vessels (OOC) (with contract number PMK-2022\10014.) That is a development project for maritime competence established by the Norwegian Ministry of Education and Research in cooperation with the Norwegian Ministry of Trade, Industry and Fisheries.
1. Golbabaei, F.; Yigitcanlar, T.; and Bunker, J. [2021]. The role of shared autonomous vehicle systems in delivering smart urban mobility: a systematic literature review. International Journal of Sustainable Transportation 15(10), pp. 731-748.
2. Cahoon, S. and Haugstetter, H. [2008]. Shipping, shortages and generation Y. Proceedings, Maritime Technology and Training conference (MarTech).
3. Kooij, C. and Hekkenberg, R. [2021]. The effect of autonomous systems on the crew size of ships–a case study. Maritime Policy & Management 48(6), pp. 860-876.
4. Gavalas, D.; Syriopoulos, T.; and Roumpis, E. [2022]. Digital adoption and efficiency in the maritime industry. Journal of Shipping and Trade 7(1), pp. 11.
5. Scheidweiler, T. et al. [2019]. Dynamic ‘standing orders’ for autonomous navigation system by means of machine learning. Journal of Physics: Conference Series, 1357(1). IOP Publishing.
6. Ghaderi, H. [2019]. Autonomous technologies in short sea shipping: trends, feasibility, and implications. Transport Reviews 39(1), pp. 152-173.
7. Dachev, Y. and Lazarov, I. [2019]. Impact of the marine on the health and efficiency of seafarers. WSEAS Transactions on Business and Economics 16, pp. 282-287.
8. Elkins, L.; Sellers, D.; and Reynolds Monach, W. [2010]. The Autonomous Maritime Navigation (AMN) project: field tests, autonomous and cooperative behaviors, data fusion, sensors, and vehicles. Journal of Field Robotics 27(6), pp. 790-818.
9. Shah, S.; Logiotatopouloh, I.; and Menon, S. [2019]. Industry 4.0 and autonomous transportation: the impacts on supply chain management. International Journal of Transportation Systems, 4, pp. 45-50.
10. Perera, L.P. [2018]. Autonomous ship navigation under deep learning and the challenges in COLREGs. International Conference on Offshore Mechanics and Arctic Engineering, 51333, p. V11BT12A005. American Society of Mechanical Engineers.
11. Kr Dev, A. and Saha, M. [2015]. Modeling and analysis of ship repairing time. Journal of Ship production and Design, 31(02), pp. 129-136.
12. Munim, Z.H. [2019]. Autonomous ships: a review, innovative applications, and future maritime business models. Supply Chain Forum: An International Journal, 20(4), pp. 266-279. Taylor & Francis.
13. Curcio, J.; Leonard, J.; and Patrikalakis, A. [2005]. SCOUT-a low cost autonomous surface platform for research in cooperative autonomy. Proceedings, Oceans 2005 MTS/IEEE. IEEE.
14. Caccia, M. et al. [2008]. Basic navigation, guidance and control of an unmanned surface vehicle. Autonomous Robots 25(4), pp. 349-365.
15. Pascoal, A. et al. [2000]. Robotic ocean vehicles for marine science applications: the European ASIMOV project. Proceedings, Oceans 2000.
16. Caccia, M.; Bono, R.; Bruzzone, G.; Bruzzone, G.; Spirandelli, E.; Veruggio, G.; Stortini, A.; and Capodaglio, G. [2005]. Sampling sea surface with SESAMO. IEEE Robotics and Automation Magazine, 12(3), pp. 95-105.
17. Xu, T.; Chudley, J.; and Sutton, R. [2006]. Soft computing design of a multi-sensor data fusion system for an unmanned surface vehicle navigation. Proceedings, 7th IFAC Conference on Manoeuvring and Control of Marine Craft.
18. Felski, A. and Zwolak, K. [2020]. The ocean-going autonomous ship – challenges and threats. Journal of Marine Science and Engineering, 8(1), pp. 41.
19. Wróbel, K.; Montewka, J.; and Kujala, P. [2017]. Towards the assessment of potential impact of unmanned vessels on maritime transportation safety. Reliability Engineering & System Safety, 165, pp. 155-169. http://dx.doi. org/10.1016/j.ress.2017.03.029.
20. Perera, L.P.; Oliveira, P.; and Soares, C.G. [2012]. Maritime traffic monitoring based on vessel detection, tracking, state estimation, and trajectory prediction. IEEE Transactions on Intelligent Transportation Systems, 13(3), pp. 1188-1200.
21. Perera, L.P. and Murray, B. [2019]. Situation awareness of autonomous ship navigation in a mixed environment under advanced ship predictor. International Conference on Offshore Mechanics and Arctic Engineering, 58851, p. V07BT06A029. American Society of Mechanical Engineers.
22. Saha, R. [2021]. Mapping competence requirements for future shore control center operators. Maritime Policy & Management, 50(4), pp. 415-427.
23. ABS [2022]. Autonomous vessels. Retrieved from: https://absinfo.eagle.org/acton/attachment/16130/feab53b6f-b7a8-4982-8a7f-07eda32f3906/1/-/-/-/-/ autonomous-vessels-whitepaper-22031.pdf.
24. Bachari-Lafteh, M. and Harati-Mokhtari, A. [2021]. Operator’s skills and knowledge requirement in autonomous ships control centre. Journal of International Maritime Safety, Environmental Affairs, and Shipping, 5.2, pp. 74-83.
25. Autoship [2022]. Autonomous ships: training framework for crew, operators and designers. Retrieved from: https://www.autoship-project.eu/ downloads/Autonomous Ships Training Framework.
26. Sanchez-Gonzalez, P.L.; Díaz-Gutiérrez, D.; Leo, T.J.; and Núñez-Rivas, L.R. [2019]. Toward digitalization of maritime transport. Sensors, 19(4), pp. 926.
27. Ichimura, Y.; Dalaklis, D.; Kitada, M.; and Christodoulou, A. [2022]. Shipping in the era of digitalization: mapping the future strategic plans of major maritime commercial actors. Digital Business, 2(1), 100022.
28. IMO [n.d.]. Autonomous shipping. Retrieved from:
https://www.imo.org/en/MediaCentre/HotTopics/ Pages/Autonomous-shipping.aspx.
29. Bratić, K. et al. [2019]. A review of autonomous and remotely controlled ships in maritime sector. Transactions on Maritime Science 8(02), pp. 253-265.
30. IMO [2018]. Working group report in 100th session of IMO Maritime Safety Committee for the regulatory scoping exercise for the use of maritime autonomous surface ships. Maritime Safety Committee 100th session, MSC 100/ WP.8.
31. Wu, H.-K.; Lee, S.W.-Y.; Chang, H.-Y.; and Liang, J.C. [2013]. Current status, opportunities and challenges of augmented reality in education. Computers & Education, 62, pp. 41-49.
32. Michael-Grigoriou, D.; Kleanthous, M.; Savva, M.; Christodoulou, S.; Pampaka, M.; and Gregoriades, A. [2014]. Impact of immersion and realism in driving simulator studies. International Journal of Interdisciplinary Telecommunications and Networking, 6, pp. 10-25.
33. Sportillo, D.; Paljic, A.; Boukhris, M.; Fuchs, P.; Ojeda, L.; and Roussarie, V. [2017]. An immersive virtual reality system for semi-autonomous driving simulation: a comparison between realistic and 6-DoF controllerbased interaction. International Conference on Computer and Automation Engineering, 2017, Sydney, Australia. 10.1145/3057039.3057079. hal-01478968.
34. Marai, O.E.; Taleb, T.; and Song, J. [2023]. ARbased remote command and control service: selfdriving vehicles use case. IEEE Network 37(3), pp. 170-177.
35. Oh, J.; Park, S.; and Kwon, O.-S. [2016]. Advanced navigation aids system based on augmented reality. International Journal of e-Navigation and Maritime Economy, 5, pp. 21-31.
36. Erickson, A.; Kim, K.; Bruder, G.; and Welch, G.F. [2020]. Exploring the limitations of environment lighting on optical see-through head-mounted displays. Proceedings, 2020 ACM Symposium on Spatial User Interaction. Virtual Event, Canada, Association for Computing Machinery: Article 9.
37. Wang, Y.; Zhai, G.; Chen, S.; Min, X.; Gao, Z.; and Song, X. [2019]. Assessment of eye fatigue caused by head-mounted displays using eye-tracking. BioMedical Engineering OnLine, 18(1), pp. 111.
38. Ramos, M.A.; Utne, I.B.; and Mosleh, A. [2018]. On factors affecting autonomous ships operators’ performance in a shore control center. Proceedings, 14th Probabilistic Safety Assessment and Management, Los Angeles, CA, USA, pp. 16-21.
39. Man, Y. et al. [2015]. From desk to field – human factor issues in remote monitoring and controlling of autonomous unmanned vessels. Procedia Manufacturing, 3, pp. 2674-2681.
40. Adnan, M. and Perera, L.P. [2024]. Operational support framework for maritime autonomous surface ships under onshore operation centers. 7th
International Conference on Maritime Technology and Engineering (MARTECH), Lisbon, Portugal.
41. Adnan, M. and Perera, L.P. [2024]. Navigational support framework for maritime autonomous surface ships under onshore operation centers. 7th International Conference on Maritime Technology and Engineering (MARTECH), Lisbon, Portugal.
42. Adnan, M. et al. [2024]. Functional requirements for onshore operation center in the context of remotely operated ships. 34th International Ocean and Polar Engineering Conference (ISOPE), Rodos Palace Hotel, Rhodes (Rodos), Greece.
43. Wang, Y.; Perera, L.P.; and Batalden, B.-M. [2023]. Kinematic motion models based vessel state estimation to support advanced ship predictors. Ocean Engineering, 286, pp. 115503.
44. Murray, B. and Perera, L.P. [2020]. A dual linear autoencoder approach for vessel trajectory prediction using historical AIS data. Ocean Engineering, 209, 107478.
45. Öztürk, Ü.; Akdağ, M.; and Ayabakan, T. [2022]. A review of path planning algorithms in maritime autonomous surface ships: navigation safety perspective. Ocean Engineering, 251, 111010.
46. Bui, K.; Perera, L.; and Emblemsvåg, J. [2022]. Life-cycle cost analysis of an innovative marine dual-fuel engine under uncertainties. Journal of Cleaner Production, 380, 134847.
47. Endsley, M.R. [1995]. Toward a theory of situation awareness in dynamic systems. Human factors, 37(1), pp. 32-64.
48. IMO [1972]. Convention on the International Regulations for Preventing Collisions at Sea, 1972 (Colregs). Retrieved from: https://www.imo.org/en/ About/Conventions/Pages/COLREG.aspx.
49. Perera, L.P. and Murray, B. [2019]. Situation awareness of autonomous ship navigation in a mixed environment under advanced ship predictor. International Conference on Offshore Mechanics and Arctic Engineering, 58851. American Society of Mechanical Engineers.
50. Kato, Y. [2021]. Effect of information presentation method on collision avoidance behaviour in ship maneuvering. Kobe University.
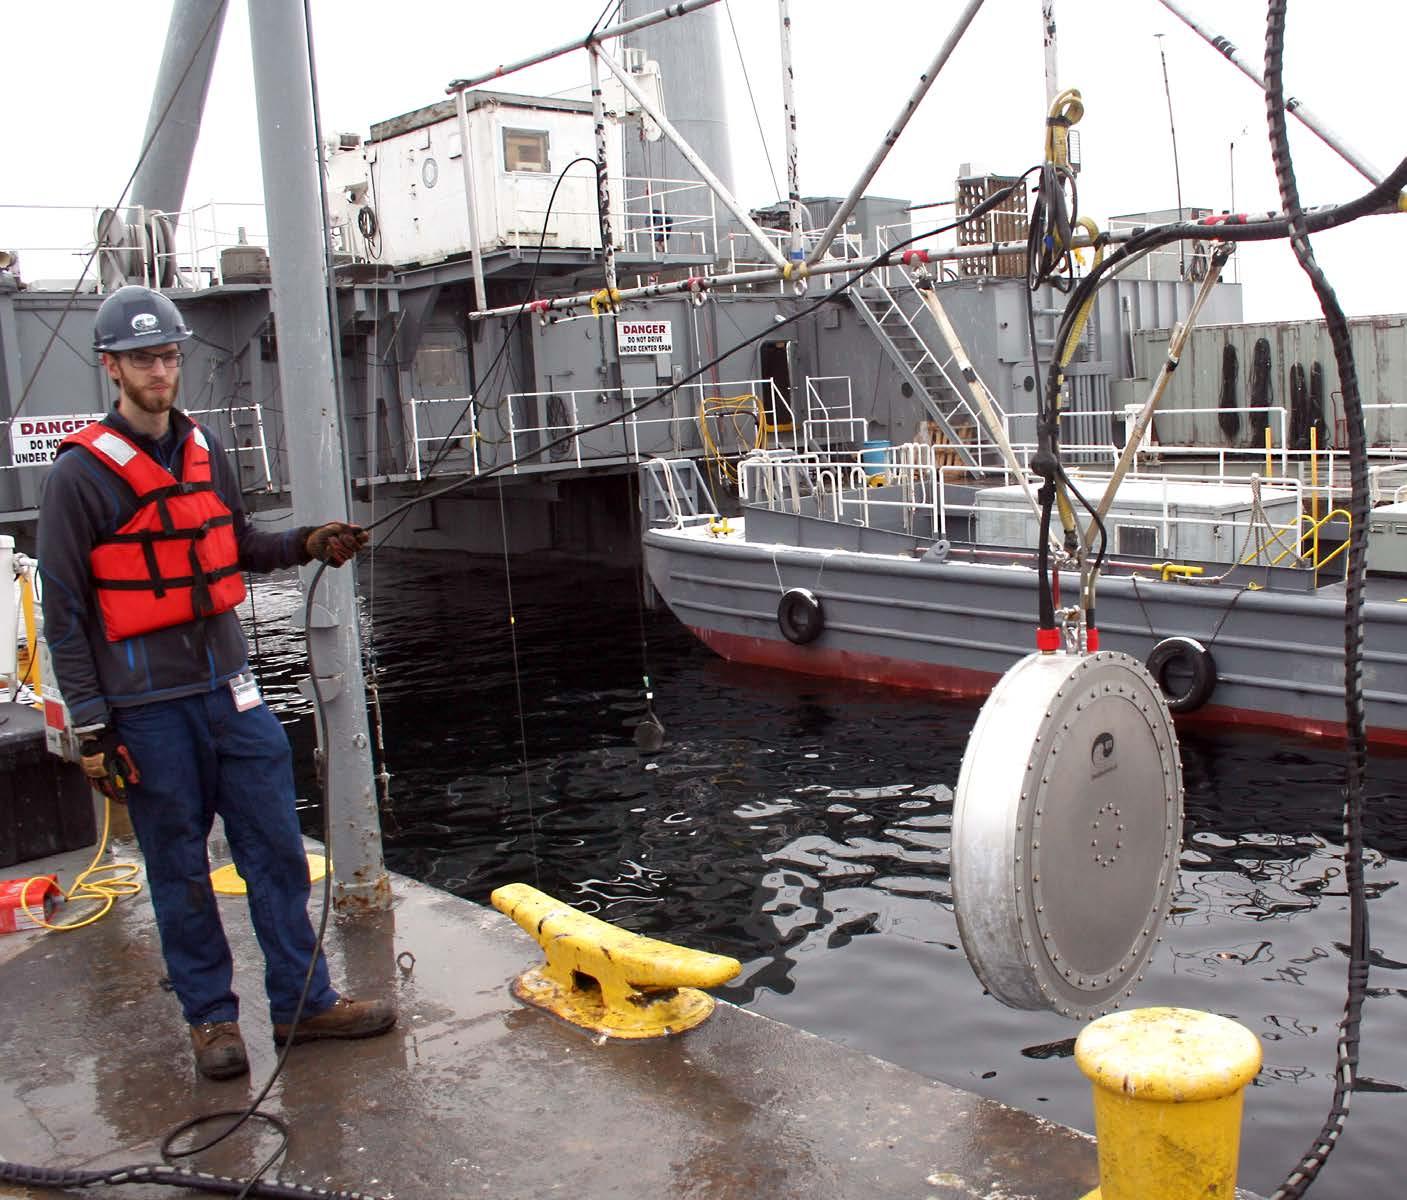
Dainis Nams is an engineer whose career has focused on leadership and technology development in the marine acoustics sector. In his role as GeoSpectrum’s director of engineering, he runs the Engineering Department, which develops and maintains the company’s core sonar and transducer product lines. With an education in mechanical engineering and a master’s in marine robotics, Mr. Nams began his career designing components for sonobuoys and towed sonar systems before rapidly moving to systems engineering and technical management. He has managed multiple towed sonar build and test programs and led the development of two of GeoSpectrum’s product lines: the patented C-Bass low-frequency electromagnetic marine vibrator and the M670 hull mounted sonar.
Where were you born? Where is home today?
I was born in Whitehorse, Yukon Territories, and now live in Halifax, Nova Scotia.
What is your occupation?
I’m an engineer at GeoSpectrum, a marine acoustic sensor and sonar company.
Why did you choose this occupation?
Engineering was a deliberate choice – because I like solving real problems and playing with technology – but I fell into the marine sector almost by accident because there are so many good opportunities in Halifax.
Where has your career taken you?
From leading robotics teams (during both educational degrees) to designing components for someone else’s sonar to leading a team developing my own sonar to building an engineering department capable of producing next generation sonars.
What hobbies do you enjoy?
Chasing my three small children, mountain biking, and renovating my century home.
What has been the highlight of your career so far? It is hard to pick just one, but I have particularly enjoyed my work on a novel low-frequency transducer. A small team of us developed it from basic principles around six years ago, and it has since become a successful product line used around the globe for an increasing number of applications. The photo shows me testing it at the US Navy Seneca Lake facility.
What do you like most about working in this field?
The ocean is an incredibly harsh and beautiful environment, meaning that there is always something new to do when working in marine technology.
Why do you stay at your current company?
I have spent most of my career in one place – an approach that is increasingly rare in my millennial generation. In fact, having done a master’s in robotics, I did not plan to work in acoustics at all.
But I have realized that what is more important than the exact technology you work on is the culture in
which you live a third of your life. I stay where I am because I love being part of a company led by people who genuinely respect its employees and where we support each other and grow together.
What are some of the biggest challenges your job presents?
There is so much that a capable company can do in this sector that it is impossible to have enough time to do it all. Choosing what opportunities and technology we will (and will not) pursue is tough but keeps us focused on what is most important.
What technological advancements have you witnessed?
The miniaturization of computing devices has impacted marine tech just as much as every other field, with components and systems becoming smaller, smarter, and better able to function without operator oversight.
What does the future hold for this industry?
In the near future, we expect to see an increasing push toward unmanned surveillance platforms as part of a broader interest in marine surveillance due to shifting global power balances.
What advice do you have for those just starting their careers and for students wanting to get into this industry?
For those starting their careers, do not start in this field (or any) unless you are genuinely passionate about it. Anyone can learn skills and gain experience, but those with enthusiasm for their work stand out and find it most fulfilling.
For students interested in this industry, set yourself apart by seeking hands-on experience beyond the curriculum. Extracurricular tech teams are one great way to do this: as a founding member of the Dalhousie ROV Team, I attended four MATE international ROV competitions. This taught me as much as all my classes combined, plus it introduced me to my first employer.
Real-time Marine Weather Data for Unprecedented Insights and Enhanced Situational Awareness
by Dan Reed and Carson Straub
The World Economic Forum has identified weather as the number one threat to society. In the marine domain, weather has always represented a serious threat to the safety of maritime vessels and their crews. Moreover, weather plays a central role in fleet operations and logistics, as well as sustainability which is increasingly pertinent as we address ongoing climate change. Yet, despite the importance of weather in the marine domain, forecasts are typically inaccurate. For example, OceanSync observations show that ~30% of the time that good weather is predicted (i.e., winds less than 10 knots), bad weather is actually observed (greater than 10 knots). While cutting-edge AI weather models hold a great deal of promise, these models are data hungry and weather stations are extremely sparse throughout the global ocean.
OceanSync, based in Halifax, Nova Scotia, was founded to address these issues by developing and deploying low-cost, fully-automated, shipborne IoT systems for capturing weather data. These platforms – termed gateways (Figure 1) – not only ingest meteorological data, but are sensor agnostic, enabling limitless types of data to be harvested from a ship in real time. OceanSync gateways support decisionmakers whether they are focused on JIT logistics, safety, efficiency, and/or sustainability by enhancing situational awareness through real-time, ship-to-shore data exchange across a wide range of data sources and types.
The OceanSync gateway has a modular design that does not require integration with
a ship’s existing systems or instrumentation. By adopting a plug-and-play approach to data acquisition, the gateway effectively reduces the cost-per-observation at sea by a factor of between six and ten. Being sensor agnostic means that it is extremely flexible and extendable, and complementary data sources are readily integrated by connecting additional instruments. This design also significantly simplifies installation: a gateway is shipped to the vessel along with sensors and can be installed quickly and easily by the crew.
Edge processing on the gateway helps to minimize the amount of data that must be transmitted to our cloud-based data warehouse. Observations are uploaded at a specified cadence via satellite link while at sea or independent LTE connection when in coastal waters or in port. Upon arrival, data undergoes a thorough QA process, which includes checks for completeness, internal consistency, and validity, as well as data fusion to supplement our observations with third party datasets, such as global weather forecasts, ocean waves and currents, proximity to ports and anchorages, geohashes, among others. The entire process – from data harvesting to analysis and dissemination – is fully automated, furnishing customers with robust, real-time insights.
There are no constraints on the types of data that are ingested. We currently deploy receivers that capture Automatic Identification System (AIS) messages from nearby vessels and the host vessel, giving fleet operators visibility of nearby traffic without needing satellite AIS subscriptions. In addition, we also capture motion data – roll, pitch, and yaw –contextualizing the weather experienced by the vessel, its cargo, and crew. This data aids in incident analysis and can predict risks in real time such as container loss due to parametric rolling. Additionally, OceanSync gateways gather radar data to detect non-AIS targets, vital for securing maritime borders.
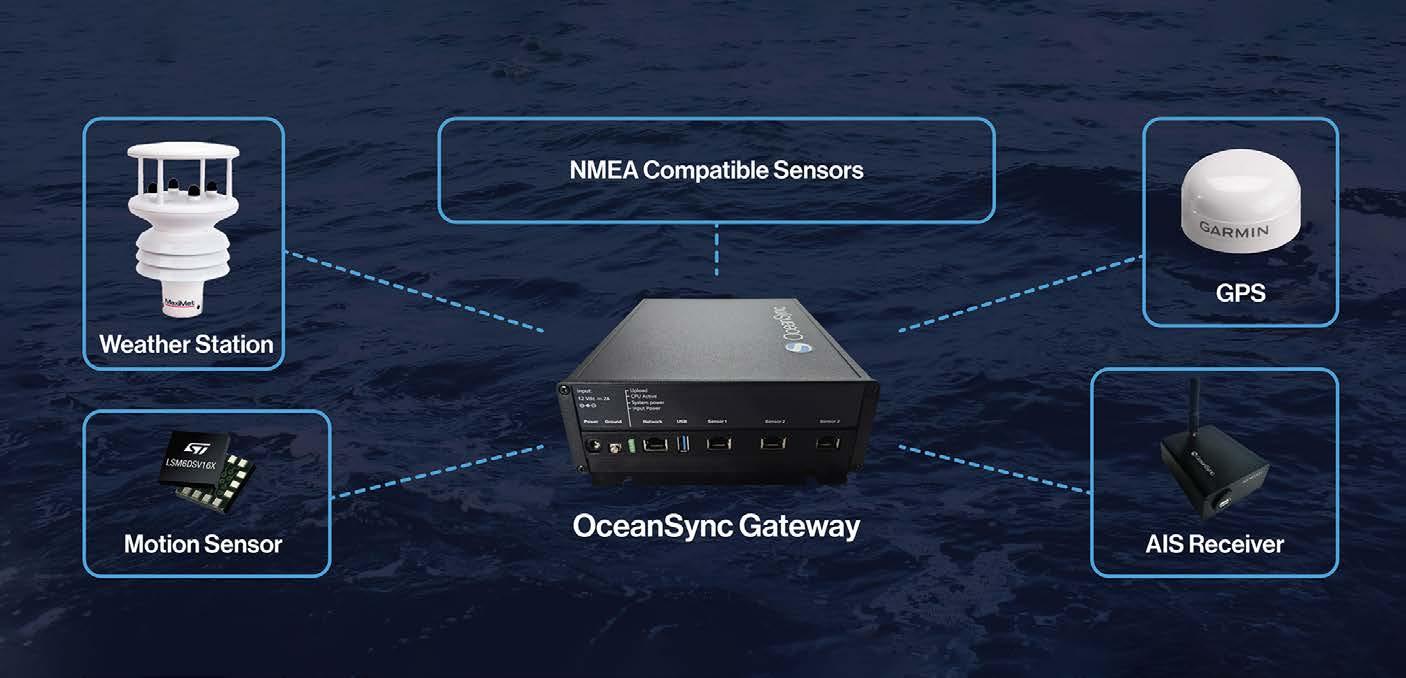
Products, Services, and Beyond
OceanSync offers a suite of products and services that cater to a variety of customers, including fleet managers, vessel captains, and protection and indemnity clubs, among others. Live dashboards, which provide vessels’ current positions, statuses, environmental conditions, and other data captured on the gateway, enable managers to monitor their fleets in real time through maps, time series, tables, and other intuitive visual elements. It is here that fleet managers can track changing weather conditions and hone in on specific vessels to monitor their progress under certain conditions or in specific regions.
Voyage reports are generated automatically when a vessel reaches its destination and are distributed via email to customers. They include a detailed summary of all data captured throughout the voyage in the form of a digital log, time series of environmental conditions and vessel dynamics, plots of wind and wave intensity distribution relative to the vessel, and a classification of periods of “good” and “bad” weather. OceanSync’s automated approach eliminates manual data entry, providing fleet managers with immediate notifications and an in-depth voyage summary. For unpredictable events like severe weather, OceanSync also offers incident reporting, highlighting key data to better understand the event.
Owing to its rigorous and robust data processing pipelines, OceanSync produces datasets that are AI ready. As advanced weather models like GraphCast and NeuralGCM evolve, clean, accurate data will become ever more important. Data collected by OceanSync can be used as both training data and input data for AI weather models, enabling the creation of high-resolution localized weather forecasts. By establishing a broad network of weather observing systems, forecasts can be generated for specific vessels or regions such as ports and high-traffic waterways. The accuracy of AI predictions is directly tied to input data quality. Higher quality datasets lead to more precise model predictions.
While we cannot control the weather, OceanSync’s network of data capture IoT devices and cloud-based data platforms provide an opportunity to glean key insights into marine weather as it happens to support critical decision-making. These insights will only become all the more important as extreme weather becomes increasingly common due to climate change.
by Anahita Laverack
Oshen develops fully autonomous, winddriven robotic vessels for remote ocean sensing, enabling continuous monitoring of waves and weather with a network of small, cost-effective micro-vessels. In this article, we report on our two UK Department for Environment, Food, and Rural Affairs (DEFRA) funded projects where micro-vessels have been deployed for cetacean monitoring and metocean data collection.
Before we go into details, we provide a quick overview of the platform and sensing capabilities. We make autonomous microvessels (1 m length platforms) to collect ocean data. The micro-vessels use wind for propulsion, and solar panels power the onboard electronics (Figure 1). This means that their effective mission duration can extend to six or more months. Our sensing capability to date includes a suite of environmental and metocean sensors: a keel-mounted hydrophone for passive acoustic monitoring (PAM), weather observations such as air pressure and significant wave height, and visual surface observations. Operating at speeds of 1-3 knots, we have completed 100 km+ missions, operated in conditions up to 2.5 m wave height and 40 kt gusts.
All navigational logic, including corrections for tide and upwind behaviour, is processed on board. Users only need to send a waypoint to the micro-vessel, which autonomously handles the rest.
In partnership with DEFRA, we worked on
a project last year aimed at evaluating the feasibility of using our wind-driven microvessels for acoustic and visual sensing. Following this, we have received a phase 2 project to roll out a full end to end monitoring system. This initiative, funded by DEFRA’s marine natural capital and ecosystem assessment program, seeks to fill key gaps in DEFRA’s Offshore Wind Enabling Actions Programme and the UK’s marine strategy by offering a cost-effective and efficient solution for continuous marine monitoring.
Following initial trials around Anglesey, we conducted three final day-long deployments in Cardigan Bay, home to the UK’s largest resident Bottlenose Dolphin population. The dolphins in Cardigan Bay are among the most studied in the UK. Extensive research has been conducted on their behaviour, social structure, and habitat use. The area is monitored by several organizations, including the Cardigan Bay Marine Wildlife Centre (CBMWC) and the Sea Watch Foundation, which conduct regular surveys and research projects. This made it an ideal test site for an initial study, as we could compare our findings with the existing research and data for the area.
Equipped with two different hydrophones, our aim was to assess the audio quality of data collected from our micro-vessel. Over six sea trials, the vessel sailed autonomously for 35 km, totalling 18 hours of sea time, gathering extensive audio recordings and visual data.
We successfully recorded audio of Bottlenose Dolphins using both high-end and costeffective hydrophones. Our micro-vessels, being a quiet asset due to not having a propeller, made them ideally suited to PAM of the Bottlenose Dolphins, which the analysis revealed to be more frequently located near the coast, aligning with existing research.
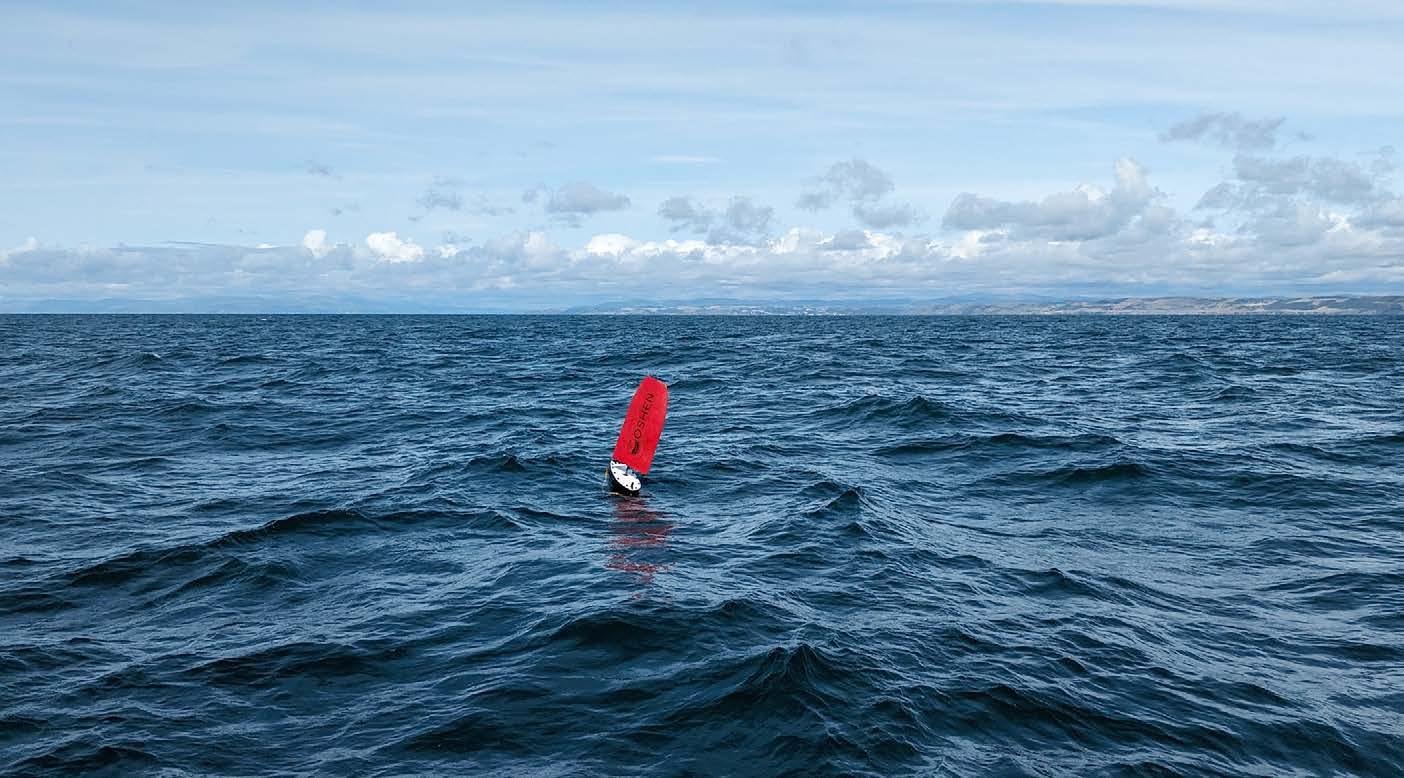
Onboard cameras captured images of seabirds, including Manx Shearwaters, while a live dashboard was developed for real-time data transmission, providing crucial metocean data and vessel statistics every five minutes. The collected data was shared with scientists at CBMWC, which confirmed that the quality was sufficient for future research and monitoring projects.
Developing an autonomous platform like ours entails overcoming two primary categories of technical challenges: software technical problems and practical engineering problems.
Essentially, if you want to find a great navigation algorithm, you can read 100 different papers on the topic, and gain an excellent understanding. If you want to design a really robust waterproof enclosure for your motors and encoders, an experienced engineer can offer much more value than the information you can easily find online. Our team, composed of early career engineers, initially struggled with these issues but learned to navigate them through collaboration and industry knowledge sharing. This distinction shows the benefit of information sharing
and collaboration across the industry. Many of these engineering challenges are solved problems that all hardware developers face, and by sharing solutions with each other it leaves more time for everyone to focus on the innovative side of the technology development.
Our future plans involve deployment across the UK, and a project with the Monterey Bay Aquarium Research Institute. We are currently making a small production run of microvessels and are looking forward to taking on new projects using our PAM and metocean data collection capabilities.
Holding a degree in aeronautical engineering from Imperial College London, Anahita Laverack is the co-founder and CEO of Oshen. She currently oversees Oshen’s strategic development and hardware design, applying her specialized knowledge to advance autonomous marine sensing technologies. www.oshensail.com
by Patricia Sestari
Cold-water coral ecosystems, especially those found on vertical cliffs, represent one of the most intriguing and ecologically significant marine habitats. Despite their importance, these ecosystems remain poorly understood due to their inaccessibility and the limitations of traditional research methods. However, advancements in underwater optical sensors, particularly high-resolution laser scanning technology, are transforming our ability to study these elusive environments.
The recent scientific expedition to the Galápagos Islands serves as a landmark study in the exploration of cold-water coral ecosystems. Funded by the Schmidt Ocean Institute and conducted in collaboration with Memorial University of Newfoundland, the Charles Darwin Foundation, and the Galápagos National Park, this expedition focused on the vertical coral habitats of this UNESCO World Heritage site (Figure 1). Led by chief scientist Dr. Katleen Robert, the team utilized Voyis’ Insight Micro underwater laser scanner to document the complex structures and biodiversity of these corals.
The Voyis Insight Micro laser scanner is at the forefront of underwater optical sensor technology, designed to capture high-resolution 3D laser data and crisp still images. Its capabilities are crucial for studying coldwater coral ecosystems, which present several research challenges. Traditional ship-based
sensors are often unable to reach the depths where these corals thrive. The vertical cliffs and rugged terrains of their habitats require sensors capable of detailed mapping to accurately capture the intricate structures and biodiversity. Additionally, understanding the relationship between water column dynamics, physical reef features, and coral distribution necessitates precise and high-resolution data.
During the Galápagos expedition, the research team employed the ROV SuBastian, equipped with the Voyis Insight Micro laser scanner, to conduct high-precision mapping of the vertical coral reefs. This methodology allowed for an unprecedented level of detail in documenting the reef morphology, biodiversity, and coral growth patterns. The 3D reconstructions revealed complex geological features that influence coral distribution, while high-resolution images enabled the identification of individual coral species and other marine organisms. These insights are essential for understanding the environmental conditions that support coral survival in such challenging habitats.
Cold-water corals do not rely on symbiotic algae for sustenance, unlike their shallowwater counterparts. Instead, they depend on nutrient-rich currents. This unique ecological niche highlights the importance of advanced research methods to study these organisms. The baseline data collected during the Galápagos expedition provide a critical reference for evaluating human impact and shaping conservation efforts. The pristine environment of the Galápagos Marine Reserve, one of the world’s largest marine protected areas, offers an ideal setting for studying undisturbed ecosystems.
The implications of this research extend beyond the scientific community. The detailed
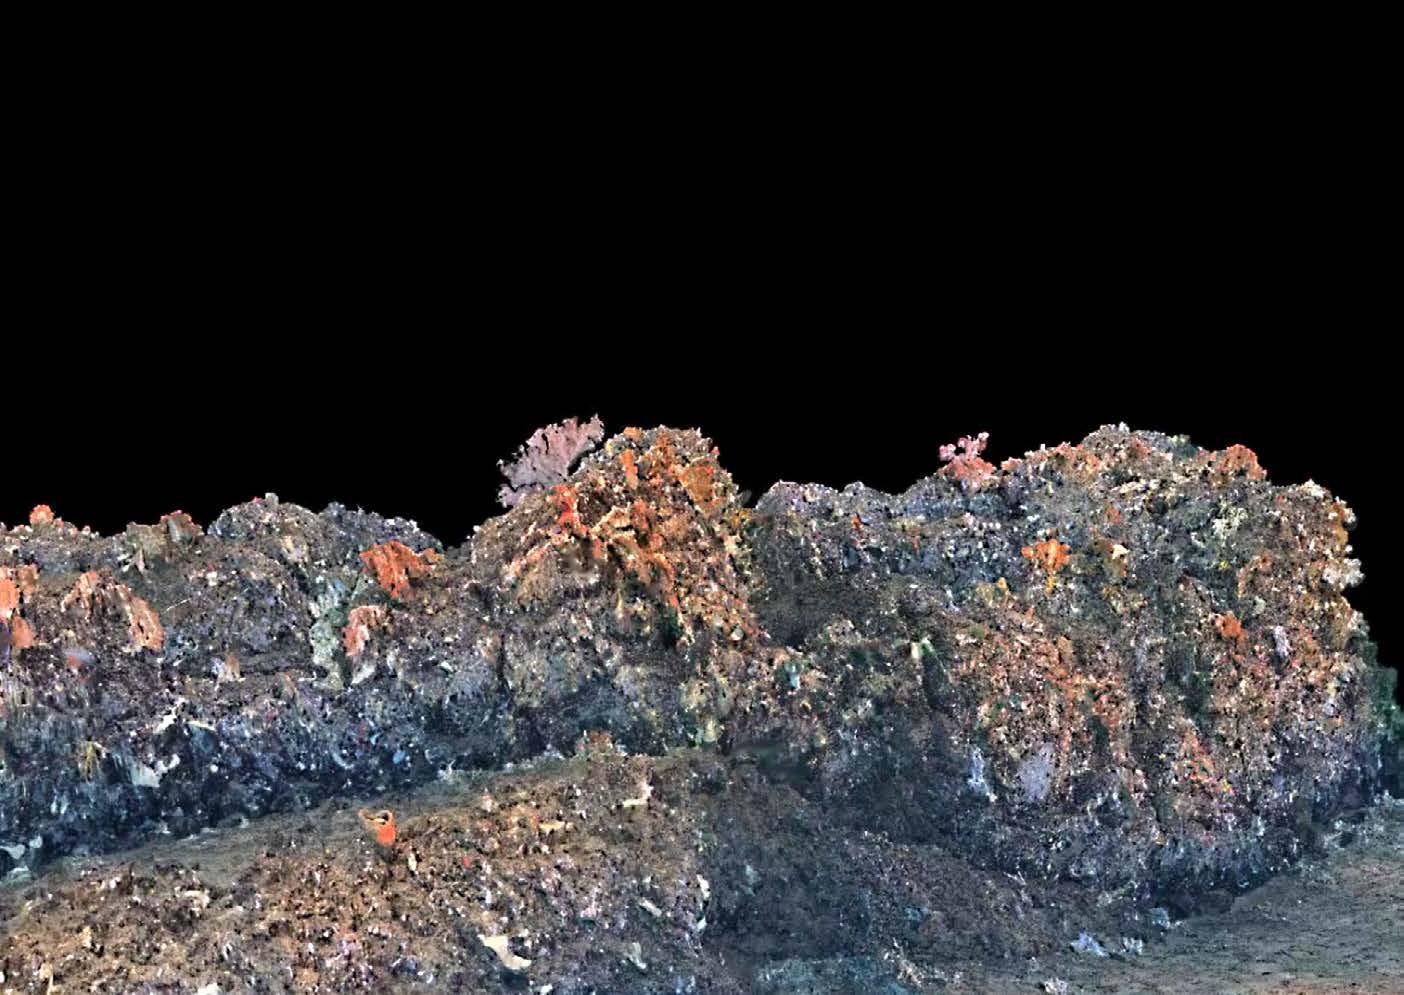
digital reconstructions and high-resolution images generated by the Insight Micro laser scanner offer accessible insights for scientists and the public alike. These tools not only enhance our understanding of cold-water coral ecosystems but also contribute to more informed and effective conservation strategies.
The Galápagos expedition exemplifies the transformative potential of cuttingedge technology in marine research. The deployment of the Voyis Insight Micro laser scanner enabled the team to overcome traditional research limitations and provided unprecedented insights into the complex and diverse world of cold-water corals. This case study underscores the significance of advanced underwater optical sensors in expanding our knowledge of global coral ecosystems
and highlights the importance of continued innovation in marine research technology.
In conclusion, the integration of high-resolution laser scanning technology in the study of coldwater coral ecosystems marks a significant advancement in marine science. The Galápagos expedition, facilitated by Voyis’ Insight Micro laser scanner, demonstrates the vital role of these advanced optical sensors in exploring and documenting previously inaccessible habitats. By providing detailed insights into the structure and biodiversity of deep-sea corals, this research paves the way for more informed conservation efforts and a deeper understanding of these critical marine environments.
by Gorden Konieczek
Magnetometers are widely used in marine applications for different purposes. The biggest advantage of magnetometers in that environment is that the physical quantity the sensor is measuring is not affected by the medium in which the sensor is operated and, to some extent, by the medium in which the target is located. This makes a magnetometer the ideal choice when it comes to detection of objects that are not located on the seabed. Magnetometers are passive devices and whether an object can be detected or not depends on three main factors: the magnetic properties of the object, the signal-to-noiseratio, and the distance between magnetometer and target. The magnetic field is fading with the third power of the distance, which makes it important to get as close to the object as possible. This, and the fact that magnetometers cannot classify objects as they cannot distinguish a bomb from a bucket, is a big limitation of magnetometers. Another one is that magnetic fields which will interfere with the measurement are all over the place. Think of vessels, machines, power lines … you name it. The magnetometer even creates a magnetic field when being moved through the Earth’s magnetic field – regardless of type, brand, and make. This makes the application of magnetometers quite challenging, but it is well worth the effort because magnetometers can do things that other sensors cannot.
Are Fluxgate Magnetometers the Better Choice?
There are different types of magnetometers available: cesium vapour and proton magnetometers are the most used in the industry today. Unlike in land applications,
fluxgate sensors are living their existence in a niche in the marine industry. For that reason, and since SENSYS is a manufacturer of fluxgate sensors, this article focuses on the fluxgate sensor. Invented in 1937 by Friedrich Foerster, a fluxgate has a typical resolution of 0.1nT and can measure fields with a flux density of up to 1mT. As a comparison, the Earth’s magnetic field reads about 0.049mT. Fluxgates are certainly not the most sensitive magnetometers on the market and, with 10-20 pT noise, not the ones with the lowest noise. This looks like a disadvantage at first glance, but fluxgates have properties making them the preferred choice for many marine applications like unexploded explosive ordnance surveys, cable and pipeline tracking, and exploration.
Fluxgates can measure all components of the magnetic flux; many optical pumped sensors are scalar magnetometers that can measure the total magnetic intensity only. Fluxgates are extremely fast. SENSYS sensors have a bandwidth of 4 kHz, which means that they can follow changes of the flux up to 4,000 times per second. Together with a high sampling rate, SENSYS digitizers can have sampling rates of up to 10 kHz. Magnetometers can be mounted exposed to alternating fields close to the source of interference. This makes fluxgates extremely suitable for ROV and AUV applications – by applying filters the noise can be separated from the usage signal (Figure 1).
Fluxgate sensors are very small, robust, do not require cooling, and have a very low power consumption. Finally, they are significantly cheaper than optical pumped sensors. Fluxgate sensors are not better, neither they are
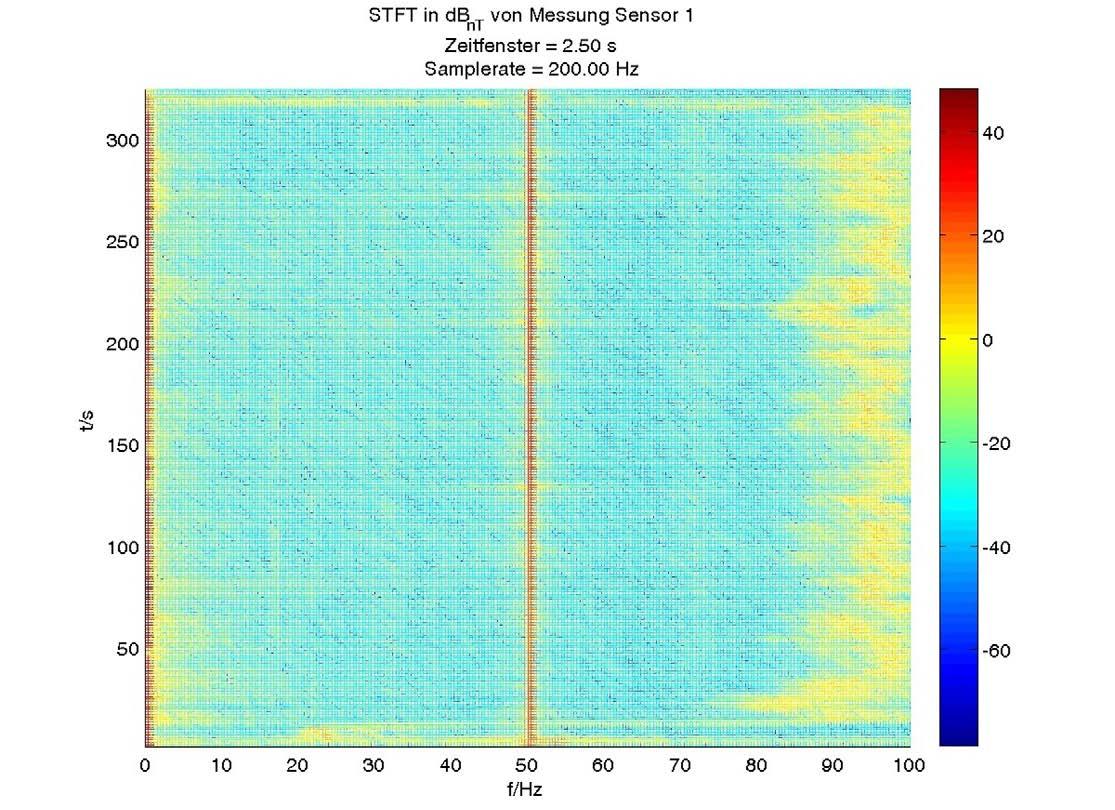
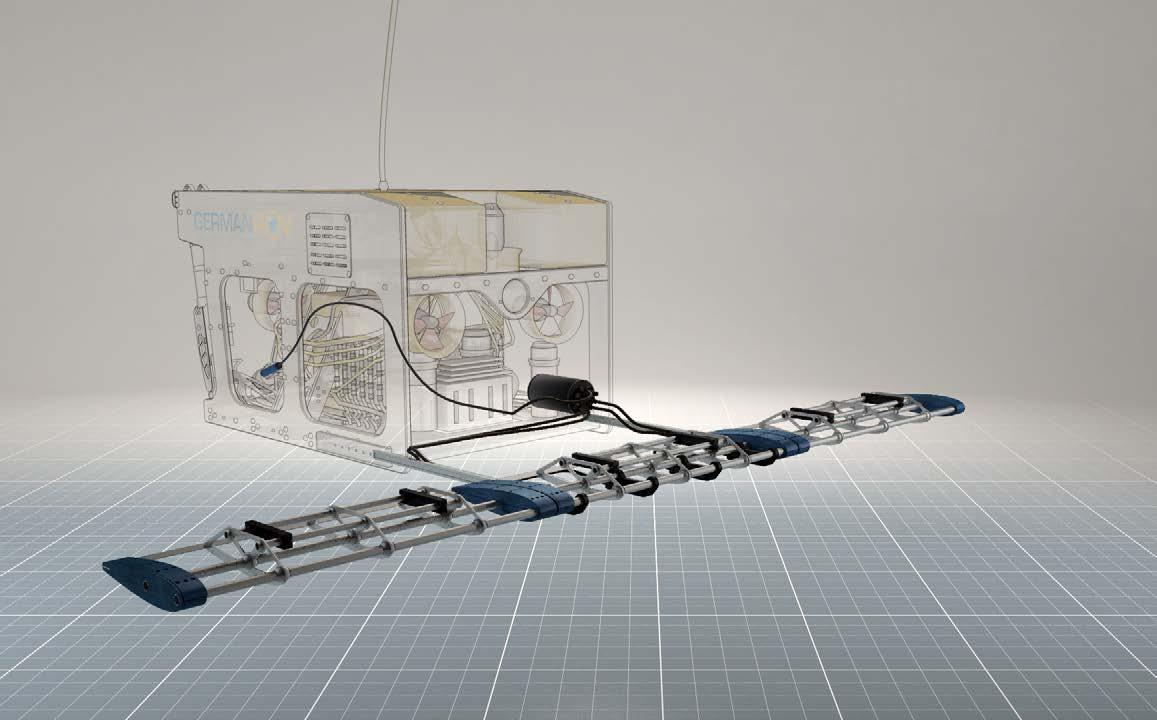
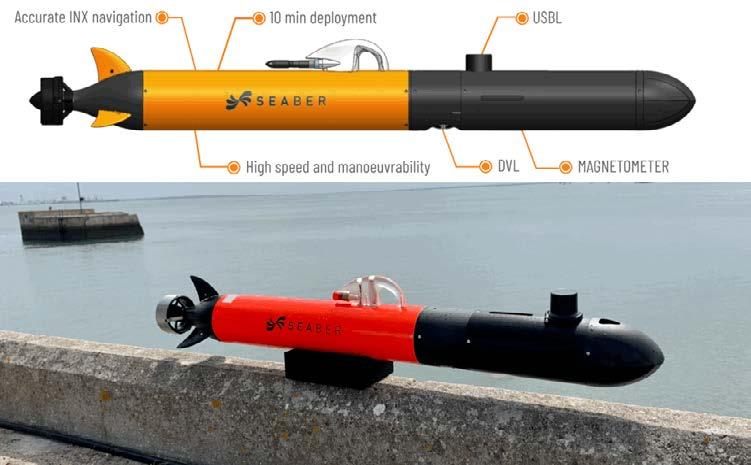
worse than optical pumped sensors. They are just different, and some types are better suited for one application than another. Fluxgates contribute greatly to the market. Comparing data sheets soon becomes pure theory if you start to move a sensor. It is always a package that makes a survey solution.
The SENSYS Survey Solutions
We basically offer two solution packages; both are based on the same tri-axial fluxgate magnetometer. Our first system is the MX3DUW system (Figure 2), which is a modular multi-channel system. We believe in multichannel applications for a couple of reasons. The most important ones are efficiency and data redundancy (quality). Five sensors with an analogue output are connected to one digitizer unit; up to four digitizers can be daisy-chained resulting in a 20-sensor system.
The data interface is Ethernet, and the device can either send a user datagram protocol data stream (ASCII or binary) or utilize a recording software we provide. This makes it easy to integrate the system into existing networks and survey setups.
With the appearance of autonomous solutions, different sensor integration approaches are required. The SENSYS answer to these requirements is the FGM3D UWD sensor. This tri-axial fluxgate sensor has a digital
interface and can output configurable protocols on RS232, RS422, CAN, or Ethernet. It is compensating the data in real time without the need of driving calibration routines. This is what we consider to be self-compensating. Built-in acceleration sensors are adding even more compensation options. This makes this sensor ideal for AUV solutions like the SEABER Marvel (Figure 3), which is extremely easy to use and deploy. The UWD sensor seamlessly fits into this concept since it is easy to use and the data are easy to process.
Gorden Konieczek is with SENSYS Magnetometers and Survey Solutions for 10+ years as an application engineer. His focus is on solutions for underwater applications and archaeology. www.sensysmagnetometer.com
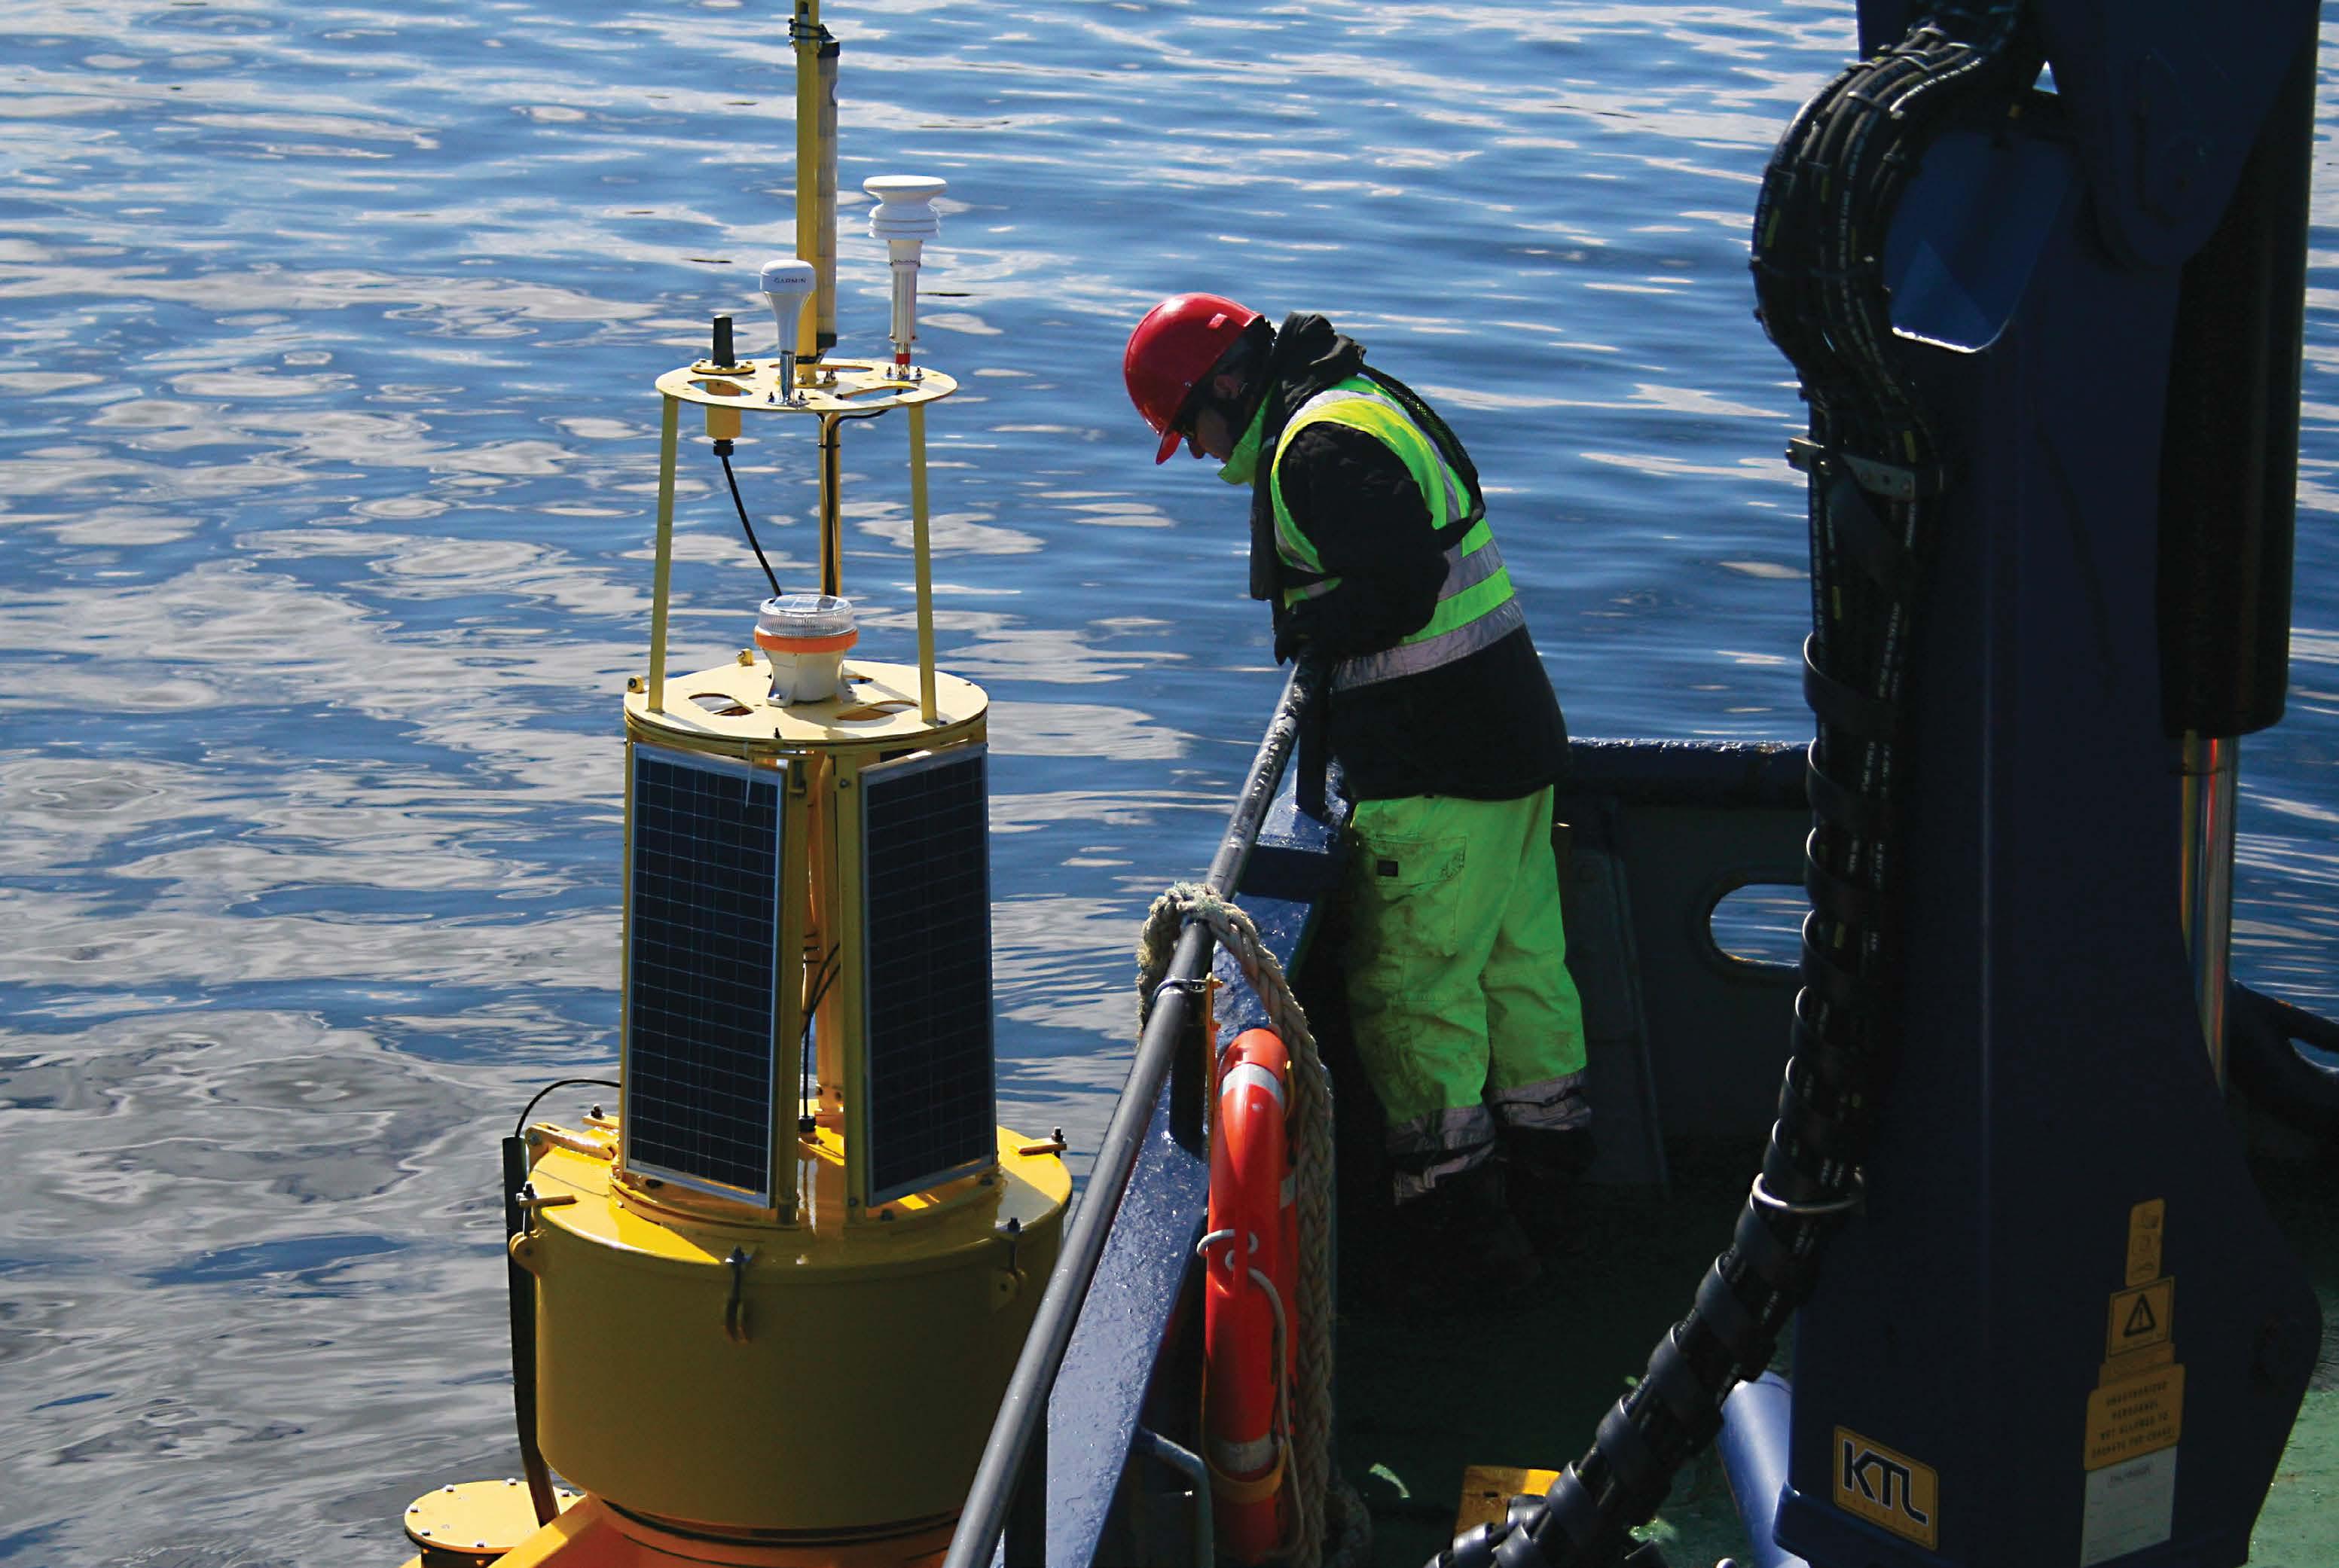
SERVICES AND BENEFITS
• Special events
• Reunions
• Degree frames
• Alumni and campus news
• Group rates on insurance services
• Alumni credit card
• Retail discounts
• University library access
CAREER SERVICES
• Resume/CV critique and evaluation
• Mock interviews
• Job search skills
– personal branding, networking, job search resources
• Resume referral services
• Job postings
• Access to career events
Stay connected and up to date on new alumni services, events, latest news and how you can become involved.
www.mi.mun.ca/alumni/reconnectwithmi alumni@mi.mun.ca
1 800 563 5799, ext. 0367
linkedin.com/edu/ FisheriesandMarineInstituteofMemorialUniversity
facebook.com/ MarineInstituteAlumni twitter.com/ MarineInstitute
youtube.com/marineinstitutepr
instagram.com/marine.institute
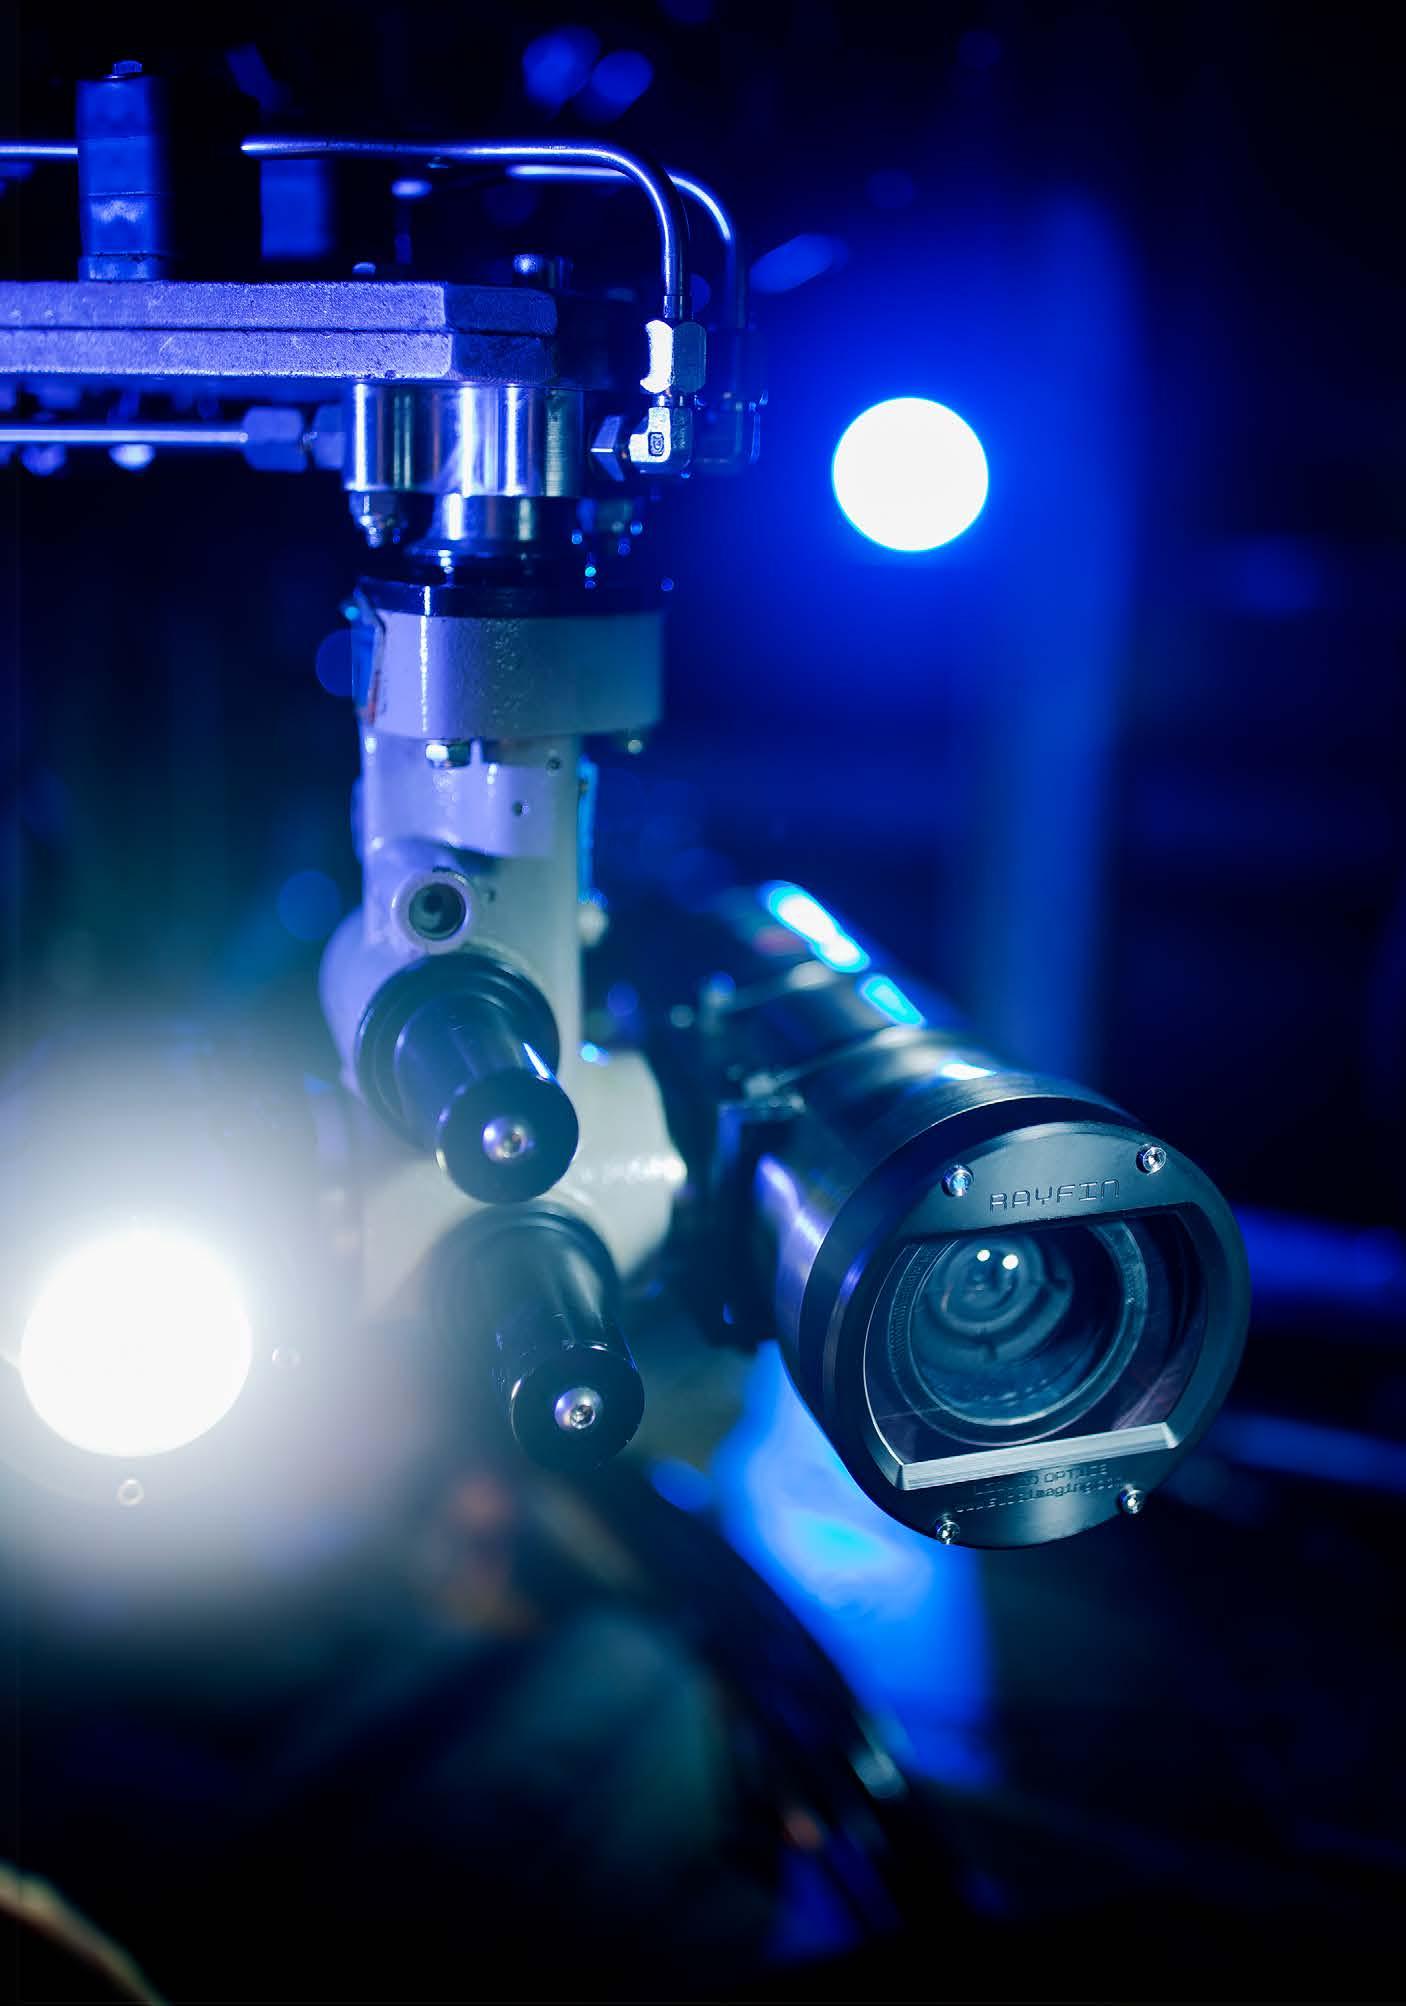
The Rayfin Benthic Camera is a testament to cutting-edge innovation and meticulous design. As the industry’s most feature-rich and flexible camera, it is rated for depths up to 6,000 m and is available with 4K, HD, and IP video formats. The camera integrates advanced software for either autonomous or battery operations with internal storage or is equipped with Rayfin Single Channel Inspection for live inspections and surveys with immediate media access and topside storage. The camera’s data-logging capabilities include built-in depth, tilt, and roll sensors, storing NMEA sensor data and EXIF-embedded images. The Rayfin Benthic exemplifies the best of underwater imaging technology, merging durability with superior functionality.
www.subcimaging.com
by Joshua Gillingham
Remotely operated vehicles (ROVs) have become an industry mainstay, performing critical diagnostic and surveying tasks that once required putting the lives of human divers at risk. Navigated by pilots on the surface using a video feed streamed via tethered cable, ROVs perform a range of essential tasks for modern marine and aquaculture operations through auxiliary manipulators like cutters and grippers, as well as with surveying instrumentation such as ROV-mounted sonar.
While multibeam and side scan sonar systems remain an important feature of remotely operated vehicle loadouts, exciting new instrumentation alternatives are giving pilots an even deeper view into the subaquatic world. Two such innovative instruments include LiDAR, which offers stunning 3D scans of submerged air cavities, and magnetometers, used to detect invisible magnetic field disturbances on the seafloor. Both have been central to recent groundbreaking developments involving deployments on SEAMOR Marine’s Chinook ROV.
LiDAR stands for Light Detection and Ranging and uses pulsed laser signals to map surfaces. Unlike sonar, which is only effective underwater, LiDAR is used to map above-water structures and submerged air cavities. Underwater Acoustics International (UAI) chose SEAMOR Marine’s Chinook ROV for its compact design and its unwavering stability while collecting aggregate data from both sonar and LiDAR scanners mounted onto the same ROV
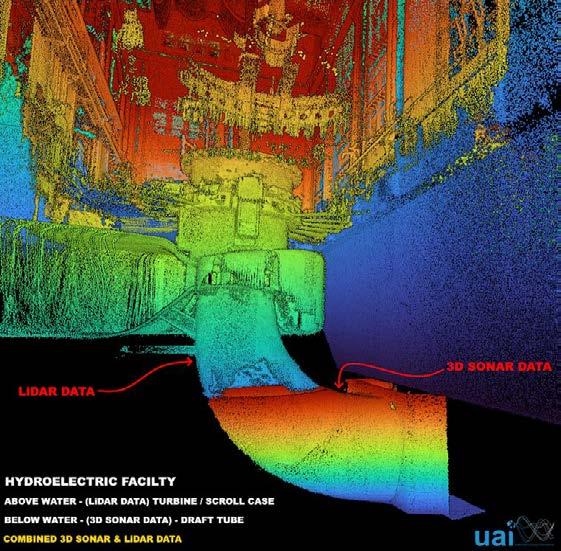
unit. The combined effect was stunning, producing exquisitely detailed 3D maps of hydroelectric facilities from extensive collected data synthesized into a single digital model (Figure 1).
By mounting sonar and LiDAR scanners on SEAMOR’s Chinook ROV, the UAI pilots were able to confidently navigate submerged sections of the hydroelectric facility shown in Figure 1 to collect all the necessary imaging data. High fidelity sonar captured fully submerged components, heedless of murky waters, particulate debris, and other obstructions that might impair a visual surveying camera. The top-mounted LiDAR was activated whenever the Chinook surfaced in an interior cavity, either within the structure or outside along the hydroelectric dam’s exterior walls. All the while, the Chinook’s six famously reliable and powerful thrusters ensured the unit remained stable enough to collect high quality data.
If subaquatic air cavities prove difficult to map, much more could be said of the invisible electromagnetic disturbances caused by unexploded explosive ordnances (UXOs) on the ocean floor. The global maritime industry has
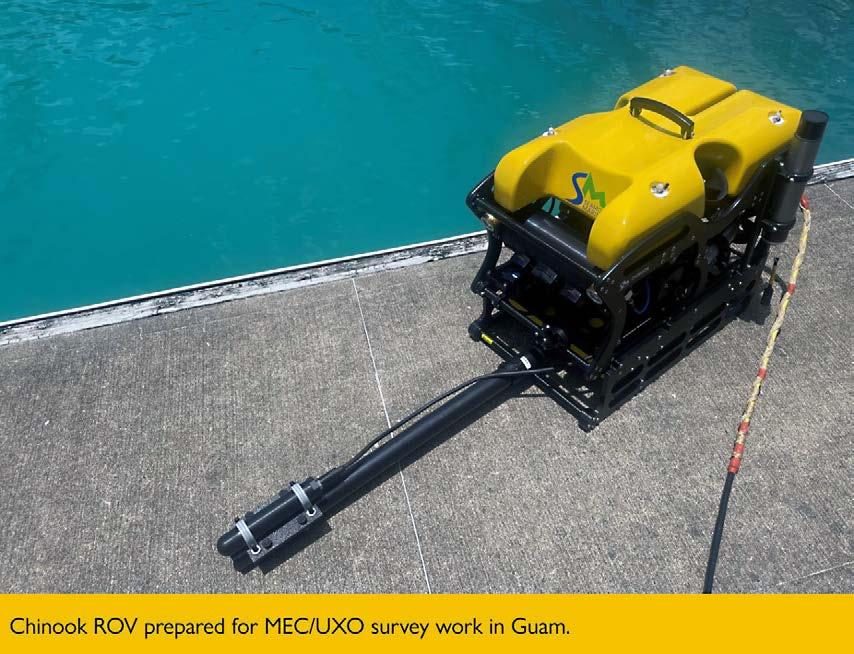
increasingly recognized the risk of encountering or disturbing one of these devices, spurring the drive to develop efficient solutions to locate and disarm these hazardous munitions.
Specialized devices known as magnetometers detect signature magnetic field fluxes produced by UXOs, which may only emit disturbances at strengths of 5-20 nanoteslas. The scale and size of these magnetometers varies, but most are towed by manned marine vessels or by autonomous underwater vehicles (AUV) the size of pickup trucks or larger. However, recent innovative trials from the team at Ocean Floor Geophysics successfully tested an ROVmounted magnetometer on SEAMOR Marine’s Chinook ROV (Figure 2), which can be deployed by hand with as few as two people.
The Ocean Floor Geophysics team initially found it difficult to parse the UXO signals from electrical and mechanical interference in the ROVs they were testing with, some of which emitted an interfering flux of up to 500 nanoteslas just through the builtin tilt mechanism. However, SEAMOR Marine’s Chinook ROV was selected for
the test deployment because of its efficient mechanical and low-interference electrical design. These features provided the essential stability and electronic silence needed to successfully locate UXOs buried in the ocean floor using magnetometer data.
As new loadouts and auxiliary features continue to be developed for use on ROVs, the role of these units in marine and maritime operations around the globe will only become more essential. The full potential of ROVmounted LiDAR and magnetometers is yet to be fully realized; as highlighted here, early implementations have proved promising. Continued innovation and collaboration between industry partners across the globe will be critical in carrying this technological momentum forward. SEAMOR Marine is proud to have played a role in these early trials and we look forward to continuing to support these efforts by designing ROVs such as the Chinook with a hard-earned reputation as one of the most durable and reliable units on the market.
Joshua Gillingham is the communications liaison for SEAMOR Marine located in British Columbia, Canada. www.seamor.com
by Emma Carline
Underwater equipment typically generates sound, whether from the engine of a ship or the pumps and thrusters of a remotely operated vehicle (ROV). These sounds create pressure waves that travel through the water and can be captured by hydrophones – sensitive underwater listening devices that convert sound into digital signals.
Underwater sound source localization can be achieved using multichannel data from an array of hydrophones. This technique is crucial for tracking vessels and marine mammals but also proves valuable for inspecting underwater equipment.
Sound mapping, a technique using a hydrophone array, visualizes sound sources in the field of view. It overlays a map of sound levels onto a camera image, resembling a heatmap from an infrared camera (Figure 1). This map is created through beamforming, where the synchronized hydrophone array channels are delayed and summed to amplify sounds from specific points while attenuating others. A 2D array provides directionality in both x and y axes.
While sound mapping in air is common with arrays of over 100 microphones, underwater sound mapping is more challenging due to the higher speed of sound, longer wavelengths, and the need for costly waterproof equipment. Enter the icListen Smart Underwater Sound Imager (SUSI), a compact array for high-resolution sound mapping (Figure 2). With only 16 icListen hydrophones in a 0.5-metre footprint, SUSI is designed to be mounted on an ROV or other platform for dynamic subsea inspections.
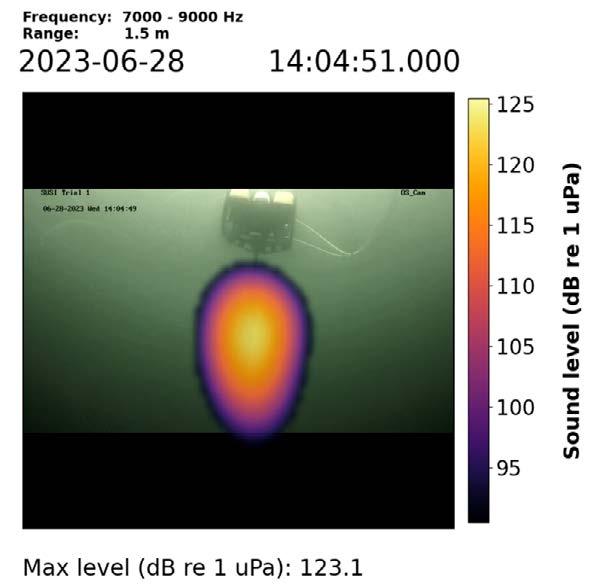
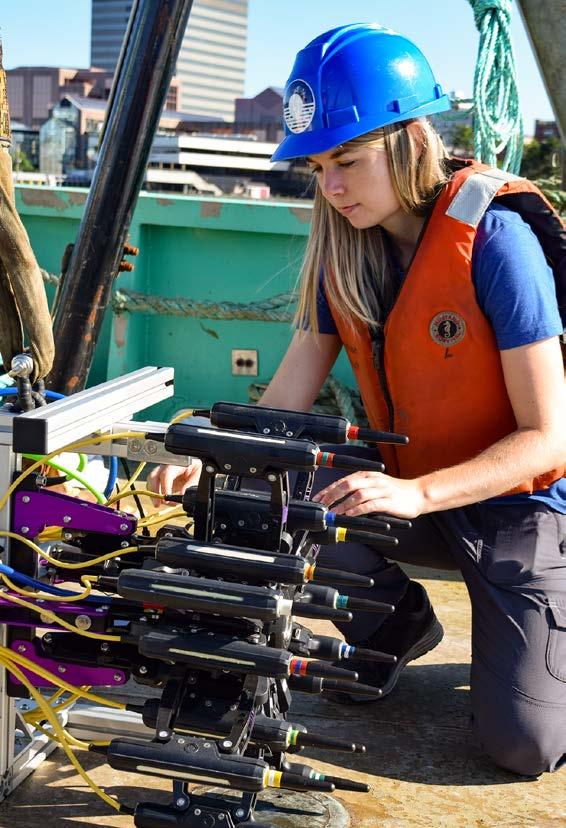
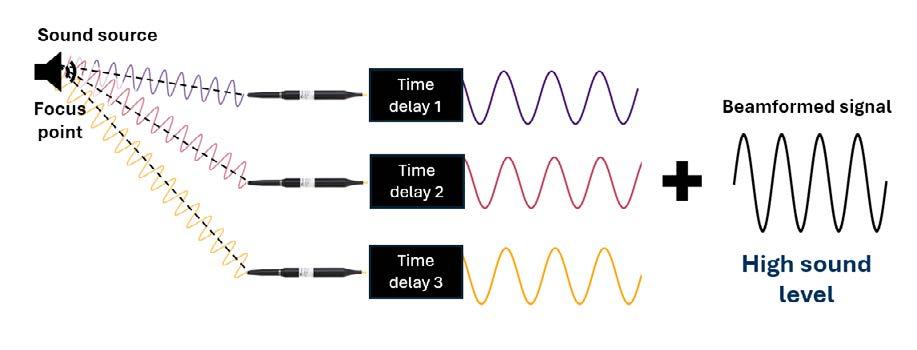
SUSI’s hydrophone geometry is optimized for frequencies between 2-10 kHz, encompassing many mechanical sounds. Beamforming calculations in the frequency domain enable real-time sound mapping, providing immediate feedback during equipment inspections. This processing also allows for frequency-band selective sound maps, reducing background noise by focusing on specific machinery sounds (Figure 3).
Besides sound mapping, SUSI can capture high-quality acoustic signatures from specific areas on equipment. While the array’s sound mapping frequency range is determined by hydrophone spacing and diameter, individual hydrophones record broader bands, including ultrasonic leak sounds up to 200 kHz. These capabilities provide a comprehensive picture of the acoustic emissions from subsea equipment.
One challenge for ROV-mounted arrays is the noise produced by the ROV itself, which can mask components and change sound paths. Identifying the ROV’s noise profile helps distinguish its sounds from equipment sounds and avoid frequency bands being disrupted by ROV noise.
The SUSI system has undergone extensive testing, including in Halifax Harbour, a deepwater oil field in the Gulf of Mexico, and fields off the coast of Australia. Despite
the complicated, noisy environment, SUSI successfully detected and mapped various equipment sounds.
Sound mapping is changing the way we monitor underwater conditions. SUSI, a portable hydrophone array, offers highresolution sound mapping, providing a new perspective on underwater equipment and vessel noise and opening possibilities for both addressing and mitigating sounds.
Emma Carline is an acoustic algorithm developer at Ocean Sonics Ltd. in Truro Heights, Nova Scotia. Her passion is creating new tools to extract knowledge from ocean acoustic data. She works with hydrophone arrays for sound detection and localization and enjoys the full development process from mathematical modelling to testing offshore. She holds a M.Sc. in mathematics from Dalhousie University. https://oceansonics.com/
Each morning, Edwina Nash of Branch, St. Mary’s Bay, on the island of Newfoundland, heads to her front door with her camera in hand to capture the ocean’s “mood.” On this day, the ocean was riled up, offering her the opportunity to snap this stunning photo. You can imagine the roar of the ocean and the feel of saltwater on your skin.
The MATE ROV Competition uses remotely operated vehicles to inspire and challenge students to learn and creatively apply science, technology, engineering, and math to solve realworld problems and strengthen their critical thinking, collaboration, entrepreneurship, and innovation.
The competition challenges students from around the world to engineer ROVs to complete a set of mission tasks based on real-world, workplace scenarios. The competition emphasizes and inspires a mindset of entrepreneurship and innovation by requiring students to transform their teams into “start-up” companies that respond to a request for proposals. In addition to their robots, the student teams also prepare technical reports, create a marketing (poster) display, and deliver engineering presentations.
For the 2024 competition, student teams deployed advanced ocean observing assets for data collection, installed state-of-the-art submarine telecommunications cables, administered probiotics to heal diseased coral, identified healthy habitats for lake sturgeon, and deployed autonomous robotic floats to monitor ocean health.
The JOT is pleased to once again this year publish the teams achieving top honours in the Marketing Display category:
EXPLORER – EXPOSEA, Hong Kong University of Science and Technology, Hong Kong
PIONEER – Water Jets, San Diego Miramar Community College, San Diego, CA, USA
RANGER – Geneseas, St. Francis High School, Sacramento, CA, USA
The JOT is also publishing the top Technical Documentation Report in the Explorer category:
EXPLORER – Purdue ROV, Purdue University, West Lafayette, IN, USA
Congratulations to the winning teams!
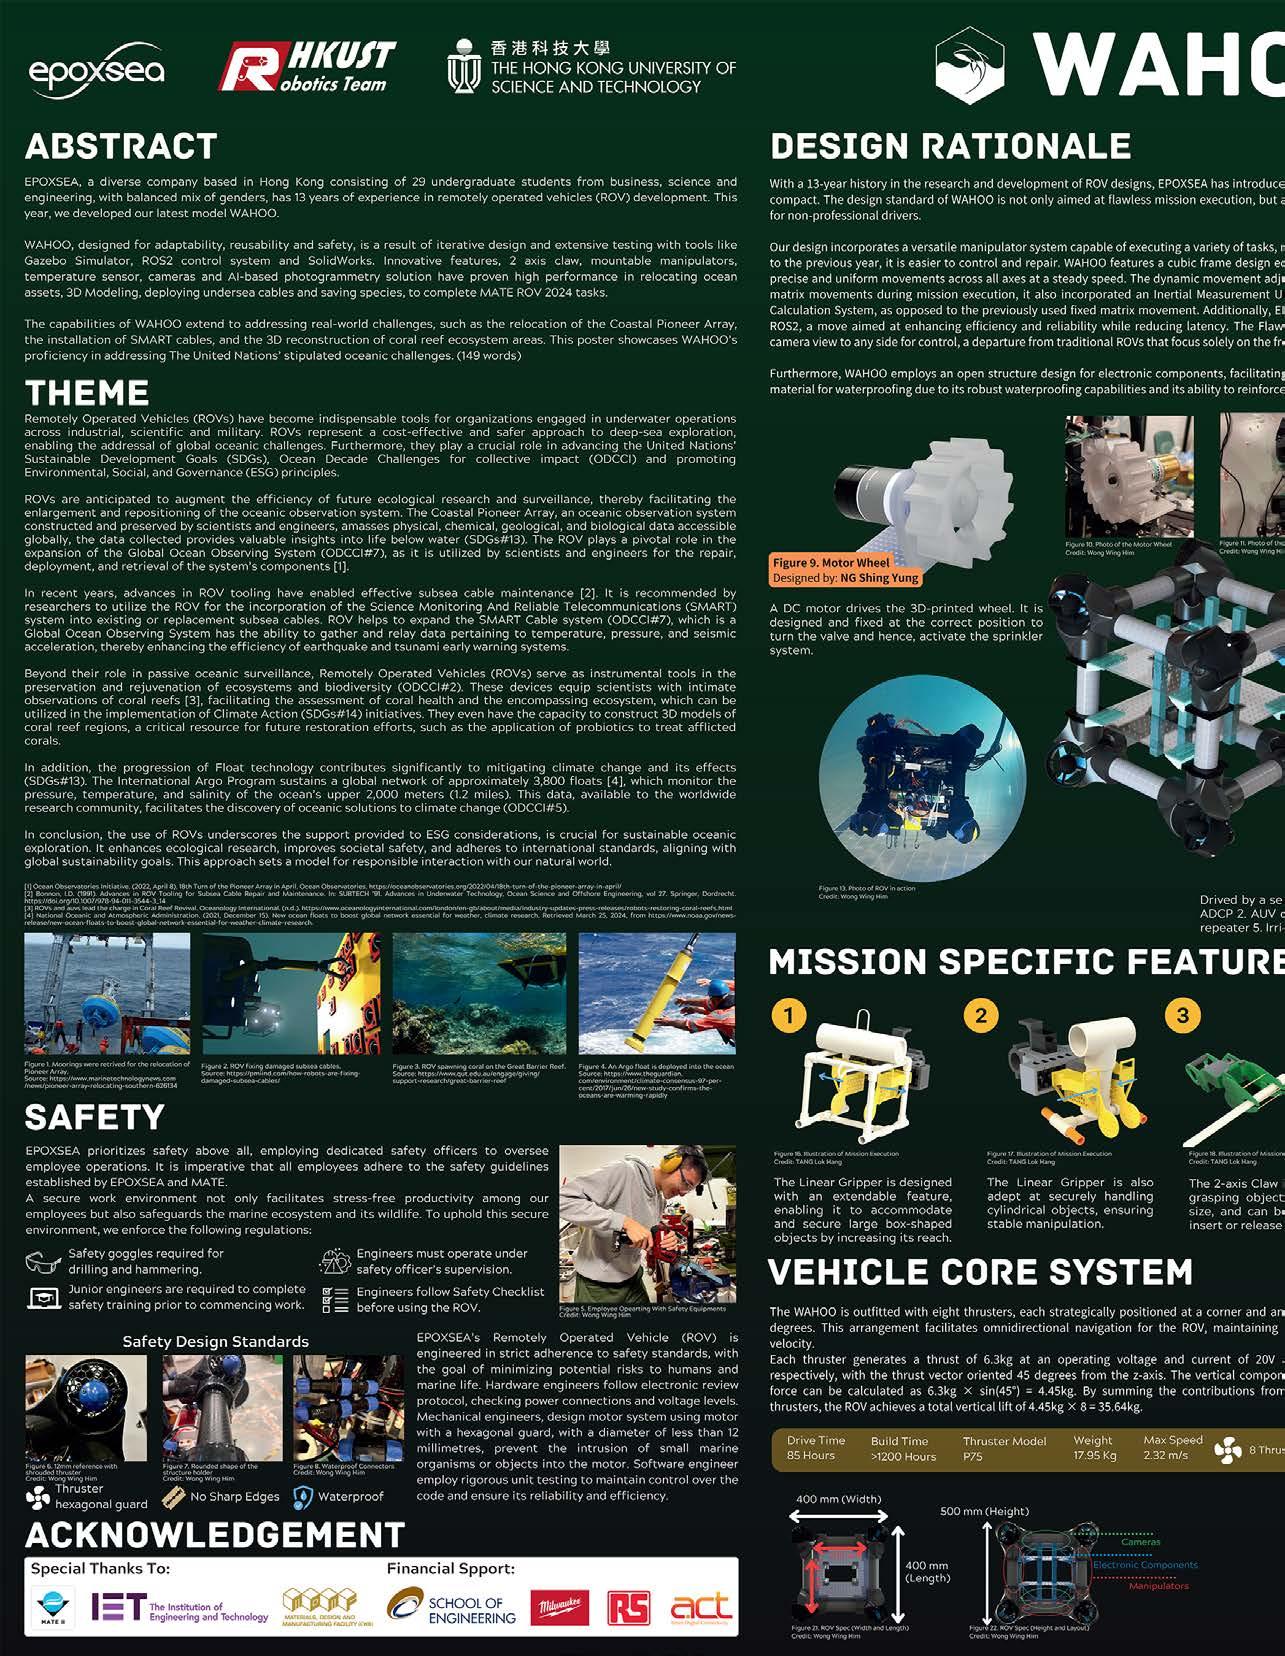
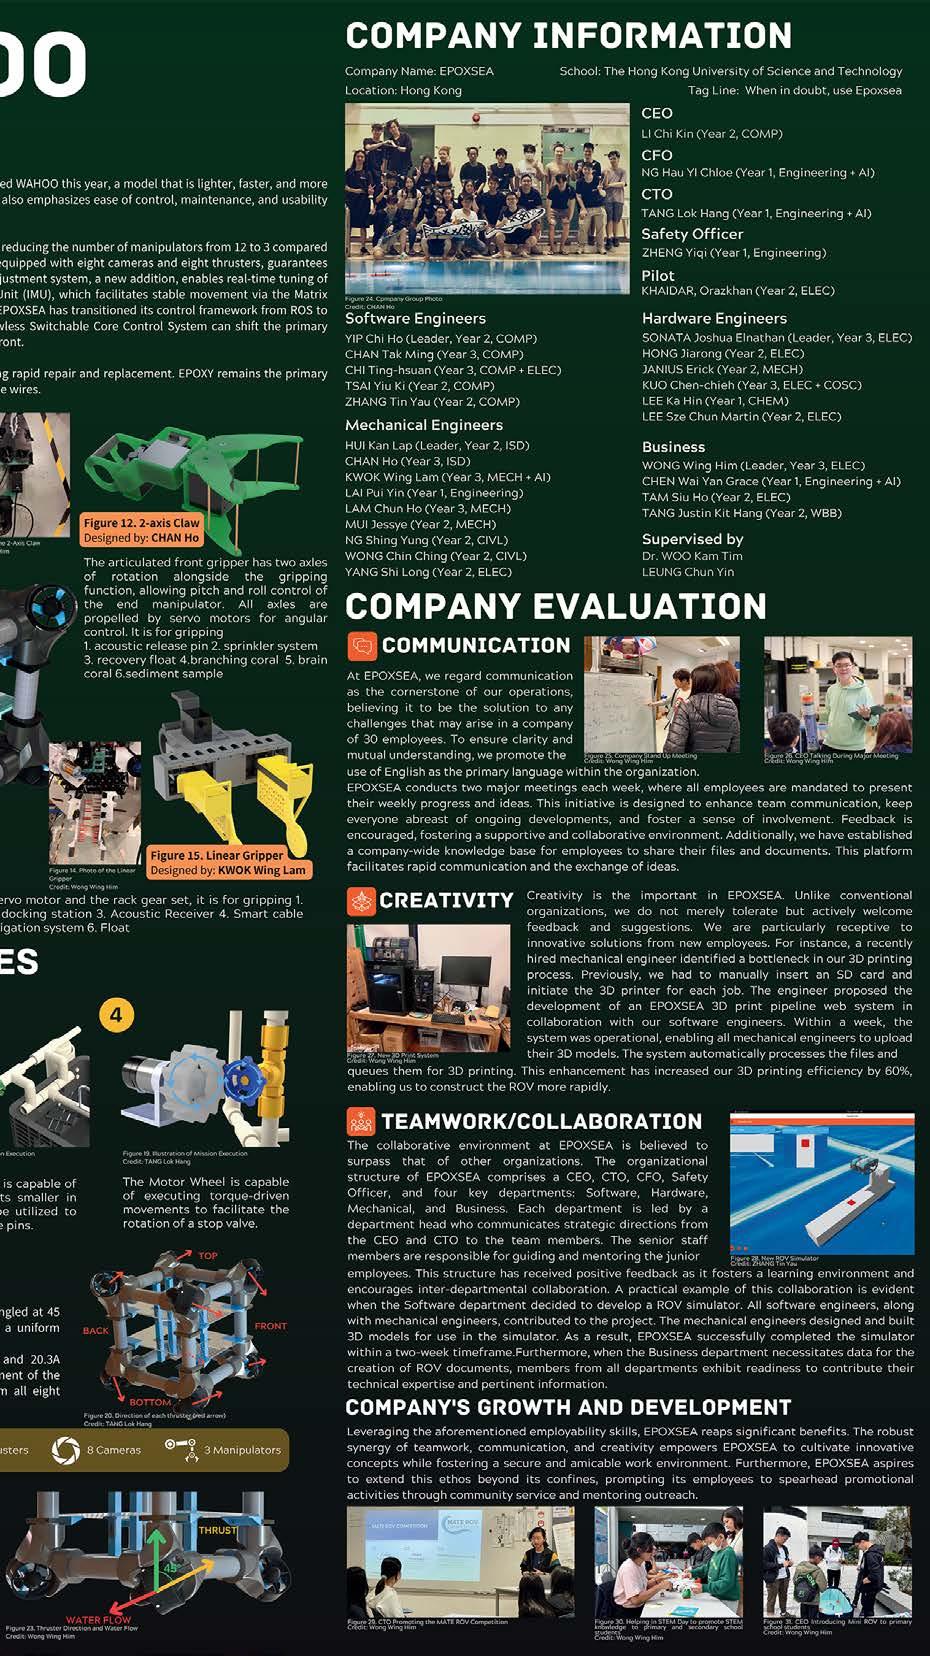
TEAM NAME EXPOSEA
Hong Kong University of Science and Technology
Hong Kong
TEAM MEMBERS
CHAN Ho
CHAN Tak-Ming
CHEN Wai-Yan Grace
HONG Jiarong
JANIUS Erick
KHAIDAR Orazkhan
LAI Pui-Yin
LEE Ka-Hin
LEE Sze-Chun
LI Chi-Kin
MUI Jessye
NG Hau-Yi Chloe
MENTORS
Dr. WOO Kam Tim
LEUNG Chun Yin
NG Shing-Yung
SONATA Joshua Elnathan
TAM Siu-Ho
TANG Lok-Hang
TSAI Yiu-Ki
WONG Chin-Ching
WONG Wing-Him
YANG Shi-Long
YIP Chi-Ho
ZHANG Tin-Yau
ZHENG Yiqi
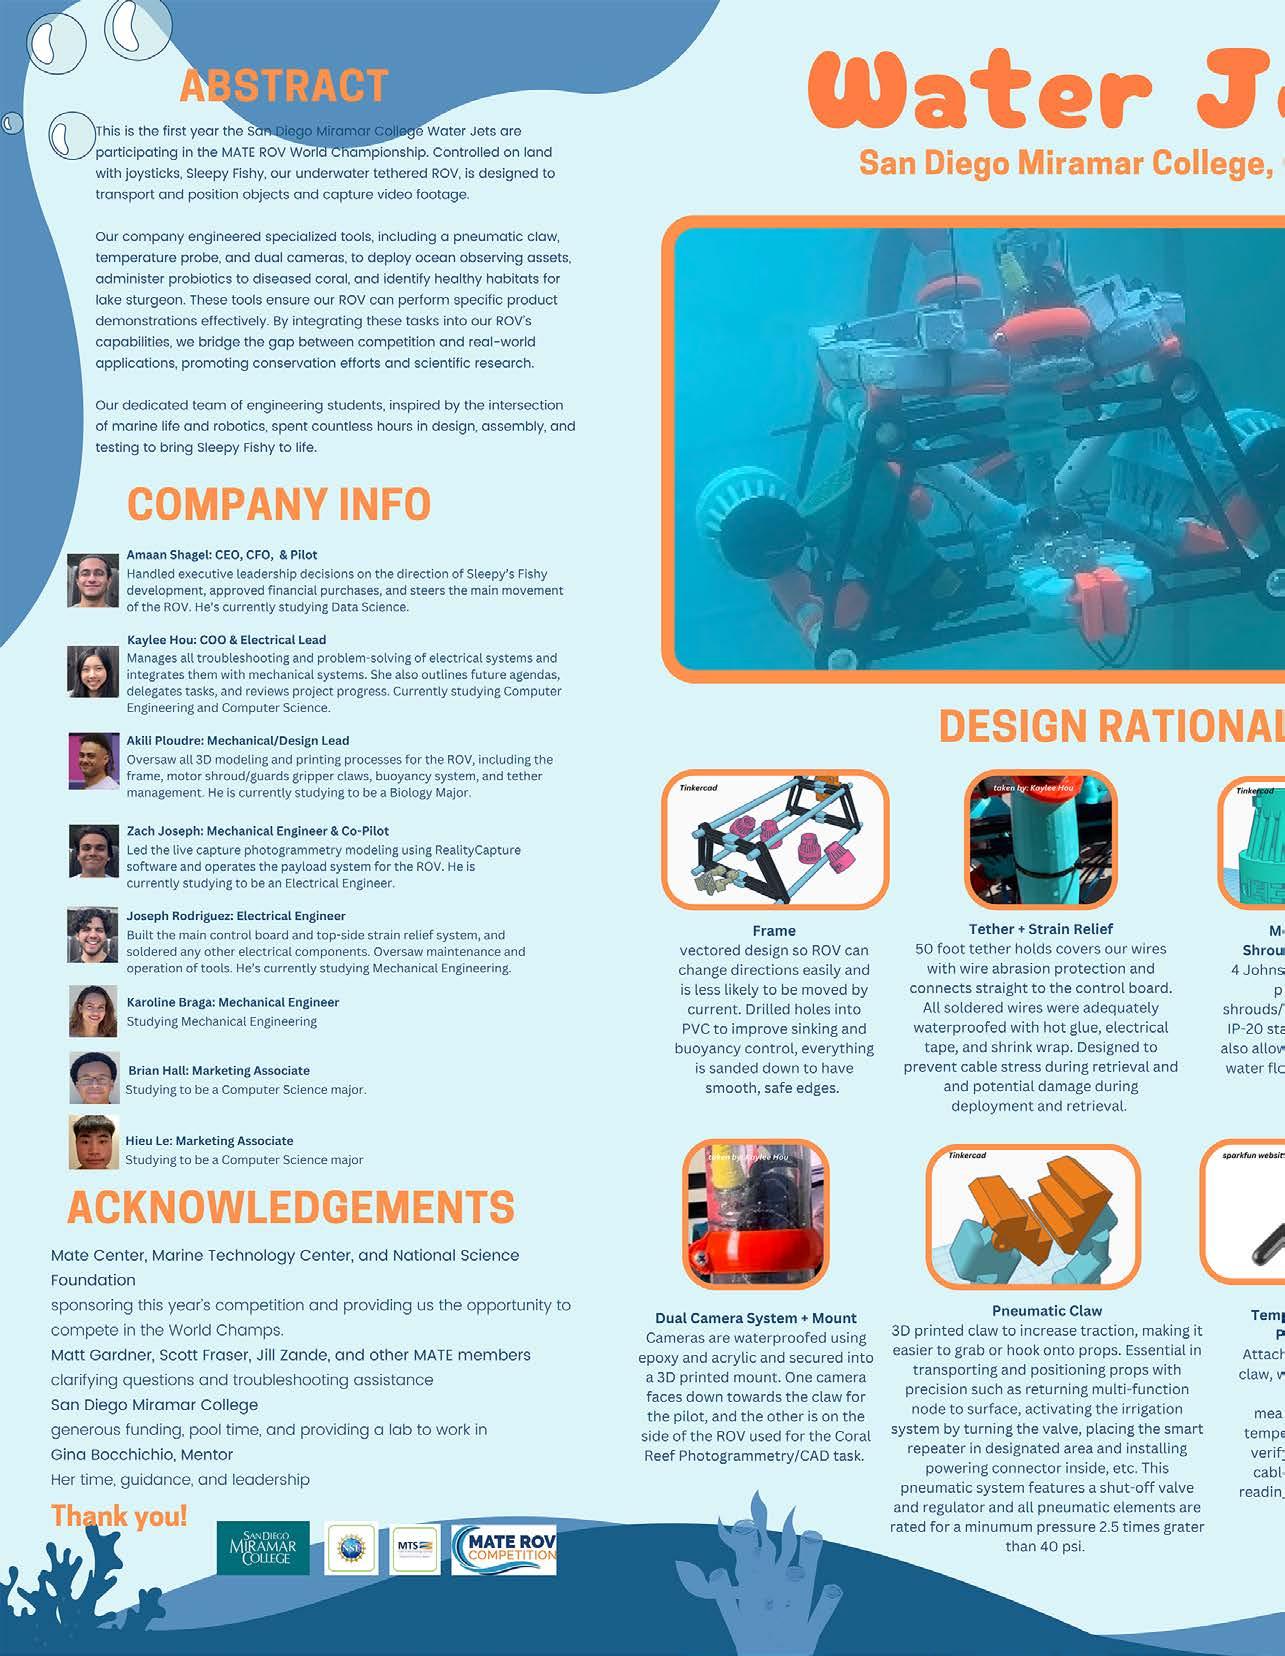
TEAM NAME Water Jets
San Diego Miramar Community College
San Diego, CA United States of America
TEAM MEMBERS
Karol Braga
Brian Hall
Kaylee Hou
Zach Joseph Hieu Le
Akili Ploudre
Joseph Rodriguez
Amaan Shaghel
MENTOR
Gina Bochicchio
TEAM NAME
Geneseas
St. Francis High School
Sacramento, CA
United States of America
TEAM MEMBERS
Mae Alvarez
Morgane Bertran
Minna Brindle
Grace Chavez
Darlene Eugenio
Angelyn Gonzales
Lauren Grindstaff
Isa Gutierrez
Catherine Hanly
Katherine Hwang
Eliza Jane Yee
Katie Koo
Azul Kuppermann
MENTORS
Marcus Grindstaff
Maurice Velandia
Dean Eugenio
Kitara Crain
Siena Marois
Audrey Mayo
Katherine Murillo
Sonalika Prasad
Isabella Ramos
Alyssa Renomeron
Gabrielle Rosario
Laila Shamshad
Yogja Singla
Maddi Sundermier
Kinnera Tirumala
Hanna Wysoczynska
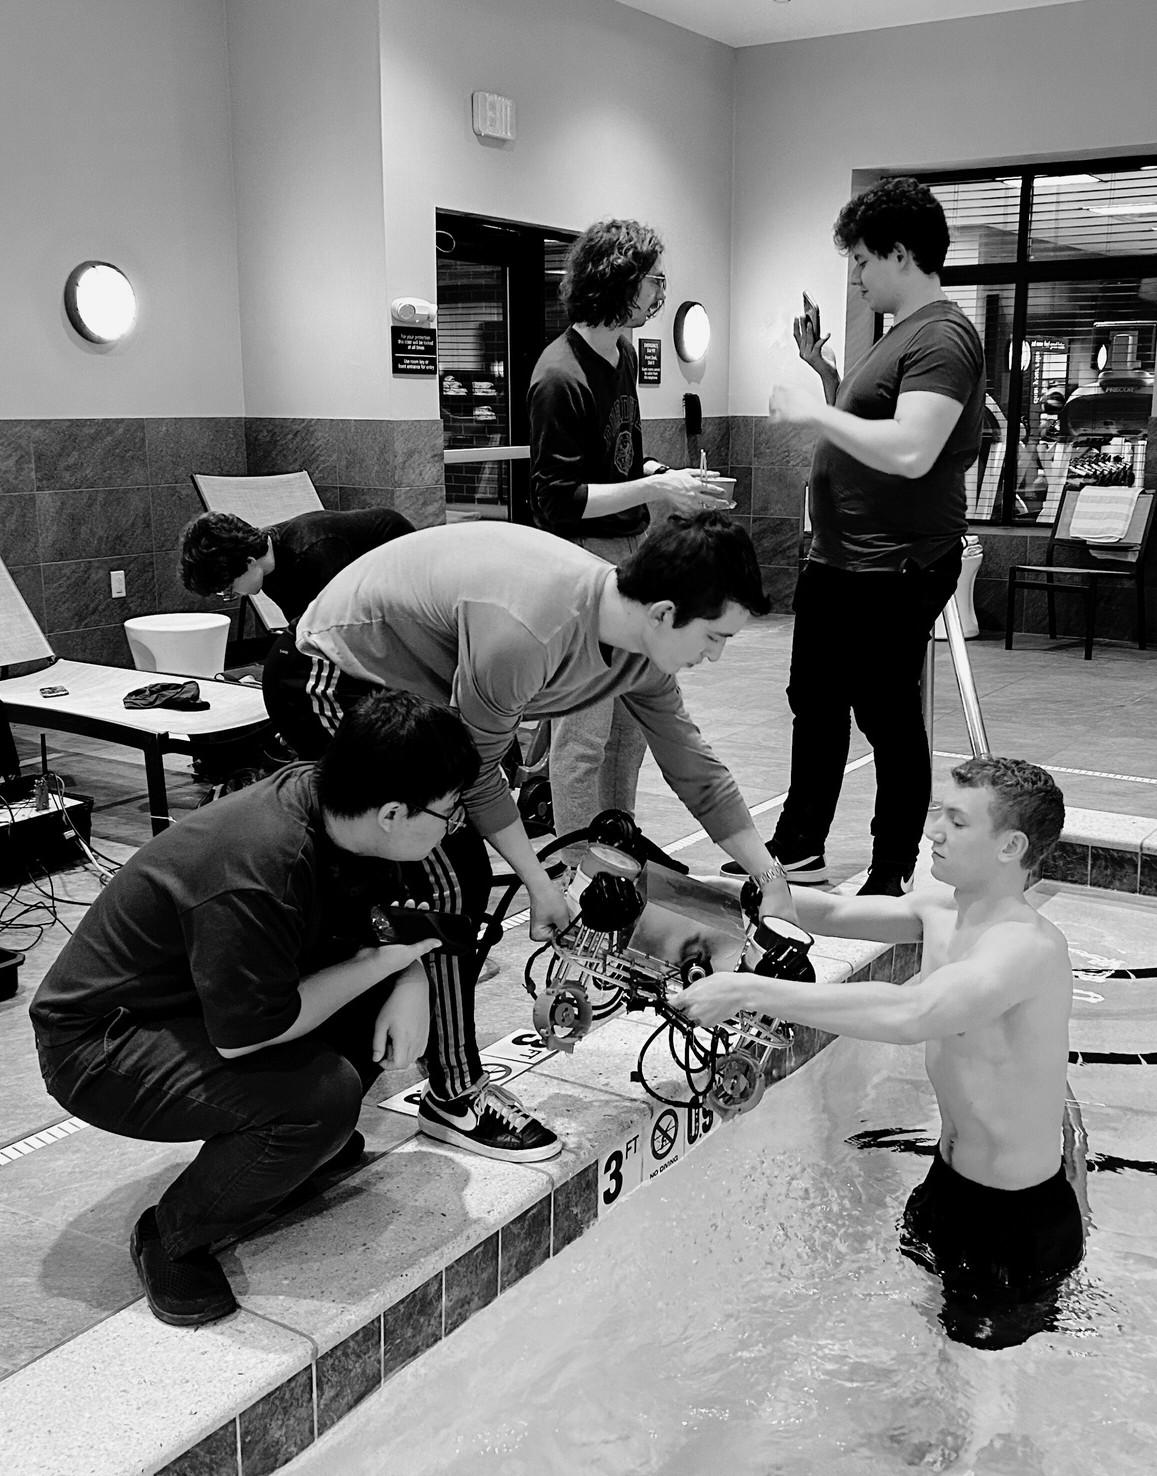
ZACHARY NEEL ChiefExecutiveOfficer
MECHANICAL
ALEX BEERS MechanicalCo-Lead
JORGE VARELA MechanicalCo-Lead
RAYGAN BINGHAM·············MarketingCo-Lead
HARRISON BOOKER··························ToolsLead
EVA MARIA DERAMON·······MarketingCo-Lead
COLTON THIEL ManufacturingLead
JASON ZHENG MechatronicsLead
AADYA ABHYANKAR*
NIKLAS ANDERSON
THOMAS CHUANG*
JOSH DOMINGUES
THOMAS HORNER
TAI HSU*
GABE TAMBOR*
MIA YAUN*

ELECTRICAL
RAGHAV KUMAR Electrical Co-Lead
MINH NGUYEN Electrical Co-Lead
DANIEL CHOI Boards Lead
VIJAY TUMMALPENTA R&D Lead
DEREK CHI KEONA FIELITZ*····················································
LEO JANERT*
ETHAN KESSEL
MANYA KODI*
JULIA LAINE*
ELENA LEHNER*
SAHIL MITRA*
AYMAN MOTODA
VINAY PUNDITH*
DANA SHI*
RHEA VIRK*
SOFTWARE
NEIL BROWN SoftwareLead
ANNA ARNAUDOVA CVLead
BEN BOARDLEY FrontendLead
CADEN BRENNAN
ETHAN BURMANE XAVIER
NIKHIL CHAUDHARY*··········································
DANIEL
ADAM KAHL*
MARVIN LIM*
ANSEN TSAN*
VINCENT ZHAO*
ADMIN
BENJAMIN TAPP SponsorshipLead
In response to MATE’s request for proposals (RFP), Purdue ROV is proud to present X16 Nemo, a remotely operated underwater vehicle designed specifically to address ocean restoration and the ten challenges identified by the UN's Ocean Decade. Named to reflect the ingenuity and heroism of Captain Nemo from Twenty Thousand Leagues Under the Sea, X16 Nemo was developed through the collaboration of over 45 employees across the mechanical, electrical, software, and administrative departments at Purdue.
Using fifteen years of experience, Purdue ROV has developed Nemo based on the belief that the best ROVs are reliable, adaptable to any mission, and easy to pilot. Nemo builds upon the company’s past success while continuing to push the envelope with new innovations and improvements tailoring X16 to the mission. Nemo is manufactured out of T6061 aluminum for a rugged and durable chassis and boasts custom electronics, designed in house and rigorously tested to ensure reliability. Nemo also features unparalleled ease-of-piloting through a new control station, expanded field of view, numerous control improvements, and a new, user-friendly pilot control interface. During Nemo’s development, Purdue ROV emphasized multiple design iterations, rigorous testing, and strict safety practices.
Designed specially for completing mission tasks, Nemo is the ideal ROV for deploying floats, laying SMART-cable, restoring coral, and monitoring ocean health. In total, Nemo highlights precise custom tools, excellent computer vision, and an articulating primary manipulator, making it wellequipped to aid in ocean preservation.
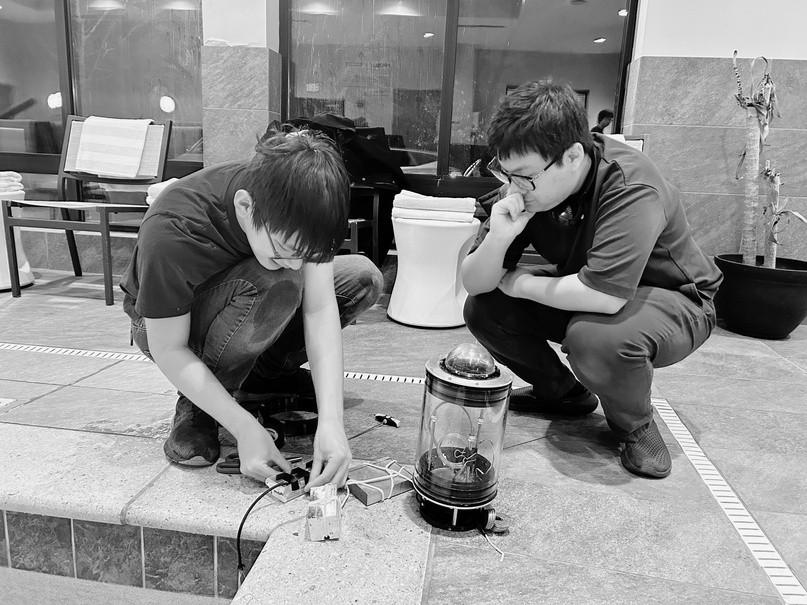
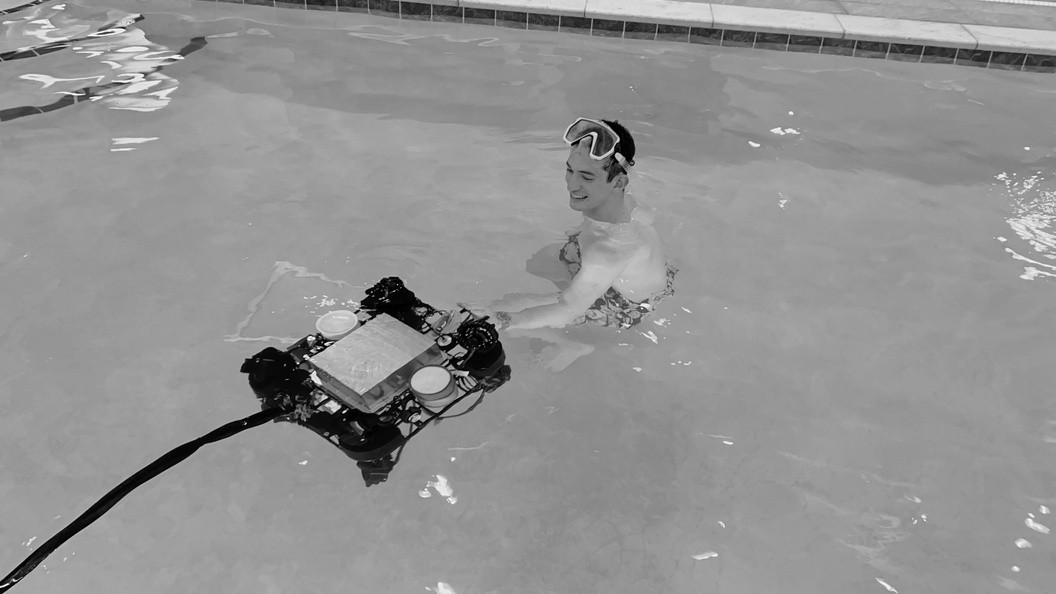
TEAMWORK
Company
DESIGN RATIONALE
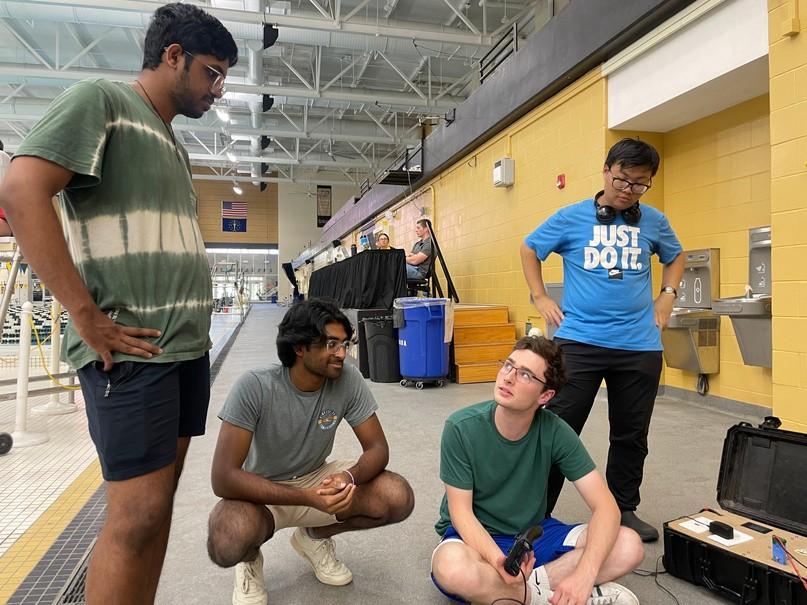
SYSTEM
COMPUTER VISION
SPECIALIZATIONS
CRITICAL
Testing

SAFETY
Purdue ROV is a collaborative team of forty-seven members spread across three different colleges and eleven majors. In order to maintain cohesion across such a large and diverse team, Purdue ROV is organized into three different technical departments - mechanical, electrical, and software - as well as an administrative department that oversees finances, outreach, and growth.
Each technical department is organized hierarchically with department leads and project-specific sub-leads for major subsystems such as the tools or front-end. The leads are responsible for creating the vision and design requirements for the ROV as well as acting as project managers for their departments. Each lead reports to the CEO, who enforces competition and university regulations, sets a high-level schedule for the team, and coordinates a team-wide design.
The company recruits new employees every fall, and the department leads oversee their training and mentorship. Employees are given ownership of an individual project, ensuring every employee ends the season as an expert in their subsystem. The leads specify design
requirements and ensure the system can be integrated into the project as a whole. Purdue ROV also heavily emphasizes crossdepartment collaboration, with several project teams that function across departments, such as our embedded project team, which is composed of both electrical and software employees.
Purdue ROV follows a weekly development cycle, starting with a leadership planning meeting every Monday. In this meeting, leadership will set weekly goals and assess whether each team can adhere to the project schedule. Next, the whole team convenes on Wednesday, where the CEO announces upcoming project milestones. Each department holds its short stand-ups to discuss current progress, weekly goals, and obstacles preventing them from progressing. Employees spend the rest of the meeting working on their respective projects. The week concludes with a Saturday general meeting consisting of the same principles, intended for employees to use to complete their weekly goals.
In terms of project management tools, the team uses Slack for general communication, Google Drive for general file-sharing, Trello for project management, GitHub for software version control, and more as seen in Figure 2. Additionally, the team adopted Aras Innovator for CAD filesharing and version control this year. Aras Innovator represents the cutting edge of project lifecycle management (PLM) software, providing employees with valuable experience with enterprise-level project management software and improving the mechanical department’s scalability and ease of integration.
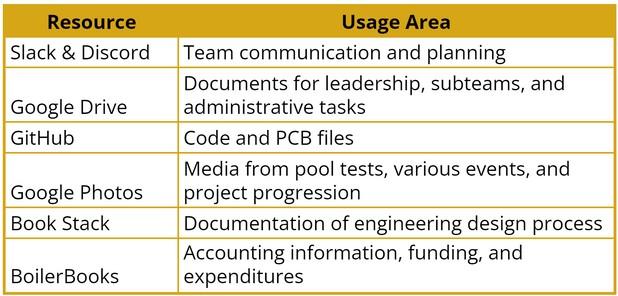
Purdue ROV’s design cycle is split into four stages: training, design, manufacturing, and testing, all seen in events in Figure 3. Before the school year begins, the leadership creates SIDs, project timelines, and sets design requirements for the base vehicle. At the start of the semester, the team enters the training phase, where new employees are recruited and trained in applicable
departmental skills such as NX CAD, Eagle PCB design, Embedded C, Python, ROS, Git, and more.
Next, the team enters the design phase, modeling the ROV in CAD, designing custom electronics, and programming the front-end control software. This phase consists of many internal design reviews and culminates with an alumni design review. During this event, employees present their designs to industry members and gain valuable feedback before manufacturing.
In the manufacturing phase, components for the ROV are fabricated and assembled. Purdue ROV prides itself on manufacturing in-house as much as possible to teach employees industry-applicable skills. Manufacturing culminates in the maiden voyage, marking the moment when the assembled ROV undergoes its inaugural pool test. Finally, during the testing phase, various subsystems of the ROV will be finetuned as the team makes the final preparations for the product launch date.
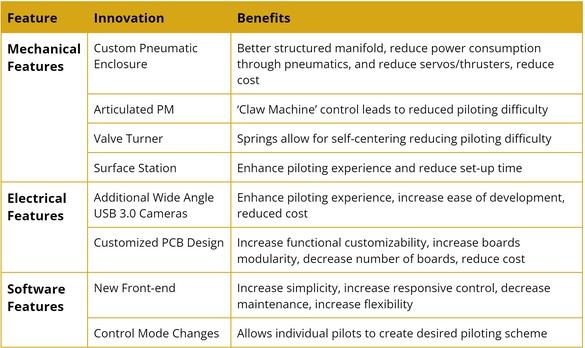
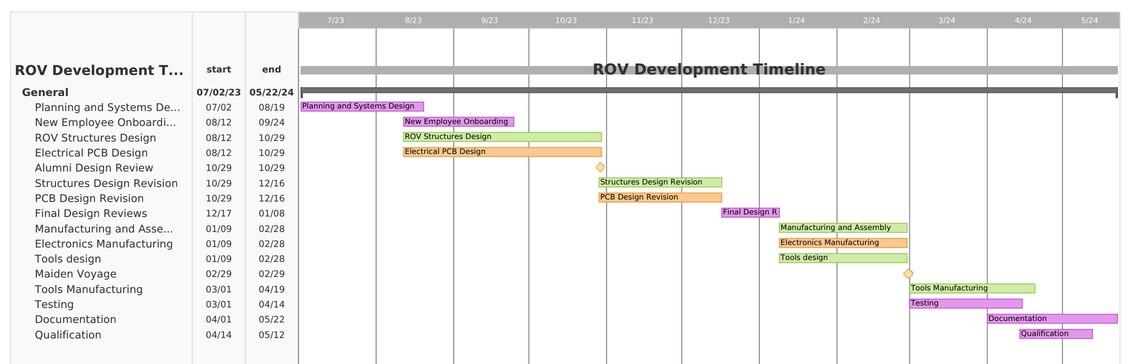
Throughout the team's 16 years of experience, we have learned that the best ROVs are adaptable to any mission task, easy to pilot, and reliable. X16 Nemo is designed with three main principles: adaptability, simplicity, and reliability. With adaptability in mind, X16 Nemo is designed with a single plate frame for easy access to the electronics. The grid spacing on the frame plate is standardized to simplify tool mounting design and allow for modular tool placement on the ROV. Additionally, X16 Nemo is designed with adjustable buoyancy through mountable foam blocks to easily tune the center of buoyancy (CoB). To improve drivability, the CoB is positioned slightly above the center of mass. This results in a stable and maneuverable ROV that does not overcorrect for rotations. We also opted to maintain the same thruster configuration from X14 and X15, as it is both proven to be reliable and our pilots have found that the symmetric thrust profiles make it easier to pilot. In terms of hardware, X16 Nemo’s electronics were designed with reliability and modularity in mind, ensuring the ROV could handle any mission tasks and would not fail during a mission.
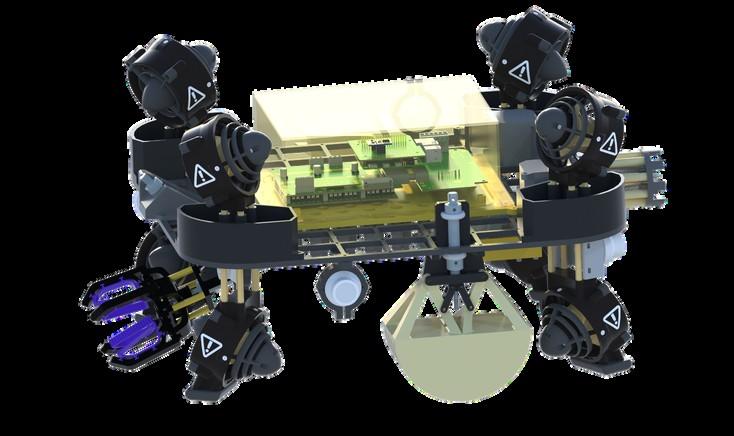
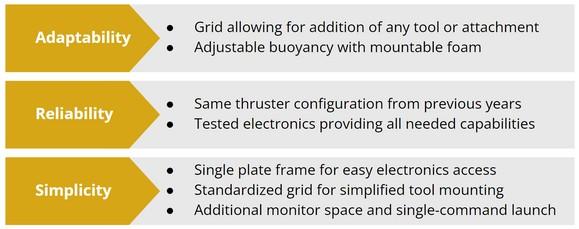
constraints, and better grip strength for manipulators. Therefore, Purdue ROV determined that the benefits of pneumatic power were worth the additional complexity and design effort.
X16-Nemo continues utilizing pneumatic power for mission tools. Fluid power shifts the power load from the electrical stack toward the mechanical team. This allows for maximal power provided towards the thrusters - which is required due to our use of eight T200 thrusters. It also comes with a myriad of other benefits such as reduced electrical complexity, more lenient power
Finally, X16’s software stack was designed for easy piloting. X16 sports a new control station with additional monitor screen space along with a new front-end that productizes the ROV, allowing the pilot to launch the ROV with a single command. Nemo’s software stack is made modular through the use of ROS2, allowing for rapid software prototyping. Nemo also offers a variety of new control features such as 4 control granularities and front-back reversible controls.
The frame was designed to serve as a universal mounting system for all of the ROV’s subsystems. The frame’s main priorities are to enable easy mounting for diverse subsystems and provide vehicle rigidity while remaining as lightweight as possible.
To cut weight and complexity from previous designs, a single-frame design was chosen. While two plates would seem to provide more mounting and rigidity, in reality, it obstructed access and reduced the total useful volume for mission tool mounting. To simplify mounting, we chose a universal 2” square grid. The overall frame footprint was designed to fit in a suitcase, making air transport possible. The frame was graciously water-jetted from a single sheet of 0.25” Al-6061 by Waterjet Cutting of Indiana, Inc. The geometry of the frame itself is based on finite element analysis (FEA) results and experience r.
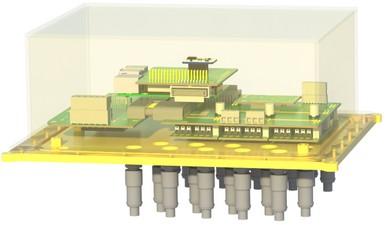
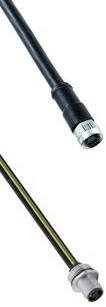
routing signals to all the ROV’s electrical systems. Continuing from our success with previous machined boxes, this year's Power Box again houses both power and systems. Putting them together in a single enclosure simplifies sealing and implementation of safety features, like the leak sensor, keeping our electronics safe. The Power Box is CNC milled out of a single block of 6061-T6 aluminum, allowing for high strength at minimal cost (welded versions have proven to be far more expensive in terms of time). The enclosure seals to a custom-manufactured lid, the Carrier Plate, via a face, seal using a 1/8” x-profile o-ring and has a vacuum port to test the seal.
Many design changes were made to expand reliability. Increasing the box’s e to accommodate boards made onics more reliable as the extra space nts wires from disconnecting when g the box, a prevalent issue last year. g the o-ring groove from the Power the Carrier Plate made it easier to with and seal as the o-ring would not t.
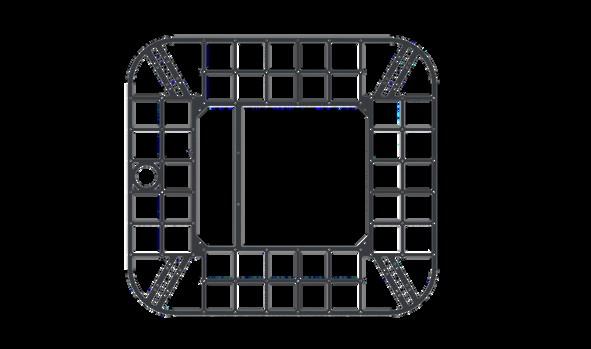
Mounted in the frame’s center, the Power Box is the heart of the ROV, housing our custom circuit boards and ELECTRONICS ENCLOSURE POWER BOX
th these design changes, hydrostatic element analysis (FEA) was performed to determine the minimum wall thickness needed to prevent failure at a depth of 10m with a factor of safety of 2.0.
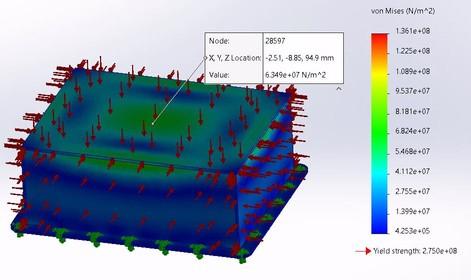
The Carrier Plate serves as a lid for the Power Box. The plate is designed with cross-department feedback to ensure there would be numerous mounting points for electronics scaffolding and well-placed ports for electrical connectors. The design maintains an even center of gravity while remaining lightweight due to isogrids cut into the bottom of the plate. Since the plate had to remain 0.25” thick for the connectors, scaffolding screws, and o-ring groove, iso-grids were utilized to remove extraneous material.
The plate was designed using 6061 aluminum to withstand at least 40 psi of external pressure, and FEA was conducted for design validation before manufacturing. The combined Power Box and Carrier Plate connect to the tether and provide support for connections to 12 brushless DC motors, including 8 thrusters, the pneumatics enclosure, as well as multiple USB cameras via Binder ports. There are additional ports for further expansion to new capabilities and arrangement flexibility.
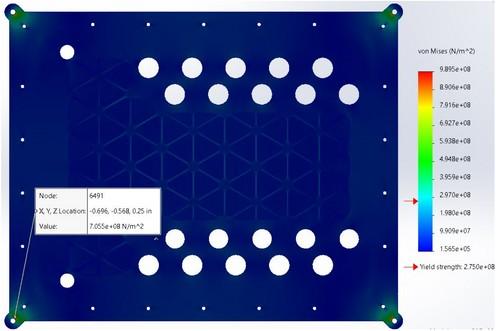
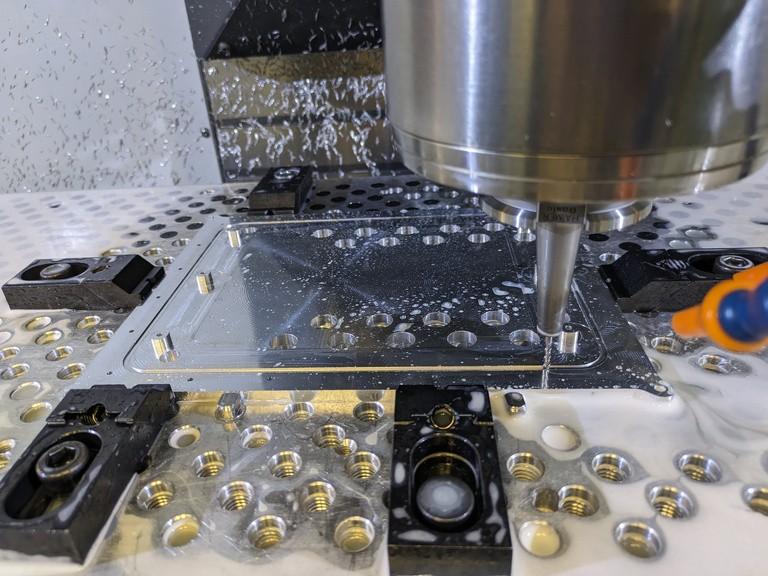
y nted securely in the electrical enclosure, which led to significant reliability issues. This year we resolved this issue by rigidly mounting the electrical stack to the carrier plate with a 3D printed scaffold. 3D printing was chosen as it allowed rapid modification for new electrical components and provided sufficient structural rigidity to the stack. This proved invaluable as multiple prototypes were created to create the perfect fit between imperfectly toleranced parts.
The scaffolding provides the electrical components with adequate spacing, increasing important buffer time between leak detection by leak sensors and emergency recovery of the ROV. A separate scaffolding component was also developed for the Raspberry Pi, allowing easy removal of the element. All together, this design refresh makes the current electronics enclosure much easier to work with and more dependable than previous iterations.
This season, the team opted for pneumatic-driven tools to complete the given mission tasks. The main reason to use pneumatics is to reduce electrical power usage - eight T200 thrusters take up 91% of power capacity. Pneumatics, however, come at the cost of complex manufacturing operations. Manifolds are notoriously hard to manufacture: they require small, tightly packed holes that don’t meet. Even so, we decided to machine it from 6061 aluminum ourselves. Manifolds are already highly custom to each application; a compact waterproof manifold is so specialized that outsourcing was not worth it.
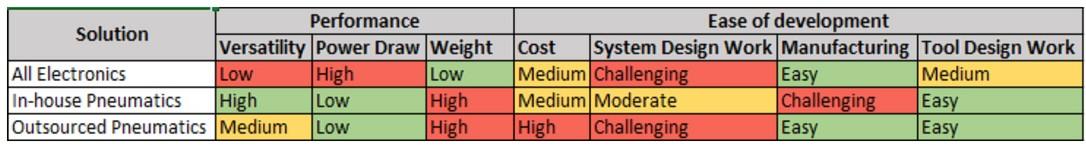
We would either have to adapt our pneumatic system to the manufacturer’s requirements or pay large amounts to get a complex milled part.
Most of the design effort was optimizing hole depth ratios (depth:diameter) and wall thickness to improve manufacturability The current design heavily employs drilling from multiple faces. Creating 90-degree bends for fittings to have enough space drilling THRU holes from opposite faces and meeting in the middle. This reduced our depth ratios from 19, impossible, to 9 which was attainable with available tools.
Despite intricacies, the manifold was manufactured successfully on the first try and proven to be a great success as it has successfully been tested up to 100psi. It is completely quiet when pressurized, with no audible leaks, and has interchangeable fittings if they were ever to be damaged. The manifold is also highly responsive as the pilot perceives the cylinder movement as in
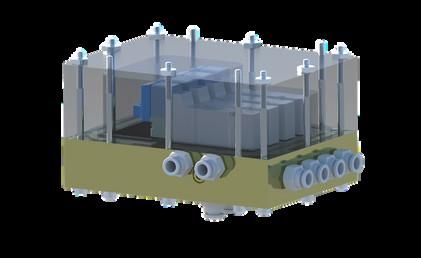
was selected after extensive research and MATLAB simulations, and anecdotally was also the layout the pilot found easiest to use when completing mission tasks. This year, the team selected to design X16 with this thruster envelope because of its thrust
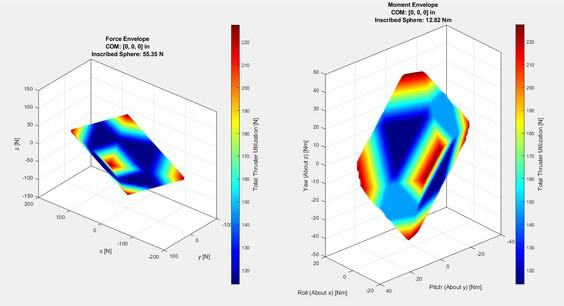
The tether acts as an umbilical to X16Nemo from the base station, transmitting data and supplying power to the ROV. Last year, Purdue ROV placed considerable resources and time into designing a new and improved tether to achieve as close to neutral buoyancy as possible so that it would not impact the ROV’s controllability.
After many iterations,
For the past two years, Purdue ROV has opted to use a novel thruster layout. This layout is unique in that it is symmetric in three planes, resulting in a uniform thrust envelope in the Y (left/right) and Z (up/down) axis while allowing for maximum thrust along the principal X (forward/reverse) axis and a high degree of pitch and yaw authority. This design
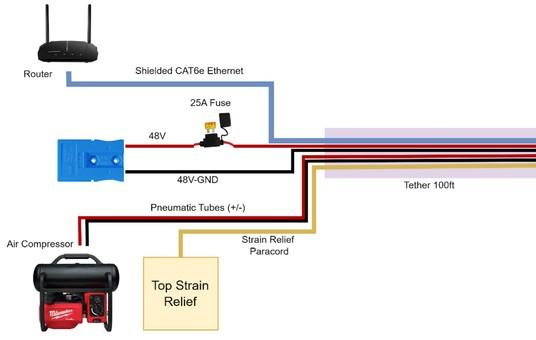
this tether proved to be reliable and close to neutrally buoyant, so the team opted to reuse it this season to focus design efforts on other areas.
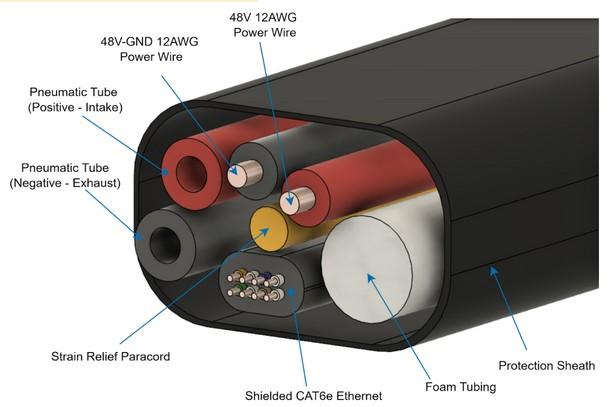
The tether supplies power and data to the ROV via a heavy-duty power cable and CAT6e-shielded ethernet cable to limit electromagnetic interference from the water. The tether contains two pneumatic tubes, an intake tube supplying air to the pneumatics manifold, and an exhaust tube venting air back to the surface. Foam tubing also runs through the length of the tether to achieve near-neutral buoyancy of the tether. Finally, the tether relieves strain via the internal paracord and a PET cable sleeve to prevent damage to the wires.
These blocks provide approximately 300g of buoyancy each, are symmetric about the robot to maintain a centered CoB, and are designed to take up as little usable mounting space as possible.
Finally, small foam-filled buoyancy cubes were designed to be mountable to the frame. These cubes bring the ROV to a neutral buoyancy and ensure the CoB remains near the ROV’s geometric center. These cubes were an improvement on the previous design which required extensive duct-taping to stay on ROV Nemo.
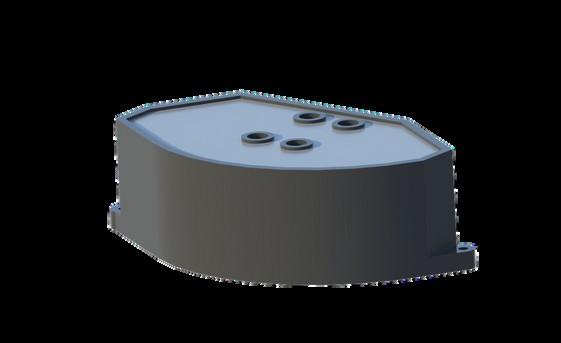
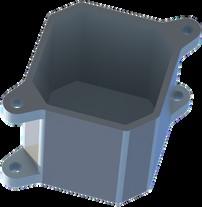
See Appendix A for the tether management protocol.
In past years, Purdue ROV has found that the most maneuverable ROVs are symmetric, ie designed such that the center of mass (CoM) is as close as possible to the geometric center. Likewise, to ensure stability underwater, the center of buoyancy (CoB) should be positioned slightly above the CoM. With this CoB above the CoM, the ROV will naturally selfright its orientation, with the distance the CoB is from the CoM dictating the speed of this behavior.
ROV Nemo achieves near-neutral buoyancy through four large corner foam blocks located under the thrusters.
The Electronic Stack of ROV Nemo is centered around four basic ROV requirements: Power, Motion, Vision, and Tools. The stack consists of 5 custom PCBs for optimized modularity: Power Slab, Backplane, Pi Shield, ESC Controller, and ESC Adapter. First, for Power, the Electronic Stack converts 48V from the tether to 12V for thrusters, servos, and solenoids, 5V for the onboard embedded computer and microcontroller, and 3.3V of all additional logic components. Most importantly, Power Slab has a DC-DC conversion brick that can convert 48V to 12V at 1300W power output. The Backplane board then distributes power and logic utilizing SAMTEC connectors which ensures solidly mounted connections and reduces unreliable ribbon cables. Properly-rated SAMTEC ET60S Series connector were utilized to transfer the high amounts of power required by the Electronic Stack.
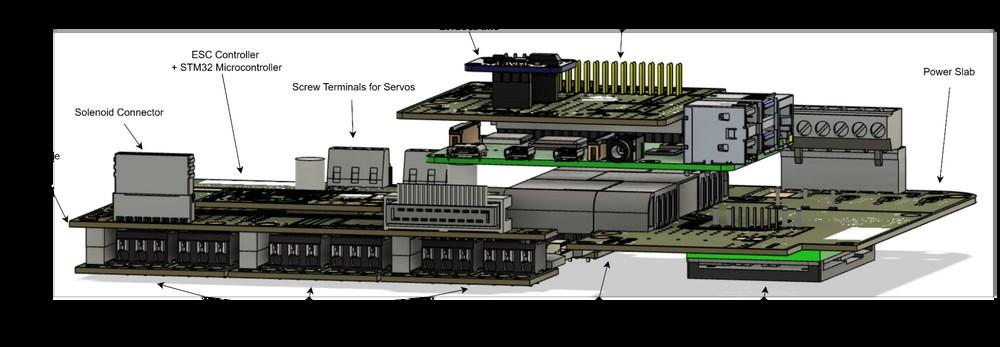
Second, X16-Nemo’s stack achieves its Motion by controlling 8 Blue Robotics T200 Thrusters. With 12V power supplied, the stack can reliably operate all 8 thrusters simultaneously with controls from 2 Lumenier BHeli32 4-in-1 ESCs (Electronic Speed Controller), STM32 Microcontroller, and Raspberry Pi 4B (Pi4B). The embedded communication between multiple microcontrollers is done through SPI protocol between the Pi4B and STM32 chip to output 8 PWM signals to the BHeli32 ESCs.
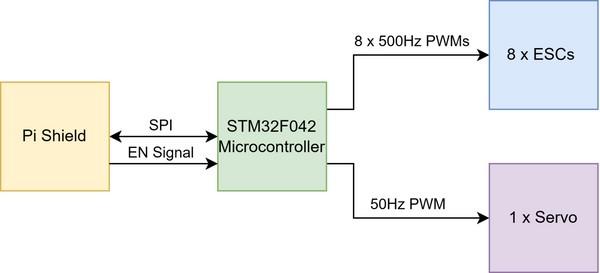
Third, the electrical stack achieves Vision through 4 digital cameras. We use DWE ExploreHD 3.0 Digital Cameras for 3 reasons: USB compatibility with Pi4B, onboard H.264 Compression, and with a wide field of view and high frame rate (30fps). To maximize the performance of the cameras, we also use a third-party 4port USB 3.0 Hub to distribute the streams to the USB 3.0 port of the Pi4B. The camera streams will be processed by the Pi4B and
sent via the Ethernet of the Tether to the Surface Station.
Fourth, the Electrical Stack of X16-Nemo can operate its Tools, consisting of pneumatic solenoids and servos. For the pneumatic solenoids, we can open and close the 4 solenoids on the ROV by 4 GPIO pins of the Pi4B. For the servos, we have screw terminals on the side of the Backplane which consists of a 12V power and PWM signals from the STM32.
In the design of the X16 Nemo’s Electrical Stack, we need to take into account all components that have high power consumption, and with our configuration of 8 thrusters, we need to be extra careful about the energy usage of the ROV. Because of that, we have some estimations of the wattage of each component based on datasheets and we have the following table:
To elaborate, our system consumes a total of 1180W maximum with the majority of power drawn from the 8 T200 Thrusters with 2 ESCs. Additionally, a total of 1180W maximum means that the system is drawing about 24.58A of maximum current from 48V power; therefore, we chose a 25A fuse to prevent over-current damage to the ROV.
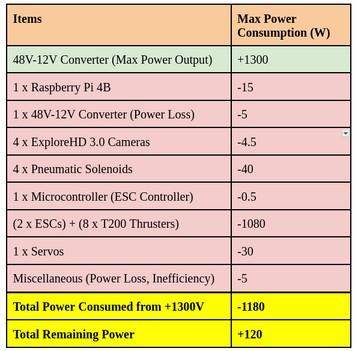
Purdue ROV prides itself in customdesigning all five PCB boards, developed in Autodesk Eagle. These boards are rigorously reviewed and tested, offering the team greater modularity and control over functionality, physical footprint, and design. In the end, this is a design decision that offers strong benefits to both member education and ROV performance.
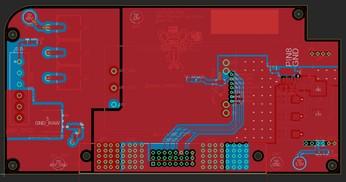
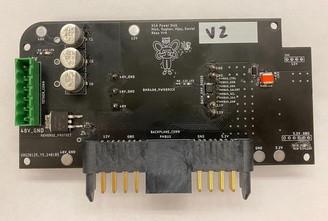
The chief design goal of X16-Nemo’s Electrical Stack is to improve the reliability and functionality of X15’s Electrical Stack. For instance, last season, the team struggled with establishing embedded communication to drive thrusters. This year, after deciding to redesign the system from the ground up, the team performed market research on potential protocols and used decision matrices to select the best improvements to address these issues. Four protocols were considered: CAN Bus, SPI, I2C, and UART.
Based on the decision matrix, we decided to adopt SPI instead of the previously used CAN Bus because of various reasons. First, SPI was simple as
it does not require additional circuitry. Second it is reliable as proven by our temporary fix last year. Finally it best fit our intended application since we only have a single receiver.

In addition to selecting a new embedded protocol, we opted to rethink our packet format. The previous season’s implementation of SPI was unidirectional and fire-and-forget, resulting in an unreliable protocol with minimal debugging information. Messages were expanded to include two-way communication, error checking (CRC), multiple message types to control both thrusters and servo tools, sequence numbers (message IDs), and acknowledgments. All of these features result in negligible communication overhead while ensuring reliability and offering valuable diagnostic information should an error occur.
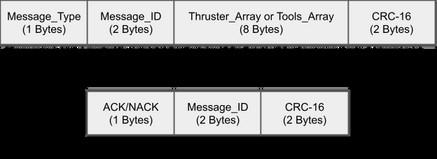
The new packet protocol was developed collaboratively between the software and electrical departments. The protocol was first prototyped at the beginning of the season on development boards, with new features added one at a time and rigorously tested before implementing the next feature. Before the boards were ordered, the embedded software developers conducted a design review of the final PCBs to ensure compatibility with the new protocol. Once the electrical
manufacturing phase was complete, the code was flashed to the ROV and, once again, tested and debugged the code on the stack. Through this collaborative process and systematic design process, the team was able to avoid any major design issues and prevent major project schedule delays, unlike last year. See Appendix C for additional rationale.
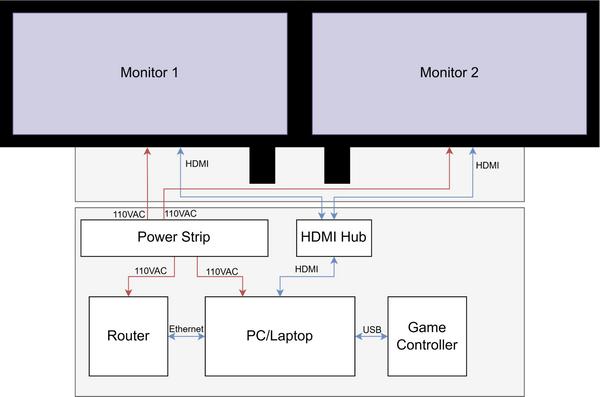
Figure 19. Control Station SID
Previously, Purdue ROV did not have a dedicated surface station, opting to use a laptop to display camera streams and the user interface. This made piloting difficult during competition, as the pilot was limited to one camera view at a time. This season, the team addressed this problem by designing a new, dual-monitor surface station, designed to be assembled and torn down in five minutes or less. The surface station was built into a large Pelican case, comparable in size to a checked bag, to facilitate easy transport
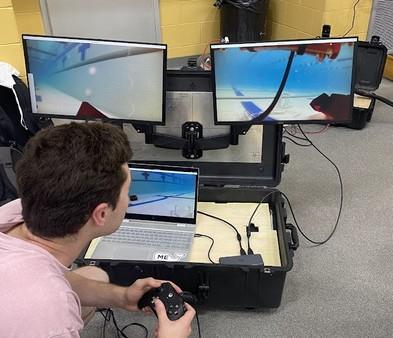
The team selected a dual monitor setup to maximize screen real estate, however, this also comes at the cost of increased setup and teardown time. The selected arms were chosen to partially mitigate this disadvantage; they are easy to assemble and can slide directly off the wall mount, reducing setup time. After the mission is completed, the monitors are stowed inside a dual monitor storage bag along with their associated cables, which all fit neatly inside the base of the box. Finally, the deck crew drilled the assembly and teardown of the surface station to verify it could be completed during the 5-minute setup stage.
This year the software department decided to deprecate our previous, node.js piloting interface in favor of developing a new user interface developed in PyQt5. The previous front-end was supported by the team for several years but was becoming clunky, hard to update, and sub-optimal for continued use. After performing market analysis, the team settled on PythonQT5 over node.js because it was easier to develop and integrated well with the rest of the software stack. Using QtDesigner, a user interface can be created with a simple drag-and-drop program and then easily converted to a Python file and connected to a Python environment.
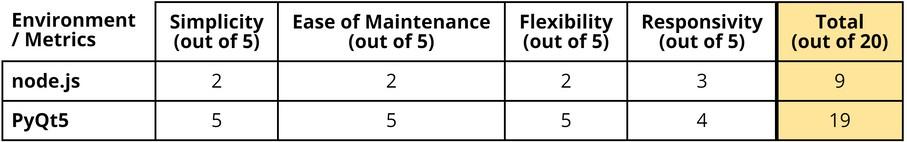
Table 6. Front-end Development Environment Decision Matrix
Having selected the environment, the front-end sub-team began development, designing the front-end to be user-friendly and productized. The frontend was designed so that every sub-system could be launched with a single command, and would terminate when the front-end was closed. Finally, rigorous testing was conducted to ensure the UI comprehensive launch would not negatively impact ROV operation.
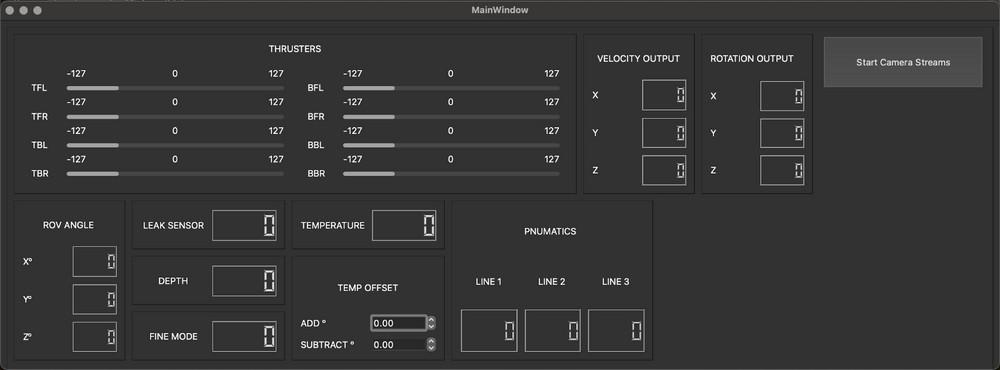
The UI separates each camera stream into independent windows that can then be moved to various monitors on the surface station. The user interface then remains on the pilot’s laptop and displays information including thruster outputs and sensor data.
The Control Box is the power supply box that provides 48V power to the ROV Nemo’s Tether from the normal 110VAC wall outlet. Similar to the standard MATE Control Box, our control box consists of an Anderson Connector, a power switch, an extra AC outlet, and an LCD power monitor. To convert 48V at 1440W from AC sources, we use four AC-DC power supplies, each of which can convert AC to 12V at 30A. Connected in parallel, voltage is quadrupled from 12V to 48V @30A providing a maximum Wattage of 1440W.
Onboard is a power switch that turns on and off the 48V power to the ROV’s tether acting as an emergency power switch. Additionally, we have a wattage meter LCD monitor that can measure the voltage, current, and power consumption of the ROV providing another layer of security.
Internally, the Control Box’s internal connection and wiring are done with highpower screw terminals and 10-12AWG wires as all the internal components are securely mounted
and organized to ensure no exposed wiring or electrical hazards. Lastly, the Control Box is protected by a hard plastic casing box from any physical damage.
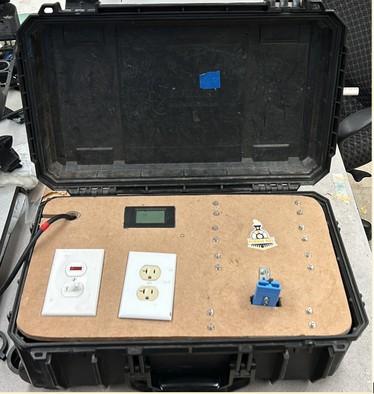
Camera positions were selected to make piloting the robot and interacting with the environment as easy as possible. There are four total cameras each placed around a tool being used. The first camera is placed in front of the robot facing the primary manipulator. One camera is mounted under a thruster to the right of the primary manipulator.
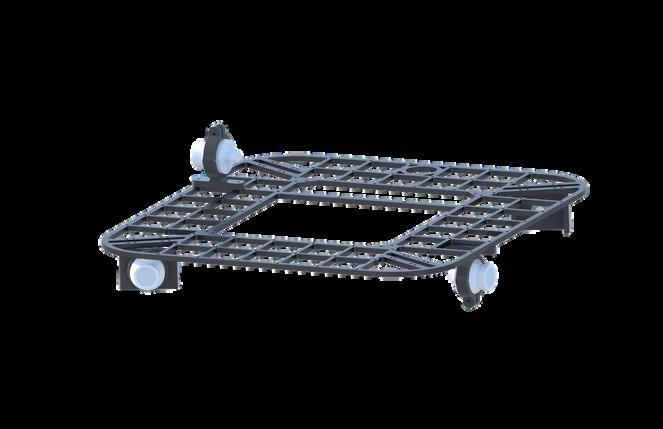
This camera allows the driver to see forward while moving the robot but also is angled so the pilot can gauge distance when using the primary manipulator. The second camera on the front is mounted on the PM itself moving with the PM as it articulates. This camera is critical for navigating over deployment areas and also provides a view of the primary manipulator in the downward position allowing for easy manipulation of items on the ground. The next camera is placed on the back of the robot to the left of the value turner above a thruster.
Like the front camera, this camera is angled, giving the pilot an optimal view of the Valve Turner tool.
The last two cameras are placed on the left and right side of the robot expanding the overall field of vision. They also provide the pilot with a view of the Rock Collector and Plier tool respectively.
To achieve the coral modeling task for the “From the Red Sea to Tennessee” task, we first devised a way to measure the unknown measurements using known values. To do this, we created an algorithm based on the math from Zhang and He to project any quadrangle into a rectangle on a flat plane to calculate the aspect ratio of the rectangle to use known measurements to find unknown ones (pp. 419-425).
To correct the distortion of the fisheye lens Explore HD cameras, we made a checkerboard calibration algorithm that takes many pictures of the checkerboard calibration pattern and outputs a camera matrix as well as distortion coefficients. These allow us to take the image, undistort, and crop the usable part of the image to get more accurate values when measuring.
lengths of the structure, we devised an algorithm to find the points of the rectangle and input them into our aspect ratio measurement function to get the unknown lengths in real-time. First, we filtered images to get rid of red and black to prevent interference from zip ties, different colored pieces, and red velcro. Then we used canny edge detection to find all contours in the image. With the contours, we did a few blurring steps to get the most clear contours. Then we mapped contours to polygon lines only if the contour would create 4 points and found the biggest one of these quadrangles and passed it to our aspect ratio function to get an aspect ratio. Then depending on the part we multiplied by a different value to get the unknown lengths.
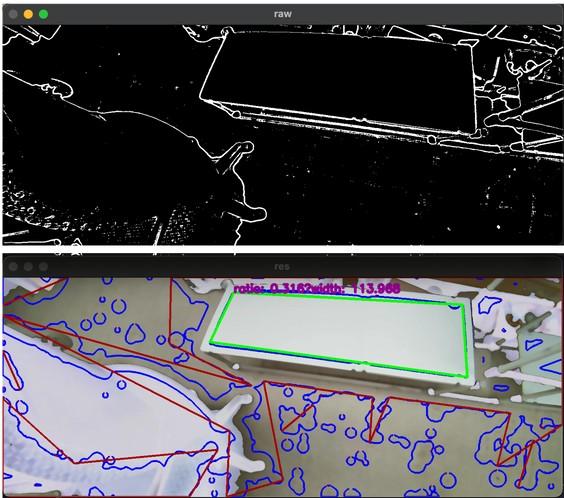
These tools utilize pneumatically actuated cylinders powered by compressed air to accomplish tasks. These tools are reliable, and fast, and can vary in power depending on the task. With the optimization of pneumatic cylinders for the task through mathematical calculations below and verification through prototypes, pinching hazards and sample damage from the excessive gripping force was eliminated. This makes these tools the safest and most reliable tools possible.
The Primary Manipulator (PM) is powered by two pneumatic cylinders for opening/closing the claw and rotating the claw horizontally and vertically.
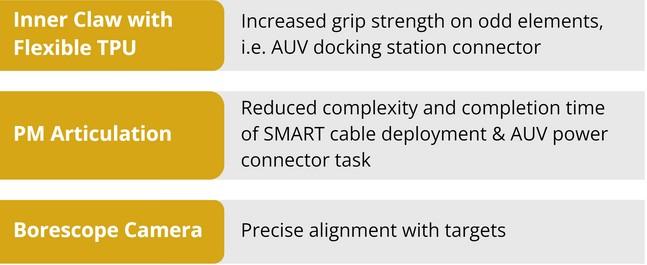
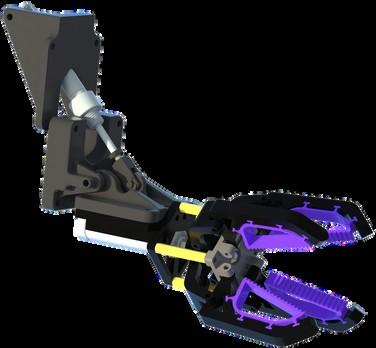

The Rock Collector utilizes a large 3D printed ‘bucket’ similar to the tried and true excavator buckets. The bucket allows for easy collection of samples from the ocean floor. ‘Vents’ in the bucket made possible by 3D printing decreases drag and allows for ocean debris to be sifted away leaving only the desired sample.
The Plier Tool uses a small pneumatic cylinder which allows for a large acquisition zone and high speeds with minimal strength allowing for soft tubing to be clamped with minimal damage. Suitable for grabbing difficult-to-grab small objects such as the Smart Repeater Cable.
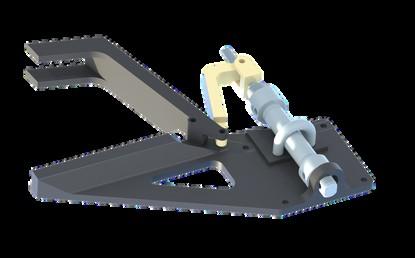
These tools are custom-designed for their specific role on the ROV to accomplish tasks that the pneumatic tools can not accomplish easily. These tools are designed to aid in our core principle of decreasing piloting difficulty. All these tools were custom-designed for their specific mission task. Because of our standardized frame, new tools can be easily added and removed if so desired, thus tools such as the Magnet Tool which is used only for one task - removal of the recovery float’s manual release pin - were included on the ROV.
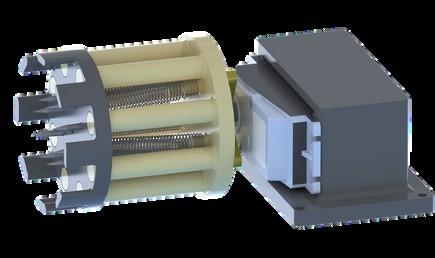
The Valve Turner utilizes a modified servo powered by the ROV to operate objects like the probiotic irrigation valve. The custom-designed interface utilizing low spring constant springs allows for selfcentering, minimizing piloting difficulty.
The Temp Sensor allows for temperature readings to monitor ocean health. Custom software GUI allows for easy calibration against a known temperature target.
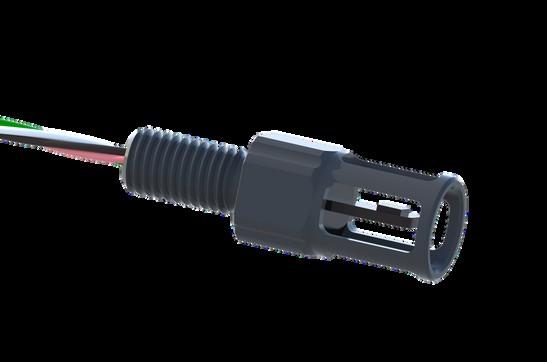
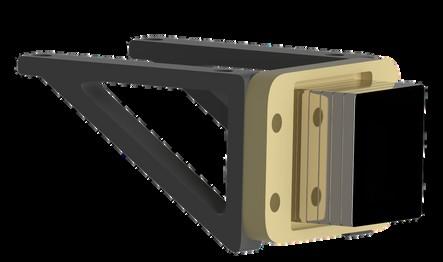
The Magnet Tool utilizes high-strength neodymium magnets that allow for easy recovery of magnetic items such as the recovery float’s manual release pin. Simplistic design makes this tool adaptable to any form required of the tool.
The Custom Carabiner contains 3D printed geometry that maximizes the acquisition zone and easily interfaces with the Primary Manipulator through a standard ½” PVC Tee fitting. With a strong torsion spring and PETG components, this tool i d il l ks into pos
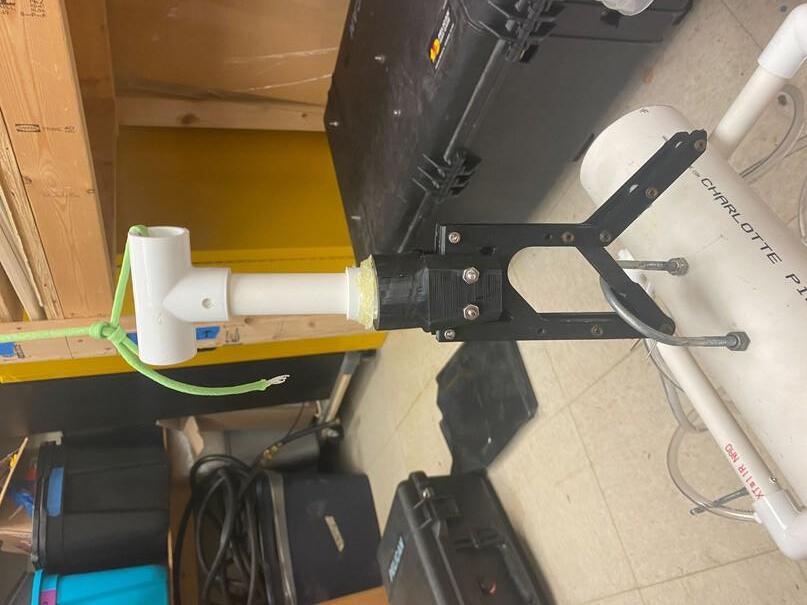
DEclude on the ROV, each task was characterized and carefully examined. From there, mechanical leadership decided with input from members on the final list of tools to design. Decisions were based on A) demonstrated need per task list, B) member bandwidth, C) previous need for tools, and D) suitability of other tools.
With the Plier Tool, for instance, we had to decide if keeping the tool for tubing tasks or freeing up space and utilizing the PM was most beneficial. Ultimately based on our goals of decreasing piloting requirements, a custom tool was chosen to increase the acquisition zone and reduce the already long list of tasks for the PM.
After generating the tools list, the design phase began. We started with a Build vs. Buy analysis and performed market research. In almost all cases, it was demonstrated that we could both make a tool cheaper and more suited for our use case than COTS solutions. In one exceptional case of the temperature sensor, the BlueRobotics model was chosen since it was faster to integrate and also cheaper when factoring in the time and opportunity cost of an in-house design.
Only two tools, the PM and Magnet Tool qualified for a Reuse vs. New decision as they were the only two tools with previous designs. For the Magnet Tool, the initial design failed a simple test of pulling out the float’s release pin, so a new tool had to be designed. For the PM, it was decided that a new tool would be made since it was the most critical tool in our arsenal, our primary manipulator. Even the slightest improvement in quality would lead to a large decrease in piloting difficulty due to its amount of use.
With these analyses completed, individual members were assigned tools and began design. With the emphasis on rapidly producing design iterations, the assigned member would have weekly progress checks to ensure members were not stuck on roadblocks. Leadership also utilized design reviews to ensure the proper tool was designed for the job.
An example of the design process is the primary manipulator’s articulation, now purposefully designed for the AUV docking station connector task. However, it originally started as its own tool. In the first ideation stage, a guide tool was created to align the repeater up with the connector. However, after finishing the entire design process, it was decided that it was far too bulky and too specialized, making piloting harder and the ROV less reliable. The task was re-examined and ultimately, the current design arose after multiple stages of design changes.
A variety of testing methodologies were employed throughout the initial design process and iterations following thereafter. To begin, mechanical parts underwent varying levels of finite element verification before manufacturing. Pressure-critical components, such as the Power Box, and expensive components or components with a high manufacturing time were verified to have a minimum factor of safety (FoS) of 2.0 before manufacturing. For non-sensitive components, a minimum FoS of 1.5 was ensured for the final version of the part, with initial prototypes not undergoing rigorous finite element tests. Potentially pressure-sensitive components were also tested utilizing a pressure testing chamber up to 50 psi before being installed on the ROV to ensure the safety of critical electronics and structures. Finally, custom tools were tested with our standard 1meter stick test (can the tool work after sticking it on the end of a 1m stick?) before being installed on the ROV. This verification allowed the team to identify and differentiate between issues caused by the part being submerged and purely mechanical issues.
When parts were found to be structurally inadequate the first step was to optimize the geometry of the components. Using FEA stress concentrations could be identified and reduced by optimizing component geometries. In cases where a simple geometry change was not sufficient to fix the part, multiple potential solutions were available. On some components, a design change would be made to add additional support to at-risk structures. For other elements, manufacturing changes could be utilized to resolve structural failures. Many tools were made using 3D printing, so increasing the infill of components or varying the filament material used would fix these parts. For some mission-critical tools, multiple versions were designed and produced in parallel allowing the team to select the best-performing version and for crossmember mentoring. Rapid prototyping practices were also heavily encouraged to ensure members could physically understand components being designed in CAD software and reduce misjudgments in component sizing.
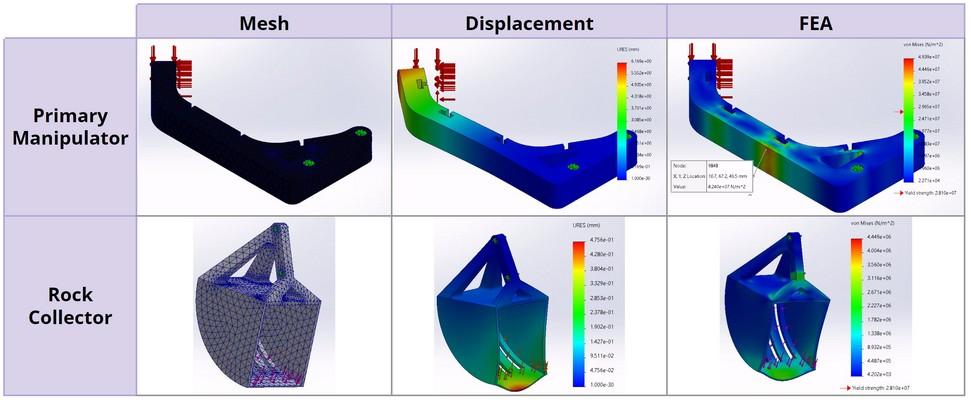
Safety is the highest priority for Purdue ROV. A safe work environment does more than prevent workplace injuries; it improves employee comfort, productivity, and enjoyment. The safety of all employees, bystanders, and equipment is examined in each and every action taken or product used.
Purdue ROV utilizes numerous standard operating procedures (SOPs) that every employee must follow when working on ROV Nemo. To ensure this occurs, new employees must complete hazard training before using the team workspace, and receive permission from a senior member before operating hazardous equipment. This year, multiple onsite safety officers were appointed to ensure safety infractions are recorded for remedial training.
Safety rules range from the one-hand rule when handling high voltages to proper PPE equipment when operating power tools. These rules were created over the years of the club’s existence with the assistance of resources such as the Oceaneering HSE Employee Handbook (2018). During the ROV's construction, specific checklists (See Appendix A) are followed to ensure risks are minimized.
A new safety measure expanded upon this year was the proper handling of hazardous materials. The team self-audited our chemical inventory, safely disposing of chemicals the team no longer uses and verifying hazardous materials were being stored properly.
New systems have also been put in place to review and reduce the usage of hazardous materials where possible.
During the operation of the ROV at pool tests, employees are also required to follow safety checklists (See Appendix A) to ensure both that ROV Nemo is safe to operate and that members remain safe while operating ROV Nemo. Any infraction at this stage disbars said member from the pool test and a follow-up safety meeting is scheduled to prevent future incidents from occurring.
ROV Nemo has numerous safety features. First, the tether has both a master fuse for the device and a strain relief cord to ensure physical and electrical safety. Secondly, sharp edges are minimized on the metallic parts via manual hand-reaming. Anodization is also performed to reduce potential health hazards from aluminum allergies.
Additionally, ROV Nemo’s custom thruster ducts integrate ingress protection features. They satisfy IP20, blocking objects larger than 12.5 mm while also minimizing any reduction in water flow.
Finally, the vehicle’s software provides the pilot with diagnostic information to ensure correct functionality before deploying into the water. Data on the current draw, Raspberry Pi temperature, and leak detections are continuously updated on the pilot’s screen so the pilot can shut off the ROV if conditions become unsafe.
Interested parties can view our Company Safety Review for further info.
Purdue ROV creates its yearly budget based on a combination of previous budgets, projected incomes, and projected future expenses. These expenses include the cost of producing ROV Nemo, the costs of attending the MATE competition, and the costs of R&D and new equipment for the workstation. This year, Purdue ROV's main financial objective was to reduce overall development costs while increasing overall income.
To reduce our development costs, the team carefully budgeted and tracked purchasing decisions while also strongly emphasizing the reuse of old materials. Efforts were also made to pursue sponsors who could provide discounted parts or services to aid in the development of our ROV. One such discount, by Binder USA, saved the team $500 on connectors. Similarly, the team opted to reuse thrusters from a decommissioned ROV, saving $1,600 on new T200 thrusters.
To increase funding, the team placed significant emphasis on utilizing academic connections and leveraging our Alumni network. The team was able to pursue our first ever crowdfunding campaign this season with the help of the Purdue College of Engineering. This uncertain venture ended up netting the team $4400 in alumni support as well as a $3000 College of Engineering match.
Overall, our strategy resulted in a budgetary surplus of nearly $8000 while also providing us with invaluable contacts and future income sources in place for the future. This year's surplus has entirely eliminated the deficit from the previous year and will provide the team with significant capital to pursue more R&D projects and finish our workspace renovations in the future.
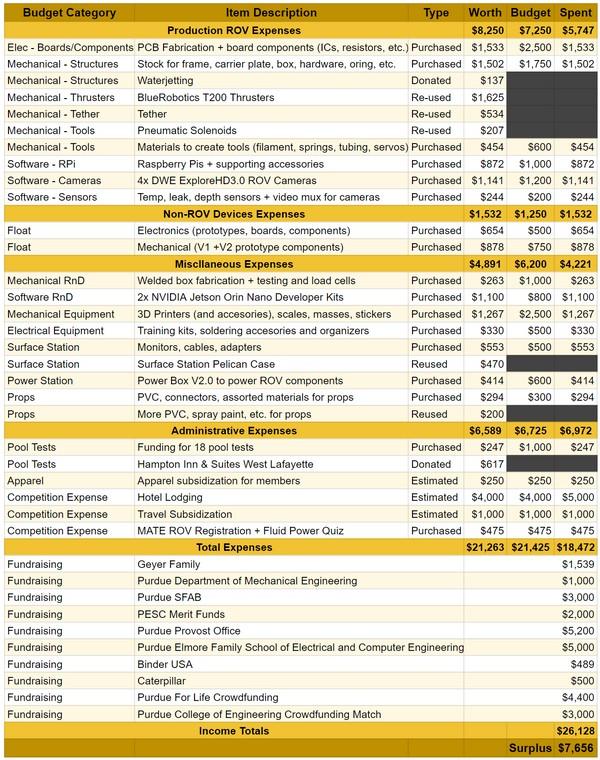

Parents and Family for advice and support | MATE Center for providing us this opportunity Volunteers and Judges at the MATE Competition | Company alumni for their support throughout the year | All our employees for their hard work throughout the year | Purdue IEEE Student Branch for being a great parent organization | Purdue Cordova Recreation Center and Hampton Inn for their provision of pools for testing | Bechtel Innovation Design Center for their manufacturing assistance
Americas Region HSE Employee Handbook 2018 Version 3.0.” Oceaneering, 2018. Callister, W. D., & Rethwisch, R. D. G. (2012). Materials science and engineering: An introduction (Vol. 8). John Wiley & Sons.
Christ, Robert D., and Robert L. Wernli. The ROV Manual: A User Guide for Remotely Operated Vehicles. 2nd ed., Butterworth-Heinemann, 2014.
Oberg, E , Jones, F D , Horton, H L , & Ryffel, H H (2004) Machinery’s Handbook: A reference book for the mechanical engineer, designer, manufacturing engineer, draftsman toolmaker and Machinist Industrial Press
Parker O-ring handbook. Lexington, KY: Parker Seal Group, O-Ring Division, 2001.
ROS 2 Documentation: Iron, Open Robotics, docs.ros.org/en/humble/index.html. “T200 Thruster.” Blue Robotics. http://www.bluerobotics.com/store/thrusters/t200-thruster “2024 Competition Manual Explorer Class.” MTS/MATE, 16 Jan. 2024.
Zhengyou Zhang, Li-Wei He, "Whiteboard scanning and image enhancement", Digital Signal Processing, Volume 17, Issue 2, 2007, Pages 414-432.
Pre-Deployment (Power OFF)
Area is clear of obstructions/hazards
Power supply is OFF
Cables and tether are undamaged
Cables are tied down and not loose
Connectors are fully inserted
Tether strain relief wire are attached to a stable structure
Screws are tightened on electronics and pneumatics enclosures
Deployment (Power ON)
Pilot sets up surface station
Pilot calls team to attention
Co-pilot calls out “Power ON” and switches on power supply
Deployment members verify ROV is on with thruster ESC startup sequence
Deployment members places ROV into the water and holds it securely underwater
Deployment members release air pockets
Deployment members check for signs of a leak (e.g. bubbles)
Leaked, go to Failed Bubble Check
Else, deployment members shout “ROV ready” and continue checklist
Pilot arms ROV and ensure controller movements correspond to thrusters
Pilot checks camera streams and tool actuation
Continue to Launch
Failed Bubble Check
Deployment members pull ROV out of water
Co-pilot turns off power supply and calls out
“Power OFF”
Members wipe off water on ROV
Members visually inspect to determine source of leak
Members document cause of leak, implement corrective actions and check all systems for damage
Launch
Pilot calls “ROV Launch” and starts timer
Deployment members let go of ROV and shout “ROV released”
Continue to ROV retrieval if no issues arise
Lost Communication
Steps attempted in order. Mission resumes when one succeeds
Co-pilot checks tether and laptop connections on the surface
Pilot attempts to reset the BattleStation
Co-pilot cycles the power supply
Co-pilot turns power supply off and calls out “Power off”
Deployment team pulls ROV to surface
ROV Retrieval
Pilot drives ROV to side of pool, disables thrusters and calls out “Retrieve ROV”
Deployment members pull out ROV
Deployment members call out “ROV retrieved”
Continue to demobilization or launch
Co-pilot turns off power and calls “Power Off”
Deployment members do visual inspection for damage
Pilot powers off battle station
Anderson connectors of tether are removed from power supply
Turn off air compressor and vent line
Remove air line from pneumatics enclosure
Assembly Check
ROV disconnected from power and pneumatics
PCBs are clean without visible damage
No wires are disconnected, loose, exposed or can get pinched by box or thrusters
Inside of the box is clear of water (residue)
Enclosure shows no sign of damage
All ports on the carrier plate are firmly screwed on
O-rings are undamaged and lubricated.
O-ring grooves are clean and unmarred
Tools are firmly attached to frame with little to no play
Power on pneumatics and check for leaks via “hiss” sounds and soapy water spray bottle
When powered, PCB warning lights are off
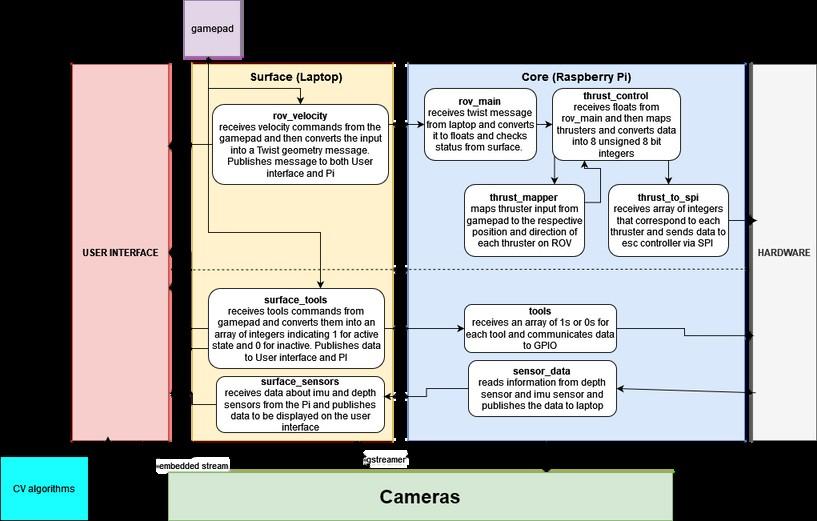
FLUID POWER SID
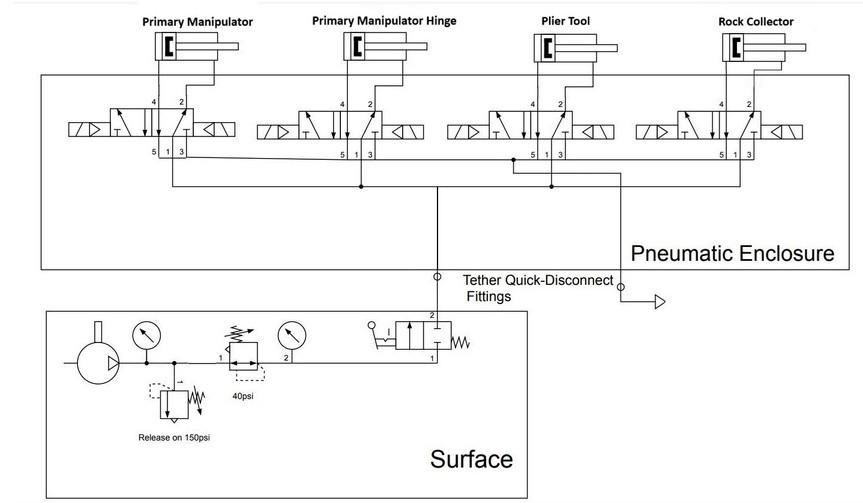
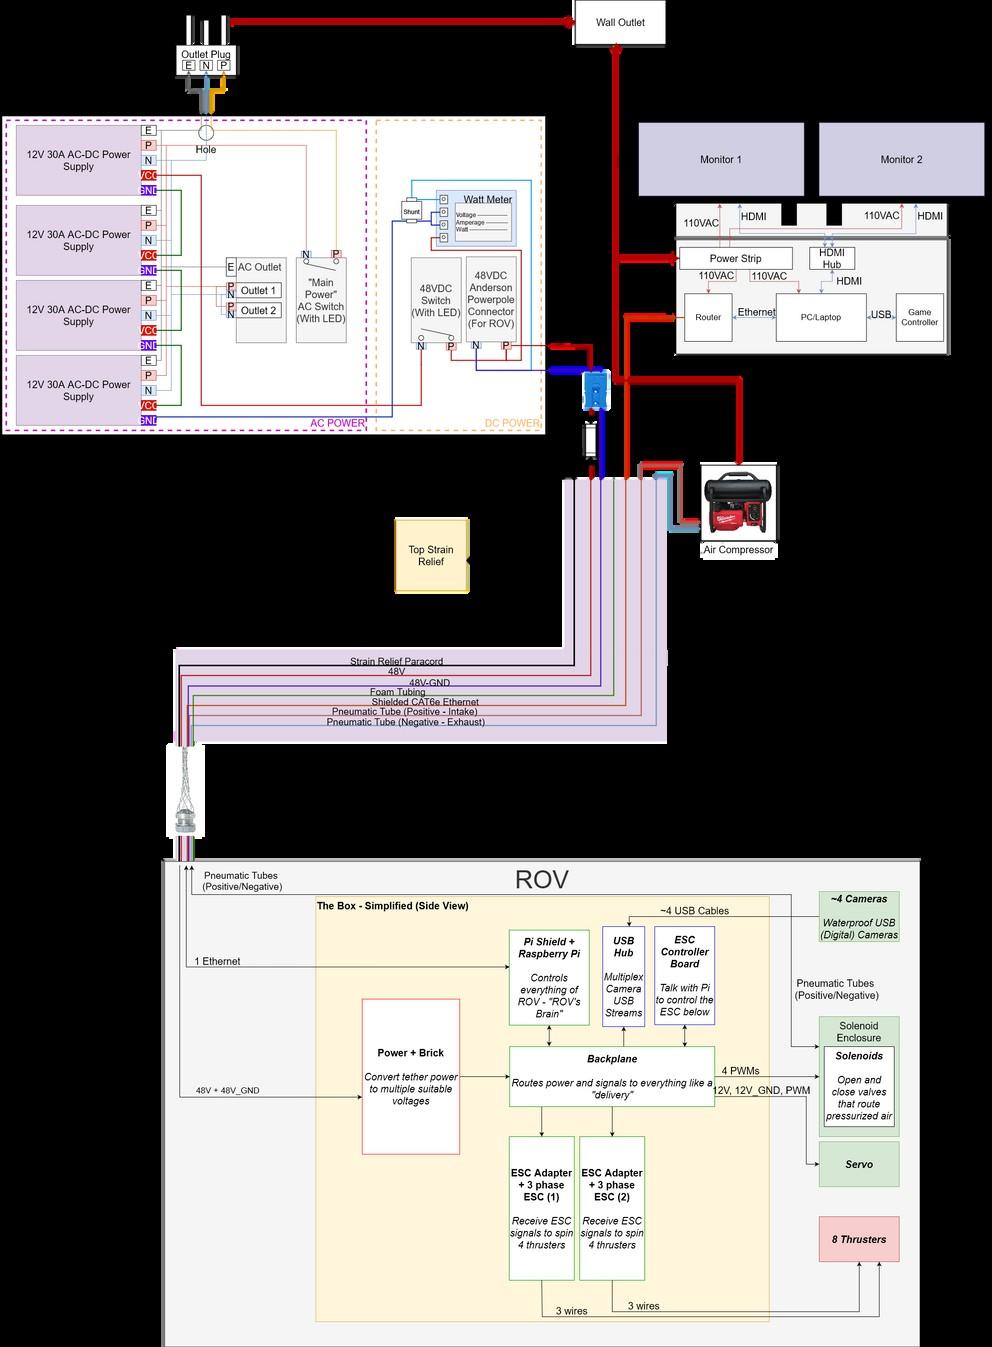
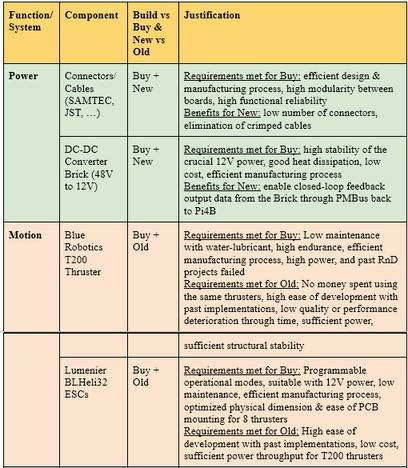
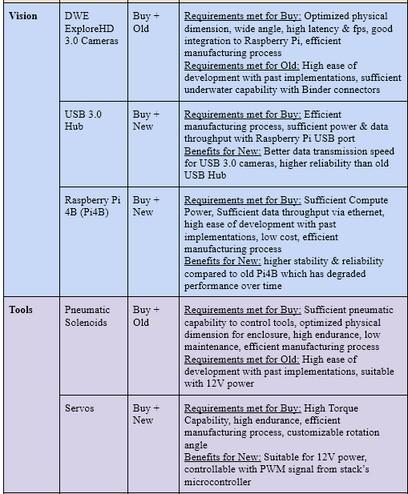
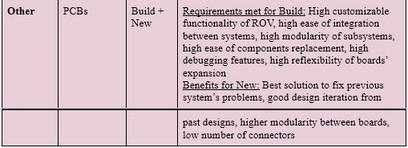
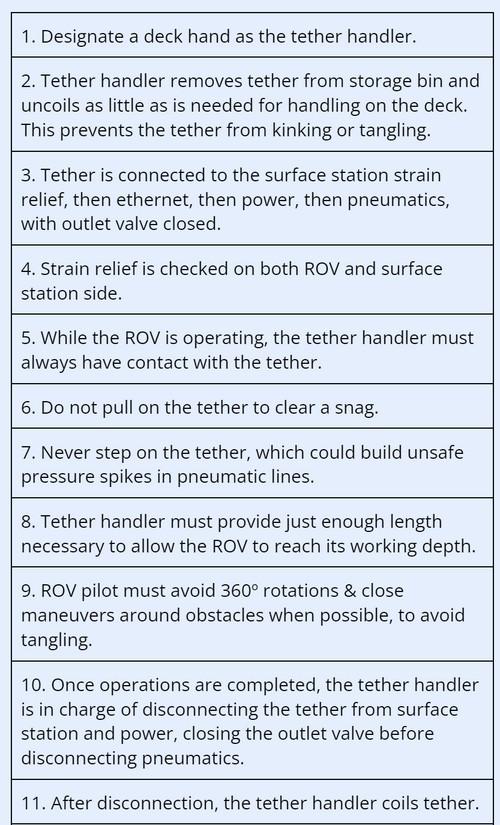
Table 9. Tether Management Protocol Adapted from Christ & Wernli, 2013