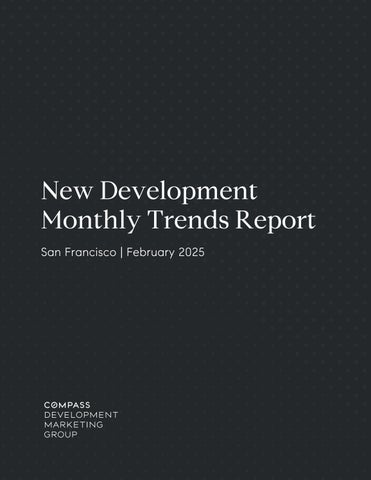
CDMG’s Monthly Trends Report provides an in-depth look at San Francisco’s neighborhoods districts 6-9 where new developments are most prevalent. Published monthly and highlighting the city’s vast condominium market, we pull information from a combination of public and proprietary databases which access the most up-to-date closing information and sales conditions for new development properties as well as resales.
San Francisco County | Year to Date Condominium Summary
Sales Volume | Year to Date Comparison Since 2018
In a year-over-year comparison to 2024, January 2025 has seen a 18 8% increase in the number of condominiums sold (+18 sales).
Average Price & PPSF | Year to Date Comparison Since 2018
In a year-over-year comparison to 2024, January 2025 has seen a slight increase in average sale price and a slight decrease in average sale price per square foot, +2 3% and -2 9% respectively. Source: InfoSparks: Data points are “Rolling 1
San Francisco County | Condominium Summary
Supply & Demand
The period from January 2024 to January 2025, saw an average monthly supply of condominiums of 670. On the demand side, there has been a 18.8% increase (+18 sales) compared to January 2024 and a 19.1% decrease (-27 sales) since last month.
Monthly Average Sale Price Change & Average PPSF
In a year-over year comparison the average sale price has increased by 2.3% and in a one-month comparison, it has decreased by 1 0%.
Source: InfoSparks: Data points are “Rolling 1 Month” which shows only a month of activity for each data point. Data was sourced on February 14, 2025
San Francisco County | Condominium Sales by Price Point
District 6 | Condominium Summary
Supply & Demand
The period from January 2024 to January 2025, saw the supply of condominiums averaging 43 per month on market. On the demand side, there has been a 30.0% decrease (-3 sales) compared to January 2024 and a 41 7% decrease (-5 sales) since last month.
Monthly Average Sale Price Change & Average PPSF
In a year-over-year comparison the average sale price has decreased by 7 8% and in a one-month comparison, it has decreased by 12 6%.
$1,440,000
$1,280,000
$1,120,000
$1,120,000
$1,053,800$1,080,556
$960,000
$960,000
$800,000
$800,000
$640,000
$640,000
$480,000
$480,000
$320,000
$320,000
$160,000
$160,000
$0
Source: InfoSparks: Data points are “Rolling 1 Month” which shows only a month of activity for each data point. Data
District 6 | Condominium Sales by Price Point
District 7 | Condominium Summary
Supply & Demand
The period from January 2024 to January 2025, saw the supply of condominiums averaging 58 per month on market. On the demand side, there has been an 50.0% increase (+5 sales) compared to January 2024 and a 21 1% decrease (-4 sales) since last month.
Monthly Average Sale Price Change & Average PPSF
In a year-over year comparison the average sale price has decreased by 0 6% and in a one-month comparison, it has increased by 52.1%.
$2,560,000
$2,240,000
$1,920,000
$1,600,000
$1,280,000
$960,000
$640,000
Source: InfoSparks: Data points are “Rolling 1 Month” which shows only a month of activity for each data point. Data was sourced on February 14, 2025
District 7 | Condominium Sales by Price Point
District 8 | Condominium Summary
Supply & Demand
The period from January 2024 to January 2025, saw the supply of condominiums averaging 143 per month on market. On the demand side, there has been a 3.4% decrease (-1 sale) compared to January 2024 and no change since last month with sales remaining at 28
Monthly Average Sale Price Change & Average PPSF
In a year-over-year comparison the average sale price has increased by 14 1% and in a one-month comparison, it has decreased by 8 8%.
$1,350,000 $1,500,000
$1,200,000
$1,050,000
$900,000
$750,000
Source: InfoSparks: Data points are “Rolling 1 Month” which shows only a month of activity for each data point. Data was sourced on February 14, 2025
District 8 | Condominium Sales by Price Point
District 9 | Condominium Summary
Supply & Demand
The period from January 2024 to January 2025, saw the supply of condominiums averaging 314 per month on market. On the demand side, there has been a 40.0% increase (+12 sales) compared to January 2024 and a 12 5% decrease (-6 sales) since last month.
Monthly Average Sale Price Change & Average PPSF
In a year-over-year comparison the average sale price has decreased by 4 3% and in a one-month comparison, it has decreased by 13 8%.
$1,080,000
$900,000
Source: InfoSparks: Data points are “Rolling 1 Month” which shows only a month of activity for each data point. Data was sourced on February 14, 2025
District 9 | Condominium Sales by Price Point
Select New Development Resale Search
The following are closed resales from a collection of new developments from the beginning of 2023
Select New Development Resale Search
The following are closed resales from a collection of new developments from the beginning of 2023.
Select New Development Resale Search
The following are closed resales from a collection of new developments from the beginning of 2023.
New Construction Project Profile
The information presented below is derived from currently selling new construction developments.
55 and 12 Accessory Suites
The data contained in the tables below refer to initial closings and listings conducted by the developer.
New Construction Project Profile
The information presented below is derived from currently selling new construction developments.
1288 Howard
Address
1288 Howard Street, San Francisco
Developer March Capital Management
Residences 125
Average HOA Fees ~$400 - $460 / Month
Date on Market January 2022
The data contained in the tables below refer to initial closings and listings conducted by the developer.
New Construction Project Profile
The information presented below is derived from currently selling new construction developments.
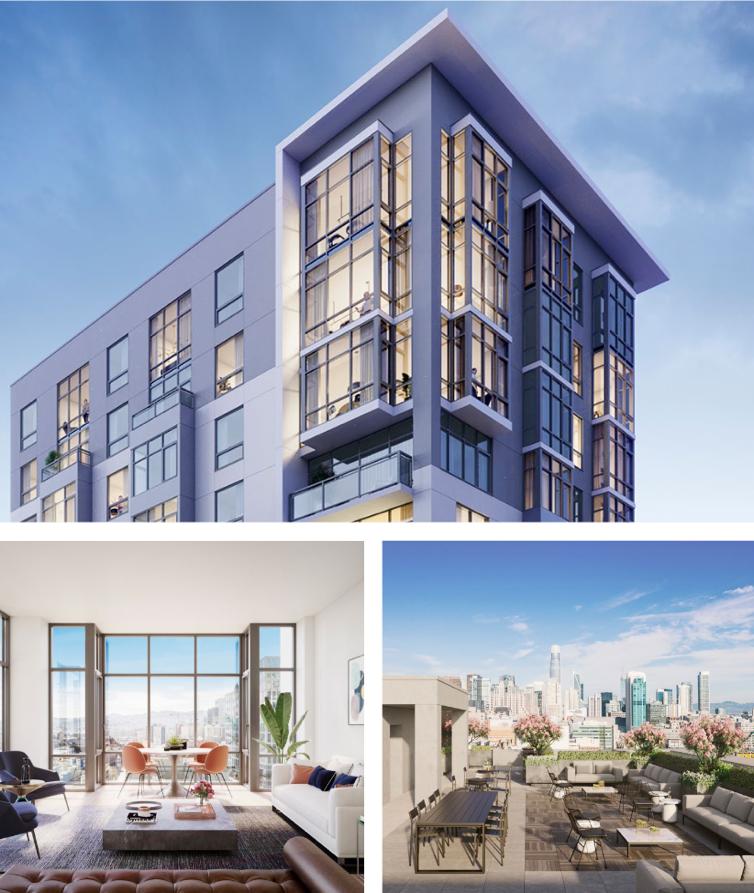
2177 Third
Address
2177 Third Street, San Francisco
Developer Align Real Estate
Residences 114
Average HOA Fees ~$740 - ~$1,100 / Month
Date on Market December 2019
The data contained in the tables below refer to initial closings and listings conducted by the developer.
New Construction Project Profile
The information presented below is derived from currently selling new construction developments.
Address
875 California Street, San Francisco
Developer Grosvenor Americas
Residences 44
Average HOA Fees ~$1,840 / Month
Date on Market March 2021
The data contained in the tables below refer to initial closings and listings conducted by the developer.
New Construction Project Profile
The information presented below is derived from currently selling new construction developments.
The Belvedere
Address
2525 Van Ness Ave, San Francisco
Developer March Capital
Residences 28
Average HOA Fees $933 - $981 / Month
Date on Market January 2024 The
New Construction Project Profile
The information presented below is derived from currently selling new construction developments.
Four Seasons Private Residences
Address
706 Mission Street, San Francisco
Developer
Westbrook Partners
Residences 146 Average HOA Fees
Month
Date on Market June 2019
The data contained in the tables below refer to initial closings and listings conducted by the developer.
New Construction Project Profile
The information presented below is derived from currently selling new construction developments.
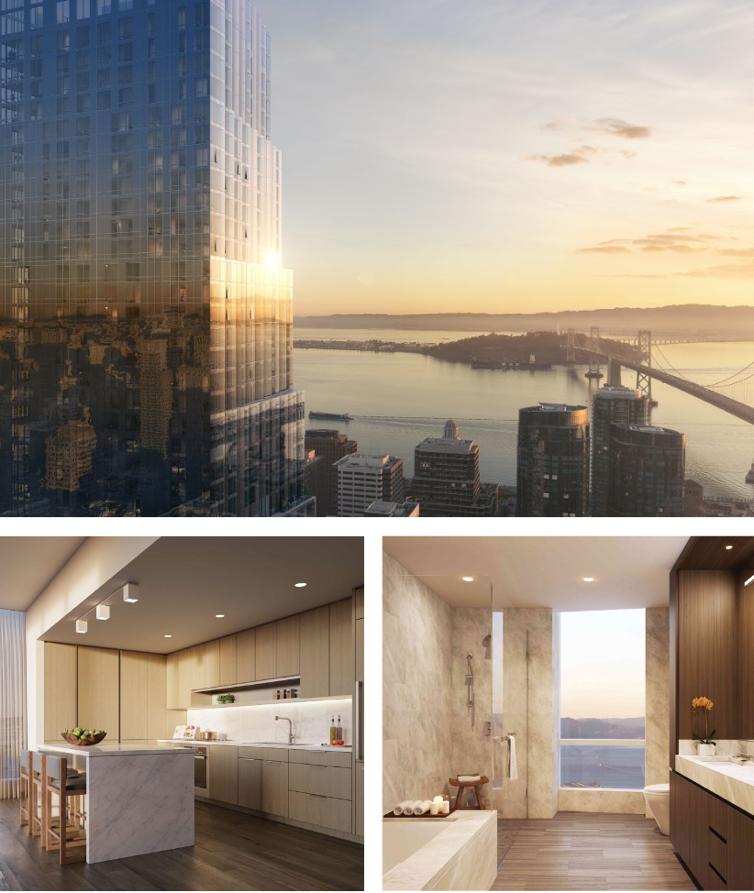
MIRA
Address
280 Spear Street, San Francisco
Developer Tishman Speyer
Residences
392
Average HOA Fees ~$1,075 - $1,560 / Month
Date on Market November 2018
The data contained in the tables below refer to initial closings and listings conducted by the developer.
New Construction Project Profile
The information presented below is derived from currently selling new construction developments.
One Eleven
Address
588 Minna Street, San Francisco
Developer
Z&L Properties
Residences
39
Average HOA Fees ~$525 - ~$680 / Month
Date on Market December 2019
The data contained in the tables below refer to initial closings and listings conducted by the developer.
New Construction Project Profile
The information presented below is derived from currently selling new construction developments.
One Steuart Lane
Address
1 Steuart Lane, San Francisco
Developer
SRE Group LTD / Paramount Group
Residences 120
Average HOA Fees
- ~$3,000 / Month
Date on Market February 2020
The data contained in the tables below refer to initial closings and listings conducted by the developer.
New Construction Project Profile
The information presented below is derived from currently selling new construction developments.
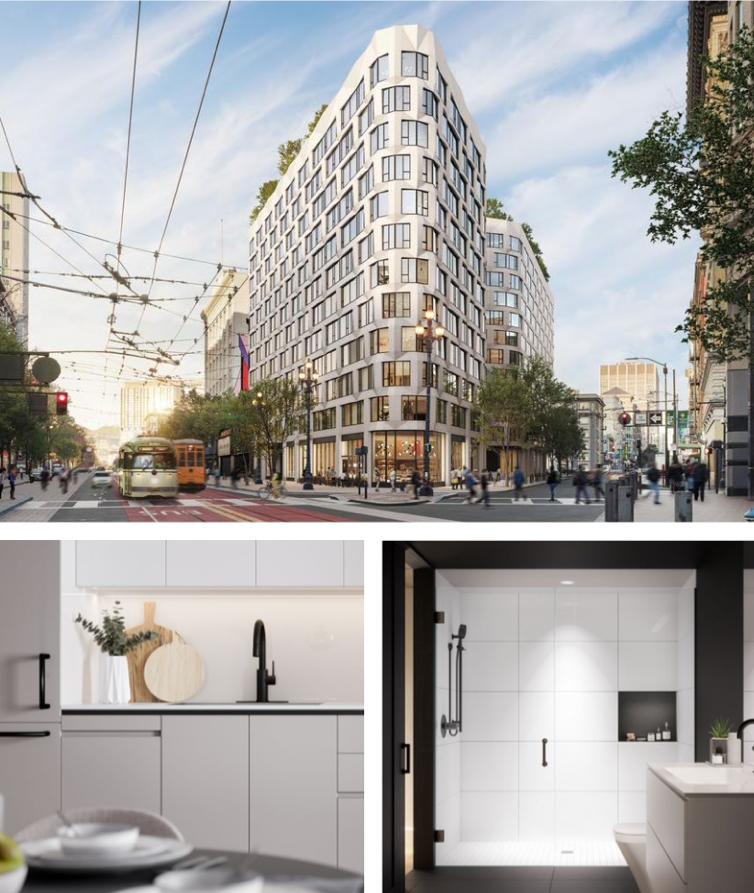
Serif
Address
960 Market Street, San Francisco
Developer L37 Partners
Residences 242
Average HOA Fees ~$600 - ~$1,100 / Month
Date on Market June 2021
The data contained in the tables below refer to initial closings and listings conducted by the developer.
New Construction Project Profile
The information presented below is derived from currently selling new construction developments.
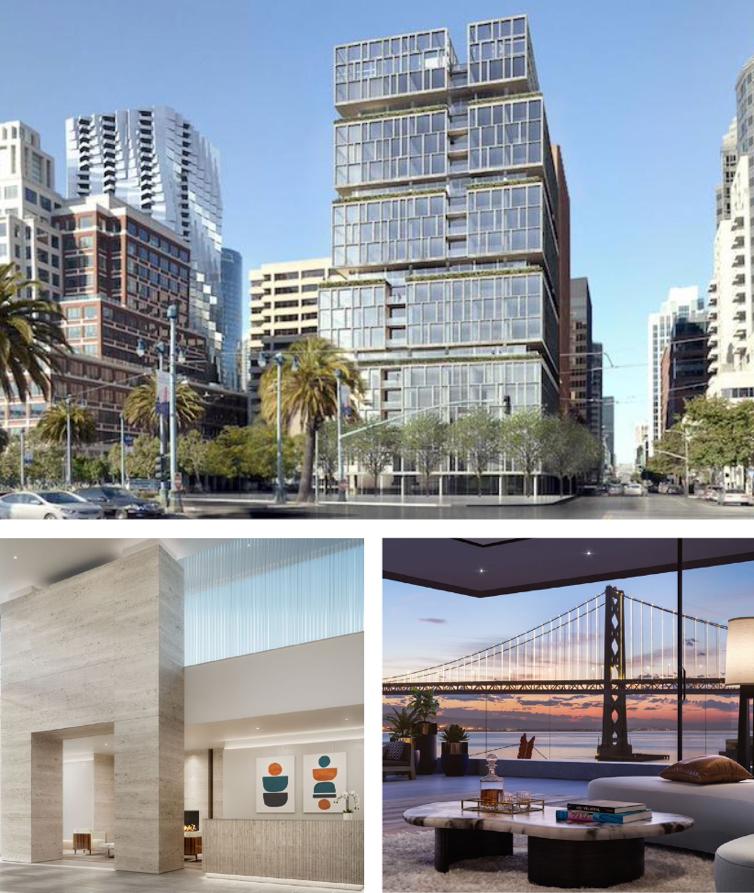
Address
488 Folsom Street, San Francisco Developer Related Residences 118
Average HOA Fees
- ~$2,490 / Month
Date on Market June 2018
The data contained in the tables below refer to initial closings and listings conducted by the developer.
New Construction Project Profile
The information presented below is derived from currently selling new construction developments.
The Bristol
Address
1 Bristol Court, San Francisco
Developer Wilson Meany
Stockbridge Real Estate Funds
Residences 124
Average HOA Fees
$1,290 - $1,420 / Month
Date on Market March 2021
The data contained in the tables below refer to initial closings and listings conducted by the developer.
New Construction Project Profile
The information presented below is derived from currently selling new construction developments.
The Row Homes at Yerba Buena Island
Address
37 & 38 Meadow Drive, San Francisco
Developer Wilson Meany
Stockbridge Real Estate Funds
Residences
12 Released
Average HOA Fees
$1,462 / Month
Date on Market April 2024
The data contained in the tables below refer to initial closings and listings conducted by the developer.
currently selling new construction developments.
Maison Pacific
1580 Pacific Avenue, San Francisco
JS Sullivan Residences
Average HOA Fees 703 / Month
Date on Market September 2023
The data contained in the tables below refer to initial closings and listings conducted by the developer.
New Construction Project Profile
The information presented below is derived from currently selling new construction developments.
2238 Market
Address
2238 Market Street, San Francisco
Developer Prado Group Vanke US
Residences 42
Average HOA Fees ~$660 - ~$880 / Month
Date on Market April 2022
The data contained in the tables below refer to initial closings and listings conducted by the developer.
New Construction Project Profile
The information presented below is derived from currently selling new construction developments.
88 at the Park
Address
88 Arkansas Street, San Francisco
Developer First City Development
Residences 127
Average HOA Fees ~$600 - ~$765 / Month
Date on Market May 2022
The data contained in the tables below refer to initial closings and listings conducted by the developer.
New Construction Project Profile
The information presented below is derived from currently selling new construction developments.
Union House
Address
1515 Union Street, San Francisco
Developer DM Development Residences 41
Average HOA Fees ~$900 - ~$1,680 / Month
Date on Market February 2020
The data contained in the tables below refer to initial closings and listings conducted by the developer.
New Development Monthly Trends Report
891 Beach Street San Francisco, CA 94109
Compass makes no representations or warranties, express or implied, with respect to future market conditions or prices of res idential product at the time the subject property or any competitive property is complete and ready for occupancy or with respect to any report, study, finding, recommendation, or other information provided by Compass herein. Moreover, no warranty, express or implied, is made or should be assumed regarding the accuracy, adequacy, completeness, legality, reliability, merchantability, or fitness for a particular purpose of any information, in part or whole, contained herein. The statistics and information in this report are based upon publicly available data of transactions reported from January 2023 to January 2025 All material is presented with the understanding that Compass shall not be deemed to provide legal, accounting, or other professional services. This is not intended to solicit the purchase or sale of any property. Any and all such warranties are hereby expressly disclaimed. Equal Housing Opportunity.