

Location Strategies for Research and Development Facilities in Japan
The Potential of R&D Property Lease


“ Summary
Investing in intangible assets, including research and development (R&D), is crucial in today’s economy. The location of R&D facilities is influenced by various factors, such as real estate market conditions, existing company sites, and access to researchers, related institutions and knowledge. Historical changes in the manufacturing industry, as well as the political and economic environment, have influenced the present geographical distribution of these R&D centers. As new trends in manufacturing and R&D focus on the benefits of urban concentration and functionality, there is a continued emphasis on central metropolitan areas. In recent years, the real estate market has seen a rise in the supply of rental properties specifically designed for R&D activities, particularly in the Kanto region (also called as the Greater Tokyo area), mainly centered around Tokyo (NLA: 318,000 sqm), and the Kinki region (also called as the Greater Osaka area), centered around Osaka (NLA: approx. 124,000 sqm). These rental properties are equipped with the necessary facilities to cater to specific R&D requirements, including different specifications and laboratory equipment, setting them apart from regular office buildings. However, given the unique nature of R&D activities amongst companies, there are many aspects and considerations that need to be thoroughly examined when selecting a rental space as a potential location. Effective communication and collaboration with experienced real estate specialists and relevant stakeholders within the organization are vital for the success of such projects.

01 Trends in Corporate R&D Facilities
In recent years, there has been increasing attention on investing in intangible assets. In the modern economy, intangible assets such as knowledge, brands, and design have been proven to generate significant profits for companies. R&D activities are also recognized as one of these intangible assets and enhancing the productivity of R&D activities will be essential for companies going forward.
Three elements of R&D facilities: real estate, existing sites, and people and knowledge
R&D involves the creative efforts and exploration dedicated to acquiring new knowledge and applying existing knowledge (MEXT, 2020). This definition encompasses not only academic research but also activities aimed at improving product development and production processes within companies. Many companies establish separate sites for R&D activities, such as laboratories and R&D centers. Regarding real estate requirements for R&D facilities, the Osaka Research Center for Industry and the Economy (2007) has identified three key factors after studying existing research:
1. Land : Availability of land with the necessary size.
2. Internal Factors : Proximity to existing corporate facilities
3. Environmental Factors : Information gathering, accumulation of related industries, and talent acquisition
Considering the current real estate market and trends in R&D, this report expands the definition in “1” beyond land as the “real estate factor” and includes the availability of properties that can serve as prospective R&D facilities sought by companies. This paper investigates the potential of the real estate market specialized for R&D purposes.
Trends in Location of R&D Facilities: from 1960s to 2010s
Figure 1 represents the total number of R&D facilities established in each prefecture in the six decades leading up to 2005. Tokyo and Kanagawa Prefecture stand out with a notably higher number of facilities, followed by the prefectures with major cities in the Kanto region, the Kinki region , and outside these regions.

Kanagawa
Osaka
Ibaraki
Saitama
Hyogo
Prefectures
Chiba
Aichi
Shizuoka
Kyoto
Tochigi
Shiga
Fukuoka
Hiroshima
Tokyo N of Sites
Figure 1: Number of R&D Facilities by Completion Period
Source: Prepared by JLL based on the Osaka Research Center for Industry and the Economy (2007) Of the 47 prefectures, only regions with 30 or more facilities for each period have been extracted.
In general, there were fewer R&D facilities built in the 1970s, and many were established in Tokyo from 2000 onwards. This trend is believed to be influenced by the location dynamics of the manufacturing industry, which has historically served as the core of private sector R&D.
In 1959, the “Factory Location Act” was established, targeting the metropolitan area to control pollution from population concentration and factory operation. Later in 1964, the law was extended to include the Kinki region (National Land Development Council, 2001). This law placed restrictions on the establishments of factories and universities in urban areas, resulting in the relocation of universities to regional areas,
causing changes in the spatial distribution of researchers and students who would be potential candidates to become researchers. The relocation of factories also prompted the relocation of R&D sites that require collaboration with production bases. In the 1980s, the Act for Accelerating Regional Development Based upon High-Technology Industrial Complexes (Technopolis Act, 1983) encourages the transfer of R&D functions to outside urban areas. For example, the establishment of research institutes that focus on nextgeneration materials and biotechnology has increased in Ibaraki Prefecture, where Tsukuba Science City is located (Kamakura 2016: 56). This can be attributed to a period of
economic growth and the emergence of advanced cases of innovation under the “in-house principle” (New Energy and Industrial Technology Development Organization, 2016: 6), which contributed to the growth of R&D facilities during that time. Since the 1990s, factors such as the appreciation of the Japanese yen, globalization, and the impact of industrial hollowing and economic downturn following the bursting of the bubble economy led to the consolidation of production facilities. In particular, in Tokyo and Kanagawa Prefecture, there was a transformation of large-scale factory sites with convenient access to railway stations into commercial facilities, residential housing, and R&D facilities (Kondo, 2017). A substantial increase has been observed particularly in the Tokyo metropolitan area since the 2000s, and the abolition of Act concerning the Industry Restriction in 2002 is considered one of the contributing factors. Kamakura (2012) highlights three characteristics of R&D functions from the 2000s based on multiple case studies of manufacturing companies:
Relocate from Metropolitan Area
1960-1970s
- Factory Location Act
(1959, 1964)、Industrial Relocation Promotion Act
(1972)
- Relocation of manufacturing facilities to outside urban areas
1980s
- Establishment of the “Technopolis Act” (1983)
- Success of companies with in-house R&D
- Increase in R&D centers across Japan
1. Enhance R&D functions with a focus on the proximity of manufacturing and R&D capabilities.
2. Increase customer-oriented R&D facilities.
3. Establish consolidated R&D facilities to create synergy effects.
The first characteristic can be described as a conventional function, but as manufacturing have moved back to urban areas, there has been an increased emphasis on urban sites. The second characteristic, known as the “servitization of manufacturing,” is believed to be motivated by the growing importance of customer research and has led to a trend of relocation to large metropolitan areas. The third characteristic aims to facilitate cross-departmental interaction within companies and leverage the diversity of cities, promoting the relocation near headquarters and surrounding areas. This also includes a trend toward fostering external collaboration to enhance open innovation.
Return to Metropolitan Area
1990s
- Industrial hollowing, economic downturn, land price falling, and IT development
- Consolidation of sites in manufacturing sector and relocating R&D sites for effective use of assets
2000s
- Abolishment of Factory Location Act(2002): manufacturing sites and universities return to urban areas
- Focus on open innovation
- Concentration of companies and R&D sites close to Tokyo
Differences in Optimal Locations Based on the Nature of R&D Activities
Each company conducts unique R&D activities and results in varying optimal strategies for each organization. For example, telecommunication industry sites and manufacturing sites are expected to have different requirements for R&D facilities and talent accumulation location. Even within the same industry, the nature of R&D can differ. Manufacturing predominantly accounts for R&D expenditures in Japan (Figures 3 and 4). Within the manufacturing industry, the electrical machinery
sector has established central laboratories to promote knowledge production for various businesses and products, whereas the automotive sector focuses on specialized R&D in a single business (Yasuda and Maekawa, 2010). In addition, the organizational positioning of R&D institutions can also influence location strategies. For example, companies with crossfunctional R&D capabilities differ in knowledge network structure and location strategy compared to those where R&D functions are department-specific (Kamakura 2016: 78).
Figure 2: Trends in R&D Facility Location
Figure 3:
Source:
Figure 4: Manufacturing Industry Internal Research Expense Breakdown: Top 10 Categories of Expenditures in 2022
Source: JLL designed based on the “Science and Technology Research Survey,” Statistics Bureau, Ministry of Internal Affairs and Communications. Manufacturing Industry Internal Research Expense Breakdown: Top 10 Categories of Expenditures in 2022
Strategies for R&D facilities also differ depending on the areas of research that each company prioritizes. R&D activities can be broadly classified into three categories (Statistics Bureau, Ministry of Internal Affairs and Communications, 2023).
1. Basic Research: does not consider applicability or specific use cases.
2. Applied Research: explores the practical potential of the results obtained from basic research.
3. Developmental Research: focuses on product development.
Environmental Factor: Advantages of Talent, Knowledge, and Cities
This section considers the environmental factors that are vital for the location strategy of R&D centers, specifically the proximity to knowledge and the talent produces it. During the era of closed innovation, it was considered vital to protect the knowledge generated through R&D. In such cases, R&D centers were ideally situated in inconvenient and isolated areas. However, in recent years, there has been a shift towards valuing knowledge sharing over protection, leading to a greater emphasis on urban locations, particularly those that foster collaboration and concentration with researchers, competitors, and related companies.
Knowledge can be shared and reproduced. It is not possible to eliminate the avenues for acquiring knowledge without compensation, leading to the concept of knowledge spillover. Knowledge spillover occurs when knowledge spreads beyond its intended boundaries. It’s important to note that certain types of knowledge can only be transmitted through face-to-face communication in social networks, thus limiting the extent of spillover based on distance (Mizuno, 2020: 30-31). This motivates R&D activities to be conducted in locations where knowledge accumulation is possible. Accumulation facilitates the mutual exchange of external benefits between researchers and companies. Urban areas are often characterized by high concentrations of researchers, research institutions, universities, and a diverse pool of talent and related industries. The presence of such diversity serves as a catalyst for innovation, thus highlighting the importance of urban locations.
In basic research, there is value in close collaboration with academic institutions, while in developmental research, emphasis is placed on proximity to customers and factories. These differences in research are believed to stem from variations in the objectives of product development within companies. It involves a distinction between supplying advanced products that cater to the needs of the new era, following and improving upon competitors’ new products, or stimulating demand by offering innovative products using new technologies (PwC, 2016).
Factors for R&D Facility Location
• Land : Affected by policy and laws in addition to the trend in the commercial real estate market
• Internal : Affected by existing sites and location of business partners
• Environment : Affected by the distribution of source of knowledge such as research institutions, related industries, and researchers
Additional Priority Elements from 2000s
• Proximity of manufacturing and R&D functions (internal factor)
• Customer-oriented (environmental factor)
• Creation of synergies (environmental factor)
Figure 5: Key Points for Chapter 1
Source: JLL designed based on Kamakura (2012) and the Osaka Research Center for Industry and the Economy (2007)

02 Recent Trends in R&D Facility Location
Analysis of R&D Facility Location Trends in 2020s: focusing on region, industry, and motivation
In the previous chapter, we provided an overview of the historical evolution of R&D facility locations and factors influencing location strategies based on past studies. Now, let’s explore the present-day trends in corporate location dynamics.
JLL has compiled data on the establishment or planned launch of R&D centers in Japan, between January 1, 2020, and August 31, 2023, based on disclosed information from 214 companies.1 1
Location: Prefectures with the largest number of sites included Kanagawa (45 facilities, 21%), Tokyo (34 facilities, 16%), Osaka (18 facilities, 8%), Chiba (10 facilities, 5%), and Miyagi (8 facilities, 4%) (Figure 6). For Miyagi Prefecture, it is believed that the active collaboration between Tohoku University and private companies in joint research, as well as the accumulation of related companies and talent in Sendai City due to IT industry attraction policies, had an impact.

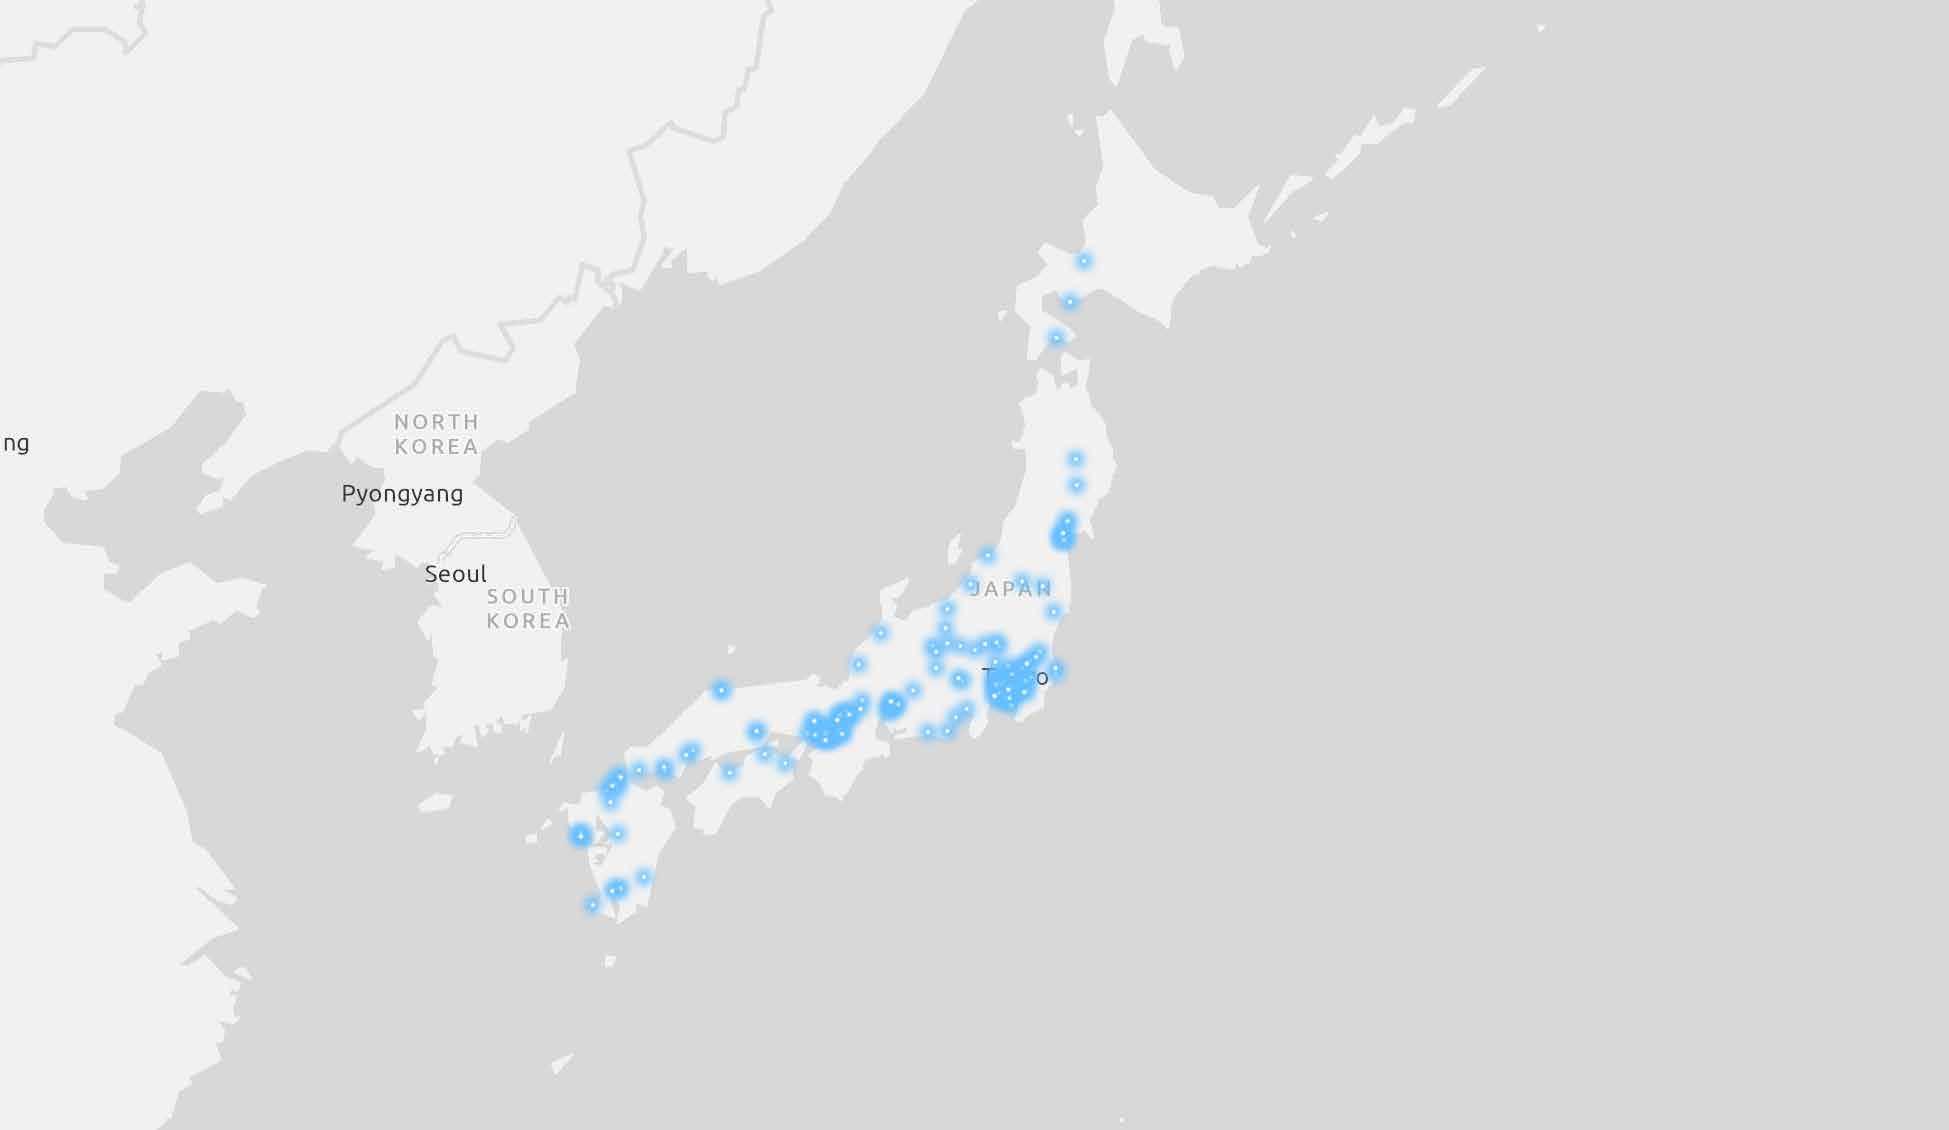

Figure 6: Geographic Distribution of Recently Established R&D Facilities (including planned).
Source: Prepared by JLL based on corporate websites, timely disclosure, and various media reports.

Around Osaka
Around Tokyo
In terms of industry, manufacturing accounted for 132 facilities (62%), followed by wholesale and retail with 24 facilities (11%), academic research, specialist technology services, and telecommunications, each with 17 facilities (8% each) (Figure 7). The prevalence of the manufacturing industry corresponds to the R&D expenditure trends presented in the previous chapter. Based on descriptions provided in press releases and other sources regarding the reasons for establishing the centers, the real estate factors for each case were classified. The categories used were as follows: (1) New: Establishment of new facilities without relocating existing R&D facilities; (2) Expansion: Relocation to scale up operations and expand the size; (3) Consolidation: integration of existing multiple facilities; (4) Renewal: Renewal of aging facilities.2 “New” facilities accounted for 91 cases (42%), followed by 64 (21%) for “Expansion,” 64 (21%) for “Consolidation,” and 9 (4%) for “Renewal.” There were numerous instances where new centers were established in new regions without utilizing existing facilities.
In addition, with cases driven by R&D-related factors, three factors were identified and analyzed.3
1. “Knowledge exchange” encourages the interaction of diverse talents, fostering open innovation.
2. “Improvement in Transportation Access” features proximity to public transportation and convenience.
3. “Talent Acquisition” refers to local employment and student internships.
Knowledge exchange was the driver for 115 cases (54%), followed by public transport access improvement for 21 cases (10%), and talent acquisition for 19 cases (9%) (Figure 7). The majority of R&D facility establishments aimed to increase knowledge exchange.
Number of Facilities Established by Industry, Large Category by Industry
Manufacturing
Wholesale and Retail Trade
Scientific Research, Professional and Technical Services
Information and Communications
Construction
Services, N.E.C.
Other
Motivation
Figure 7: Distribution of Data. The total figure does not match the total of cases, as multiple motivations for establishment can be stated, and only statements in corporate press releases and media reports were counted.
Source: JLL
2 In cases where multiple motivations were involved (e.g., “Consolidation” that falls under “Expansion” in terms of size) each relevant category was counted separately, resulting in potential duplicate counts.
3 Instances where a single center had multiple motivations were counted separately for each relevant category, leading to potential duplicate counts. Any centers without stated reasons for establishment were not included in the count, resulting in a total number of facilities that is less than 214.
Comparison of Real Estate Usage Types: Multi-Tenant and Single-Tenant
In this chapter, we classify the various forms of real estate usage into two categories: (1) “multi-tenant”, where multiple tenants use a single property, and (2) “single-tenant”, where one company occupies a rental building or a property developed and owned by itself and analyze the differences in trends (Figure 8).4
Breaking down the usage types, 146 facilities (68%) were categorized as single-tenant, and 54 facilities (25%) were classified as multi-tenant. Fourteen facilities (7%) could not be categorized, or the usage type could not be identified.
Next, we will examine the geographical distribution trends of the locations. Within the 23 wards of Tokyo, the proportion of establishments that are multi-tenant type reached 22% (12 facilities), whereas for single-tenant facilities it was 8% (12 facilities). The direct distance between the company’s headquarters and the R&D facility, it was observed that multitenant facilities tended to be farther from the headquarters
compared to single-tenant facilities. On average, the distance for multi-tenant type was 351km, while the single-tenant type was 133km. The median distance for multi-tenant properties was 124km and 27km for single-tenant properties.
The real estate factors of each case based on different usage types indicated that within multi-tenant establishments, a higher percentage of establishments were motivated by the “new” facility factor compared to the single-tenant facility. (76% : 25%). Conversely, for single-tenant facilities, there were more instances of establishing locations motivated by “Expansion” (42% : 13%) and “Consolidation” (27% : 9%) compared to multitenant facilities.
Lastly, we will explore the trends in motivations for establishing R&D centers based on different usage types. Cases with the purpose of “Knowledge Exchange” were commonly observed, regardless of real estate usage type. However, multi-tenant facilities showed a higher tendency to have a higher proportion of establishments motivated by both “Knowledge Exchange” and “Talent Acquisition” compared to single-tenant facilities.
Motivation for Establishment by Property Type, by Usage
Multi-Tenant (N=54)
for R&D Facility Establishment by Usage
Figure 8: Distribution of Motivation for Facility Establishment by Real Estate Usage
Fourteen cases were excluded from the analysis due to difficulty in determining the usage. The percentage values were calculated based on the number of facilities for each category (a total of 214 facilities, 146 being single-tenant, and 54 being multi-tenant) as the denominator.
Source: JLL
4 For the percentages presented in this section, the denominator for the breakdown of usage types is N=214. For all other numerical values, the denominator is based on the number of cases for each category, with a total of 214 cases (146 being single-tenant and 54 being
Single Tenant(N=146)
Multi-Tenant (N=54)
Single Tenant(N=146)
(N=214)
Motivation
Recent Trends in R&D Facility Locations: Differences in Strategies Based on Differences in Usage Types
The distribution trends indicate that companies are choosing different types of real estate usage based on their specific company objectives.
Many multi-tenant R&D centers were found to be in regions that were distant from the city centers and corporate headquarters in the Tokyo metropolitan area. There was a noticeable trend towards these centers being motivated by the establishment of new facilities and the acquisition of talent. It appears that many companies choose to establish a presence in new locations to build networks and encourage interaction with fresh talent. Multi-tenant properties offer the advantage of easy aggregation, as multiple research institutions and researchers can operate within the same building. As most multi-tenant facilities are rental units, they are often preferred for establishing bases in areas where land and property acquisition is challenging, but convenience is high. Rental properties also provide flexibility in terms of opening and closing facilities. In some cases, R&D centers were established for a limited time, specifically for joint research projects.
On the other hand, single-tenant R&D centers were found to have many instances motivated by expansion, consolidation, and knowledge exchange. It appears that many companies aim to promote collaboration by modifying the scale and distribution of their existing centers. Having full control over their real estate allows companies to easily tailor R&D facilities to their specific needs. As discussed in the next chapter, while there is a growing trend in rental properties specifically for R&D, the number of available options is relatively limited compared to the office market, particularly in terms of meeting specific size requirements. The limited availability is due to a lack of properties in the rental market that can meet the space requirements for expansion or consolidation by companies with significant R&D operations. Some cases showed examples of developing adjacent sites to existing facilities or expanding within the same site, indicating the continuing relevance of leveraging corporate real estate for effective utilization.
• Having other tenants in the facility make it easier to benefit from concentration
• Flexibility for size and tenancy period, suitable for establishment of new facility
Source: JLL
• Easier to build equipment and floor plan suited to own experiment
• Suited to expansion and consolidation for effective use of existing facilities and enhancing collaboration

Figure 9: Advantages of “multi-tenant” and “single-tenant” R&D facilities
03 Supply and Sub-Markets Overview of Leased R&D Properties
Due to the factors discussed earlier, there is anticipated demand for R&D centers to be located within major metropolitan areas. Furthermore, the evolving trends in R&D methods indicate a specific demand for R&D centers within multi-tenant facilities. In this chapter, we will provide an overview of the leasing markets that hold potential for R&D facilities.
In manufacturing R&D, experiments are frequently conducted and specialized equipment is often used. As a result, R&D activities involving experiments are considered more challenging to carry out remotely. Additionally, there is a higher likelihood of needing facilities with more complex requirements compared to typical office buildings, including considerations such as water supply and drainage. Moreover, there is a need to ensure convenient transportation and functionality for researchers. As a result, leased properties5 that meet the demand of R&D activities tend to be concentrated in the Kanto (Greater Tokyo) and Kinki (Greater Osaka) regions (Figures 10 and 11)6. Historically, they have primarily served as incubation facilities with limited floor areas, contract constraints, and restrictions on the size and activities of accepting companies, focusing on industry-academic collaboration and venture support. Leased facility supply has increased since the 2010s, and more recent properties have fewer occupancy constraints compared to conventional ones. Furthermore, there is an
emerging trend of offering larger properties that can provide floor areas of over 1,000 sqm on a single level, which diversifies the range of choices available in terms of size.
Total Supply by Prefecture
Total Leasable Area of Properties Located in Each Prefecture (sqm)
Kanto ■ Kinki
Source: JLL
5 Properties that have space for tenants to engage in scientific experiments in the exclusive space and R&D activities are indicated as the intended purpose. For example, this includes incubation facilities operated by universities. However, properties primarily focused on leasing to office tenants, even if they mention the possibility of R&D usage in their lease materials, are excluded.
6 Figures for rent and net leasable area mentioned in this chapter include estimated values. All figures for 2023 in this chapter refer to values as of November 30, 2023. The amount excludes taxes.
Figure 10: Net Leasable Area by Prefecture Figures in brackets indicate the number of sample properties in the Prefecture.
Saitama
Net Leasable Area by Municipality
Kawasaki City(��)
Yokohama City(��)
Kobe City(��)
Fujisawa City(�)
Ota City(�)
Kyoto City(�)
Koto City(�)
Soraku-gun Seika cho(�)
Kashiwa City(�)
Ibaraki City(�)
Sagamihara City(�)
Amagasaki City(�)
Settsu City(�)
Tsukuba City(�)
Ikeda City(�)
Minato City, Tokyo(�)
Edogawa City(�)
Sakai City(�)
Chiba City(�)
Wako City(�)
Uji City(�)
Kyotanabe City(�)
Funabashi City(�)
Kusatsu City(�)
Suita City(�)
Otsu City(�)
Kawaguchi City(�)
Nagahama City(�)
Higashi Osaka City(�)
Koganei City(�)
Total Leasable Area of Properties Located in Each Prefecture (sqm)
Figure 11: Net Leasable Area by Municipality
Only regions with a total net leasable area of 1,000 sqm or more are included. Figures in brackets indicate the number of sample properties in the municipality.
Source: JLL

Kanto Region Rental R&D Property Market
As of November 2023, the total rental supply area in the Kanto region (including Tokyo, Kanagawa, Chiba, Saitama, and Ibaraki Prefectures) amounted to 318,000 sqm (56 facilities). There is a significant concentration of these properties in the Tokyo Bay area (Figure 12). Over the period from 2000 to 2023, the supply area in the Kanto region has witnessed an approximate threefold increase (Figure 13).
There are plans to complete three R&D facilities by the end of 2024 in Kawasaki City, Tsukuba City, and Koto City (in Tokyo 23 Special Wards). The combined estimated rental supply area for these three facilities is expected to be 19,000 sqm.
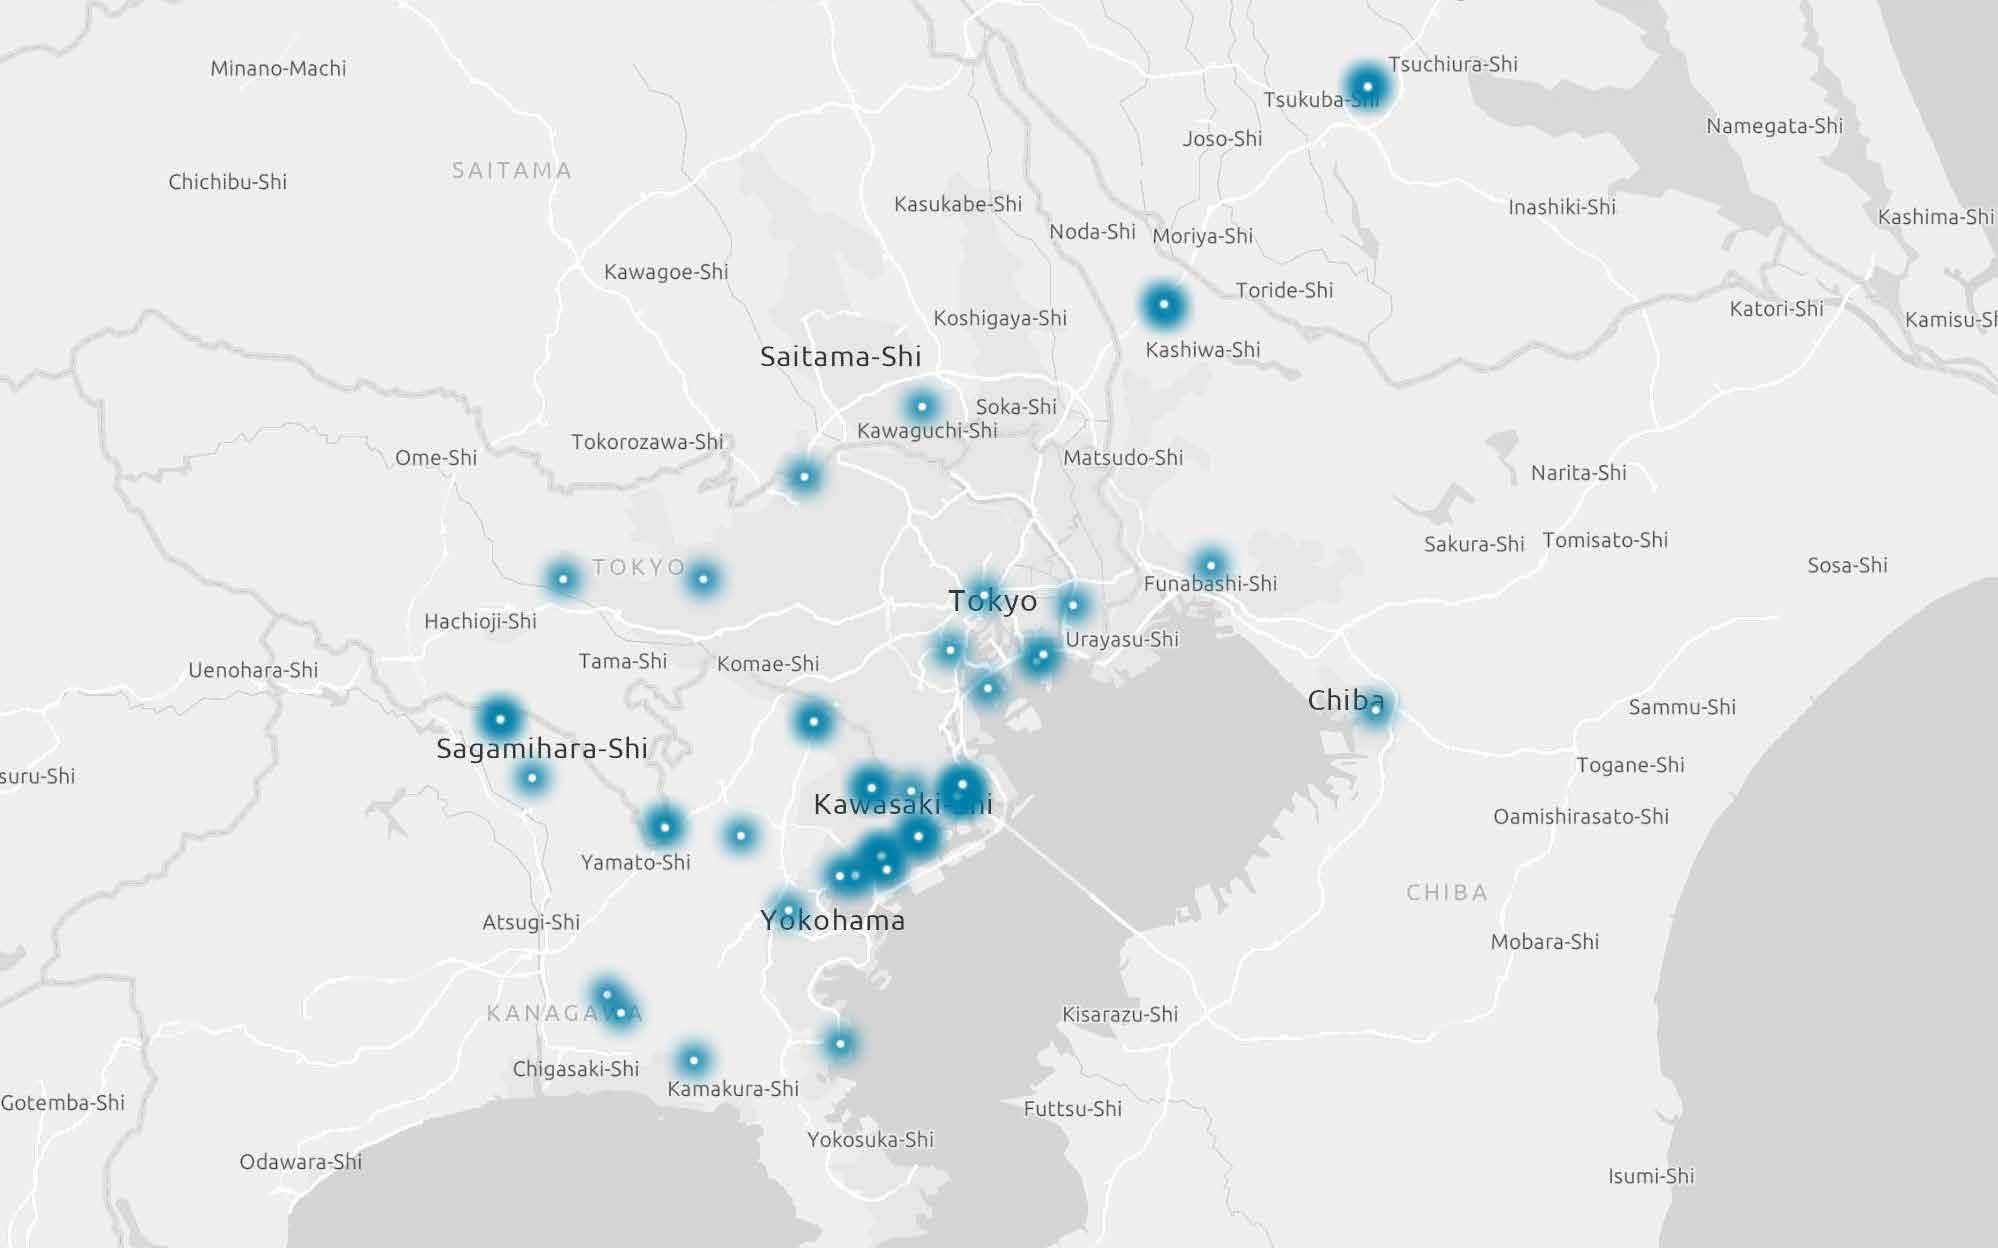
Figure 12: Rental R&D Facilities in the Kanto Region (N=56). Darker colors indicate more facilities. Prepared by JLL using ArcGis Online (scale of 1:800,000).
Supply of Leased R&D Properties (Kanto Region)
Figure 13: Area of Rental R&D Facilities in the Kanto Region Since 2000 Assuming that rental R&D space was supplied in the year of completion.
Source: JLL
Major Sub-Markets in the Kanto Region
Kawasaki City: Known for the concentration of corporate factories, serving as the core of the Keihin Industrial Zone. The “King Skyfront” initiative has facilitated the collaboration between public and private sectors to establish a cluster of R&D facilities for companies. Advantageous features include convenient public transportation access to metropolitan Tokyo and Haneda Airport. Based on the research conducted in November 2023 (the same applies hereafter), the monthly rental prices per square meter (asking rent) ranged from JPY3,500 – 6,655.
Yokohama City: Well-developed system for attracting companies through government initiatives and policies, resulting in multiple instances where companies have relocated their headquarters or established new facilities using subsidies, etc. The Shin-Yokohama Station, a stop for the Shinkansen (bullet train) lines, enhances the region’s transportation connectivity with other cities. It also provides convenient access to the vibrant downtown area that centered around Yokohama Station. As of the research conducted, the monthly rental price per square meter (asking rent) was JPY1,500 – 4,991.
Tokyo 23 Special Wards: The manufacturing industry is concentrated in Ōta City, which also has convenient access to Haneda Airport. Additionally, there is a notable presence of specialized facilities in Koto Ward, focusing on the life sciences and healthcare industries. As of the research conducted, the monthly rental prices per square meter (asking rent) was JPY2,410 – 7,260.

Kinki Region Rental R&D Property Market
As of November 2023, the total rental supply area in the Kinki Region (consisting of Osaka, Kyoto, Hyogo, and Shiga) amounted to 124,000 sqm (43 facilities). There is a noticeable trend of concentration in certain areas of Kobe City and Kyoto City (Figure 14). In Kyoto City, a significant portion of the supply area is attributed to the “Kyoto Research Park,” established in 1989. In Kobe City, the supply area is concentrated in the waterfront area, particularly Port Island, as part of the “Kobe Medical Industry City” initiative aimed at the post-disaster
discovery following the Great Hanshin Awaji Earthquake in 1995. Additionally, the total supply area in the Kinki Region has nearly doubled between 2000 and 2023 (Figure 15).
There is an upcoming rental facility in Osaka City, that is specifically designed for the medical industry, scheduled to be completed in 2024. This facility will include rental spaces for R&D purposes, with an estimated total area of approximately 2,000 sqm.

Figure 14: Rental R&D Facilities in the Kinki Region (N=43). Darker colors indicate more facilities. Prepared by JLL using ArcGIS Online (scale of 1:800,000).
Supply of Leased R&D Properties (Kinki Region)
Figure 15: Area of Rental R&D Facilities in the Kinki Region Since 2000 Assuming that rental R&D space was supplied in the year of completion.
Source: JLL
Major Sub-Markets in the Kinki Region
Kyoto City: Known for its numerous academic research institutions, making it a well-known university town. The Kyoto Research Park has been developed on the site of the former Osaka Gas Kyoto Plant site, supplying rental properties since the 1980s, as well as the provision of incubation facilities and industry-academia collaboration centers by universities. There is an expectation for further development, as the local government has announced the relaxation of building regulations for offices and laboratories in the southern area of JR Kyoto Station. As of the research conducted, the monthly rental price per square meter (asking rent) was JPY2,800 – 6050.
Kobe City: Since 1998, the “Kobe Medical Industry City” initiative has been underway, with a focus on consolidating the medical-related companies in the Port Island area. The area offers accessibility from various transportation hubs such as Shin-Kobe Station, Kobe International Airport, and Kobe Port. As of the research conducted, the monthly rental price per square meter (asking rent) was JPY2,667 – 4,600.
04 Real Estate Specifications Required for R&D Facilities
While the nature of R&D activities can significantly vary among companies and organizations, there is an agreement that the requirements for real estate differ from those for office buildings. Figure 16 illustrates examples of considerations to be aware of during property selection when assuming the establishment of a leased R&D facility engaging in scientific experiments.

Property Specifications
・ Area: Necessary size must be confirmed to ensure effective operation in the experiment room and office space. For example, if a change in the experiment equipment or floor plan is expected due to the change in the size and content of the research project, the flexibility of facility operation will increase with opportunities of partial cancellation or expansion of leased space.
・ Ceiling Height, Floor Height: Most properties have a minimum of 2,700mm ceiling height and 4,400mm floor height. The necessary ceiling and floor height must be understood as it affects the installation and positioning of experiment equipment, comfortable work environment, and effectiveness of ventilation.
・ Floor Load Capacity: Most properties have a floor load of ≧500kg/sqm. This spec affects the installation of experiment equipment. Load dispersion plates may be used in some cases.
・ Other: Seismic performance of facilities must be confirmed from a safety perspective. In addition, a review of floor levelness and the existence of vibration may be necessary.
Experiment Infrastructure
・ Water Supply and Drainage: Many properties allow for installation of water supply and drainage in the exclusive area. If the reagent or effluent contains hazardous chemicals, the wastewater treatment method differs from that for general wastewater. The property’s rules for processing must be confirmed.
・ Ventilation: Many properties allow for installation of local exhaust ventilation (e.g., draft chamber). In addition to the efficiency of the local exhaust ventilation, overall ventilation volume must also be secured to ensure air cleanliness throughout the entire exclusive area.
・ Power: Many properties offer three-phase power supply. The availability for expansion of power supply and emergency power sources must be considered to secure business continuity planning.
・ Other: Availability of air conditioning, number of units and zoning must be confirmed as for general office space relocation. If rooftop space is to be used for equipment, necessary size of rooftop space must be also considered.
Safety and Productivity
・ Hazardous materials: Landlords for some properties state the acceptable biosafety level (BSL). If regulated substances such as high-pressure gas are to be handled, strict safety management will be required at each stage of transportation, storage, disposal, and equipment design to achieve safety.
・ Loading/unloading route: Many properties have elevators for carrying materials. In addition to convenience in replacing laboratory equipment and fixtures, it relates to safety in transporting potentially hazardous waste and hazardous materials.
・ Common facilities: Properties with rental meeting rooms and communication spaces are more likely to foster interaction among researchers. Some properties have operators actively involved in organizing networking events.
・ Other: As with general office buildings, properties that are newer and more convenient in terms of public transport access to and from employee residences, restaurants, business partners, etc. will enhance satisfaction and productivity of employees.
Figure 16: Considerations for R&D Facilities Involving Scientific Experiments
Source: JLL based on Ministry of Education, Culture, Sports, Science and Technology (2010) and interviews with JLL employees, etc.
Facility Specifications: Area, Ceiling and Floor Height, Floor Load Capacity
R&D facilities require two separate zone: one dedicated to experimental activities and another for administrative tasks. It is essential to prioritize efficiency in workflow within these spaces while also considering safety through proper zoning and wellplanned pathways.
According to Yamamoto (2014:144-145), the average research space per researcher in Japanese universities is approximately 20 sqm, which is smaller compared to 50-70 sqm per researcher in U.S. universities. However, the Science Council of Japan (1999) states that for chemical-related research in universities, an estimated area of 1,000 sqm (equivalent to 30-40 sqm per researcher) is required for a department comprising 25-30 individuals. While these numbers provide a general idea of university research environments, a range of 20-40 sqm per researchers can be used as a guideline. This range is slightly larger compared to preliminary research on office workers, which found an average floor area of 11.5 sqm per office worker (Japan Federation of Building Contractors Associations, Tokyo Building Contractors Association, 2020:87).
Additionally, due to the presence of tall and heavy research equipment, it is crucial to consider property specifications such as ceiling and floor height and load capacity for installation.
Experiment Infrastructure: Water Supply and Drainage, Ventilation, Power
It is important to also consider the infrastructure necessary for the operation of experimental facilities, such as water supply and drainage, ventilation, and electricity. The capacity and location of water supply and drainage pipes, duct space for ventilation systems, and electrical capacity may vary depending on the property’s layout and floor. If there is a possibility of upgrading or adding equipment and facilities, it is advisable to assess the potential for expansion in terms of these infrastructure facilities, as well as the facility specifications.
Safety and Productivity: Hazardous, (Un)Loading route, Common facilities
If hazardous materials need to be stored and handled during experiments, it is important to verify whether the prospective property allows for such usage. Even if the property permits them, safety measures must also be implemented during the experiment, transportation, and storage stages. Having dedicated hallways and elevators for handling the materials is desirable for safety reasons. In terms of productivity, properties with well-equipped shared spaces offers added value. Properties that include large conference rooms, communication spaces, cafeterias, etc., can enhance both internal and external communication.
Ensure a Successful Project: Value of Specialists Providing One-Stop Services
These items are listed as examples, and there is additional consideration to be taken into account based on the specific nature of each R&D activity and the circumstances of individual companies. For instance, budgetary constraints and schedule limitations for establishing a site are major factors that need to be addressed. Attractive real estate options for many R&D sites often come with higher rental costs or prices. Furthermore, due to the complexity of construction and relocation processes, higher time cost and larger expenses are likely to be required compared with office relocations.

To ensure the success of difficult projects, it is critical to establish smooth communication with not only internal stakeholders, including researchers and company personnel, but also external parties in each relocation process such as equipment manufacturers, interior construction companies, moving companies, and real estate agents. As the number of considerations and stakeholders increases, the burden on the assigned personnel also grows. Therefore, in larger-scale projects especially, partnering with external specialists who can offer a comprehensive range of services can greatly contribute to streamlining the project and enhancing its efficiency.
References
• Akio Kondo (2017), 産業立地と都市再開発からみた東京の変貌 [The Transformation of Tokyo from the Perspective of Industrial Location and Urban Redevelopment], Annual Review of Economic Geography, Vol. 63, No. 4, 304-319, https://doi.org/10.20592/ jaeg.63.4_304
• Hitoshi Yamamoto (2014), 安全で快適な実験室のデザイン ─ フレキシビリティ、室内気流そして耐震性を統合して考える─ [Designing Safe and Comfortable Laboratories - Integrating Flexibility, Indoor Airflow, and Earthquake Resistance], Environment and Safety, Vol. 5, No. 3, 143-147, https://doi.org/10.11162/daikankyo.14C0902
• Japan Federation of Building Contractors Associations and Tokyo Building Contractors Association (2020), ビル実態調査のまとめ 令和2年度[Summary of Building Fact-Finding Survey FY2020], Japan Federation of Building Contractors Associations and Tokyo Building Contractors Association, CD-ROM version.
• Masahiko Mizuno (2020), 企業はなぜ東京に集中するのか―経済地理学の視点から [Why Do Companies Concentrate in Tokyo: From the Viewpoint of Economic Geography], Japan Journal of Labor Studies, No. 718, 29-39, https://www.jil.go.jp/institute/zassi/ backnumber/2020/05/pdf/029-039.pdf *Viewed on September 26, 2023
• Masashi Yasuda and Keiichi Maekawa (2010), 電機メーカにおける研究開発戦略の変遷事例 : 企業内研究所の存在意義を考える[A Case Study of the Transition of R&D Strategy in an Electrical Manufacturer: Considering the Significance of In-house Research Laboratories], Proceedings of the 84th Annual Meeting of the Japan Society of Business Administration, Miyagi, 2010-09-02/05, http://hdl.handle.net/2433/130685 *Viewed on September 25, 2023
• Ministry of Education, Culture, Sports, Science, and Technology (2010), 実験施設の整備等における安全衛生対策の留意点について [Points to keep in mind regarding safety and health measures in the development of experimental facilities],https://www.mext.go.jp/ component/a_menu/education/detail/__icsFiles/afieldfile/2010/04/27/1292181_1.pdf *Viewed on November 8, 2023
• Ministry of Education, Culture, Sports, Science and Technology(MEXT) (2020) “MEXT: Indicators of Science and Technology 2019 Note to users”, https://www.mext.go.jp/en/content/20200728-mxt_kouhou02-000009058_01.pdf *Viewed on July 29, 2024
• National Land Council, Second Metropolitan Area Development Subcommittee (2001), 工業等制限制度をとりまく現状と課題について [The Current Situation and Issues Surrounding the Industrial Restriction System], “https://www.mlit.go.jp/singikai/kokudosin/shuto/2/ images/shiryou4.pdf *Viewed on November 13, 2023
• Natsuki Kamakura (2012), 首都圏近郊における大規模工場の機能変化——東海道線沿線の事例—— [Functional Change of Large Factories in the Suburbs of the Tokyo Metropolitan Area: A Case Study along the Tokaido Line], Geographical Review, Vol. 85, No. 2, 138-156, The Association of Japanese Geographers https://doi.org/10.4157/grj.85.138
• Natsuki Kamakura (2016), 日系化学企業における研究開発機能の空間的分業と知識フローに関する地理学的研究[A Geographical Study on the Spatial Division of Labor and Knowledge Flow of R&D Functions in Japanese Chemical Firms], Doctoral dissertation, Graduate School of Arts and Sciences, University of Tokyo, AY2015 https://doi.org/10.15083/00073258 *Viewed on September 25, 2023
• New Energy and Industrial Technology Development Organization (2016), オープンイノベーション白書 第三版 [Open Innovation White Paper, Third Edition], https://www.nedo.go.jp/content/100918466.pdf *Viewed on November 13, 2023
• Osaka Industry and Economy Research Center (2007), 平成18年度調査研究 企業における研究機関の設置状況に関する調査 [2006 Survey Research on the Establishment of Research Institutes in Companies], Osaka Prefectural Government, March 2007. https://www.pref.osaka.lg.jp/attach/1949/00051733/06-labo_all.pdf *Viewed on September 26, 2023
• PwC (2016) イノベーションの新たな世界秩序 Strategy& 第11回グローバル·イノベーション1000 [The New World Order of Innovation Strategy & 11th Global Innovation 1000], https://www.strategyand.pwc.com/jp/ja/publications/innovations-new-world-order-jp.pdf *Viewed on September 25, 2023
• Science Council of Japan, Standing Committee IV (1999), 第4常置委員会報告 我が国の大学等における研究環境の改善について(最 終報告)[Report of Standing Committee IV: Improvement of Research Environment in Japanese Universities (Final Report)], Science Council of Japan, 394-503,https://www.scj.go.jp/ja/info/kohyo/17youshi/1712.html *Viewed on November 9, 2023
• tatistics Bureau of the Ministry of Internal Affairs and Communications, 統計局ホームページ/令和5年科学技術研究調査 用語の解説 [Statistics Bureau Website/Science and Technology Research Survey 2023: Glossary of Terms], https://www.stat.go.jp/data/kagaku/ kekka/a3_25you.html *Viewed on September 25, 2023
Research author
Yuki Matsumoto Manager, Research yuki.matsumoto@jll.com
Jones Lang LaSalle K.K.
Tokyo Headquarters
Kioi Tower, Tokyo Garden Terrace Kioicho, 1-3 Kioi-cho Chiyoda-ku, Tokyo 102-0094
+81 3 4361 1800
Osaka Nippon Life Yodoyabashi Building, 3-5-29 Kitahama Chuo-ku, Osaka-shi, Osaka 541-0041
+81 6 7662 8400
Research at JLL
JLL’s research team delivers intelligence, analysis and insight through marketleading reports and services that illuminate today’s commercial real estate dynamics and identify tomorrow’s challenges and opportunities. Our more than 550 global research professionals track and analyze economic and property trends and forecast future conditions in over 60 countries, producing unrivalled local and global perspectives. Our research and expertise, fueled by real-time information and innovative thinking around the world, creates a competitive advantage for our clients and drives successful strategies and optimal real estate decisions.
Fukuoka Daihakata Bldg. 2-20-1 Hakata-ekimae, Hakata-ku, Fukuoka-shi, Fukuoka 812-0011
+81 92 233 6801
Nagoya
21F JP Tower Nagoya, 1-1-1 Meieki, Nakamura-ku, Nagoya-shi, Aichi 450-6321
+81 52 856 3357
About JLL
For over 200 years, JLL (NYSE: JLL), a leading global commercial real estate and investment management company, has helped clients buy, build, occupy, manage and invest in a variety of commercial, industrial, hotel, residential and retail properties. A Fortune 500® company with annual revenue of $20.8 billion and operations in over 80 countries around the world, our more than 108,000 employees bring the power of a global platform combined with local expertise. Driven by our purpose to shape the future of real estate for a better world, we help our clients, people and communities SEE A BRIGHTER WAYSM. JLL is the brand name, and a registered trademark, of Jones Lang LaSalle Incorporated. For further information, visit jll.com.
*Acknowledgements: I would like to thank Yosuke Terade for the grateful graphic design of this paper, and Kiyoko Harris and Kokoro Tanigawa for collaboration on the translation process into English.
This report has been prepared solely for information purposes and does not necessarily purport to be a complete analysis of the topics discussed, which are inherently unpredictable. It has been based on sources we believe to be reliable, but we have not independently verified those sources and we do not guarantee that the information in the report is accurate or complete. Any views expressed in the report reflect our judgment at this date and are subject to change without notice. Statements that are forward-looking involve known and unknown risks and uncertainties that may cause future realities to be materially different from those implied by such forward-looking statements. Advice we give to clients in particular situations may differ from the views expressed in this report. No investment or other business decisions should be made based solely on the views expressed in this report.
Copyright © Jones Lang Lasalle IP, Inc. 2024