
H 1 2 0 2 3
MOUNTAIN TOWN MARKET REPORT
Aspen Breckenridge
Vail Telluride
Steamboat Springs
North Lake Tahoe
South Lake Tahoe
Jackson Hole
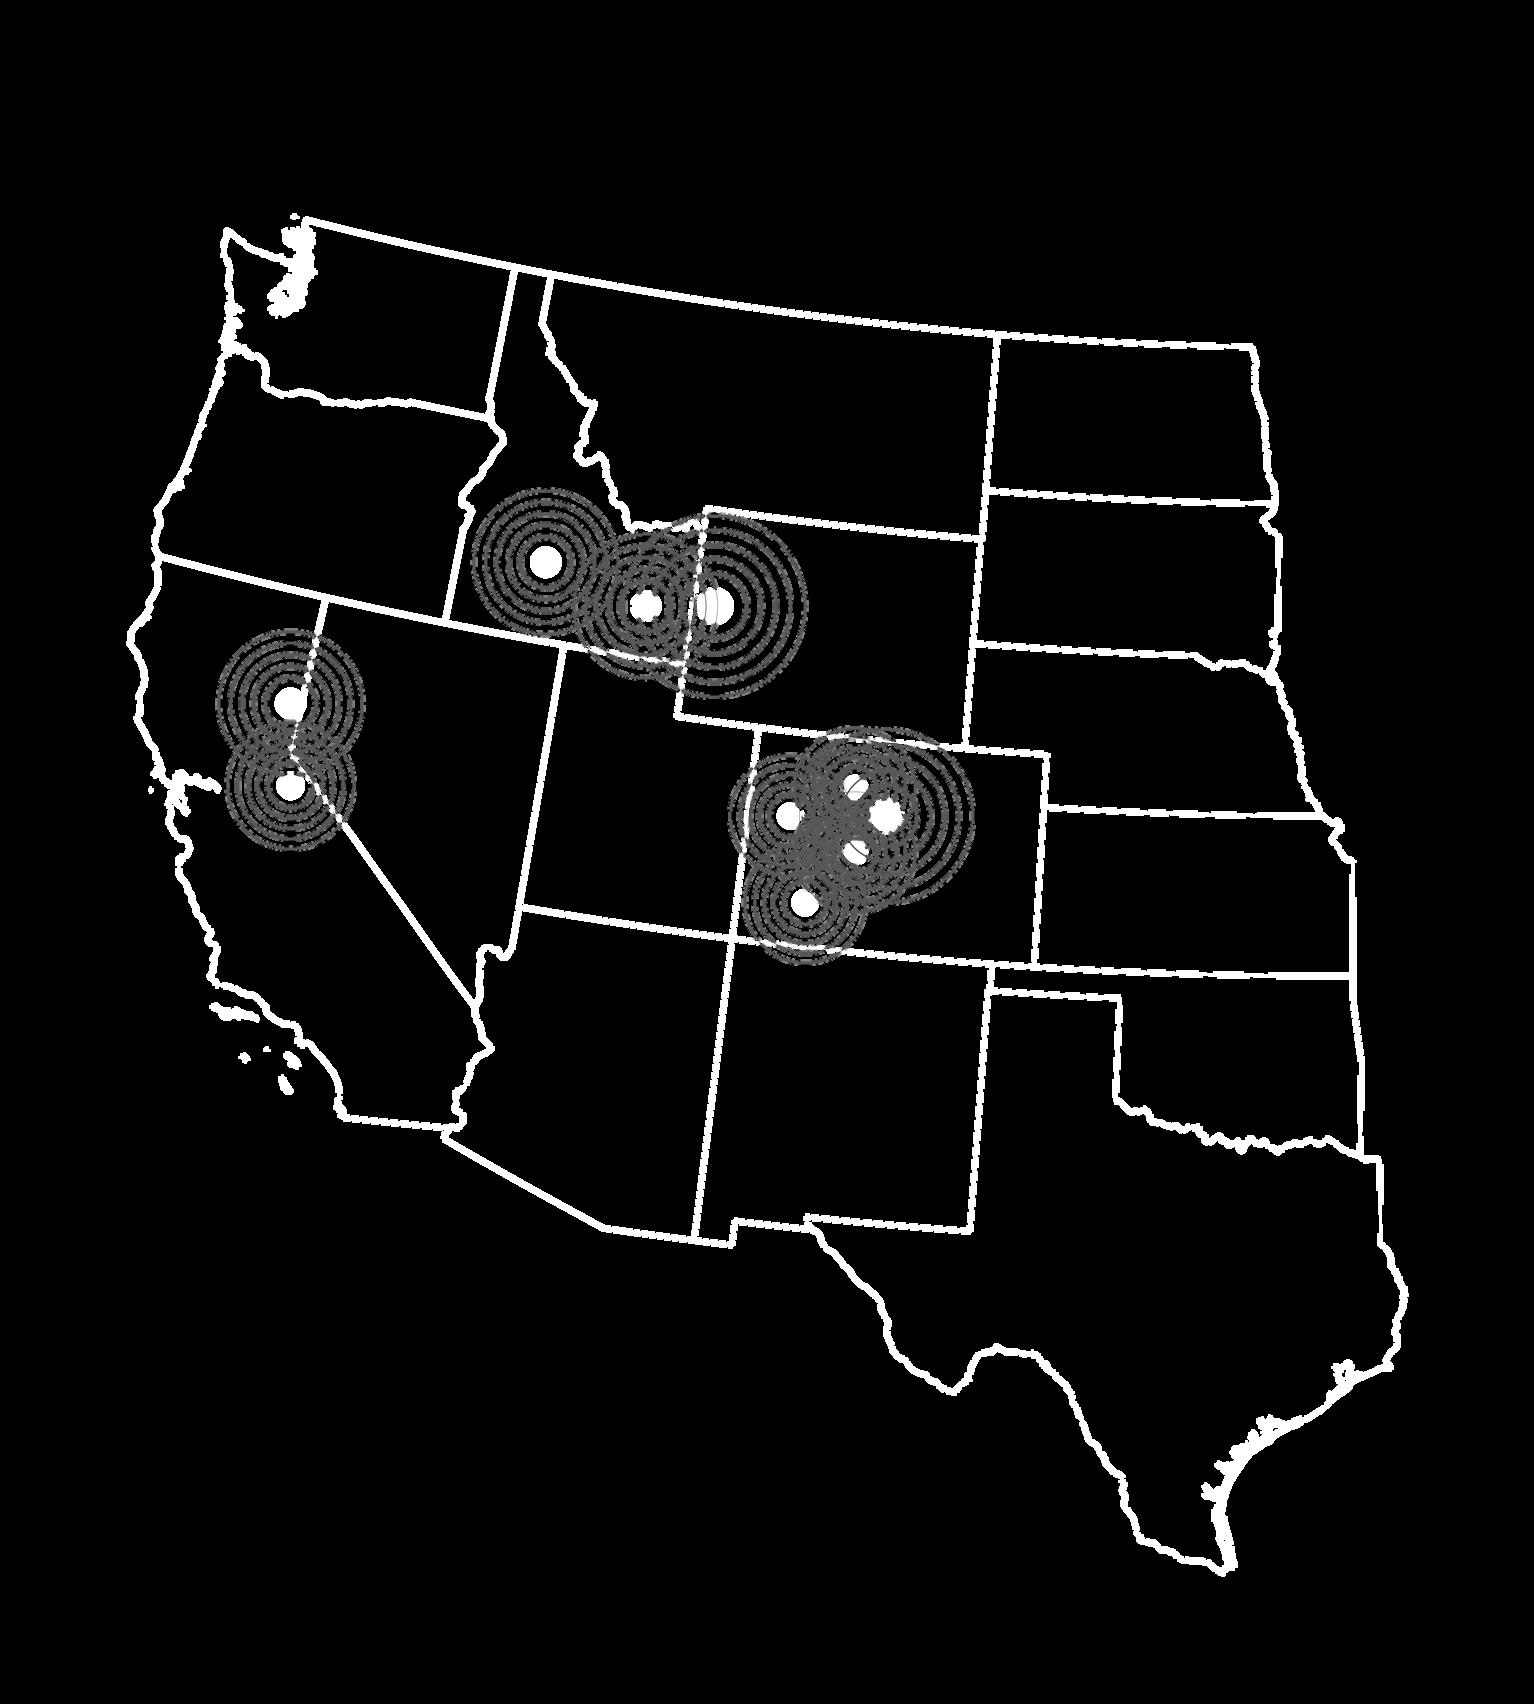
Sun Valley
Teton Valley
Living in a resort community presents a distinctive and enticing way of life, offering breathtaking scenic views, endless recreational opportunities, and an unparalleled sense of community The real estate market in resort communities differs significantly from most markets across the country To assist consumers who are interested in buying, selling, or simply curious about how these markets compare, we have compiled the Mountain Town Market Report. This valuable resource gathers real estate statistics from various resort towns across the Mountain West region. The report thoroughly examines market data for notable locations in Colorado, California, Nevada, Idaho and Wyoming
While all the featured markets in this report offer similar lifestyle benefits, each community and its respective real estate market is unique Factors such as seasonality, location, inventory, and various other elements influence the real estate market in these communities, driving the continuous growth of the resort luxury home market.
Having a solid understanding of the market is crucial for real estate success, whether you are a buyer or a seller The Mountain Town Market Report serves as a valuable resource for making informed decisions As you explore the following pages and delve into the details of these remarkable mountain town communities, we encourage you to consider the data and seek guidance from your Compass real estate expert.
Compass, the leading brokerage in the country, is committed to providing unparalleled service, both in your hometown and in your ski town
3
$2,186,905 $4,530,433 $4,548,567

COLORADO
ACTIVE NEW SOLD AVERAGE SOLD PRICE DAYS ON MARKET H1 2023 H1 2022 % CHANGE H1 2019 132 116 13.8% 223 102 75 209 80 37 97 68 -17.5% -45.6% 0.4% 41.1% 95 134
Source: AGSMLS: Aspen, Brush Creek Village, Old Snowmass, Woody Creek, data from 1/1/23 - 6/30/23 compared to 1/1/22 - 6/30/22 and 1/1/19 - 6/30/19
ASPEN ATTACHED HOMES
DETACHED HOMES
$15,566,198 $12,253,508
ACTIVE NEW SOLD AVERAGE SOLD PRICE DAYS ON MARKET H1 2023 H1 2022 % CHANGE H1 2019 190 159 19.5% 305 105 57 346 104 55 101 60 3.0% -8.3% -21.3% -28.7% 202 144 $6,529,435
5
COLORADO BRECKENRIDGE ATTACHED HOMES NEW SOLD AVERAGE SOLD PRICE DAYS ON MARKET H1 2023 H1 2022 % CHANGE H1 2019 592 747 -20.7% 893 484 $591,010 367 $956,675 447 $950,093 -17.9% 0.7% 206.3% 51 16 49 SAR MLS: Summit County, data from 1/1/23 - 6/30/23 compared to 1/1/22 - 6/30/22 and 1/1/19 - 6/30/19
DETACHED
NEW SOLD AVERAGE SOLD PRICE DAYS ON MARKET H1 2023 H1 2022 % CHANGE H1 2019 251 347 -27.7% 378 192 $1,420,360 151 $1,962,937 194 $2,302,425 -22.2% -14.7% 87.8% 122 41 77 SAR MLS: Summit County data from 1/1/23 - 6/30/23 compared to 1/1/22 - 6/30/22 and 1/1/19 - 6/30/19 7 3
HOMES
$1,039,308 $1,969,321 $2,291,090

COLORADO
ACTIVE NEW SOLD AVERAGE SOLD PRICE DAYS ON MARKET H1 2023 H1 2022 % CHANGE H1 2019 125 148 -15.5% 273 111 81 190 73 61 106 98 -31.1% -37.8% 16.3% 40.2% 92 129
Source: TELMLS: Telluride, Mountain Village data from 1/1/23 - 6/30/23 compared to 1/1/22 - 6/30/22 and 1/1/19 - 6/30/19
TELLURIDE ATTACHED HOMES
HOMES
$4,851,738 $6,154,925
ACTIVE NEW SOLD AVERAGE SOLD PRICE DAYS ON MARKET H1 2023 H1 2022 % CHANGE H1 2019 112 103 8.7% 194 67 22 328 56 30 67 50 -16.4% -40.0% 26.9% 9.7% 155 170 $2,047,681
9
DETACHED
STEAMBOAT SPRINGS

COLORADO
ATTACHED HOMES NEW SOLD AVERAGE SOLD PRICE DAYS ON MARKET H1 2023 H1 2022 % CHANGE H1 2019 148 241 -38.6% 329 213 $517,917 142 $1,004,507 201 $1,162,759 -29.4% -13.6% 180.0% 80 20 56 Source: REcolorado: Steamboat Springs data from 1/1/23 - 6/30/23 compared to 1/1/22 - 6/30/22 and 1/1/19 - 6/30/19
DETACHED HOMES
NEW SOLD AVERAGE SOLD PRICE DAYS ON MARKET H1 2023 H1 2022 % CHANGE H1 2019 91 134 -32.1% 181 103 $1,259,337 54 $2,311,480 103 $2,307,506 -47.6% 0.2% 44.6% 123 56 11 81
$1,250,345 $2,043,390 $2,460,056

COLORADO
ACTIVE NEW SOLD AVERAGE SOLD PRICE DAYS ON MARKET H1 2023 H1 2022 % CHANGE H1 2019 505 657 -23.1% 934 500 327 150 333 215 557 366 -40.2% -41.3% 20.4% 117.2% 29 63
Source: VBRMLS: Vail Eagle-Vail Beaver Creek Avon Edwards data from 1/1/23 - 6/30/23 compared to 1/1/22 - 6/30/22 and 1/1/19 - 6/30/19 VAIL VALLEY
ATTACHED HOMES
ACTIVE NEW SOLD AVERAGE SOLD PRICE DAYS ON MARKET H1 2023 H1 2022 % CHANGE H1 2019 151 159 -5.0% 353 140 85 267 85 51 121 74 -29.8% -31.1% -18.9% 5.5% 91 96 $2,999,202 $5,407,695
13
DETACHED HOMES
$4,385,584

CALIFORNIA & NEVADA
HOMES ACTIVE SOLD AVERAGE SOLD PRICE DAYS ON MARKET H1 2023 H1 2022 % CHANGE H1 2019 177 -7.8% 255 148 $552,118 $1,009,521 147 $938,219 -17.7% 7.6% 55.6% 84 27 42 Source: Tahoe Sierra MLS data from 1/1/23 - 6/30/23 compared to 1/1/22 - 6/30/22 and 1/1/19 - 6/30/19 121 192
NORTH LAKE TAHOE ATTACHED
DETACHED HOMES
ACTIVE SOLD AVERAGE SOLD PRICE DAYS ON MARKET H1 2023 H1 2022 % CHANGE H1 2019 429 -33.2% 702 383 $1,232,881 $1,819,413 428 $2,116,341 -42.3% -14.0% 107.1% 81 28 58 642 247 15

CALIFORNIA
ACTIVE SOLD AVERAGE SOLD PRICE DAYS ON MARKET H1 2023 H1 2022 % CHANGE H1 2019 81 114 -28.9% 89 62 $449,256 51 $764,794 85 $678,884 -40.0% 12.7% -2.4% 113 85 83 Source: STMLS South Tahoe Multiple Listing Service data from 1/1/23 - 6/30/23 compared to 1/1/22 - 6/30/22 and 1/1/19 - 6/30/19
SOUTH LAKE TAHOE ATTACHED HOMES
DETACHED HOMES
ACTIVE SOLD AVERAGE SOLD PRICE DAYS ON MARKET H1 2023 H1 2022 % CHANGE H1 2019 320 455 -29.7% 300 254 $614,929 252 $864,623 405 $962,868 -37.8% -10.2% 18.6% 111 59 70 17

IDAHO
HOMES ACTIVE NEW SOLD AVERAGE SOLD PRICE H1 2023 H1 2022 % CHANGE H1 2019 198 -11.6% 196 217 147 90 187 131 -26.7% -31.3% -31.3% $467,656 $1,065,932 $732,074 DAYS ON MARKET 137 63 224 66 -4.5% 137 Source: SVMLS Single Family Condo Townhome Jan - June 23 vs 22
SUN VALLEY ATTACHED
DETACHED HOMES
ACTIVE NEW SOLD AVERAGE SOLD PRICE H1 2023 H1 2022 % CHANGE H1 2019 295 -8.1% 630 346 155 95 231 139 -21.6% -31.7% -23.7 $857,741 $2,148,703 $1,638,464 181 125 321 168 -25.6% 220 19
TETON VALLEY
-43.4% $161,466 $442,361 $250,359

IDAHO
DAYS ON MARKET 163 156 4.5% 146 ATTACHED HOMES ACTIVE NEW SOLD AVERAGE SOLD PRICE H1 2023 H1 2022 % CHANGE H1 2019 77 77 0.0% 85 50 38 68 24 47 65 44.7% 63.1%
TBOR Single Family Condo Townhome Jan - June ‘23 vs ‘22 and 2019
DAYS ON MARKET 103 82 25.6% 322
ACTIVE NEW SOLD AVERAGE SOLD PRICE H1 2023 H1 2022 % CHANGE H1 2019 217 251 -13.5% 628 373 194 135 78 197 100 -31.5% -22.0% 18.2% $450,806
21
DETACHED HOMES
$1,392,620 $1,646,404
JACKSON HOLE
$1,437,251 $1,526,064

WYOMING
DAYS ON MARKET 64 107 107 128 -16.4% 156 Source: TBOR Single Family Condo Townhome Jan - June 23 vs 22 and 2019 ATTACHED HOMES ACTIVE NEW SOLD AVERAGE SOLD PRICE H1 2023 H1 2022 % CHANGE H1 2019 99 -7.5% 163 117 85 39 84 42 -23.8% -7.1% 6.2%
$778,658
DETACHED HOMES
ACTIVE NEW SOLD AVERAGE SOLD PRICE H1 2023 H1 2022 % CHANGE H1 2019 213 14.5% 309 179 86 58 130 69 -6.9% -15.9% 24.0% $3,042,464 $3,969,127 $4,920,638 DAYS ON MARKET 121 165 186 212.6 -22.4% 304 23
ALL STATS
ATTACHED HOMES

H1 2023 ACTIVE NEW SOLD AVERAGE SOLD PRICE DAYS ON MARKET ASPEN BRECKENRIDGE TELLURIDE STEAMBOAT SPRINGS VAIL VALLEY 132 80 592 73 125 148 333 215 505 37 367 61 142 $4,548,567 $956,675 $2,291,090 $1,004,507 $2,460,056 134 49 129 56 63 42 83 $1,009,521 $764,794 51 121 177 81-198 77 68 137 90 24 $732,074 $250,359 63 163 107 $1,526,064 39 64 99 NORTH LAKE TAHOE SOUTH LAKE TAHOE SUN VALLEY TETON VALLEY JACKSON HOLE COLORADO CALIFORNIA / NEVADA IDAHO WYOMING
295 217 135 181 95 78 $1,638,464 $1,646,404 125 103 165 $4,920,638 58 121 213 SUN VALLEY TETON VALLEY JACKSON HOLE IDAHO WYOMING 25
Borum eosaped quiae conestrunt fugitaspedis atem Poreptiatur, nossequis adipienim in nuscimo sapellaut evelibus ipidus maximagnim volecae venimpor a sae poriae et velis re nam, sus alitatu reperibusdae nis secatus eiurit, quamus et fugit, se di ate nis di que voluptatat optiamet, cus aliqui odi il idus si res expliqui quiaeceror saperep elitet vero voluptat
Fici omnientio et et laborum landis pro volupta volorio restia ad quodis simus et aut aperitatiis re sum voluptatur? Quidelis magnatiume con non experer ruptiunditas doluptas vellit rende parciatio. Itaturis sit alicide nihicatum dollit a voloritia nonsequundi sanditaque lant et harchit aut quis es explacepe voles eaquae velit enimilique nos et aborrum fuga. Itat quistem quae sapit.
AGENT/TEAM NAME
Compass is a l censed real estate broker and abides by Equa Housing Opportunity laws Al materia presented herein is intended for informational purposes on y Information s comp led from sources deemed re iab e but is subject to errors omiss ons changes in pr ce condit on sale or withdrawal without notice This is not intended to so icit property already isted Photos may be virtua ly staged or d gitally enhanced and may not reflect actual property condit ons
M: 000.000.0000 ∙ AGENTNAME@COMPASS.COM ∙ WEBSITE.COM
