International Research Journal of Engineering and Technology (IRJET) e-ISSN: 2395-0056

Volume: 09 Issue: 09 | Sep 2022 www.irjet.net p-ISSN: 2395-0072
“HYDRAULIC AND HYDROLOGICAL IMPACT ON BRIDGE”
Priyanka R. Ingole1 , Dr. Sachin.S.Saraf2 , Dr. Prof. Ashish Bijwe31 PG Scholar ,Department of Civil Engineering , DRGIT&R , Amravati, Maharashtra, India
2 Professor, Department of Civil Engineering , P.R. Pote Patil College of Engineering and Management, Amravati, Maharashtra, India
3Assistance Professor, Department of Civil Engineering , DRGIT&R Amravati, Maharashtra, India ***
Abstract - This study discusses hydrologic and hydraulic bridge/culvert studies to estimate the 100-year water surface elevation at a given project site. Bridges (and sometimes very large culverts) are very expensive hydraulic structures that typically have a design life of 100 years. Most of the bridges are collapsing due to overflowing flood water. In Pakistan, this important study is usually neglected, resulting in bridges collapsing before the design deadline. In the present scenario, no one can deny the importance of this study, especially after the destruction of bridges due to the recent flood (July 2010) in Pakistan. This study focuses on various hydrologic and hydraulic procedures to calculate the 100-year flood discharge at the Long Branch culvert site located under Guinea Road in Virginia, USA. To do this, we used Anderson's method to estimate the discounts for different payback periods. The bridge engineer can then correct the road level for the culvert by taking into account the corresponding freeboard value. Such a structure will not block a flood with a periodicity of 100 years
Key Words: Hyrologicalmodeling,hydraulicbridge,bridge
1. INTRODUCTION
Bridgesareveryexpensivestructures.Millionsofrupeesare spentonbridgesinPakistan,butmostofthemwillnotlast much longer because either hydrological and hydraulic studiesarenotdoneatallorevenifthestudyisdone,itis notdoneproperly.Therefore,thefreeboardprovidedisnot sufficient to calculate the floods of different period. Therefore,thebridgeoverturnsandthestructuralintegrity ofthebridgeiscompromised.Ahydrologicalandhydraulic studyshouldbedoneforthebridge/culvertandthenapply allthefindingsfromthestudytoarealworldscenario.The project involves carrying out hydrological and hydrotechnical studies of bridges and culverts. Different hydrological and hydraulic procedures are used to determinethewatersurfaceelevationforfloodsofdifferent recurrence periods at the site of a bridge or culvert. The studyensuresthatthestructurewillnotcollapseduringits entireservicelifeandwillremainintactandsecureduring itsuse.Eachbridgemustbedesignedtoensurethata100yearfloodwillpasswithoutcompromisingtheintegrityof the structure. In most cases, bridges collapse due to overflowing flood water. Therefore, bridges must be designed to allow enough space for floodwaters to pass safelywithoutoverturningthebridge.
2. STUDY AREA
2.1 BRIDGE INFORMATION
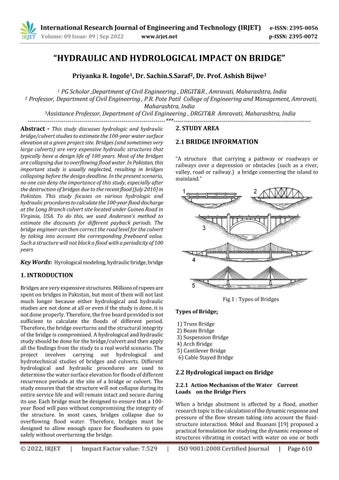
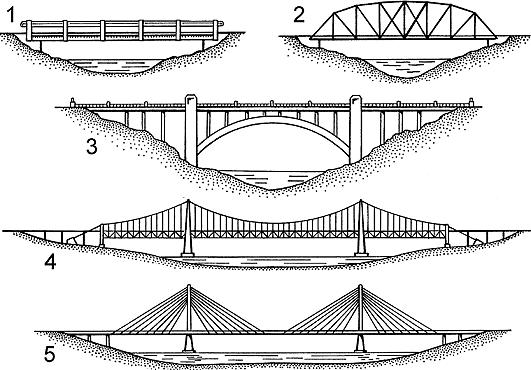
“A structure that carrying a pathway or roadways or railways over a depression or obstacles (such as a river, valley,roadorrailway.) a bridgeconnectingtheisland to mainland.” Fig
When a bridge abutment is affected by a flood, another researchtopicisthecalculationofthedynamicresponseand pressure of the flow stream taking into account the fluidstructure interaction. Mikel and Buanani [19] proposed a practicalformulationforstudyingthedynamicresponseof structures vibrating in contact with water on one or both
International Research Journal of Engineering and Technology (IRJET) e-ISSN: 2395-0056
Volume: 09 Issue: 09 | Sep 2022 www.irjet.net p-ISSN: 2395-0072
sides,anddevelopedsimplifiedproceduresforthepractical evaluation of vibration periods, hydrodynamic loads, and structure-waterseismicresponse.systemsincludinghigher mode effects. However, relatively few systematic studies consideringtheeffectofimpact,particularlyfluid-structure interaction,havebeenconductedonpierswithwaterflow pressure.
When a flood impacts a bridge abutment, the abutment impactprocesscausedbytheflowcanbedividedintotwo parts:themomentoffloodimpactonthebridgeabutment and the movement of water flowing around the abutment afterthemomentofimpact.
2.2.2 Influence of Fluid –Structure on the Dynamic Water Pressure after the Moment Impact
Tofurtherinvestigatetheeffectoffluid-structureinteraction onthewaterflowpressureappliedtothebridgeabutment whenthefloodactsontheabutmentinasteadystate,the maximumdisplacementatthetop ofthebridgeabutment and the maximum stress at the bottom of the bridge abutmentareconsideredasinvestigationvolumes.variation ofthefluid-structureinteractioneffectcoefficient(F-Sc)asa functionofflowvelocity,whereF-Scisdefinedastheratioof the numerical response of the bridge abutment under the pressure of flowing water to bridge abutment responses underwaterpressureexcludingtheeffectoffluid-structure coupling.
3. DATA COLLECTION
Sr No AtDefinedc/s( 130mu/s) At Existingc/s
1 Catchmentarea 1.74 Curas mail
2 HydralurGradent 1.223.73 3 H.F.LTalledatside 98.250 97.670 4 L.B.L@Site 96.220 95.815 5 ProposedRTL 99.205 98.685 6 Bedwidth@Site 10.00m 12.00m 7 Bankwidth@Site 15.00m 28.00m 8 Foundation Open Open 9 %obstructionat H.F.L 28.65%10 %obstructionat 0.FL 16.35%11 Requiredwater wayatH.F.L 13.06m12 Waterway Provided 14.00m13 Angleofsite 30*14 Proposal 7.00m che2 gale
3.1 General Data
Name of Work :- Construction of Minor Bridge in Km 7/700OnNandgaon Kh. Mokhad Savner Mhasala Dadapur to TahashilBoundryM.D.R75 Necessity:-AtPresentthereisaH.Pculverthaving3rowsof 900mmdiaC.CPipeat This crossing This H.P Culvert is located in Ch. 7/721 havingvery Insufficient wasterway causing damages to structure.Hencehighlevel Crossingbridgeisnecessary. SelectionofSite:-Actuallythenallameetstoroadcrossing atCh.7/625.Thenitflows parallel to roaduptoCh. 7/721 on U/Sside causingheavydamagesto exising B.T road to overcome this problem newbridgesiteisproposedin Ch.7/625wherenallacrossingtheroadwith skewangle30degree
Alsoaslabculverthaving2.0mclearspanis proposedatexisting Crossing to flow out water from road side gutterandwaterfromvillage Hydraulics :- Hydraulicdetailsareseparatelyattached.High levelminorbridgeclearing theH.F.Lwithaprovisionofaffiuxandnominal clearance.
Proposal:- Spanarrangement - High level submersible Minor bridge 2 Spans of 7.00 M. C/C TypeOf Foundation- OpenFoundation
3.2 HYDRAULIC DATA
O.F.L ( observed ) 97.250 96.670M 6 H.F.L ( Designed & Tallied with English) 98.250 97.670M
H.F.L ( Observed ) 98.250 97.670M 7 Hydraulic gradient 1 in 223.73 0.00447
International Research Journal of Engineering and Technology (IRJET) e-ISSN: 2395-0056
Volume: 09 Issue: 09 | Sep 2022 www.irjet.net p-ISSN: 2395-0072
8 Natureofcrossing skew–30u 9 Natureofbed mediumgravelswith murum 10 NatureofBank Firm 11 Rugositycoeff. Compartment No1 0.035 No2 0.030 No3 0.035 12AngleofSkew Skew 30 13 TypeofBridge Highlevelsubmersible bridge withOpen Foundation 14 SlitFactor 4.75 (assumed) 15 LinearWateratO.F.L 9.15M. 16 LinearWateratH.F.L 13.06M. 17 InglishDischarge 92.533Cumec 18 ManningDischarge 91.176Cumec 19 Velocity OfH.F.L 3.402M/sec 20VelocityOfO.F.L 2.133M/sec 21ObstructionatHFL 28.65% 22ObstructionatOFL 16.35%
PROPOSAL:-TypeofBridge- HighlevelSubmiersible MinorBridge
SpanArrangement–2spansof7.0mc/c WidthOfBridge -7.50MWide. TypeofFoundation- OpenFoundation RTLproposed - 98.685 HeightOfBridge (RTL–LBL) 2.870 M (98.685–95.815) 4.RESULT
10 7 5700 11 8 5850 12 9 6000 13 10 6100 14 11 6200 15 12 6300 16 13 6400 17 14 6500 18 15 6600 19 16 6700 20 17 6775 21 18 6850 22 19 6950 23 20 7000 Q= CXA A+4 C=4200+0.74(4600-4200)C=Constant 4496.00 Q=3265.274 Cuses 92.533Cumec i.e 92.533Cumec
4.1HYDRAULIC GRADIENT
Table -2 HydraulicGradientCalculation S.N U/S D/S Diff Slope CH R.L CH R.L 1 2 3 4 5 6 7 1 300 97.310 0 95.815 1.495 2 270 96.890 30 95.610 1.280 3 240 96.685 60 95.480 1.205 4 210 96.335 90 95.320 1.015 5 180 96.260 120 95.230 1.030 6 150 96.190 150 95.020 1.170 7 120 96.080 180 94.800 1.280 8 90 96.020 210 94.710 1.310 9 60 95.900 240 94.540 1.360 10 30 95.890 270 94.210 1.680 11 0 95.815 300 93.890 1.925
2022, IRJET | Impact Factor value: 7.529 | ISO 9001:2008 Certified Journal
International Research Journal of Engineering and Technology (IRJET) e-ISSN: 2395-0056
Volume: 09 Issue: 09 | Sep 2022 www.irjet.net p-ISSN: 2395-0072
14.750 Average - 1.341 1in223.729 i.e 0.00447
DISCHARGEBYMANNING’S ATH.F.L DefineX-sectionat130m.OnU/S 98.250M
Table 3 DischargeByManning’sAtH.F.L CompatmentNo1
C H G.L H.F. LR.L Heig ht Me an Ht.
1 0 98.2 50 98.2 50 0.00 0
Leng th Are a Ht.D iff. Perime tre
Hydgadlent 0.00447
RugCoeff 0.030 V= 1/nxR2/3 xS1/2 R=A/Wp 1.886 3.402
Velocity 3.402
Discharge(Q)= AxV DISCHARGE 64.202 Cumec
Table -5 DischargeByManning’sAtH.F.L CompatmentNo3
C H G.L H.F. L R.L
Heig ht Me an Ht.
5 96.3 40 98.2 50 1.91 0
Leng th Area Ht.D iff. Perim etre
8 97.9 10 98.2 50 0.34 0 0.1 70 2.00 0.3 40 0.34 0 2.029
6 96.7 80 98.2 50 1.47 0 0.9 05 2.00 1.8 10 1.13 0 2.297
5 96.3 50 98.2 50 1.90 0 1.6 85 1.00 1.6 85 0.43 0 1.089 3.8 35 5.415
Hydgadlent 0.00447
RugCoeff 0.035 V= 1/nxR2/3 xS1/2 R=A/Wp 0.708 1.518 Velocity 1.518 Discharge(Q)= AxV
DISCHARGE 5.820 Cumec
Table
-4 DischargeByManning’sAtH.F.L
CompatmentNo2
C H G.L H.F. L R.L
5 96.3 50 98.2 50
Heig ht Me an Ht.
Leng th Area Ht.D iff. Perim etre
4 96.3 20 98.2 50 1.93 0 0.9 65 1.00 0.96 5 0.03 0 1.000
2 96.2 60 98.2 50 1.99 0 1.9 60 2.00 3.92 0 0.06 0 2.001
0 96.2 20 98.2 50 2.03 0 2.0 10 2.00 4.02 0 0.04 0 2.000
2 96.2 30 98.2 50 2.02 0 2.0 25 2.00 4.05 0 0.01 0 2.000
4 96.2 90 98.2 50 1.96 0 1.9 90 2.00 3.98 0 0.06 0 2.001
5 96.3 40 98.2 50 1.91 0 1.9 35 1.00 1.93 5 0.05 0 1.001 18.8 70 10.003
6 97.2 90 98.2 50 0.96 0 1.4 35 1.00 1.43 5 0.95 0 1.379
7 98.0 80 98.2 50 0.17 0 0.5 65 1.00 0.56 5 0.79 0 1.274
1 0 97.6 10 98.2 50 0.64 0 0.4 05 3.00 1.21 5 0.47 0 3.037
3 0 97.8 10 98.2 50 0.44 0 0.5 40 20.0 0 10.8 00 0.20 0 20.001
6 7 98.2 50 98.2 50 0.00 0 0.2 20 37.0 0 8.14 0 0.44 0 37.003 22.1 55 62.694
Hydgadlent 0.00447
RugCoeff 0.035 V= 1/nxR2/3 x S1/2 R=A/Wp 0.353 0.955 Velocity 0.955 Discharge(Q)= AxV DISCHARGE 21.153 Cumec TotalDischarge CompNo1+2+3 91.176 Cumec 98.250m at definecrosssection Dischargeis 92.533 Cumec Whichis -1.47%&i.ewithin (+,-)2%
DISCHARGEBYMANNING’S ATH.F.L
DefineX-sectionat130m.OnU/S 97.250M
CompatmentNo1
C H G.L H.F. LR.L Heig ht Me an Ht.
7 97.2 50 97.2 50 0.00 0
Leng th Are a Ht.D iff. Perime tre
6 96.7 80 97.2 50 0.47 0 0.2 35 1.00 0.2 35 0.47 0 1.105
© 2022, IRJET | Impact Factor value: 7.529 | ISO 9001:2008 Certified Journal | Page613
International Research Journal of Engineering and Technology (IRJET) e-ISSN: 2395-0056
5 96.3 50 97.2 50 0.90 0 0.6 85 1.00 0.6 85 0.43 0 1.089 0.9 20 2.194
Hydgadlent 0.00447
RugCoeff 0.035 V= 1/nxR2/3 x S1/2
R=A/Wp 0.419 1.070
Velocity 1.070 Discharge(Q)= AxV DISCHARGE 0.985 Cumec
CompatmentNo.2
C H G.L H.F. LR.L Heig ht Me an Ht.
5 96.3 50 97.2 50
Leng th Are a Ht.D iff. Perime tre
Hydgadlent 0.00447
RugCoeff 0.035 V= 1/nxR2/3 x S1/2 R=A/Wp 0.300 0.857 Velocity 0.857 Discharge(Q)= AxV DISCHARGE 0.312 Cumec
TotalDischarge CompNo1+2+3 21.287 Cumec
Thisdischargeis 23.35% OfHFL discharge Henceitis O.K
LinearWaterWay@HFL/OFL
CALCULATIONOFWATERWAY@HFLR.L 98.250M
HFL 98.250m
4 96.3 20 97.2 50 0.93 0 0.4 65 1.00 0.4 65 0.03 0 1.000
2 96.2 60 97.2 50 0.99 0 0.9 60 2.00 1.9 20 0.06 0 2.001
0 96.2 20 97.2 50 1.03 0 1.0 10 2.00 2.0 20 0.04 0 2.000
2 96.2 30 97.2 50 1.02 0 1.0 25 2.00 2.0 50 0.01 0 2.000
4 96.2 90 97.2 50 0.96 0 0.9 90 2.00 1.9 80 0.06 0 2.001
5 96.3 40 97.2 50 0.91 0 0.9 35 1.00 0.9 35 0.05 0 1.001 9.3 70 10.003
Hydgadlent 0.00447
RugCoeff 0.0300 V= 1/nxR2/3 x S1/2 R=A/Wp 0.937 2.133
Velocity 2.133 Discharge(Q)= AxV DISCHARGE 19.991 Cumec
CompatmentNo.3
CH G.L H.F. L R.L
Heig ht Me an Ht.
5 96.3 40 97.2 50 0.91 0
Leng th Are a Ht.D iff. Perim etre
Wettedarea= A2+A1xQ1/Q2+A3x Q3/Q2 A1 3.835 Q1 5.820 A2 18.870 Q2 64.202 A3 22.155 Q3 21.153 44.860 91.176
Sqm cumec = 26.517
d=Maximumflooddepth HFL–LBL 98.250 96.220 2.030
Linear WaterWay= Wettedarea@HFL/Max.depth = 26.517 2.030 13.063m
ConsideringandtoaccommnodateBedandbankwidthat existingC/S 2spansof 7.00mC/Cisprovided.
5.8 0 97.2 50 97.2 50 0.00 0 0.4 55 0.80 0.3 64 0.91 0 1.212 0.3 64 1.212
CALCULATIONOFWATERWAY@OFLR.L 97.250M
OFL 97.250m
Wettedarea= A2+A1xQ1/Q2+A3x Q3/Q2
A1 0.920 Q1 0.985 A2 9.370 Q2 19.991
Volume: 09 Issue: 09 | Sep 2022 www.irjet.net p-ISSN: 2395-0072 © 2022, IRJET | Impact Factor value: 7.529 | ISO 9001:2008 Certified Journal |
International Research Journal of Engineering and Technology (IRJET) e-ISSN: 2395-0056
A3 0.364 Q3 0.312 10.654 21.287 =9.421 d=Maximumflooddepth OFL–LBL 97.250 96.220 1.030
Linear WaterWay = Wettedarea@OFL/Max.depth = 9.421 1.030 9.15m
DESIGNOFAFFLUX
Data W/A = Wettedarea@HFL= 26.52Sqm. Q= 91.176 Cumec
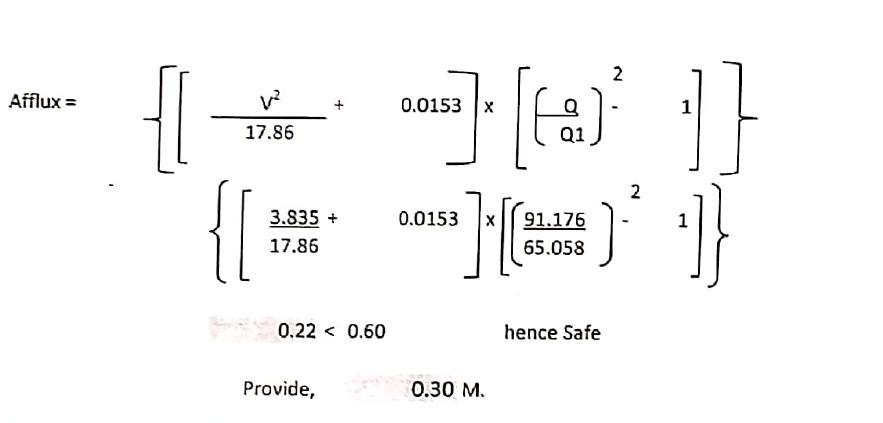
Q1= unobs Discharge = Totaldischarge–Obs.Discharge 91.176 - 26.117 65.058 Cumec
V=meanvelocityinm/sec. 1.958m/sec
d = 0.473 x (Q)1/3 (f)1/3 0.473(91.176)1/3 (4.75)1/3 = 1.266
Max Socur depth D= 2xd 2.533 m.
Socurlevel - H.F.L–D 98.250m - 2.533 = 95.717
BottomR.LofFoundation = LoweroftheFollowing
1 H.F.L–1.33xD 94.301
2 H.F.L- Max Socur depth–1.5m. 93.637m.
3 AsperTrialpit1.50 mkeying from hard strata–(95.815–1.0)= 94.815 -1.50 936.315M. Soft rock
Adopted- 93.315 being alower R.T.L Calculations
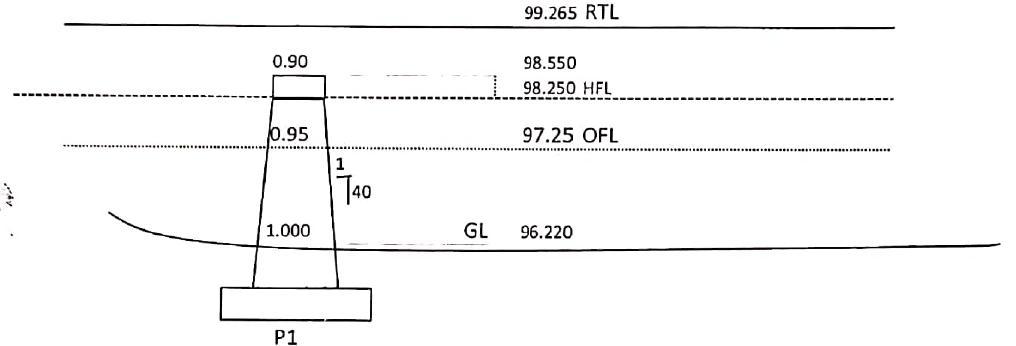
ForHighlevelSubmersibleBridge RTLisfixednow H.F.L 98.250
+Affiux 0.300 *SlabDepth of 8.0m
+Slabdepth 0.640 spanis considered
SCOURDEPTHCALCULATIONS
FOROPENFOUNDATION Q= 91.176 F = 4.75 L= 13.06 H.F.L 98.250 AtExistingH.F.L 97.670 Normalscourdepth Q= 91.176 f = 4.75
+Wearingcourse 0.075 o.64m beingaskew +Vert.Clearance bridge 99.265
R.T.Latdefined C/section = 99.265M. Definedc/sectionis =130monU/Sside
Bedslopeis = 0.00447
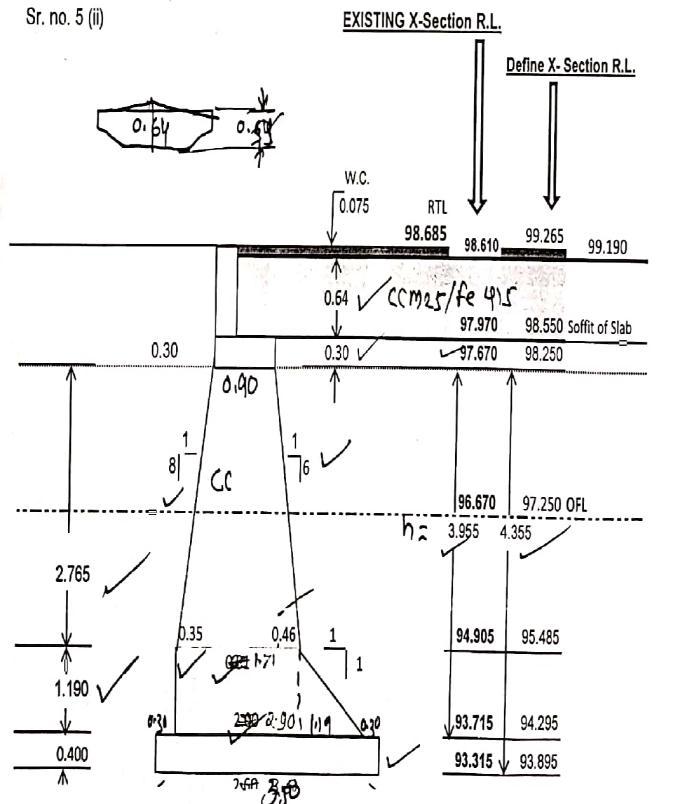
ThereforeR.T.Lexistingsite= 98.684M. say 98.685M. DESIGNSECTIONOFABUTMENT (AsperDesigncircleDrgNo.BR–NGP/2002-054)
Volume: 09 Issue: 09 | Sep 2022 www.irjet.net p-ISSN: 2395-0072 © 2022, IRJET | Impact Factor value: 7.529 | ISO 9001:2008 Certified Journal | Page615
International Research Journal of Engineering and Technology (IRJET) e-ISSN: 2395-0056
Table 6- LevelTransferatExistingDetails
SN R.LatDefined R.LatExisting
1 H.F.L 99.265 98.685
2 O.F.L 97.250 96.670
3 R.T.L 99.265 98.685
4 Foundation Level 93.895 93.315
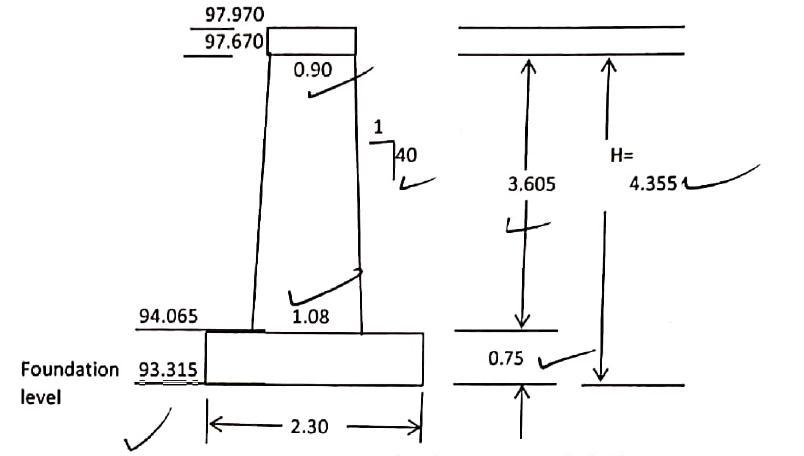
SPAN/HEIGHTRATIO
1 Foundation ofPler = 93.315M
2 Plertoplevel = 97.670M
3 Heightof Bridge = 4.335M
4 ClearspanofBridge (7.090) = 6.10M
5 S/H Ratio = 6.10/4.355 = 1.29O.K
DESIGNSECTIONOFPIER
(AsperDesigncicleDrg.NoBR-NGP/2002-043)
Srno 4
LevelsTransferatExisting
DefinedXsectionOn130m.onU/S Slope = 0.00447
CALCULATIONSFORPERCENTAGEOBSTRUCTIONAT O.F.LR.L97.250M.
For2Spansof7.00mc/c
Compartment-1
Obs Area ( as per O.F.L manning ) 0.920
NetObsarea= 0.920
AreaxVelocity 0.920 x1.070 0.985 -1cum Compartment -2
ObsAreaduetoP1with= (0.95+1.0)/2x(97.25-96.220) 1.024
Volume: 09 Issue: 09 | Sep 2022 www.irjet.net p-ISSN: 2395-0072 © 2022, IRJET | Impact Factor value: 7.529 | ISO 9001:2008 Certified Journal | Page616
International Research Journal of Engineering and Technology (IRJET) e-ISSN: 2395-0056
Volume: 09 Issue: 09 | Sep 2022 www.irjet.net p-ISSN: 2395-0072
TotalObsArea = 1.024
Obs Discharge 1.024 x 2.133 2.184 -2Cumec
Compartment -3
Obs Area ( as per O.F.L manning ) 0.36 Obsarea = 0.364
AreaxVelocity
Obs Discharge 0.364 x 0.857 0.312 -3 cum
TotalObsDischarge= 1+2+3 3.481 Cumec
TotalDischargeatO.F.L = 21.287 Cumec
% Obstruction at O.F.L = ( Obstructed discharge/ Total discharge)x100 (3.468/21.287)/100
16.35% <30% Hencesafe&O.K
5. CONCLUSIONS
Basedontheresultsofthisstudy,thefollowingconclusions weredrawn:
1. From this study, it can be assumed that if waterways becomenarrower,moreexpectedbankerosionanderosion may occur. To avoid such a drastic situation, river preparationworksfrom1kmupstreamto1kmdownstream mayberecommendedandcontinuousmonitoringshouldbe carriedoutduringandaftertheconstructionofthistypeof structureinthestatedsituation.
2.Theresultofthestudywasonlyachangeinthelevelof thebottomanderosionoftheshore.Thereweredifferences inthewaterlevel,aswellasinthespeedofthecurrent.The resultofthestudyisbasedontheexistingconditionofthe NalaRiver.Theapproachmaybethesameforallrivers,but thereisthepossibilityofdeviationsincaseofotherbaseline conditionsandotherrivers.Theresultalsovarieddepending on the condition of the soil, the speed of the current, the effectofwaves,tides,surfacerunoffandsoon.
3.Thisprojectfoundthatmanyriverbridgesthataremore than40yearsoldaresubjecttocollapseduringfloodsand suddenincreasesincontractionandlocalerosion.
4.Theresultsshowedthatthebridgeabutmentnarrowed theflowcross-sectionandcausedanincreaseinsupportin the upper sections. This increase in underflow caused a decreaseinthelongitudinal velocityintheupper reaches. Also,theresultsshowedthatthepositionofthemaximum layer shear stress moved from the separation zone to the edgeofthebridgesupport.
5.Inaddition,theresultsshowedthatforthecross-section of the downstream bridge abutment, the secondary flow patterniscompletelydifferentfromthenormalsecondary flowinthecaseofanopenchannelincidentwithoutabridge abutment.
6.1)Recommendations:
1.Hydrologicalandhydraulicsurveysofallexistingbridges inIndiashouldbeproperlycarriedout.
2.Thebridgeengineershouldcarryoutthesestudiesbefore providingsufficientfreeboardatthenewbridgelocation.
3. The level of the bridge deck should be at least 150 mm abovethemaximumheightofthewatersurface.
REFERENCES
(1) AASHTO, Drainage Manual, Chapter 10, “Bridges,” AASHTOTechnicalCommitteeonHydrologyandHydraulics, 2009(draft).
(2) AASHTO, Highway Drainage Guidelines, Chapter 7, HydraulicAnalysisfortheLocationandDesignofBridges, AASHTOTechnicalCommitteeonHydrologyandHydraulics, 4thEdition,2005.
(3) Clarkin, Kim; Keller, Gordon; Warhol, Terry; Hixson, Suzan, Low-WaterCrossings: Geomorphic, Biological, and EngineeringDesignConsiderations,06251808P,SanDimas, CA: US Department of Agriculture, US Forest Service, San DimasTechnologyandDevelopmentCenter,366p.,2006.
(4) Corry, M.L., Jones, J.S. and Thompson, P.L., Design of Encroachments on Floodplains Using Risk Analysis, Hydraulic Engineering Circular No. 17, Federal Highway Administration,WashingtonDC,1981.
(5)FederalHighwayAdministration,RiverEngineeringfor Highway Encroachments Highways in the River Environment,HydraulicDesignSeriesNo.6,FHWANHI-01004,December2001.
(6) Federal Highway Administration, Stream Stability at HighwayStructures,HydraulicEngineeringCircularNo.20, ThirdEdition,FHWA-NHI-01-002,2001
© 2022, IRJET | Impact Factor value: 7.529 | ISO 9001:2008 Certified Journal | Page617
International Research Journal of Engineering and Technology (IRJET) e-ISSN: 2395-0056
Volume: 09 Issue: 09 | Sep 2022 www.irjet.net p-ISSN: 2395-0072
(7) National Cooperative Highway Research Program, Handbook for Predicting Stream Meander Migration and SupportingSoftware,NCHRPReport533,2004.
(8) Davidian, J., Computation of Water Surface Profiles in OpenChannels, Techniques of Water Resources Investigation, Book 3, ChapterA15,USGeologicalSurvey,WashingtonDC,1984
(9)Bonner,VernonR.andBrunner,Gray,1994,“HECRiver Analysis System,”Hydraulic Engineering ’94, Volume 1,pages376-380, Proceedings for the ASCE1994 National Conference on Hydraulic Engineering
(10)Brunner,GaryW.andPiper,Steven.,1994.“Improved Hydraulic Features of the HEC River Analysis System”, Hydraulic Engineering ’94, Volume 1, pages 502-506, Proceedings for the ASCE 1994 National Conference on Hydra ulic Engineering.
(11) Federal Highway Administration(FHWA), 1985. “Hydraulic Design of HighwayCulverts,” Hydraulic Design SeriesNo.5,USDepartmentofTransportation,Washington, DC.
(12) HEC, 1994. “HEC River Analysis System, “Technical PaperNo.147,Davis,CA,August1994.
(13)Calderon,Camilo,2006,Spatio-temporalvariability of evapotranspiration rates and its effect on distributed hydrologic modelling of a regional water balance: M.S. Thesis,UniversityofOklahoma,93p.
(14)Seilheimer,T.S.,andFisher,W.L.,2008,Instreamflow assessment of steams draining the Arbuckle-Simpson aquifer: Final report submitted to the OklahomaWater ResourcesBoard,49p.
(15)Vieux,B.E.,andMoreno,M.A.,2008,Arbuckle-Simpson HydrologyStudy,Distributedwaterresourcesassessment: Final report submitted to the Oklahoma Water Resources Board, University ofOklahoma School of CivilEngineering andEnvironmentalScience,44p
2022, IRJET | Impact Factor value: 7.529 | ISO 9001:2008 Certified Journal |