
International Research Journal of Engineering and Technology (IRJET) e-ISSN: 2395-0056
Volume: 12 Issue: 02 | Feb 2025 www.irjet.net p-ISSN: 2395-0072
International Research Journal of Engineering and Technology (IRJET) e-ISSN: 2395-0056
Volume: 12 Issue: 02 | Feb 2025 www.irjet.net p-ISSN: 2395-0072
Amit jyoti1, Anwar Alam2
1M. Tech scholar, civil engineering, CIT Ranchi
2Assistant professor, civil engineering, CIT, Ranchi
Abstract - This research was conducted with a view to understanding the seismic performance of curved I- girder bridges concerning curvature radius, span length, and intensity of earthquake. Such bridges have been very common in modern infrastructure and grow increasingly and are vulnerable to seismic events. This M-tech project’s aim was to analyse the seismic performance of curve I girder bridges. This project focusing on curvature influence, force distribution, deformation pattern during seismic events. The Project involved the linear and nonlinear seismic analysis to understand the static and dynamic response of the bridge. The seismic analysis was done on the curve bridge model of having 5 span and length 100m. The earthquake effect was analysed on the bridge model and tried to analyse the forces on bridge, displacement in bridge and stress distribution by the use of nonlinear time history analysis method. The Advanced CSI bridge v26.1.0 software employed to model bridge structures and simulates seismic loads, considering nonlinear material behaviour and dynamic response. This research work was aimed at evaluating, under different seismic scenarios like along the longitudinal direction or transverse direction. The stress distribution, deformation, and mechanisms of possible failure analysed by the software. The results show a strong curvature effect on the seismic response of these bridges. The earthquake zone 5 of Indian region was taken as reference in this project. The earthquake zone 5 includes the region of Kashmir, POK border with Nepal, Sikkim and northeast region of India. These areas are vulnerable to the severe earthquake
Key words: I girder, seismic, earthquake zone, time history, CSI Bridge
Curved I-girder bridges are unique and more complicatedthanstraightbridges.Thesetypesofbridges are desirablein hilly and mountainous region where the space and difficult terrain gives less space for highway bridge construction. In hilly and mountainous region curvedbridgescouldbehorizontallycurvedorvertically curve depending upon the terrain. Other than hilly and mountainous region, in city areas where space is constraint these types of curved bridges fulfill the criteria ofhighways.Forcitypurposeitcouldbecurved steel girder or curved steel box girder and curved concrete box girder. The curved bridges unique geometry brings special challenges to the designers to design structures under earthquake loadings. As
opposed to straight members, these structures are exposed more complicated loaddistributions asaresult of interaction between bending moment, torsion and axialforcesundertheinfluenceofseismicloads.Dynamic forces and torsional forces are prominent due to of curved geometry, and as a result increased stresses, deformationscanbecausedwhichvulnerabilitytowards damage.Bridgecurvesarisefromvariousfactorssuchas sitelimitations,verticalandhorizontalalignment, traffic density as well as speed limit variation. Usually, for the constructionofcurvebridges,boxgirderbridgesbecome more advantageous owing to their cellular cross section that is capable of withstanding high twisting moments. However, for this case, I girder curve bridge is being studied. Mainly the arch-shaped bridges are accepted andutilizedmorebecauseoftheireffectiveness,stability, functionality,costefficiency,andbeauty.Mostoftenthey are designed to be circular in shape with transitional curves. In the case of curved bridges, torsion being induced influences the bridges response in axial, shear andtorsional bendingmoments.Thiscausesa distortion on the cross-section of the bridge and leads to differential stresses on the flanges. Edged over by the availability of computer technology with sophisticated analysis tools, the design and analysis of highly curved bridges are now easier. Analytical evaluation of the bridgesthatarecurvedinplaninvolvesmorechallenges compared to straight bridges because they are affected bybothbendingandtwistingduetothecurvatureofthe girders. Hence the section selected for curved bridge design should possess a high torsional rigidity for effectiveuseofthesection.Inthecaseofsmallcurvature bridge,effectofcurveangleonBM,SF,TMandVDcanbe ignoredifitiswithinthelimits.
1.1.1. SEISMIC DISPLACEMENT: Seismic displacements in bridges refer to the movements or shifts in a bridge structurecausedbyseismicforcesduringanearthquake. When an earthquake occurs, ground motions induce forcesthattravelthroughtheearth,causingthebridge's foundation and superstructure to experience displacement, both horizontally and vertically. These displacementscanhavesignificanteffectsonthebridge's performance,safety,andoverallstability.
1.1.2. PIER FAILURE: Pier failure in bridges due to seismic forces is a critical concern in earthquake engineering. During an earthquake, seismic forces can
International Research Journal of Engineering and Technology (IRJET) e-ISSN: 2395-0056
Volume: 12 Issue: 02 | Feb 2025 www.irjet.net p-ISSN: 2395-0072
induce lateral and vertical ground motions that place significant stress on these piers. If the forces exceed the piers' capacity, failure can occur, leading to severe damage or even collapse of the bridge. Factors like horizontalaccelerationandverticalforcesplayedagreat role in pier failure. During an earthquake, the ground moves horizontally, which can generate large lateral forcesactingonthepiers.Ifthepiersarenotdesignedto resisttheseforces,theymayfailduetoshearorbending stresses. In addition to horizontal forces, vertical accelerations from seismic waves can create additional loads on the piers, which can cause buckling or failure, particularlyinshorterpiersthataremoresusceptibleto theseverticalmotions.
1.1.3.
Expansion joints are essential components in bridge design, allowing for the controlled movement of the bridge deck as it expands or contracts due to temperature fluctuations, settlement,orseismicactivity.Duringanearthquake,the ground motion generates powerful lateral forces that causethebridgedecktomovehorizontally.Theseforces can exceed the design limits of the expansion joints, leading to their deformation, rupture, or complete failure. If the joints cannot accommodate the horizontal movement during an earthquake, they may become overstressed,leadingtostructuraldamage.Inadditionto horizontal displacements, seismic forces can also cause vertical movements in the bridge deck due to vertical accelerationsfromtheearthquake.Iftheexpansionjoint is not designed to accommodate both horizontal and vertical movements simultaneously, it can fail under these conditions. Vertical displacements can cause misalignment or even damage to the joint’s sealing and connectioncomponents.
1.1.4. BEARING FAILURE: Bearings are critical components that transfer loads between the bridge superstructure (deck) and substructure (piers, abutments). They also allow for the relative movement between these components caused by temperature changes, settlement, and seismic activity. During an earthquake, seismic forces can subject bearings to extreme stresses. During an earthquake, horizontal ground motion generates lateral forces that cause the bridgesuperstructuretomoverelativetoitsfoundation. Bearingsaredesignedtoaccommodatesuchmovements, but if the seismic forces are too great, they may exceed the bearing's capacity, leading to failure. This could result in the bridge deck moving off alignment or collapsing. Bearings that are intended to allow movement (sliding bearings) may experience excessive displacement during an earthquake, leading to slippage or loss of control over the movement. This can cause instabilityandmisalignmentofthebridgedeck.
1.1.5. ABUTMENT SLUMPING: Abutment slumping in bridges refers to the failure or displacement of the
bridge's abutment, which is the structure that supports the ends of the bridge and transfers loads from the bridge deck to the foundation or underlying soil. Abutments are typically designed to resist vertical and horizontal loads, including the forces exerted by the bridge deck and traffic. However, during seismic events, seismic forces (horizontal ground motion, vertical shaking, or both) can cause the abutment to move or slump, potentially compromising the stability of the entirebridgestructure.Duringanearthquake,horizontal groundmotionexertslateralforcesontheabutment.The lateral forces may push the abutment back or sideways, causing it to shift or even fail. Seismic forces also cause verticalgroundaccelerationsthatmayaffectthestability of the abutment. If the ground beneath the abutment becomes unstable due to the shaking, it may result in settlementortilting,causingtheabutmenttoslump.This vertical displacement can further misalign the bridge deckorleadtofoundationfailure.Whensoilliquefaction occurs beneath or around the abutment, it can cause significantsettlementortiltingoftheabutment.Thisloss of support can result in the abutment slumping and, in severecases,causethecollapseofthebridge.
X1.1.6. FOUNDATION FAILURE: The foundation of a bridgeplaysacriticalroleintransferringtheloadsfrom the superstructure (bridge deck and other elements) to the ground or underlying bedrock. During an earthquake, lateral ground motion generates significant horizontalforcesthatcancauseslidingorshiftingofthe foundation.Seismicshakingcancauseunevensettlement of the foundation, especially in areas with soft or loose soils. The differential settlement (where one part of the foundationsettlesmorethananother)canleadtotilting or distortion of the bridge deck, potentially causing it to crack or displace. Settlement failure occurs when the foundationsinksunevenly, oftendue tothesoil beneath thefoundationbeingunabletosupporttheweightofthe bridgeduringanearthquake.Differential settlementcan causethefoundationtotiltordistort,affectingtheentire bridge structure. Shear failure occurs when the foundationexperiencesexcessiveshearforcesthatcause it to crack, break, or fail. This can happen when the foundation is not properly reinforced or when the seismicforcesexceedtheshearcapacityofthematerials usedinthefoundation.
1.1.7. COLLAPSE DUE TO SOIL LIQUIFACTION: complete collapse of bridges because of soil liquefaction is a significant concern during seismic events, particularly in areas with loose, saturated soils. Soil liquefaction is a condition that occurs during an earthquake when saturated, loose soils (usually sandy soils)experienceanincreaseinporewaterpressuredue toseismicshaking.Asthesoilparticleslosecontactwith each other, the soil temporarily loses its shear strength and behaves like a liquid. This can cause the ground to become unstable, resulting in differential settlement,
International Research Journal of Engineering and Technology (IRJET) e-ISSN: 2395-0056
Volume: 12 Issue: 02 | Feb 2025 www.irjet.net p-ISSN: 2395-0072
lateral spreading, or tilting of structures that are supported by this soil. Differential settlement occurs when the soil beneath the bridge foundation undergoes uneven liquefaction. Different areas of the foundation mayexperiencevaryingdegreesofsettlement,whichcan cause the bridge deck to tilt, crack, or become misaligned.Liquefactioncausesthesoiltoloseitsability tobearloads.
Earthquake is the shaking of the earth surface that causes tremendous disaster in the world. It causes because of sudden release of energy from the lithosphere that creates seismic waves. Earthquake causes naturally or be induced by man-made activities such as mining, nuclear test and fracking. Naturally Earthquake generally caused by geological faults, volcanic activity, land slide, tsunami and other seismic events. The location below which earthquake starts is called hypocenter and on the surface it is called epicenter. The earthquake generally occurs along fault linesandnarrowzoneswheretwotectonicplatesorpart ofrockslidesoveroneanother.Seismologyisthescience which studies seismic events. Through this we know about the causes of earthquake and intensity of earthquake. Major earthquakes tend to occur in regions where tectonic plates meet, with one of the most significant earthquake zones being the Pacific Belt. The belt, which surrounds the Pacific Ocean, experiences frequent seismic activity that affects areas such as New Zealand, Papua New Guinea, and Japan. Seismic activity within the Pacific Belt is not uniform, and it includes several branches in different regions. Many of these areas are also associated with volcanic activity, earning the belt the name "Ring of Fire." In addition to pacific belt The Alpide belt also vulnerable to earthquake. Alpide belt stretches from east of Mediterranean to the west of East Indies. This belt accounts for about 15% of the energy released by earthquakes, but it has less volcanicactivitycomparedtothePacificBelt.
1.2.1.1
This is the most common cause. The Earth's outer shell, orlithosphere,isdividedintolarge,rigidplatesthatfloat on the semi-fluid asthenosphere beneath them. These plates constantly move, and when they interact (collide, slidepast,orpullapart),stressbuildsupandisreleased asseismicenergy.Thefractureinrockpropagatedinthe same direction or in the area of weak direction and extendedtoomanykilometers.Thistheorywasgivenby harry fielding Reid after observing and research on san Andrea fault which causes san Francisco earthquake in 1906. As fault rupture progresses towards the fault the rockmassestriedtomoveinoppositedirectionandthus
duetostrainitbouncesbacktoapositionwherethereis less strain. This movement when happens again and again there is rise in vibration and that propagates as seismicwaves.
Exampleofearthquakeduetotectonicmovement
1976TangshanEarthquake
1999TaiwanEarthquake
1.2.1.2 VOLCANISM
Earthquake in volcanic regions often occurs due to both tectonic faults and magma movement in volcanos. Earthquakeswarmsservesasmarkersforthelocationof the flowing magma throughout the volcanos. These swarmsrecordedthroughseismometersandtiltmeters.
Example:-1980mountHelensearthquake.
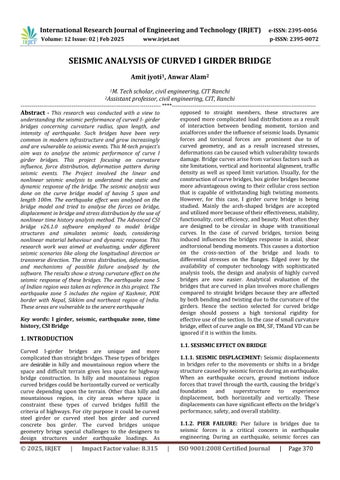
1.2.1.3 FAULTING
Faults are fractures in the Earth's crust where blocks of rock have moved relative to one another. When stress builds up along a fault and overcomes the friction holdingtherockstogether,itcausesarupture,resulting inanearthquake.
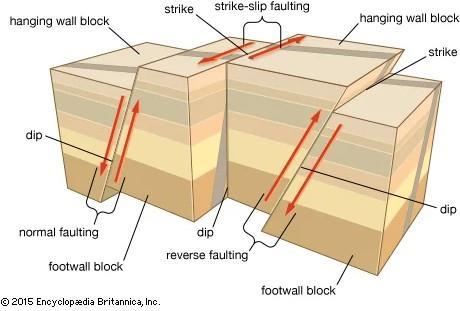
1.3. EARTHQUAKE ZONES IN INDIA
TheearthquakezonesinIndiaareidentifiedbyusingthe modifiedMercalliintensity.Itmeasureshowearthquake affectsareas.AftertheLaturearthquakeinMaharashtra in1993,theseismicmapwasupdated.Accordingtomap low danger zone called seismic zone 1 was combined withseismiczone2.Sozone1notshownafterupdate.
1.3.1. ZONE- 2
It is low intensity area and it covers around 40% of India’s land. This includes the Karnataka plateau and peninsularregionofIndia.
International Research Journal of Engineering and Technology (IRJET) e-ISSN: 2395-0056
Volume: 12 Issue: 02 | Feb 2025 www.irjet.net p-ISSN: 2395-0072
1.3.2 ZONE- 3
It includes the area of Kerala, goa, Lakshadweep Island along with the parts of Punjab, Rajasthan, MP, Bihar, Jharkhand, Odisha, and Tamilnadu and so on. It covers theareaaround30%ofcountry.
1.3.3 ZONE- 4
Itcoversaround18%ofland.Itisahighintensityzone. It includes the area of J&K Himachal Pradesh, border withNepal,Sikkim,UP, WestBengal,Bihar,andcoastof Maharashtra.
1.3.4 ZONE- 5
Itisextremelyseverezone.Itcoversaround10%ofland ofcountry.ItincludesHimachalPradesh,Rann ofKutch, northBiharandAndaman&NicobarIsland.
1.4
TheAASHTOLRFDCodeisa setofdesignguidelinesfor highway bridges in the United States. It provides a modern, comprehensive method for designing and evaluating the structural integrity of bridges and transportation-related infrastructure. The LRFD approach is based on probability and reliability theory, which ensure the safety, performance, and durability of bridge structures over time, even under unpredictable conditions. The code incorporates load and resistance factor design, where different factors are applied to accountforvariousuncertaintiesinboththeloads(such as traffic, wind, and seismic forces) and the structural resistance(suchasmaterialpropertiesandconstruction variations). This design methodology ensures that
bridges can withstand extreme events without overestimating or underestimating their safety margins. OneofthekeyprinciplesoftheAASHTOLRFDCodeisto ensure that bridge designs are cost-effective while still meeting safety and performance standards. The code is regularly updated to reflect advancements in materials, technology, and engineering knowledge. It considers a wide range of bridge types, including both simple and complexstructures,anditprovidesdetailedguidanceon materials, geometry, and load distribution for various scenarios. The AASHTO LRFD Code is essential for ensuring that bridges are designed and built with the highest level of safety, efficiency, and sustainability. It plays a crucial role in maintaining the integrity of the U.S. transportation system, providing engineers and designers with the tools they need to create infrastructure that can safely handle the demands of modern traffic, weather conditions, and other environmental factors. It also ensures that new bridges are capable of performing over the long term, minimizingtheneedforcostlyrepairsorreplacements.
1.5 METHOD OF SEISMIC ANALYSIS (IRC CODE)
As per IRC code IRC SP-114-2018, the seismic analysis onbridgestructurecouldbedonebythreemethods.
1.5.1 Seismic coefficient Method
1.5.2 Elastic response spectrum method
1.5.3 Time history method
1.5.1 Seismic coefficient method
This method of analysis is used for low and medium heightstructure.Otherthanthisthestructurewithsmall span and length be analyzed by this method. The structure is analyzed by this method in single mode vibration.Theseismicforceresistedbybridgecomputed by,
F= A× (Dead load or Live load)
Where,
F=Horizontalseismicforce
A=Horizontalseismiccoefficient
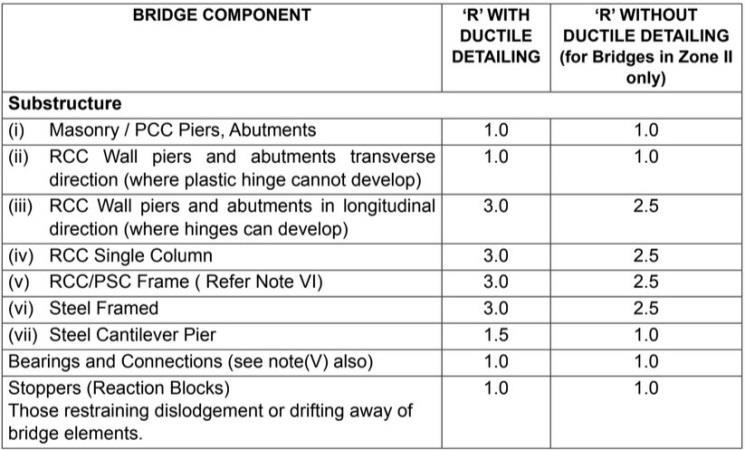
Horizontalseismiccoefficientdeterminedbyformula, A= (Z/2) × (S/g)/ (R/I)
Where,
Z=ZoneFactor
I=ImportanceFactor
R=ResponseReductionFactor
International Research Journal of Engineering and Technology (IRJET) e-ISSN: 2395-0056
Volume: 12 Issue: 02 | Feb 2025 www.irjet.net p-ISSN: 2395-0072
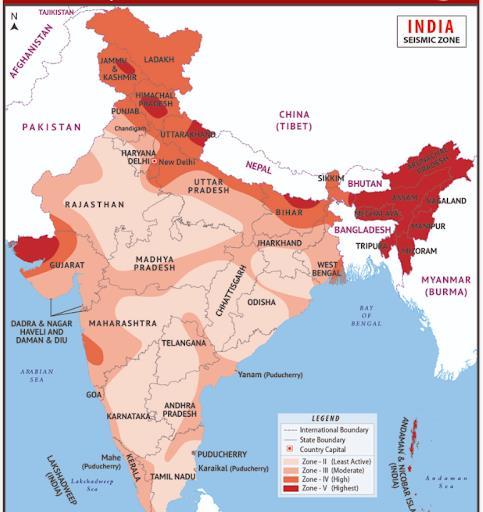
Chart- 1: sa/gcurveforseismiccoefficientmethod Where,
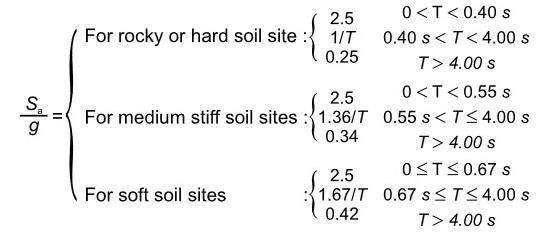
Table- 1: ZoneFactor
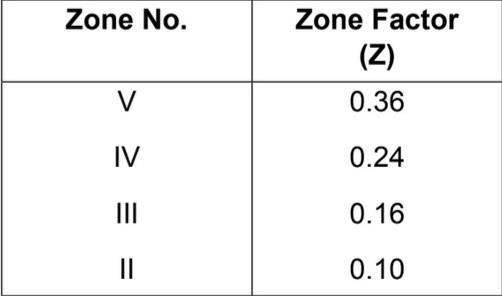
Table-2: ImportanceFactor
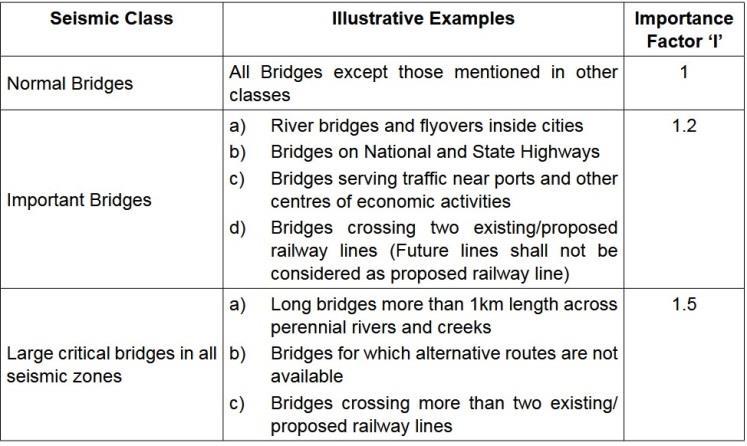
Table-3: ResponseReductionFactor
This method is used for the analysis of complex structure. Complex structure includes continuous bridges, Bridges with different pier height and bridges which are curved. The bridges with pier height more than30mareanalyzedbythismethod.
This method is typically used for bridges with high pier heights or those that experience sudden changes in mass, stiffness, or geometry along their spans. It is also applied when there are significant differences in the parameters between adjacent supports. The dynamic analysis of such bridges is conducted using the time history method, which integrates the equations of motion step by step, ensuring that the highest mode of vibration is properly accounted for. The key difference between linear and nonlinear time history analysis lies in how the lateral resisting forces are represented. In elastic systems, these forces are a simple function of displacement,whereas,ininelasticsystems,theydepend onthepriormotionhistory.
International Research Journal of Engineering and Technology (IRJET) e-ISSN: 2395-0056
Volume: 12 Issue: 02 | Feb 2025 www.irjet.net p-ISSN: 2395-0072
Mohammad Farhan et al (2020)
A review study on seismic analysis of RCC Bridge with Nonlinear pushover analysis method was conducted by the [md Farhan et al]. Nonlinear pushover analysis method currently used for analytical evaluation of the behaviour of the structure in inelastic range. Previously nonlinear analysis method was limited by its assumptions such as taking fundamental node which control structure response, distribution of lateral forces wasfixedformonitoringnodesandtargetdisplacement. Currently this method being upgraded to include higher modesascomparedtolimitedmodespreviously.Dueto the induction of higher modes the standard pushover analysis method is equivalent to the level of the time history method. Previously this method was used to investigateonlybuildingframes.Theaimofstudywasto investigate the applicability of the standard pushover analysismethodincaseofcomplexbridgestructure.The study reviewed numbers of literatures of various researchers.
Anurag Deshpande ET all (2017)
The main aim of the research was to conduct the comparison between box Girder Bridge and I Girder Bridge along with some column skewness. The horizontal curvature and column skewness simultaneouslyimplementlotofinstabilitytothebridge. The study was conducted on a bridge model of 2 spans,
eachspanhadlengthof50m,bothendsofthebridgehad an abutment and the mid span of the bridge was supported by a circular column of 1.5m diameter. One bridge model had box girder and other had I girder and restoftheitemwassameforboththebridgemodel.The radius of curvature was taken as 150m and 250m. The studywasconductedforthreecasesofcolumnskewness i.e. 0, 15, 25 degree. The bridge model was made by the use of software CSI bridge v 21.1.1. Research was conducted for both seismic loading and vehicular loading. The vehicular loading was conducted by IRC class AA and IRC 6 of vehicle loading. The research conducted by the researchers i.e. [Anurag Deshpande et al]concludedthatIgirderbridgemodelvibratesinboth transverse and longitudinal direction but box girder bridgemodeldidnotbehavelikethat.BoxGirderBridge only vibrates in the longitudinal direction so, from this resultit wasconcluded thatboxGirderBridgehasmore stability as compared to I Girder Bridge. As column skewness increases there is increase in transverse vibration and decrease in longitudinal vibration. The result showed as the radius of curvature increases the base reaction decreases. So, high radius of Curvature Bridge would be more stable as compared to the low radiusofcurvature.
Andreija raseta et al (2016)
The study was aimed to evaluate the seismic performance of reinforced concrete (RCC) structures, focusing on their resilience against earthquakes. The design involved a continuous girder bridge with four spans (35m, 50m, 50m, 35m), with piers of varying heights (7m, 14m, and 21m), fixed to the ground. The analysisconsideredbothgeometricnonlinearity(P-Delta effect)and material nonlinearity(fibre model for plastic hinges)toassessthebridge’sresponsetoseismicforces. Artificially generated and recorded earthquake Accelerograms were applied during the dynamic analysis. The main findings highlighted that bridges in earthquake-prone areas should be designed to remain functionalpost-earthquake.Structuraldamageshouldbe minimized,especiallyincriticalcomponentslikepiers,to preventfailureandensuresafety.
Thomas Wilson ET all (2014)
The study was focused on the seismic response of skewedandcurvedRCCbridgesinmountainousregions. Researchers analysed eight different bridge configurations with varying degrees of skewness and curvature, under low to moderate seismic conditions, which are typical in mountainous areas. To assess how these bridges respond to earthquakes, they performed nonlinear time history analysis using finite element models. The results showed that skew and curvature significantly affect seismic performance, and when combined,theycreatestackingeffects,makingthebridge
International Research Journal of Engineering and Technology (IRJET) e-ISSN: 2395-0056
Volume: 12 Issue: 02 | Feb 2025 www.irjet.net p-ISSN: 2395-0072
more vulnerable. Understanding how skewed and curved bridges behave during earthquakes is crucial for designing safe and resilient transportation systems. Since these bridges have complex geometries, their seismic response is also more complex compared to regular straight bridges. While skewed bridges offer design flexibility, they have historically been linked to earthquake-induced failures due to excessive superstructure deflection. The study examined the seismic Response of RCC bridges with continuous deck designs, integral abutments, and stiff backing soils. It also explores how different combinations of skew and curvature impact bridge stability, providing valuable insights for safer bridge design in earthquake-prone regions.
Thestudycomparedvariouspushoveranalysismethods outlined in international standards; using an RCC buildingframedesignedaccordingtotheprovisionsofIS 1893-2002.Thebuilding,designedwithastrength-based approach and sufficient ductile detailing, was also evaluated for its performance. Pushover analyses were conducted using two different levels of ground motion, applying the ATC-40 method, FEMA340 method, and their modified method from FEMA440. The results showed that for low seismic activity, the differences between the four methods were negligible. However, in the case of high seismic activity, there was a notable variationintheresults.
The study was focused on assessing the seismic vulnerabilityofhighwaybridgessupportedbywallpiers. The analysis was done by nonlinear pushover analysis. The research models the nonlinear structural and material behaviour of various bridge components, includingthesuperstructure,expansionjoints,approach embankments, abutments, bearings, wall piers, footings, pile caps, and piles. It also defines failure measures for each component to evaluate their ability to withstand earthquakes. The study was conducted in the Midwestern USA, a region highly vulnerable to earthquakes.Researchersanalysed90differentwallpier bridge models, performing both transverse and longitudinal pushover analyses due to the threedimensional nature of bridges. In a transverse pushover analysis, a gradually increasing horizontal force is applied perpendicular to the bridge span, testing its resistance to lateral seismic forces. In a longitudinal pushover analysis, the force is applied parallel to the span to examine how the bridge withstands front-toback movement during an earthquake. By analysing these structural responses, the study provides valuable insights into how wall pier-supported highway bridges behaveunderseismicloads.Thefindingshelpengineers
design earthquake-resistant bridges, ensuring greater safetyanddurabilityinseismic-proneregions.
Geometrical modelling had been done by the use of AUTO CAD software and CSI Bridge v 26.1.0 software A detailed three dimensional model of I girder bridge including all curved sections for the, I girder, piers and abutments had been made by AutoCAD 2D & 3D software.Forcarryingouttheseismicanalysisofcurved I Girder Bridge of 100m length of 5 spans, CSI Bridge v 26.1.0softwarehad beenusedinthisstudy.Detailed 3d modelling of deck slab and deformation of wearing coat as well as deformation of piers was analyzed through this software. Other than these the base shears, base reaction, shear force, stresses, relative acceleration, relative displacement, relative velocity computed by the use of this software using time history method. The seismic behavior of the bridge had been checked and detailed it through graphs. CSI bridge software is very versatileandproductivefortheanalysisofdifferentkind ofbridges.
A Typical 3-Dimensional RCC I GIRDER Bridge with up to five spans consist of a continuous 100m long continuous 20meachspanwithabutment bothside had been takeninthisstudy. CSIbridgev26.1.0softwarehad been used for analyzing the seismic performance of the bridgebytheuseoftimehistoryanalysismethod.
Table-5: Geometricpropertiesofbridge
International Research Journal of Engineering and Technology (IRJET) e-ISSN: 2395-0056
Volume: 12 Issue: 02 | Feb 2025 www.irjet.net p-ISSN: 2395-0072
The I GIRDER has a seismic response defined by the earthquake forces EQ+X which had been considered in load cases and also other load cases that include a parapet wall, footpath, and wearingcoat under vertical loading.
The following figures depict the deformation modes of theIGirderBridgeunderseismicloading.
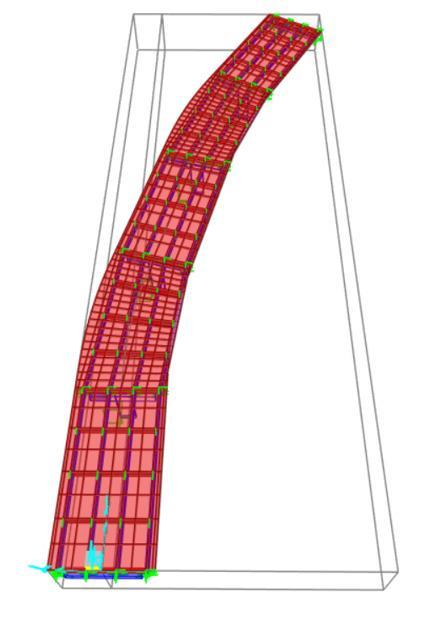
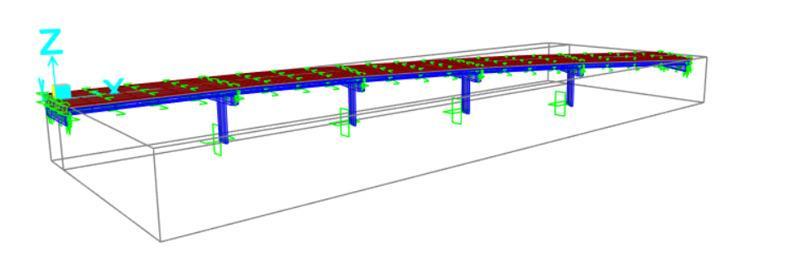
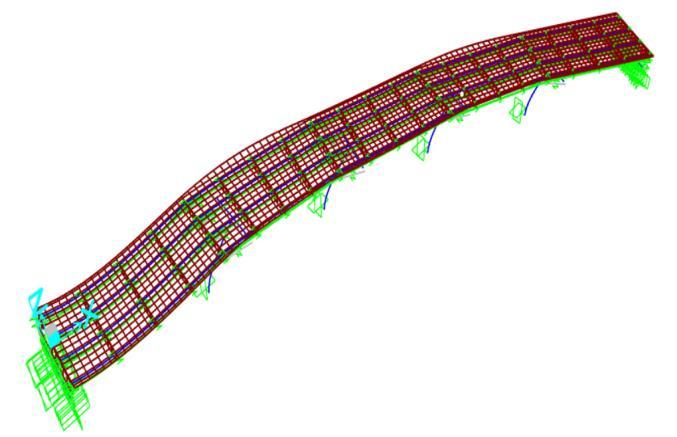
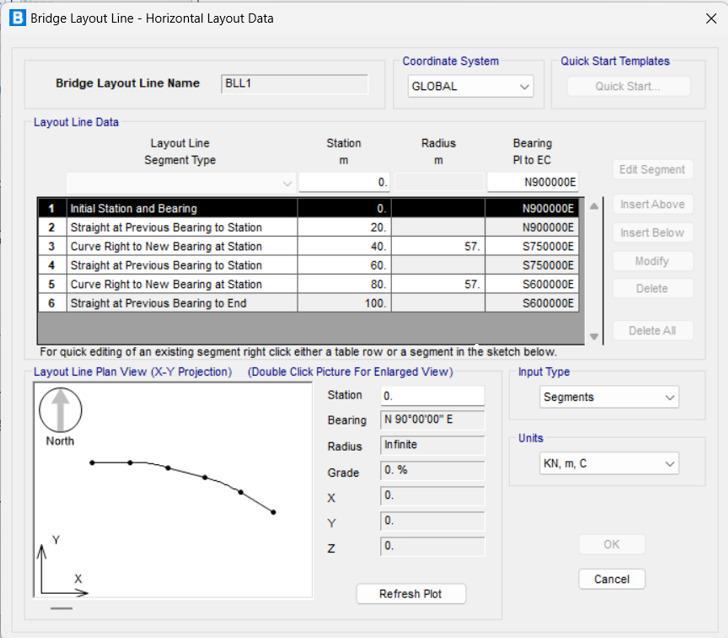
Chart-2:Horizontallayoutofbridgemodel
Thisgraphrepresentsthehorizontallayoutofthebridge model which had been made by CSI bridge v26.1.0 software. The bridge is horizontally curved of radius 57m at 40m and 80m. The total bridge length is 100m. Thebridgealignmentisnortheast.Theseismicresponse ofbridgehadbeencheckedinEQ+Xdirection.
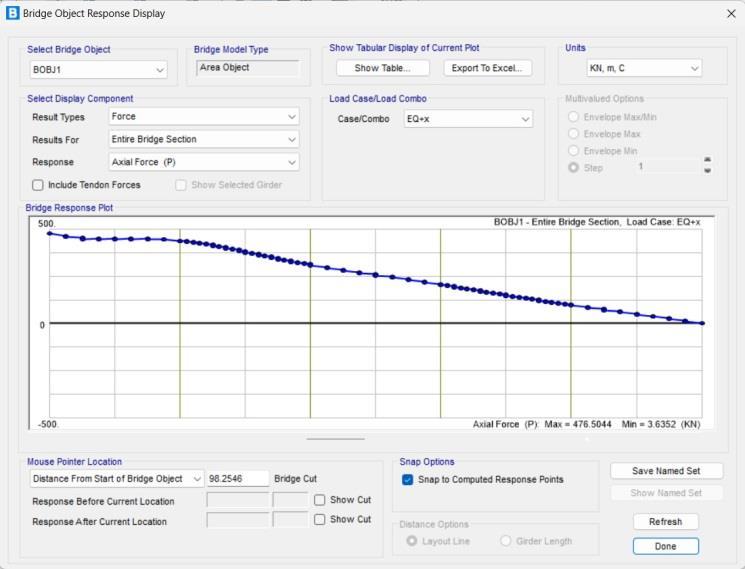
Chart-3: Graphofaxialforceinentirebridgesection
The graph represents the effect of axial force in the entire bridge section. The y- axis represents the axial force that has range between 500 to -500 KN and the xaxis represents the length of bridge. The axial force had been calculated by the software intially at 2.5m interval upto the 20m length of bridge, at 1m interval upto 40m length of bridge, again 2.5m interval fot the next 20m, 1m interval upto 80m length of bridge and last upto 100m it had been calculted at an interval of 2.5m. the
International Research Journal of Engineering and Technology (IRJET) e-ISSN: 2395-0056
Volume: 12 Issue: 02 | Feb 2025 www.irjet.net p-ISSN: 2395-0072
overall axial force on the bridge comes postive. The maximum axial force of 476.504KN comes at starting i.e at0mofthebridgeandminimum3.635KNcomesatthe endi.eat100mofthebridge.Theallaxialforceeffecton entirebridgesectionhadbeentabulatedintableno.6
Table-6: Axialforce(entirebridgesection)load case:EQ+x SR
1
2 2.5
3
4
5
6
7
8
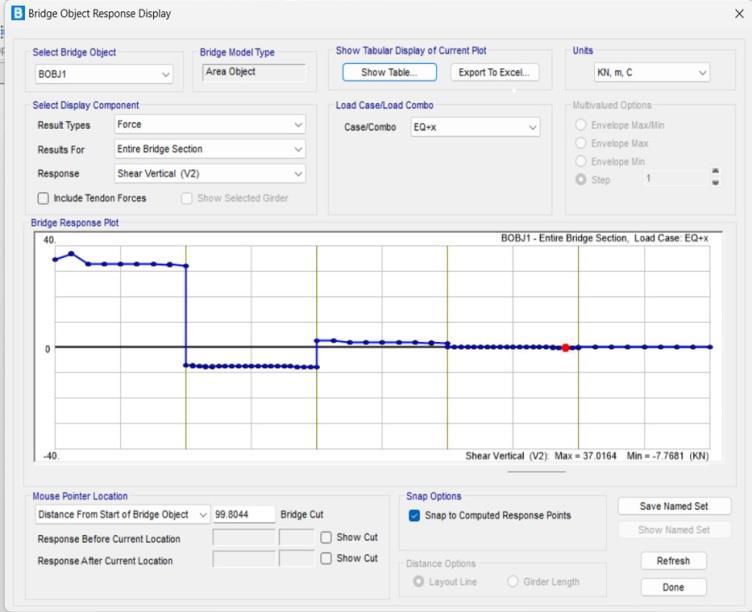
Chart-4: shearvertical(entirebridgesection)
Thegraphrepresentstheeffectofverticalshearforcein the entire bridge section. The y- axis represents the shearforcethathasrangebetween40to-40KNandthe x-axisrepresentsthelengthofbridge.Theverticalshear forcehadbeencalculatedbythesoftwareintiallyat2.5m interval upto the 20m length of bridge, at 1m interval upto 40m length of bridge, again 2.5m interval fot the next20m,1mintervalupto80mlengthofbridgeandlast
upto 100m it had been calculted at an interval of 2.5m. Theoverallverticalshearforceonthebridgecomesboth postive and negative. The maximum vertical shear force of37.016KNcomesatstartingi.eat0mofthebridgeand minimum of -7.768KN comes at the 38m section of the bridge. The negative shear vertical force comes at the rangeof20mto40msectionofthebridgemodel.Theall shear vertical force effect on entire bridge section had beentabulatedintableno.7
Table-7: shearvertical(entirebridgesection)loadcase: EQ+x
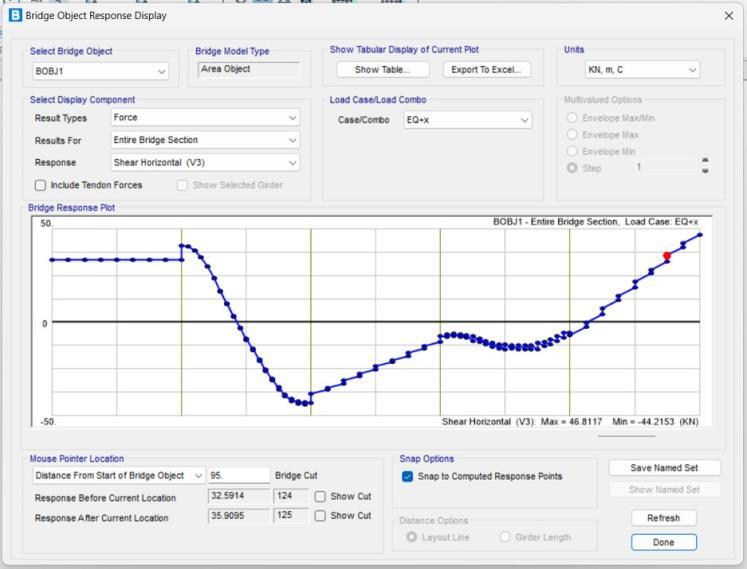
Chart-5: Shearhorizontal(entirebridgesection)
Thegraphrepresentstheeffectofhorizontalshearforce in the entire bridge section. The y- axis represents the horizontal shear force that has range between 50 to -50 KN and the x- axis represents the length of bridge. The horizontal shear force had been calculated by the
International Research Journal of Engineering and Technology (IRJET) e-ISSN: 2395-0056
Volume: 12 Issue: 02 | Feb 2025 www.irjet.net p-ISSN: 2395-0072
softwareintiallyat2.5mintervaluptothe20mlengthof bridge, at 1m interval upto 40m length of bridge, again 2.5m interval fot the next 20m, 1m interval upto 80m lengthofbridgeandlastupto100mithadbeencalculted atanintervalof2.5m.Theoverallhorizontalshearforce on the bridge comes both postive and negative. The maximum horizontal shear force of 46.811KN comes at the end i.e at 100m of the bridge and minimum of44.215KN comes at the 39m section of the bridge. The negative shear vertical force comes at the range of 29m to82.5msectionofthebridgemodel.
The all shear horizontal force effect on entire bridge sectionhadbeentabulatedintableno.8
Table-8: shearhorizontal(entirebridgesection) SR NO. Layou tline distan ce(m)
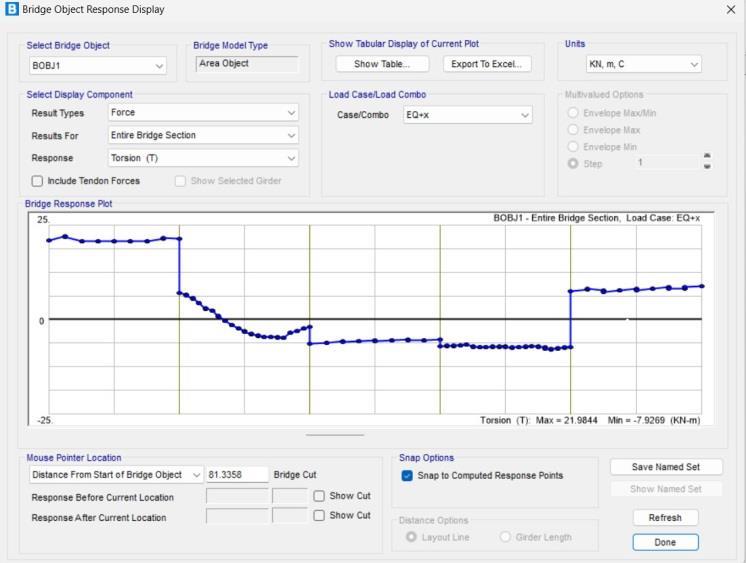
Chart-6: graphoftorsion(entirebridgesection)
The graph represents the effect of torsional force in the entirebridgesection.They-axisrepresentsthetorsional force thathas range between25 to -25 KN-mand the xaxis represents the length of bridge. The torsional force had been calculated by the software intially at 2.5m interval upto the 20m length of bridge, at 1m interval upto 40m length of bridge, again 2.5m interval fot the next20m,1mintervalupto80mlengthofbridgeandlast upto 100m it had been calculted at an interval of 2.5m. The overall torsional force on the bridge comes both postive and negative. The maximum torsion of 21.984KN-m comes initially i.e at 2.5m of the bridge section and minimum of -7.926KN-m comes at the 77m sectionofthebridge.Thenegativetorsionalforcecomes attherangeof27mto80msectionofthebridgemodel.
The torsional force effect on entire bridge section had beentabulatedintableno.9.
Table-9: Torsion(entirebridgesection)
International Research Journal of Engineering and
Volume: 12 Issue: 02 | Feb 2025 www.irjet.net
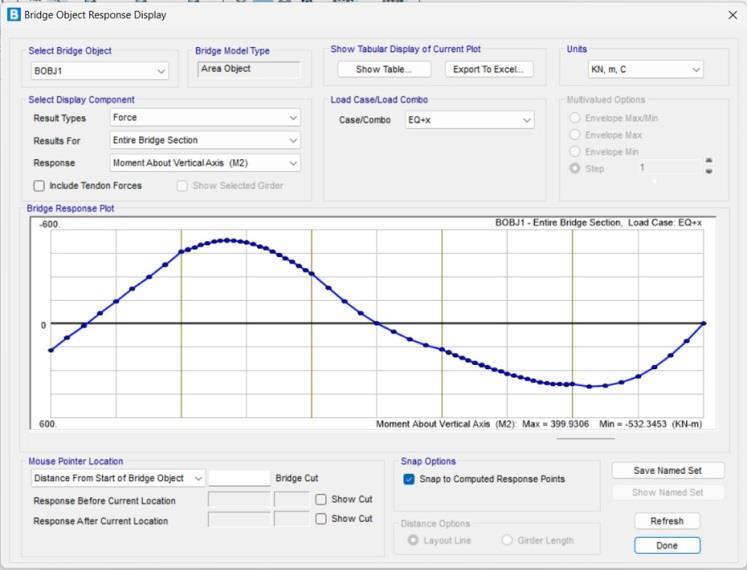
Chart-7: momentinverticaldirection(entirebridge)
Thegraphrepresentstheeffectofmomentaboutvertical axis in the entire bridge section. The y- axis represents the moment about vertical axis that has range between 600to-600KN-mandthex-axisrepresentsthelengthof bridge. The vertical moment had been calculated by the softwareintiallyat2.5mintervaluptothe20mlengthof bridge, at 1m interval upto 40m length of bridge, again 2.5m interval fot the next 20m, 1m interval upto 80m lengthofbridgeandlastupto100mithadbeencalculted atanintervalof2.5m.Theoverallmomentonthebridge comesbothpostiveandnegative.Themaximummoment of 399.930KN-m comes at intermediate portion i.e at 82.5m of the bridge section and minimum of532.345KN-m comes at the 27m section of the bridge. The negative torsional force comes at the range of 7.5m to 50m and at the end i.e at 100m section of the bridge model. The moment about vertical axis effect on entire bridgesectionhadbeentabulatedintableno.10
Table-10: verticalmoment(entirebridgesection)
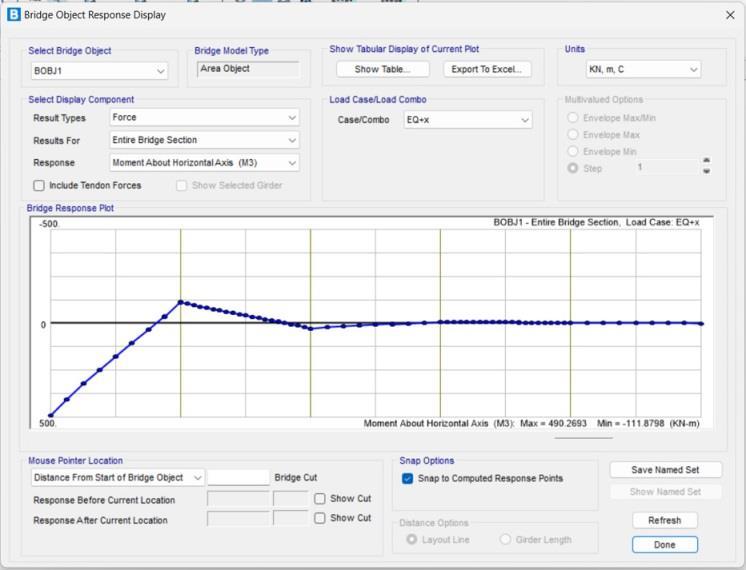
Chart-8: momentinhorizontaldirection(entirebridge)
The graph represents the effect of moment about horizontal axis in the entire bridge section. The y- axis represents the moment about horizontal axis that has range between 500 to -500 KN-m and the x-axis represents the length of bridge. The horizontal moment had been calculated by the software intially at 2.5m interval upto the 20m length of bridge, at 1m interval upto 40m length of bridge, again 2.5m interval fot the next20m,1mintervalupto80mlengthofbridgeandlast upto 100m it had been calculted at an interval of 2.5m. The overall moment on the bridge comes both postive and negative. The maximum moment of 490.269KN-m comes at starting portion i.e at 0m of the bridge section and minimum of -111.879KN-m comes at the 20m section of the bridge. The negative horizontal moment force comes at the range of 17.5m to 36m and from 57.5mto97.5msectionofthebridgemodel.
Themomentabouthorizontalaxiseffectonentirebridge sectionhadbeentabulatedintableno.11
Table-11: momentabourthorizontalaxis(entirebridge)
3
International Research Journal of Engineering and Technology (IRJET) e-ISSN: 2395-0056
Volume: 12 Issue: 02 | Feb 2025 www.irjet.net p-ISSN: 2395-0072
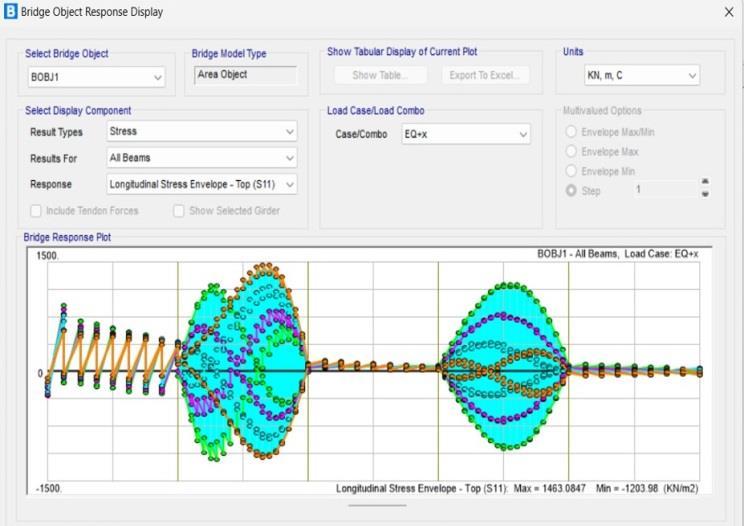
Chart-9: longitudinalstressenvelopeforallbeams(top)
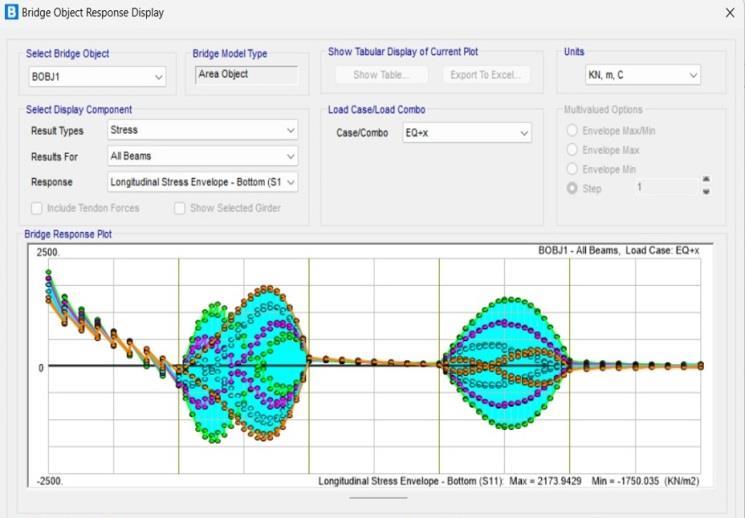
Chart-10: longitudinalstressenvelopeforallbeams (bottom)
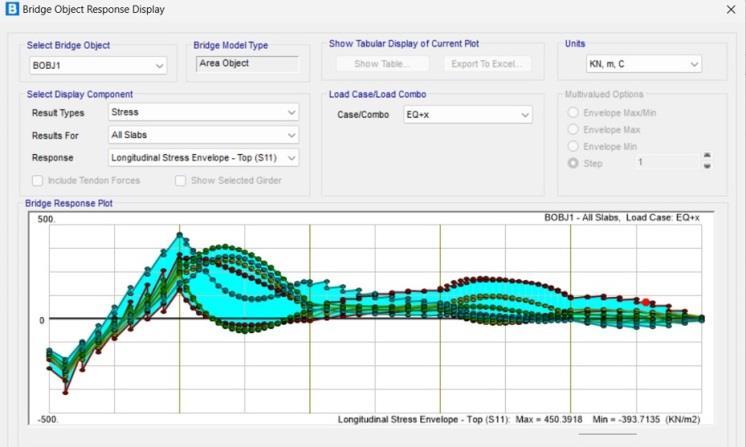
Chart-11: longitudinalstressenvelopeforallslabs(top)
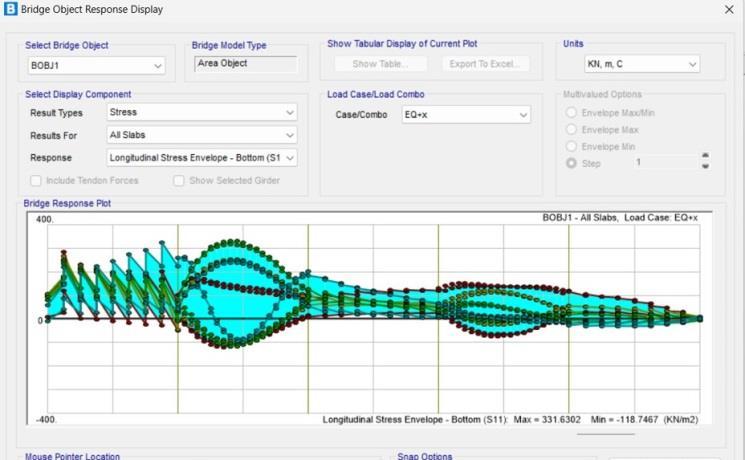
Chart-12: longitudinalstressenvelopeforallslabs (bottom)
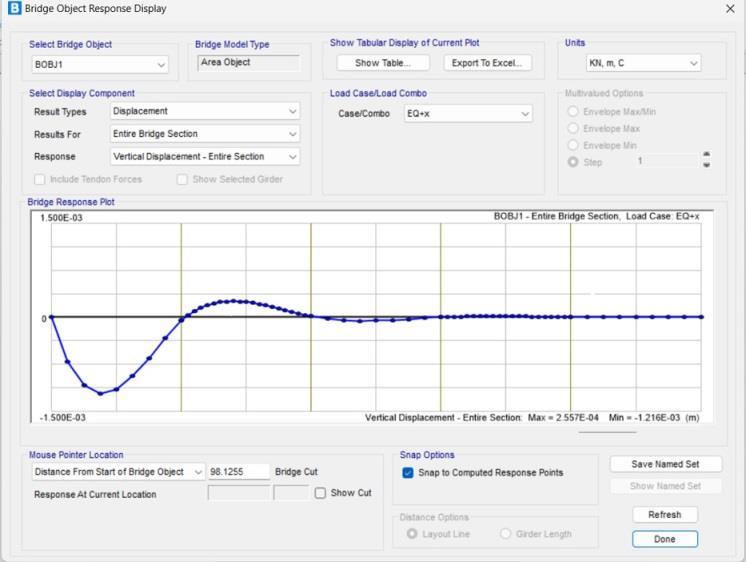
Chart-13: verticaldisplacement(entirebridgesection)
The graph represents the displacement of entire bridge section in vertical direction.The y- axis represents the vertical displacement of entire bridge section that has range between 1.5×10³ to -1.5×10⁻³m and the x-axis represents the length of bridge. The vertical displacement had been calculated by the software intiallyat2.5mintervaluptothe20mlengthofbridge,at 1m interval upto 40m length of bridge, again 2.5m intervalfotthenext20m,1mintervalupto80mlengthof bridge and last upto 100m it had been calculted at an intervalof2.5m.Theoverallverticaldisplacementinthe entire bridge section comes both postive and negative. The maximum vertical displacement of 2.557×10⁻⁴m comes at intermediate portion i.e at 28m of the bridge sectionandminimumof-1.216×10⁻³mcomesatthe22m sectionofthebridge.Thenegativeverticaldisplacement comes at the range of 2.5m to 20m and from 42.5m to 60m section of the bridge model. The vertical displacement effect on entire bridge section had been tabulatedintableno.12.
International Research Journal of Engineering and Technology (IRJET) e-ISSN: 2395-0056
Volume: 12 Issue: 02 | Feb 2025 www.irjet.net p-ISSN: 2395-0072
Table-12: verticaldisplacement(entirebridge) SR
1
2
3
4
5
6
7
8
9
11
12
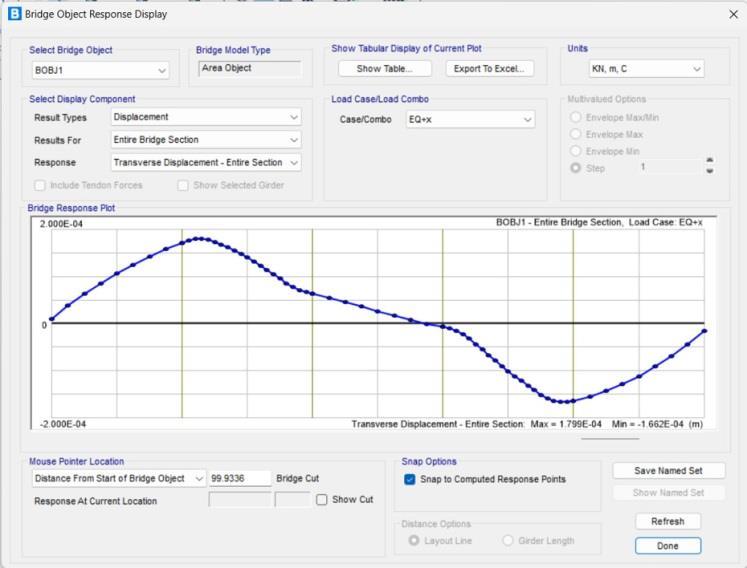
Chart-14: transversedisplacement(entirebridge)
The graph represents the displacement of entire bridge sectionintransversedirection.They-axisrepresentsthe transversedisplacementofentirebridgesectionthathas range between 2×10⁻³ to -2×10⁻³m and the x-axis represents the length of bridge. The transverse displacement had been calculated by the software intiallyat2.5mintervaluptothe20mlengthofbridge,at 1m interval upto 40m length of bridge, again 2.5m intervalfotthenext20m,1mintervalupto80mlengthof bridge and last upto 100m it had been calculted at an interval of 2.5m. The overall transverse displacement in the entire bridge section comes both postive and negative. The maximum transverse displacement of
1.799×10⁻⁴mcomesatintermediateportioni.eat22mof the bridge sectionand minimumof -1.662×10⁻⁴mcomes atthe79msectionofthebridge.Thenegativetransverse displacement comes in the range of 57.5m to 100m section of the bridge model. The vertical displacement effect on entire bridge section had been tabulated in tableno.13.
Table-13: transversedisplacement(entirebridge)
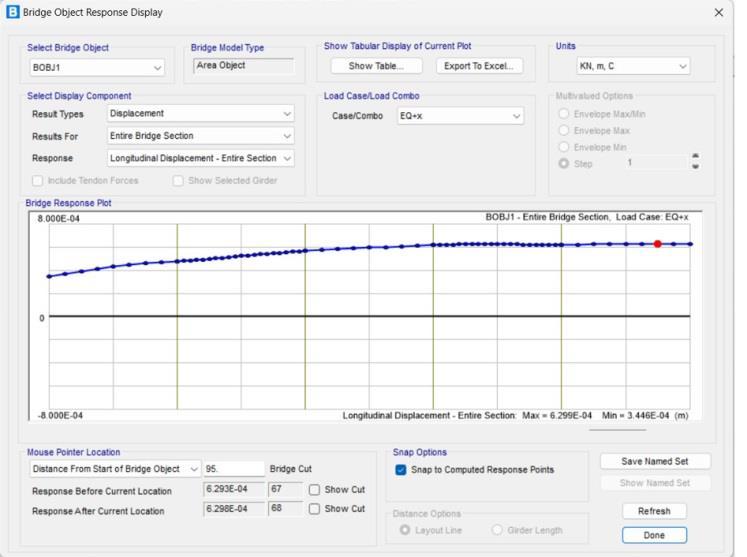
Chart-15: longitudinaldisplacement(entirebridge)
The graph represents the displacement of entire bridge section in longitudinal direction.The y- axis represents the longitudinal displacement of entire bridge section thathasrangebetween8×10-4 to-8×10⁻⁴mandthex-axis represents the length of bridge. The longitudinal displacement had been calculated by the software
International Research Journal of Engineering and Technology (IRJET) e-ISSN: 2395-0056
Volume: 12 Issue: 02 | Feb 2025 www.irjet.net p-ISSN: 2395-0072
intiallyat2.5mintervaluptothe20mlengthofbridge,at 1m interval upto 40m length of bridge, again 2.5m intervalfotthenext20m,1mintervalupto80mlengthof bridge and last upto 100m it had been calculted at an intervalof2.5m.Theoveralllongitudinaldisplacementin the entire bridge section comes postive. The maximum longitudinal displacement of 6.299×10⁻⁴m comes at almost end portion i.e at 95m of the bridge section and minimum of 3.446×10⁻⁴m comes at the starting portion i.e 79m section of the bridge. The longitudinal displacement effect on entire bridge section had been tabulatedintableno.14.
Table-14: longitudinaldisplacement(entirebridge)
SR NO Layou tline distan ce(m) Longitudin al displacem ent(m) SR NO. Layout line distanc e(m) Longitudinal displacement( m)
1 0 0.000345
2
3
4
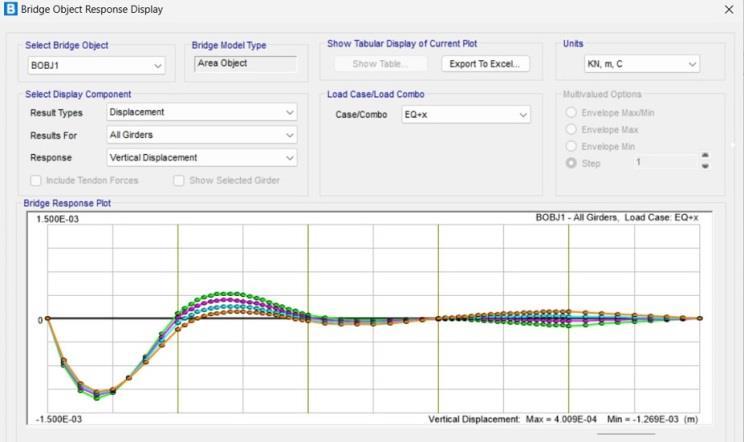
Chart-16: verticaldisplacementforallgirders
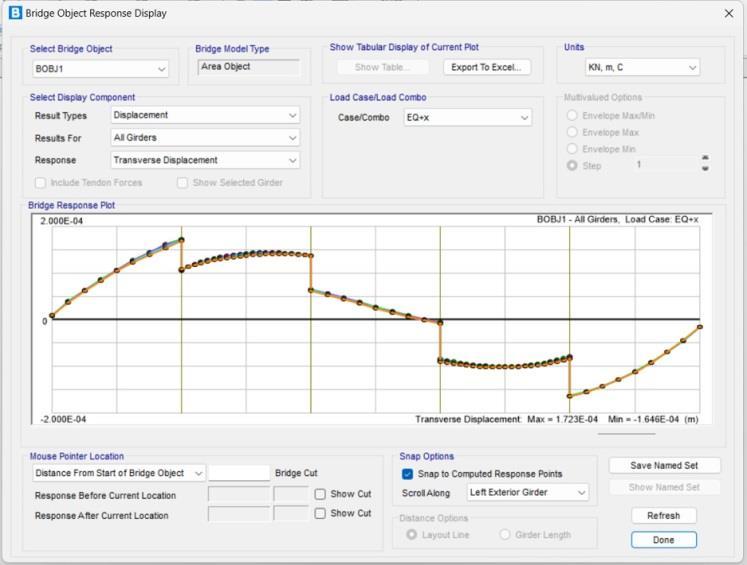
Chart-17: transversedisplacementforallgirders
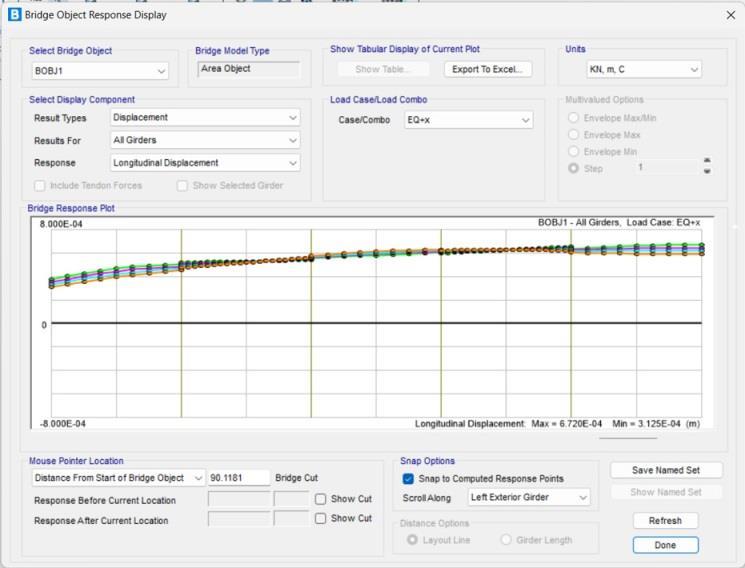
Chart-18: longitudinaldisplacementforallgirder
Thevaluesofaxialforce,verticalshear,horizontalshear, vertical moment, horizontal moment for (entire bridge section), stresses in all beams and all slabs for (longitudinal direction in top and bottom) and displacement in longitudinal, transverse and vertical direction for (entire bridge section), displacement in longitudinal, transverse and vertical direction for (all girders) have been evaluated for EQ+X components at the Entire bridge structure in this study. The outcomes are represented in the form of Graphs and tables as illustrated above. Therefore, the findings allow reaching thefollowingconclusion.
• Fromtheabovefindings, itisevidentthatthevalueof axialforcesinentirebridgesectionwaspositivethroughout the length of the bridge. The positive axial force whose maximum value 476.504KN was the positive sign for the bridge sustainability. The curve bridge is safe up to this valueofaxialforceintheentirebridgesection.
International Research Journal of Engineering and Technology (IRJET) e-ISSN: 2395-0056
Volume: 12 Issue: 02 | Feb 2025 www.irjet.net p-ISSN: 2395-0072
• Theshearforceinverticaldirectionintheentirebridge section was up to the limit whether it was positive or negative. The maximum value of 37.016KN was at the initialportionofthebridgeatthejunctionofabutmentand girder
• The longitudinal stress envelope for all beams in top section had maximum value of 1463.084 KN/m2 and minimumvalueof1203.98KN/m2
• The longitudinal stress envelope for all beams in bottom section had maximum value of 2173.94KN/m2 andminimumvalueof1750.035KN/m2 .
• The longitudinal stress envelope for all slabs in top section had maximum value of 450.391KN/m2 and minimum value of 393.713KN/m2. For the bottom section the maximum value of 331.630KN/m2 and minimumvalueof118.746KN/m2
• Theverticaldisplacementofentirebridgesectionhad maximum value of 2.5×10⁻⁴m and minimum value of 1.2×10⁻³m. Transverse displacement of entire bridge section had maximum value of 1.7×10⁻⁴m and minimum value of 1.6×10⁻⁴m. longitudinal displacement of entire bridge section had maximum value of 6.2×10⁻⁴m and minimumvalueof3.4×10-4m.
Asperthe alltheseresults theanalysisofstructurewas atsafedirection.
The main focus of the research and development is on futurescoperegardingseismicresponseanalysisforRCC (Reinforced Cement Concrete) I-girder bridges, which assumes a great dimension in seismic regions. Advanced Modelling Techniques: In addition to these methods, other computational techniques can improve theseismicresponsepredictionaccurately(forexample, finite element analysis). Except these, the other most advanced models are under development by taking into consideration nonlinear behaviour, material degradation, as well as interaction effects. Retrofitting and Strengthening: as time lapses most of the bridges falls in danger due creep loading and other environmentalfactors.So,retrofittingtechniquesneeded very much for the continuous operations of the bridge. Advance materials, like FRP and smart materials, can make aging infrastructure more resilient to seismic resistive Performance-based design: In the near future, performance-based design will take place other design criteria. It will focus on seismic loading to produce expected behavior of structures instead of compliance with prescriptive codes. Such design integrates detailed risk assessment and cost effective considerations. Seismic Isolation and Damping Systems: A new system the seismic isolation bearings and damping systems can
be used to cushion the impact of the earthquake. These systems are fast becoming part of new designs and retrofitting strategies. Monitoring and Data Acquisition: with the advancement in technology Integration of realtime monitoring systems with sensors can provide real information regarding structural performance during seismic events. Such data can add to knowledge bases and prepare bases for further designs. As per the sustainability considerations in new RCC I-girder bridge constructionandthe retrofittingof existingRCCI-girder bridges require sustainable materials and practices. Future work could consider further balancing seismic resilience with environmental effects and sustainable to the nature and people. Regulatory Frameworks: The codes and guidelines on seismic design will inevitably become obsolete as new seismic standards continue to emerge, and it would require collaboration between these different parties-including researchers, engineers, and those regulatory agencies-to render new research Climate Resilience: Since climate change amplifies seismic risks-for example through increased floodingfuture studies could integrate the various hazards into response analysis against seismic activity. International Cooperation: Global cooperation can help expand the knowledge pool and collaboration in seismic design and retrofitting at the international level, especially by combining third world and developed countries' resourcesandexperience.Insummary,seismicresponse analysis of RCC I-girder bridges can be expected to be more of an interdisciplinary approach with new technologies, materials, and methodologies to provide resiliencyagainstearthquakes.
[1.] Rašeta, A., Lađinović, Đ. and Radujković, A., 2017. The estimation of seismic performances of reinforcedconcretegirderbridgesusingnonlinear dynamic analysis. Tehnicki vjesnik/Technical Gazette, 24(2).
[2.] Deshpande, A., Jagadisha, H.M. and Galagali, A., 2017. Parametric Study on Curved Bridges SubjectedtoSeismicLoading.(4)
[3.] Farhan, M. and Tasleem, M., 2020. Pushover analysis of reinforced concrete bridge pier designed as per IRC-6 codal provision. Journal of Civil&EnvironmentalEngineering,10,p.5.
[4.] Abbasi, M. and Moustafa, M.A., 2019. Timedependent seismic fragilities of older and newly designed multi-frame reinforced concrete boxgirder bridges in California. Earthquake Spectra, 35(1),pp.233-266.
[5.] Wilson, T., Mahmoud, H. and Chen, S., 2014. Seismic performance of skewed and curved
International Research Journal of Engineering and Technology (IRJET) e-ISSN: 2395-0056
Volume: 12 Issue: 02 | Feb 2025 www.irjet.net p-ISSN: 2395-0072
reinforcedconcretebridgesinmountainousstates. EngineeringStructures,70,pp.158-167.
[6.] Bignell, J.L., LaFave, J.M. and Hawkins, N.M., 2005. Seismic vulnerability assessment of wall pier supported highway bridges using nonlinear pushover analyses. Engineering structures, 27(14),pp.2044-2063.
[7.] Chiorean, C.G., 2003, July. Application of pushover analysis on reinforced concrete bridge model. In 4thEuropeanWorkshopontheSeismicBehaviour ofIrregularandComplexStructures.
[8.] AlAyed, H.S., 2002. Seismic analysis of bridges using nonlinear static procedure. University of Maryland,CollegePark.
[9.] Pinho, R., 2007. Nonlinear dynamic analysis of structures subjected to seismic action. In Advanced earthquake engineering analysis (pp. 63-89).Vienna:SpringerVienna.
[10.] Paraskeva, T.S. and Kappos, A.J., 2010. Further development of a multimodal pushover analysis procedure for seismic assessment of bridges. Earthquake Engineering & Structural Dynamics, 39(2),pp.211-222.
[11.] Chen,J.,Han,Q.,Liang,X.andDu,X.,2017.Effectof pounding on nonlinear seismic response of skewed highway bridges. Soil Dynamics and EarthquakeEngineering,103,pp.151-165
[12.] Shatarat, N.K., 2012. Effect of Plastic Hinge Properties in Nonlinear Analysis of Highway Bridges\JordanJournalofCivilEngineering.-2012, Vol. 6, No. 4, Pp. 501-510. Jordan University of ScienceandTechnology.
[13.] Manjula,N.K.,Nagarajan,P. andMadhavan,M.T.P., 2013. A comparison of basic pushover methods. International Refereed Journal of Engineering and Science(IRJES),2(5),pp.14-19.
[14.] Standard specifications for highway bridges. 15th ed.Washington,DC:AASHTOLRFD
[15.] T.H.E.Indian, R. Congress, Standard Specifications and Code of Practice for StandardSpecifications and Code of Practice for Road Bridges, IRC 212000,pp.1–89(2000)
[16.] Seismic retrofitting manual for highway bridges. Publication FHWA-RD-94-052, FHWA, US DepartmentofTransportation,...
[17.] Agalianos A, Sakellariadis L, Anastasopoulos I (2017) Simplified method for the assessment of
the seismic response of motorway bridges: longitudinal directionaccounting for abutment stoppers.BEarthqEng15(10):4133–4162
[18.] Billah, A.H.M.M., and Alam, M.S., 2015. Seismic fragility assessment of highway bridges: a stateof-the-artreview.StructInfrastructE11(6):804–832
2025, IRJET | Impact Factor value: 8.315 | ISO 9001:2008
| Page