
International
Volume: 09 Issue: 04 | Apr 2022 www.irjet.net

ANALYSIS OF CLICKSTREAM DATA
Animesh Jain1, Ashish Kumawat2
ISSN: 2395 0056
p-ISSN: 2395-0072
1B.tech, Department of Computer science Engineering, Medi Caps University, Indore, M.P, INDIA
2Ast. Professor, Department of Computer Science and Engineering, Medi Caps University, Indore, M.P, INDIA
Abstract In a typical retail store, consumer behavior might particularly reveal a lot to the shop assistant. When it mostly comes to internet purchasing, it is impossible to observe and evaluate user behavior such as facial mimicry, objects checked or handled. In this situation, e customer clickstreams or mouse movements may mostly provide information about their purchasing habits. In this paper, we describe a methodology for analyzing e customer clickstreams and extracting information. With time, internet shopping has become a necessary component of practically every sector. From this perspective, it’s fascinating to investigate the elements that specifically encourage and kind of discourage online buying. The goal of this article particularly is to discover characteristics that influence online buying behavior. The analysis is a more important idea that aids in the prediction, processing, cleansing, and discovery of various insights. On the other hand, customer analysis works with data from an organization’s customers to kindof illustrate howthey behave and particularly perceive things concerning a given goal. At this time, evaluating consumer behavior is one of the major components of running a successful business. Through its online platform, an online store sells a variety of items. As a result, these difficulties must mostly be addressed using particularly appropriate analytical techniques and packages in conjunction with the machine learning approaches. The results of this research demonstrate how customer analysis using clickstream data can be useful to determine the next step in the business. E Commerce businesses will benefit from these insights as they can kind of predict when to have a much larger stock of a certain item when to release coupons to attract morecustomers.
1. INTRODUCTION, OBJECTIVES, AND LITERATURE REVIEW
1.1 BACKGROUND AND CONTEXT
When a person wants to buy something online from the comfort of their home, they visit the websites to order the products search for the products they wish to buy, and try to select from the many varieties of the same products.
Themajorityofthetimeshowthecustomersarevisiting the products’ page, adding it to their carts, but not purchasingthem.Theresearchstudywillconcentrateon identifying the specific issues that are primarily
influencing customers' perceptions and purchasing intentions.
Despite the company’s hard work over the years, the problem stems from customers' intentions of just browsing and not purchasing the products they want to purchase. Customers have been observed searching for and viewing many kinds of products on web platforms, even adding them to their carts. What are the reasons they are refusing to purchase those items? Several factorshavebeendiscoveredasaresultoftheconsistent inability to meet the demands of customers. The issues couldbewiththeproductquality,negativereviewsfrom previous buyers, inventories of stock, products being returned a lot, retailers abandoning the platform, and many others (Lee et al. 2019). Additionally, this consistentdropinproductavailabilityandcustomerline is affecting the loyal customer base and forcing them to turntootheroptions.
This research study aims to identify the serious underlyingfactorsthatcausecustomerstoabandontheir carts after adding items to them. The primary goal is to not only meet the customers' satisfaction with the product base but also to get the customers to buy the products which they abandon. Amazon has always focusedontheobsessionofitscustomersratherthanthe market competition. As a result, the company’s current issues with declining sales and profit are affecting its global position. Customersarethegreatestassetsofany retail business. Because customers' purchasing intentionschangeovertime,managementhasattempted to optimize products and analyze customer behavior to optimize business operations (Weingarten and Spinler, 2020). The buying intentions of customers can be identified using clickstream data and past purchasing history, which will then be analyzed using machine learningmethodology.
The goal of this research is to examine the e store visitors' behavior patterns as a powerful reference for strategizing and planning, improving services, contents, page display for better web modification, visitor behaviorpredictions,ormoremarketingstrategies.This willhelponlineretailersgainvaluableinformationabout thecutomersandtheirplatforms(LeeandKwon,2008).
1.2 MOTIVATION
Clickstream data consists of a record of a user’s activity ontheweb;Thesearethemouseclicksthatausermakes during their browsing on the web that can inform us
Volume:
about the user behavior when properly analyzed in a scientific way. These movements are a kind of online customer behavior. We can call this analysis a website crawlingorwebminingapproachtodiscoverpatternsof webnavigation,visitingpatterns,andwebcontent,fairly contrary to popular belief. By analyzing the browsing patternsofusersandtheirrelationshiptowebcontent,it is possible to rethink a web portal, website, e business, oranyweb relatedapplicationaswellasthebehaviorof users online in a major way. There are many studies on which to collect and analyze data of web portals, web content mining, review text mining, and also analysis of browsingdataintheliteratureinasubtleway.Weknow that the quality of a website and web portal is fundamental for the administrator and management of the company. In addition, we also know that adequate mining can generally produce useful results on the quality of a web page, exist as a fast performance website, its quality, and quality. As mentioned already, web usage and surfing data may be useful to figure out user behavior. Thus, in addition to the behavior of the client, a detailed client profile can also specifically be retrieved through this analysis. However, before initiating a web farming application, web operation, or sea journey analysis, one should create a model with an appropriate data warehouse. The data warehouse will essentially be at the core of the web mining model The study covers some important work on data mining techniques utilized to be used in electronic commerce, particularlycontrarytopopularbelief.
1.3 OBJECTIVES
This research study is on analyzing the e commerce websites’ customer and product base to extract meaningful insights and trends for the business. The analysis will help optimize businesses on a significant scale. This study of Clickstream data aims to execute a scientific data analysis using the machine learning methodology on the clickstream dataset. Additionally, the project will answer questions that consider the reasons behind the customers’ perception of not buying the products which they need or desire, their buying habits, and their time spent on the web. This will help obtainanapplicablestrategyforboththecustomersand the product range and help formulate further processes to tackle the business problems. This will help us improvethebusinessofthee store. Therefore, the fundamental objectives of this research studycanbelistedasfollows,
● Analysing the products generating the most revenue.
● Does the visibility of the product in the web pageaffectsthebuyingpattern?
● Understanding the surfing patterns on the web page.
● Assessing the availability of the product line as andwhenrequired.
p-ISSN:
● To understand the buying trends in different months.
● Tofindoutthesimilaritiesamongpeoplehaving thesamebuyingapproaches.
1.4 LITERATURE REVIEW
1.4.1 Clickstream Data
Analysis of clickstream data is utilitarian for processing internet data and extracting critical information. To analyzesurfertrafficinonesession,clickstreamdataisa record of online user behavior when surfing on the website or using a mobile application (Bucklin and Sismeiro,2009).Inthedigitaluniverse,clickstreamdata is utilized for modeling internet surfing, behavior, and other patterns. It gets through, depending on the complex and variable nature of online surfer behavior (Wang et al. 2017). The clickstream records the clicks that a surfer makes when visiting an online store's application on any platform whatsoever. Furthermore, clickstream data may be utilized to explain several trendsandhiddenfactorsofvisitorbuyingbehavior
Clickstream data provides a plethora of behavioral information data that records the actions of internet surfers, such as the stream of browsing clicks on a product, the number of times that product is surfed, purchasing on the website, the duration of every visit, the number of pages visited or clicks on advertisements (MoeandFader,2004).
Clickstream data is a great resource for a variety of practitioners including e commerce giants and enthusiasts, curious about understanding visitor decision making patterns. Clickstream data is digital information about the footprint of a surfer, which consists of what website traffic led the surfer to the whichwebsite,onwhichpagetheuserclickedwhichlink andsawwhichad,thetimespentbyauseronawebsite.
This service is often supplied on a website to describe how a surfer progresses from searching to purchasing any item on a certain page. When a surfer clicks on one of the links, pictures, or any other hyperlink, the information is logged. The data, however, does not includethecontentofthewebpage.Aservercollectsthis dataandstoresitonitsserverwhichallowswebsitesto log clickstream data and store it in their data warehouses (Bucklin and Sismeiro, 2009). The clickstream dataset is used to track user browsing activities for example purchase history, the order of pages visited, page visit duration, page surfing by time, and other useful information (Bucklin and Sismeiro, 2003, 2009; Moe, 2003; Sakar et al. 2019). Another sort of clickstream research looks into the user purchasing modelasitrelatestowebsitetrafficandvisitorbehavior.
International
Volume: 09 Issue: 04
Apr 2022 www.irjet.net
Wilson (2010), Olbrich and Holsing (2011), Nottorf (2014),SuandChen(2015).
1.4.2 Feature Selection
Inmachinelearningmethodology,featureselectionis an essential pre processing method for data engineering andattributeselectionisusedtopreparedatasetsbefore they are used (Garca et al. 2015). The process of obtaining the appropriate features that are the most usefulinordertopickmorerepresentativefeatureswith improved discriminative power for the initial dataset is calledfeatureselection(Duetal.2019).
When dealing with supplied data that has numerous big features and a significant number of input variables, featureselectionisutilitarian(Kumar,2014).Processing data with multiple characteristics is highly difficult during machine learning for data processing, especially with huge volumes of data, noisy data, or other redundant data which might not be useful (Taha and Bampoulidis,2019).
In certain study domains, data sets might comprise of hundreds of input attributes to predict a target class. Some features might be useful, while others may be just useless.Itisinappropriatetoforecastthetargetclass.As aresult,featureselectionisaproblem solvingtechnique for selecting a limited sample of relevant and representative characteristics while maintaining accuracy of predicting the correct classes. Make a
prediction based on all of the data sets. When working with supplied data that has a high number of multidimensional multi input characteristics, feature selectioniscritical(Kumar,2014).
Processing data with multiple input attributes is extremely difficult, especially when dealing with machine learning calculations with big data quantities, noisy data, or redundant data (Taha and Bampoulidis, 2019).
Because feature noise can have an impact on prediction outcomes, its goal is to remove non representative features from the overall dataset as certain variables (Iguyon and Elisseeff, 2003). When evaluating huge dimensional data, having too many characteristics includedcanproduceissues(Doughertyetal.2009;Hua
©
e ISSN: 2395 0056
p-ISSN: 2395-0072
et al. 2009). Only the traits that boost performance the mostareincludedinthefeatureselection,resultinginan accuratepredictor(IguyonandElisseeff,2003).
This feature selection of data can fasten training in the machine learning process, enhance predicted accuracy afterdroppingirrelevantfeaturesandpreventthemodel from overfitting by picking correlated features. Its objective is to remove characteristics that are not representative ofthedata setsincenoiseinthefeatures mightimpair predictionoutcomes(IguyonandElisseeff, 2003).
Iftherearetoomanycharacteristics,itcanleadtolarge dimensional data analysis challenges in any instance (Dougherty et al. 2009; Hua et al. 2009). To develop a good forecast, only the qualities that deliver the largest growth in performance are included in the selection process (Iguyon and Elisseeff, 2003). This feature selection process to pre process data can speed up and enhance machine learning model building, provide better and more accurate predictions after removing unrelated features, and mitigate the overfitting in selectingrelevantfeatures.
1.4.3 K-Means Clustering Algorithm
The k means algorithm is an unsupervised machine algorithm, which makes different clusters by grouping the unlabelled dataset. The k in the K means algorithm defines the number of predefined clusters that need to becreatedwhilethealgorithmworks.

It is an iterative machine learning algorithm that differentiates and divides the unlabelled dataset into k number of clusters in such a way that each data point belongs to a single group having some specific properties.
It is an algorithm based on centroids, where each the clustersisassociatedwithacentroid.Themaintaskthat this algorithm does is to minimize the sum of distances betweenthedatapointandtheircorrespondingclusters.
Thealgorithmworksinthefollowingmanner:firstly,we have to select the value for K to decide the number of clusters, then the algorithm selects the random K points or centroids, then it assigns each data point to their closestcentroid,whichwillformthepredefinedclusters, afterthisthevarianceiscalculatedandthenewcentroid is calculated and placed in each cluster, now the step of assigning the data points to the centroids is repeated.
Now, the step to calculate the variance and again reassigning occurs, and the algorithm finds the defined numberofclusters.
How to choose the value of “K number of clusters” in K means clustering?
The efficiency of the K means clustering algorithm dependsontheformationofhighlyefficientclustersthat
International Research Journal of Engineering and Technology (IRJET) e ISSN: 2395 0056
Volume: 09 Issue: 04 | Apr 2022 www.irjet.net
it identifies and group together. The selection of the optimal value of K is a big task. There are some ways to findouttheoptimal valueofKforthegivendataset,but the most appropriate method to find the number of clustersorKvalueistheElbowMethod.
Elbow Method
The elbow method is the most appropriate and one of thepopularwaystofindtheoptimalnumberofclusters. ThistechniqueusedtheconceptofWCSS(WithinCluster SumofSquares,whichgivesthetotalvariationswithina certain cluster. To measure the distance between the data points and the centroids we can use any f the methodssuchasManhattendistanceorEuclideandistae.
To find the optimal value of clusters, the elbow method followsthebelowsteps:

o Itexecutesthe K meansclusteringalgorithmon thedataset fordifferentvaluesofK(inrange1 10).
o For every value of K, it calculates the WCSS value.
o Plots a curve between calculated WCSS values andthenumberofclustersK.
o The pointof bend ora pointoftheplot appears to be like an arm, then that point is considered thebestvalueofK.
1.4.4 PCA
Many variables' dimensions are frequently present in large data sets. It is feasible to minimize the number of variables while maintaining the majority of the information in the original data collection. There are several shrinking approaches available for this purpose, with principal component analysis being the most extensively utilized (Everitt, Brian S.; Howell, David C. (2005)). Assume you have an n dimensional vector ‘x’ having ‘p’ random variables and wish to crunch the dimensionality from p to q. The principal component analysisisbasedontheassumptionthatthereisnopast
p-ISSN: 2395-0072
associationandcallsthelinearcombinations1x,2x,...,qx, with consistently maximum data variability as principal components. Solving this optimization problem shows that vectors a1, a2, ..., aq , are the eigenvectors of the matrix S of the data corresponding to the q largest eigenvaluesc(Everitt,BrianS.;Howell,DavidC.(2005))
These eigenvalues provide the variance of each component, and the ratio of the sum of the first q eigenvalues to the sum of the variances of all p input variables is the ratio of the total variance of the original data set described. by the first q principal component (Everitt, Brian S.; Howell, David C. (2005)). This seemingly simple idea has many subtleties and surprisingly many uses. Pearson, on the other hand, previously gave a geometric derivation of the same approach. This technology has been widely available with the explosion of electronic computers (Everitt, Brian S.; Howell, David C. (2005)). The amount and variety of data types and applications has increased dramatically on a huge scale. Each year, over 1000 papers provide significant analyses or, in a little less common term, essential insights as keywords or headlines. The PCA abbreviation will be used, which encompassesbothversions.
Covariance and correlation
The amount and variety of data types and applications have increased fast. Currently, over 1000 publications peryearusekeyanalysisor,inalittlelesscommonterm, important insights as keywords or headlines. We shall usethePCAabbreviation,whichincorporatesbothtypes.
Finding the linear combinations, the standardized variables will maximize variance while remaining uncorrelatedwithprevious linearcombinationsandwill yield principal components already defined by the eigenvalues and eigenvectors of the correlation matrix rather than the covariance matrix of the original variables (Everitt, Brian S.; Howell, David C., 2005). Covariance based PCA may be appropriate when all variables are measured in the same units; nevertheless, eveninthisinstance,suchresearchmaybeunproductive (Everitt,BrianS.;Howell,DavidC.(2005)).
This occurs when the variances of a few variables are much greater than the variances of the rest. In such cases, the first few components are dominated by high variance variables and tell us little that the original variances cannot. Certain scenarios call for covariance based PCA, although they are rare (Everitt, Brian S.; Howell, David C. (2005)). The vast majority of PCAs in use today are correlation based. Any method would be adequateinourcircumstances(Everitt,BrianS.;Howell, David C. (2005)). The findings presented above are based on the correlation matrix, but because the variances of all 10 tests are identical, the results of a covariance basedanalysiswouldbecomparable.
© 2022, IRJET | Impact Factor value: 7.529 | ISO 9001:2008 Certified Journal | Page3865
Figure 2: Elbow method.
Volume:
How many components
We've spoken about how the q main components account for the vast majority of variation in the p variables. What exactlydo wemean by"most," andhow doweselecthowmanycomponentstokeepintotal?On this issue, there is a considerable corpus of literature. The most straightforward way is to choose a threshold, say80%,and stop when thefirst q components account for a proportion of total variance more than that threshold (Everitt, Brian S.; Howell, David C. (2005)). In this instance, the first two components accounted for just 59% of the volatility. We usually want more than this 70to90percentiscommon,butitmightbemore or lower depending on the context of the dataset. Other solutions rely on eigenvalue values or the differences betweenconsecutiveeigenvalues.
Normalization Constraints
The primary component can be multiplied by any constant without affecting its meaning. To address the maximizing problem that leads us to primary components, we must apply a normalizing constraint. Wecanrenormalizeafteridentifyingthecomponentsby multiplying by a constant. At least two other kinds of normalizations may be significant (Everitt, Brian S., and DavidC.Howell,2005).A,whereAisthektheigenvalue, can be found on occasion in PCA output from the computer. The element in correlation based PCA is the correlationbetweenthevariableandthekthcomponent. Normalization is less prevalent, although it may be beneficialinsomecases,suchasfindingoutliers.
2. DATA SET DESCRIPTION AND TECHNOLOGY REVIEW.
2.1 CLICKSTREAM DATASET
The dataset
We utilized a dataset from the Kaggle data source. The collection comprises clickstream data from an online businessthatsellsapparelforpregnantwomen.Thedata are from the five months of 2008 and contain, among other things, product category, placement of the photo onthewebsite,IPaddresscountryofsessionorigin,and product selling price in US dollars. (ŕapczyń ski M., Białowąs S. (2013)). Each column in the dataset is a product bought by a customer. The dataset has 165474 rows of data with 14 variables. It has been collected by allrelevantdataprotectionlaws.
Size of the dataset: Thedatasethas165474rowsand14columns.
Attributes of the dataset:
p-ISSN: 2395-0072
1. YEAR: Thedataisrecordedonlyforcertainmonthsof the same year so the value of the YEAR column is the sameinalltherowsi.e.,2008.
2. MONTH: Thisvariablecontainsthe month numberin which the product was bought on the platform. It has values ranging from 4(April) to 8(August). This is a categoricalvariable.
3. DAY: This variable has the day on which the product was bought by the customer. It ranges from 1 to 31 for the number of days in a month. This is an ordinal variable.
4. ORDER: This variable contains the total number of clicks during one session of a user on the platform. It is numericaldata.
5. COUNTRY: Variableindicatingthecountryoforiginof theIPaddresswiththefollowingcategories: Australia, Austria, Belgium, British Virgin Islands, The CaymanIslands,ChristmasIsland,Croatia,Cyprus,Czech Republic, Denmark, Estonia, Unidentified, Faroe Islands, Finland, France, Germany, Greece, Hungary, Iceland, India, Ireland, Italy, Latvia, Lithuania, Luxembourg, Mexico, Netherlands, Norway, Poland, Portugal, Romania, Russia, San Marino, Slovakia, Slovenia, Spain, Sweden, Switzerland, Ukraine, United Arab Emirates, United Kingdom, USA, biz (.biz) 44 com (.com), Int (.int) 46 net(.net),org(*.org).
6. SESSION ID: Variable indicating session id (a short record).AsessionIDisauniquecodeassignedbyaweb server to a specific surfer for the duration of their visit (session) to the website. Session IDs are stored as cookies, form fields, or Uniform Resource Locators (URLs). Some web servers simply increment a static numbertogeneratethesessionID.However,mostofthe web servers use algorithms that include more sophisticated techniques, such as tracking even the variables such as the date and time any surfers visit the website,alongwithothervariablesdefinedbytheserver administrator. Each time a web user clicks on a particularlinkofawebsite,anewsessionIDisassigned. Closing and reopening the browser and revisiting the sitecansometimesgenerateanewsessionID.
7. PAGE 1 (MAIN CATEGORY): This variable is concerned with the main product category. It has four categories. 1 trousers 2 skirts 3 blouses 4 sale
8. PAGE 2 (CLOTHING MODEL): Itcontainsinformation about the product code for each product. There are a
of Engineering and Technology (IRJET)
Volume: 09 Issue: 04 | Apr 2022
total of 217 products in the dataset. All these products have a unique product id associated with the respected product.
9. COLOUR: Itdescribesthecoloroftheproduct.
beige
black
blue
brown
burgundy
blue
ofmanycolors
olive
pink
red
violet
white
10. LOCATION: Onthewebpageofthewebsitethereare locations on which the picture of the product is displayed. This variable deals with the location of the picture on the page, the webpage has been divided into sixparts:
topleft
topinthemiddle
topright
bottomleft
bottominthemiddle
bottomright
11. MODEL PHOTOGRAPHY: Any product on a website hastohaveavisualdescription.Thispicturehasamodel wearing the product. This variable depicts the visual descriptionofthetwocategories:
1 Onlyface
Profile
12. PRICE:PriceofproductinUSdollars.
13. PRICE 2: This is the variable informing about the price of a particular product being higher than the averagepricefortheentireproductcategory.
1 yes 2 no
14. PAGE: A website contains several pages to display theinformationandproducts.Thisvariablewillindicate towhichpagethesoldproductbelongs.Thisvariablehas valuesrangingfrom1to5.
2.2 TECHNOLOGY REVIEW
Analyzing and examining the clickstream stream data requires the processing of a generally large amount of data ina prettybig way.Thiscanmostlybeachievedby fairly many technologies today which are used for
ISSN: 2395 0056
p-ISSN: 2395-0072
handlinglargedatasetsinamajorway.Inthispaper,we have used python for conducting the analysis of the dataset, kind of contrary to popular belief. Python is a high level general purpose and interpreted programming language. Its design philosophy uses significantindentationtoemphasizereadability.
The language has constructs and its use object oriented approacharedesignedtoparticularlyhelpprogrammers essentiallywritecleanandlogicalscriptsfora smalland pretty large project in a huge way. Python specifically hasdynamictypingandgarbagecollection,orsotheyfor the most part though. It particularly supports fairly several programming paradigms, including structural (especially procedural), object oriented, and functional programming.
Python kind of is a kind of great language for data analysis,primarilykind ofduetoitsfantasticecosystem of data driven Python packages. Pandas generally are one of those packages that specifically make importing andanalyzingdatamucheasierinaprettybigway.
ThePythonprogramminglanguagehasestablisheditself as one of the most popular languages in scientific computing in a subtle way. Its high level interactive nature and growing ecosystem of scientific libraries for the most part make it an attractive choice for algorithm development and exploratory data analysis (Dubois, 2007;MilmannandAvaizis,2011).
However, as a general purpose language, it particularly is increasingly used not only in really academic institutions but also in industry in a major way. The python libraries used for data analysis, feature engineering, and KNN are NumPy, matplotlib, seaborn, pandas, scikit learn, and all this kind of is done in an IPythonnotebookinafairlymajorway.
NumPy
NumPy, stands for Numerical Python. It is the best packageforconductingscientificcomputinginPythonit provides a much faster and efficient data structure multidimensional array object. This object can be used with the inbuilt functions in NumPy for performing the element to element calculations like matrix multiplication on arrays or math operations between arrays. It has a well engineered library that has all the tools for reading, manipulating and writing data arrays to the device’s hard drive. Mostly all the linear algebra operations can be performed using NumPy. It can even be used to calculate Fourier transforms, and generation ofrandomnumbers.
In addition to the quick array and processing facilities thatNumPybringstoPython,thekeydataanalysisgoals are passed across algorithms. NumPy arrays are far handierfornumericdata.Howtostoreandmanagedata more effectively than the other built in Python data erection functions. Libraries built in low level languages
© 2022, IRJET | Impact Factor value: 7.529 | ISO 9001:2008 Certified Journal | Page3867
International
Volume: 09 Issue: 04 | Apr 2022 www.irjet.net
suchasCorFortranmayeasilyworkwithdatastoredin NumPyarrayswithouthavingtotransferdata.
Pandas
Pandas has within itself many rich data structures and features built to work with Structured data is fast, easy, and expressive. The pandas have methods to describe manipulate,import,analyse,andevenvisualisethedata. Asyoucansee,it’soneoftheimportantcomponentsthat generally make Python a powerful and high performing data mining environment in a self sufficient way. The main object in pandas used for the most part, is a DataFrame,atwo dimensional,column oriented,tabular data structure with row and column labels in a subtle way. pandas provide really rich data structures and features designed to work with: Structured data is fast, easy,andexpressiveinakindofbigway.Asyoucansee, it'soneoftheimportantcomponents that make Python a powerful and high performing data miningenvironment,orsotheyspecificallythought.The mainobjectinpandasusedthroughoutthisbookkindof is a DataFrame, which is a two dimensional, column oriented,tabulardatastructurehavingrowsandcolumn, similartoaMicrosoftexcelsheet.
Matplotlib
Matplotlibismostwidelyusedandmostpopularlibrary in python for creating graphs and other 2D data visualizations. It is perfect for creating such stories that are well suited for publication. It integrates pretty well withIPythontoprovideamuchuser friendly,interactive environment for building visualisations and perform exploratorydataanalysis.
Seaborn
Seaborn is a Python package for generating statistical graphs. It has a high level interface with matplotlib and istightlyintegratedwith pandas’inbuiltdatastructures. TheSeabornlibraryfunctionsprovideadeclarativedata oriented API that converts data requests into graphs of theirresponses.Seabornmechanicallymapsinformation values with visual characteristics such as colour, size or style after running datasets and plotting specifications, generatinginternaltransformationstatisticsandplotting decorations with useful axis labels and annotations. Manyseafunctionscangeneratenumbersbycomparing conditional subsets of information or concatenating completelyseparatevariablesina data set.Thepurpose of seaborn is to be useful throughout the life of a scientificenterprise.Seabornsupportsrapidprototyping and exploratory data analysis by building complete graphs from a single function call with the fewest parameters.
It can also be used to generate high quality polishing figures by providing a variety of customization options as well as rendering the underlying matplotlib objects. TheSeabornpackageprovidesaninterfacetomatplotlib
© 2022, IRJET
Technology (IRJET) e ISSN: 2395 0056
p-ISSN: 2395-0072
that enables rapid visual prototyping and statistical exploration while maintaining most of the power and balance required for graphic post production. Great quality.Itiscommonlyusedinthefieldandcanbeused to display many types of data sets that can be saved as tables.
IPython
IPythonisapartofthestandardPythonscientifictoolkit for research that interconnects everything together. It provides a quite reliable and efficient environment for interactive and exploratory computing. IPython is a modified Python wrapper to speed up code generation, testing, and debugging, especially convenient for interactive work. Matplotlib is used for data visualization. IPython is commonly used in most Python operations, such as code execution, debugging, and testing.
Aside from the standard terminal based IPython shell, theprojectalsoprovides
•AHTML notebookforconnectingtoIPythonthrougha commandlineandawebbrowser.
•AQt basedGUIframeworkconsolewithinlineplotting, multilineediting,and syntaxhighlighting
•Aninfrastructureforefficient,accurate,andinteractive parallelanddistributedcomputing
Due to all these qualities, we have chosen a jupyter notebooktoservethepurposeofIPythonforthispaper.
Scikit-learn
Scikit learn is a Python module that integrates a great range of modern machine learning algorithms, and methodsforsupervisedandunsupervisedmedium scale problems. This package focuses primarily on bringing machine learning to non experts using high level general purpose languages. Particular attention is paid to its easy nature of use, its high performance, rich documentation,andhighAPIconsistency.Ithasminimal to zero dependencies and is distributed under a simplified BSD license, making it suitable for both academic and commercial purposes (arXiv:1201.0490 [cs.LG]).
Scikit learn leverages its rich Python environment to provide modern implementations of many widely used machine learning algorithms and methods while maintaining a very user friendly interface integrated tightl
y within the Python language libraries. It meets the growing demand for statistical data analysis through descriptive and beautiful visualizations by non specialistsaswellasspecialistsinthesoftwareandweb industriesaswellasnon computersciencefieldssuchas chemistry,biology,orphysics.
Impact Factor value: 7.529
ISO 9001:2008 Certified Journal
Page3868
Volume: 09 Issue: 04
Apr 2022
Scikit learn is different from all the other machine learning tools in Python for many reasons: i) it contains compiled code for efficiency, unlike MDP (Zito et al., 2008) and My Brain (Schaul et al., 2010), iii) unlike pymvpa (Hanke et al., 2009), which has optional dependencies like R and shogun, easy deployment only relies on NumPy and scipy and focuses on imperative programmingasopposedtomybrainworkingwithdata flowframework.
3. ANALYSIS
3.1 FEATURE SELECTION AND ENGINEERING
Thecolumnswhichwewilluseforthisanalysisare:
1. MONTH: Thisvariablecontainsthe month numberin which the product was bought on the platform. It has values ranging from 4(April) to 8(August). This is a categoricalvariable.

2. DAY: This variable has the day on which the product wasboughtbythecustomer.Itrangesfrom1to31asfor the number of days in a month. This is an ordinal variable.
3. PAGE 1 (MAIN CATEGORY): This variable is concerned with the main product category. It has four categories.
Why these 5 features?
2395
p-ISSN: 2395-0072
Thefeatureswereselectedonthebasisoftheobjectives andtheusabilityofthefeaturestoanswerthequestions.
trousers
4 sale
4. PRICE:PriceofproductinUSdollars.
5. PAGE:Awebsitecontainsseveralpagestodisplaythe information and products. This variable will indicate to which page the sold product belongs. This variable has valuesrangingfrom1to5.
Selecting features such as year, order, session ID, colour, location, price 2 and model photography did not help in extracting any kind of useful insights that may help in the business optimization. These features contain information that is not useful for this analysis. The feature column year has the year of the sale of that particular product, but all the data is from a single year, thatis,2008.Hence,thisfeatureisnotusable.Thefeature column order contains the number of clicks per session before buying the product which does not provide any substantial information that can be used. Similarly, the features session ID, location, price 2 and model photography have information that cannot be used to servethepurposeifthisanalysis.
PCA
Principal component analysis is a statistical approach used to reduce the dimensionality of the dataset. It uses somethingcalledorthogonaltransformationtoconverta set of datapoints of possibly correlated features to a set of values that is linearly uncorrelated variables. These variables are called principal components. It is preferablyusedasadimensionalityreductiontechnique.
Working
PCA performs component analysis on a scaled dataset. Toapply PCA to our dataset wehave topre processour dataandmakeitscaled.Scalingcrunchesallthefeatures’ valuesintoarangeof0to1.Afterperformingscalingon ourdataset,westartbyinstantiatingaPCAmodelobject, then find the principal components by using the fit method on the object, then apply the rotation to it and then finally dimensionality reduction by applying transform()onthesameobject.Wecanalsospecifyhow manycomponentstohaveintheinitializationofthePCA object. We have selected to have only two components fromthemaindataset.

Volume:
Number of Principal Components
An indispensable part of using PCA is the ability to estimate the number of components that are needed to describe the data. The number of components can be describedbylookingatthe plotofcumulativeexplained varianceasthefunctionofthenumberofcomponents. Thiscurvein figure 4 indicatesthequantificationofhow much of the total ,14 dimensional variance is contained withinthefirstNcomponents.Here,wecanseethatfirst 6 components contain approximately 80% of the variance, while we need around 9 components to describecloseto100%variance.

Conclusion
After conducting the PCA we found that our dataset can be differentiated into a smaller number of components successfully. We have successfully reduced the number offeaturevariables.Thisreduced dimensiondatasethas 2featuresbutwecannotdifferentiatethedatapointson these two components and hence it cannot be used to make clusters. The Scree plot indicates the number of components should be 6 or 7 but we cannot realise 7 components in a 3D space, we need 7 dimensions to realiseit.
we
have to perform aggregate descriptive analysis on the dataset. once we have the big picture we can move furtherinouranalysis.
Firstly,weanalyzeddataonanaggregateleveltocheck out for any correlations that we can use to extract meaningful insights and use them to serve our purpose ofbusinessoptimization.
This correlation heatmap tells us all about the inter dependability of the feature variables in the dataset. Session ID and month are strongly correlated. Model photography and price are negatively correlated. The yearfeatureisofnouseasithasasinglevalue.Priceand pageareslightlynegatively correlated.Price2andprice areshowingastrongnegativecorrelation.Otherfeatures shownosuchcorrelation.

Wenowhavetohaveacloserlookatthedifferenttrends and try to analyse the trends they may follow to make thebestuseofthedataavailabletous.
Figure 4: Scree plot.
Wecanseethatwehavenotextractedanyusefulresults from the PCA we have performed on our data. This may be because of the reason that the principal component analysis works better when the features are highly correlated and we don’t have much high correlation betweenany ofthevariables,thereforepca isnotuseful toreducethedimensionsofthedataset.
3.2 EXPLORATORY DATA ANALYSIS
To explore the data, we have to find out the trends by lookingatthe big pictureof thetrendsin thedata.After looking at the big picture we can dive deeper into the features modifying them and using them to serve our purpose.Tolookatthetrendsfromawiderperspective
Composition of sales by month
April has the highest slice in our pie chart. This means thatmostitemsweresoldinApril.MayfollowsApriland hasa21.6%shareinthetotalsalesonthewebsite. June,July,andMayhaveaminutedifferenceinthe percentage of sales. They are in the descending order May,JulythanJune.

Volume:
April particularly has the most sales, while August has thefewest;August,though,appearstobeunusuallylow may the statistics for that month be incomplete in a pretty big way. Finally, it’s worth checking each month justtomakesurewehaveacompletelistofdatesandto track sales trends as they develop, kind of contrary to popularbelief.
So, it appears that August generally is missing data, as just roughly 70% month’s data is missing. This data cannot be imputed and we cannot afford to randomize ourdatabecauseitmayintroducesomeanomaliesinthe trendsthatweareworkingtofindout.
Sales and months by days.


When we tried to analyze the sales on each day in April bygroupingthedataontheaggregatevalues.


In the first 4 days of the month, the sales are high, and then the trend is similar throughout the month. A trend isrepeatedinafixedintervalofdaysthismaybedueto
the delay in restocking the products in the company warehouse and using this analysis the company will be able to predict when to restock to make the maximum sales. April may have either sort of confusing or
p-ISSN:
incomplete data perhaps cumulative data from March mostlyspilledintoApril,whichisfairlysignificant. Then we built a similar plot for the next month. The month of May has a similar trend as of April after neglecting the first four days. However, the average numberofsalesislessthanthatofthesame.Thehighest numberofsalesinMayisabout1400andthatofAugust isabout1900.
p-ISSN:

august will follow a similar trend as its available data is showing. We can see that till the 12th day of the month the data is available and suddenly on the 13th day it abruptlystopped,havingtoofewvalues.


When someone has to buy something, they have that productinmindmorethan90%ofthetime.Wecanuse this feature to understand which kind of clothing do peopleprefertowearfromApriltoAugust.
This can help in restocking and availability of more varietiesoftheproductbasedoncustomerpreference. Product and sales
When the plot of the cost is grouped by the items and visualized on a count plot, we see that Skirts have the greatest average cost, whilst goods on sale have the lowest price. How many of each item sells, and how muchmoneydotheybringin?

Conductingthesameanalysisonthenextmonthswecan concludethatitseemsthatsalespeakatthebeginningof eachmonthandsignificantdropasthemonthcontinues. However, April is the only month that follows this general trend exactly, with the rest of the months remaining relatively for all intents and purposes stable inamajorway.
When the data of the month of august was visualized, it madepossibleoutliersvisible.Thedataforthemonthof augustismissingsowearenotabletostronglycomment onanytrend.Althoughitmayseemlikethemonthof
Figure 14: Average cost of each clothing item
Toanswerourquestions,wetriedtolookdeeplyintothe correlations between the type of product and different categories.Asskirtshavethegreatestprice,theyarethe leastsolditem,albeitbyalittlemargin.Skirtsarethe second most profitable item in terms of sales dollars. Trousers sell the most pieces and create the most

Volume:
revenue, with substantially more sales and dollars separating trousers from the next closest item. People maybelookingatskirtsandnotbuyingthemduetothe averagehighprice.Thepriceofskirtsshouldbereduced orsomecouponsshouldbereleasedfortheitem specific typetomakepeoplebuymoreskirts.Thismayhavetwo outcomes. If the skirts are bought in the same number evenafter decreasingthecost,itmay result ina loss for thebusiness.Ontheotherhand,ifourprediction is true and people buy more skirts, we will sell more skirtsthananyotherproduct. Sale items sell significantly more than blouses or skirts but produce the fewest dollars in sales because of the loweraverageprice. Skirts,onaverage,havethehighestprice,whereasitems on sale, intuitively, have the lowest price, or so they essentially thought. How many of each item essentially dotheysell,andhowgenerallymuchprofitdotheybring ininaparticularlybigway.
Page and sales.
Intermsofaverageprice peritem,page5isthemedian page, with pages 1 and 2 having a higher average price per item and pages 3 and 4 having a pretty much lower sort of average price per item, which generally is quite significant. Page 2 has almost the best kind of average price per item, rather than page 1, whereas page 3 for themostparthasgenerallyhadthelowestaverageprice per item, which is quite significant. Was this done on purpose,basicallycontrarytopopularbelief?

Is this to kind of persuade customers to buy on page 1
p-ISSN:

a major way? Should they literally reap the benefits of thepage3bargainsbeforethepriceskindofgoupordo theygenerallyloseinterest, orsothey thought? Instead, product placement could essentially have been more arbitrary.
We can suggest the company make proper use of the website and introduce more products on the website which may make people look at the pages which come later.
These pages might have better products than the other pages but people tend to buy products early on due to lazinessormaybeduetothedeterioratingqualityofthe
becausepage2isasortoflittlesortofmoreexpensivein
productsonsubsequentpages.
The general overall number of sales by page and the money earned per page seems to have a similar distribution let's mostly take a kind of deeper look: Page 1 accounts for the kind of the largest share of revenueandsales,withthefirstpageaccountingforwell
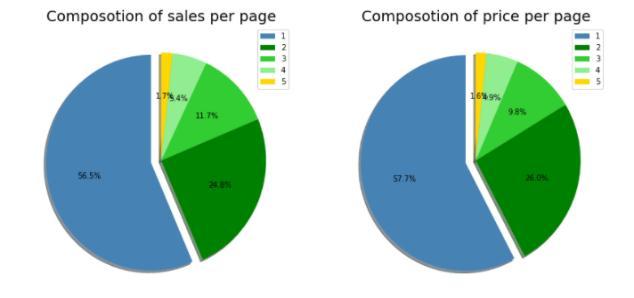
over half of all sales and pages 1 and 2 accounting for over 80% of each, which mostly is fairly significant. Customers who encounter an item they like and generally decide to particularly buy it rather than specificallycontinueexploring,forthemostpart,aretwo possible explanations that may contribute to this, which generallyisfairlysignificant.Tooptimizesales,themore


Technology
e ISSN: 2395 0056
Volume: 09 Issue: 04 | Apr 2022 www.irjet.net
popular an item is, the pretty much closer it travels to page1.
3.3 CLUSTERING

To find some of the insights using K means clustering whichisanunsupervisedalgorithmwetakethevariable page1 and apply the algorithm to find out clusters and plot them to visually interpret the results. The first step
in this process is to standardize the data which is done using the standard scaler function of the scikit learn library. Standard scaler standardizes the features by removingthemeanandscalingtounitvariance.Thenwe fitthemodelandthenpredictthepossibleclustersinthe data.
To find the correct value of the K in the K means clustering we need to plot the elbow graph which is nothingbutthewithinclustersumofsquaresagainstthe number of clusters. In the figure 20 we can clearly see that at the value 3 on the x axis the plot has a sudden

bend,thisvalueistheoptimalvalueforKinourdataset. Using this K value, we will fit the data in the K means clustering algorithm and then predict the clusters in the data.
Wehavesuccessfullyidentifiedtheclustersbasedonthe price of the products and the products. We can see in figure20thatthereare3clustersformedonthefeature page1. These three clusters imply that there are 3
© 2022, IRJET
p-ISSN: 2395-0072
buying patterns based on the products and the price of theproducts.
4. CONCLUSION
Accordingtothedataandstatisticalanalysiswecaninfer several important findings of patterns of sales of products and customer buying trends on the E commercewebsite:
Thetrendsinsalesobservedaccordingtomonthsisthat a peak in sales occurs in April, and then it declines slightly in the following months. The data for August is incomplete, but as observed, there is an evident decline in selling trends with and without the data for August monthincluded.
The observable trends in sales infer that there is a peak in the sales at the beginning of the month, and then it declines slightly over the month. Once we make amendments to the incomplete data and possible confounders,thetrendofsalesisfoundtobemorestable over a month. If we look at the price at which each productissold,ithasbeenobservedthatskirtshavethe highest average price out of all goods. While looking at whichproductsellsthemost,itisfoundthattrouserssell the highest number of units and generate the most dollarsinsalesbyasignificantmargin.Salesitemsbring in the least money but generate more sales than either blousesorskirts.Pagelistingisasfollows Pages1and2 havethehighest priceditemsandaccountfor over80% of all sales and dollars. Page 5 accounts for the fewest sales,butitisunknownifithasasmanyitemsshownas pages 1 4. Page 3 has the least expensive items of all pages.
5. REFERENCES
[1]. Apichottanakul,A.,Goto,M.,Piewthongngam,K.,and Pathumnakul, S., 2021. Customer behavior analysis based on buying data sparsity for multi category products in pork industry: A hybrid approach. Cogent Engineering, 8(1),p.1865598.
[2]. Barari, M., Ross, M., Thaichon, S. and Surachartkumtonkun, J., 2021. A meta‐analysis of customer engagement behavior. International Journal of ConsumerStudies, 45(4),pp.457 477.
[3]. Chalupa,S.andPetricek,M.,2020.UsingTechnology and Customer Behavior Characteristics to Improve HotelSalesPerformance. TEMJournal, 9(2),p.573.
[4]. Kanavos, A., Iakovou, S.A., Sioutas, S. and Tampakas, V., 2018. Large scale product recommendation of supermarket ware based on customer behavior analysis. Big Data and Cognitive Computing, 2(2), p.11.
[5]. Kumar, A., Salo, J., and Li, H., 2019. Stages of user engagementonsocialcommerceplatforms:Analysis withthenavigationalclickstreamdata. International journalofelectroniccommerce, 23(2),pp.179 211.
[6]. Lee, C.K.H., Tse, Y.K., Zhang, M. and Ma, J., 2019. Analyzing online reviews to investigate customer
Impact Factor value: 7.529
ISO 9001:2008 Certified Journal
Page3874
International Research Journal of Engineering and Technology (IRJET) e ISSN: 2395 0056
Volume: 09 Issue: 04 | Apr 2022 www.irjet.net p-ISSN: 2395-0072
behavior in the sharing economy: The case of Airbnb. Information Technology& People.
[7]. Micu, A., Micu, A.E., Geru, M., Căpățînă, A. and Muntean, M.C., 2021. THE IMPACT OF ARTIFICIAL INTELLIGENCEUSEONE COMMERCEINROMANIA. The AMFITEATRU ECONOMIC journal, 23(56), pp.137 137.
[8]. Noviantoro, T. and Huang, J.P., 2021. APPLYING DATA MINING TECHNIQUES TO INVESTIGATE ONLINE SHOPPER PURCHASE INTENTION BASED ON CLICKSTREAM DATA. Review of Business, Accounting, &Finance, 1(2),pp.130 159.
[9]. Sharma, S. and Rai, M., 2017. Customer Behavior Analysis using Web Usage Mining. Int J Sci Res Comput Sci Eng, 5(6),pp.47 50.
[10]. Weingarten, J. and Spinler, S., 2020. Shortening Delivery Times by Predicting Customers’ Online Purchases: A Case Study in the Fashion Industry. Information SystemsManagement,pp.1 22.
[11]. ŕapczyń ski M., Białowąs S. (2013) Discovering Patterns of Users' Behaviour in an E shop Comparison of Consumer Buying Behavior in Poland and Other European Countries, “Studia Ekonomiczne―, nr 151, “La société de information: perspective européenne et global: Les usages et les risques d'Internet pour Les citoyensetLesconsommateurs―,p.144 153
[12]. Everitt, Brian S.; Howell, David C. (2005). Encyclopedia of Statistics in Behavioral Science || Principal Component Analysis. , (), doi:10.1002/0470013192.bsa501
[13]. Dennis Koehn, Stefan Lessmann, Markus Schaal, Predicting Online Shopping Behaviour from Clickstream Data using Deep Learning, Expert Systems With Applications (2020), DOI: https://doi.org/10.1016/j.eswa.2020.113342
[14]. Gökhan SøLAHTAROöLU, Hale DÖNERTAùLI, AnalysisandPredictionofE Customers’Behaviorby Mining Clickstream Data, 2015 IEEE International ConferenceonBigData(BigData).
[15]. Tri Noviantoro, Jen Peng Huang, APPLYING DATA MINING TECHNIQUES TO INVESTIGATE ONLINE SHOPPER PURCHASE INTENTION BASED ON CLICKSTREAM DATA. College of Business, Southern Taiwan University of Science and TechnologyTainanCity,Taiwan
[16]. Apăvăloaie, E. I. (2014). The impact of the internet on the business environment. Procedia EconomicsandFinance,15,951 958.
[17]. Baati, K., & Mohsil, M. (2020). Real Time Prediction of Online Shoppers’ Purchasing Intention Using Random Forest. In IFIP International Conference on Artificial Intelligence Applications andInnovations(pp.43 51).Springer,Cham.
[18]. Chen, D., Sain, S. L., & Guo, K. (2012). Data miningfortheonlineretailindustry:Acasestudyof RFM model based customer segmentation using
data mining. Journal of Database Marketing & CustomerStrategyManagement,19(3),197 208.
[19]. Chung, H. M., & Gray, P. (1999). Data mining. Journal of management information systems, 16(1), 11 16.
[20]. Clifton, B. (2012) Advanced Web Metrics with Google Analytics. Available at: http://www.amazon.com/Advanced Web Metrics Google Analytics/dp/1118168445. Dougherty, E. R., Hua, J., and Sima, C. (2009). Performance of feature selection methods. Current genomics, 10(6), 365 374.Du,J.,Rong,J.,Michalska,S.,Wang,H.,& Zhang, Y. (2019). Feature selection for helpfulness prediction of online product reviews: An empirical study.PloSOne,14(12),1 26.
[21]. Fawcett, T. (2006). An introduction to ROC analysis, Pattern Recognition Letters, 27(8), 861 874.
[22]. Fernández, A., García, S., Luengo, J., Bernadó Mansilla, E., & Herrera, F. (2010). Genetics based machinelearning for ruleinduction: state of the art, taxonomy, and comparative study. IEEE Transactions on Evolutionary Computation, 14(6), 913 941.
[23]. Karegowda,A.G.,Manjunath,A.,S.&Jayaram,M. A. (2010). Feature subset selection problem using wrapper approach in supervised learning. InternationalJournalofComputerApplications,1(7), 13 17.
[24]. Ketjie, Mawardi, C. V., & Perdana, J. N. (2020). Prediction of credit cards using the Naïve Bayes method and C4.5 algorithm. IOP Conference Series: MaterialsScienceandEngineering,1007(1),012161.
[25]. Premchaiswadi, Wichian; Romsaiyud, Walesa, 2012. Extracting WebLog of Siam University for LearningUserBehavioron MapReduce,Proceedings of 4th International Conference on Intelligent and Advanced Systems (ICIAS) and A Conference of World Engineering, Science and Technology Congress.
[26]. Senecal, S., Kalczynski, P. J., & Nantel, J., 2005. Consumers Decision making process and their online shopping behavior: A clickstream analysis. JournalofBusinessResearch,58,1599 1608.
[27]. Hu, Jia, Zhong, Ning, 2008. Web farming with clickstream International Journal Of Information Technology&DecisionMaking,7(2),291 308.
[28]. Ting, I Hsien; Kimble, Chris; Kudenko, 2009. Daniel,FindingUnexpectedNavigationBehaviourIn Clickstream Data For Website Design Improvement, JournalOfWebEngineering,8(1),71 92.
[29]. Detlor B.,2000. The corporate portal as information structure: Towards a framework for portal design. International Journal of Information Technology.
[30]. Graniü A., Mitroviü I.& Maranguniü N., 2011. Exploring the usability of web portals: A Croatian
© 2022, IRJET | Impact Factor value: 7.529 | ISO 9001:2008 Certified Journal | Page3875
International Research Journal of Engineering and Technology (IRJET) e ISSN: 2395 0056
Volume: 09 Issue: 04 | Apr 2022 www.irjet.net p-ISSN: 2395-0072
case study. International Journal of Information Technology.
[31]. Lin, C.J. & Lu, H.,2000. Towards an understanding of the behavioral intention to use a web site. . International Journal of Information Technology.
[32]. Domingues, Marcos Aurelio; Soares, Carlos; Jorge, Alipio Mario.2013. Using Statistics, Visualization And Data Mining For Monitoring The Quality Of Meta Data In Web portals, Information Systems And E Business Management, 11(4), 569 595.
[33]. Randolph E. Bucklina, Catarina Sismeirob, a Peter W. Mullin Professor. Click Here for Internet Insight: Advances in Clickstream Data Analysis in Marketing. UCLA Anderson School, 110 Westwood Plaza,LosAngeles,CA90095,USAbSeniorLecturer, Imperial College Business School, Imperial College, London,UK.
[34]. Taha A.A., Bampoulidis A., Lupu M. (2019) Chance influence in datasets with a large number of features. In: Haber P., Lampoltshammer T., Mayr M. (eds) Data Science Analytics and Applications. SpringerVieweg,Wiesbaden.
[35]. Isabelle Guyon, Andre Elisseeff. An Introduction toVariableandFeatureSelection.JournalofMachine LearningResearch3(2003)1157 1182.
6. APPENDICES
APPENDIX I – The dataset used in this paper.
Size of the data set: The data set has165474rowsand14columns.
Attributes of the dataset:
1. YEAR: The data is recorded only for certain months forthesameyearsothevalueoftheYEARcolumnis the sameinalltherowsi.e.,2008.
2. MONTH: Thisvariablecontainsthe month numberin which the product was bought on the platform. It has values ranging from 4(April) to 8(August). This is a categoricalvariable.
3. DAY: This variable has the day on which the product wasboughtbythecustomer.Itrangesfrom1to31asfor
the number of days in a month. This is an ordinal variable.
4. ORDER: This variable contains the total number of clicks during one session of a user on the platform. It is numericaldata.
5. COUNTRY: Variableindicatingthecountryoforiginof theIPaddresswiththefollowingcategories: Australia, Austria, Belgium, British Virgin Islands, The CaymanIslands,ChristmasIsland,Croatia,Cyprus,Czech Republic, Denmark, Estonia, Unidentified, Faroe Islands, Finland, France, Germany, Greece, Hungary, Iceland, India, Ireland, Italy, Latvia, Lithuania, Luxembourg, Mexico, Netherlands, Norway, Poland, Portugal, Romania, Russia, San Marino, Slovakia, Slovenia, Spain, Sweden, Switzerland, Ukraine, United Arab Emirates, United Kingdom, USA, biz (.biz) 44 com (.com), Int (.int) 46 net(.net),org(*.org).
6. SESSION ID: Variable indicating session id (a short record).AsessionIDisauniquecodeassignedbyaweb server to a specific surfer for the duration of their visit (session) on the website. Session IDs are stored as cookies, form fields, or Uniform Resource Locators (URLs). Some web servers simply increment a static numbertogeneratethesessionID.However,mostofthe web servers use the algorithms that include more sophisticated techniques, such as tracking even the variables such as date and time any surfers visit on the website,alongwithothervariablesdefinedbytheserver administrator. Each time a web user clicks on a particular link of website, a new session ID is assigned. Closing and reopening the browser and revisiting the sitecansometimesgenerateanewsessionID.
7. PAGE 1 (MAIN CATEGORY): This variable is concerned with the main product category. It has four categories. 1 trousers 2 skirts 3 blouses 4 sale

8. PAGE 2 (CLOTHING MODEL): Itcontainsinformation about the product code for each product. There are a total of 217 products in the dataset. All these products have a unique product id associated with the respected product.
9. COLOUR: Itdescribesthecolouroftheproduct. 1 beige 2 black 3 blue
brown
burgundy
gray
© 2022, IRJET | Impact Factor value: 7.529 | ISO 9001:2008 Certified Journal | Page3876
Volume: 09 Issue: 04 | Apr 2022
blue
manycolors
white
10. LOCATION: Onthewebpageofthewebsitethereare locations on which the picture of the product is displayed. This variable dealswith the
locationofthepictureonthepage,thewebpagehasbeen dividedintosixparts:
1 topleft
2 topinthemiddle
topright
bottomleft
bottominthemiddle
bottomright
11. MODEL PHOTOGRAPHY: Any product on a website hastohaveavisualdescription.Thispicturehasamodel wearing the product. This variable depicts the visual descriptionofthewithtwocategories:
1 Onlyface
Profile
12. PRICE:PriceofproductinUSdollars.
13. PRICE 2: This is the variable informing about the price of a particular product being higher than the averagepricefortheentireproductcategory.
1 yes
no
14. PAGE: A website contains several pages to display theinformationandproducts.Thisvariablewillindicate towhichpagethesoldproductbelongs.Thisvariablehas valuesrangingfrom1to5.
Why these 5 features?
Thefeatureswereselectedonthebasisoftheobjectives andtheusabilityofthefeaturestoanswerthequestions. Selecting features such as year, order, session ID, colour, location, price 2 and model photography did not help in extracting any kind of useful insights that
© 2022, IRJET
ISSN: 2395 0056
p-ISSN: 2395-0072
may help in the business optimization. These features containinformationthatisnotusefulforthisanalysis.
The feature column year has the year of the sale of that particular product, but all the data is from a single year, thatis,2008.Hence,thisfeatureisnotusable.
Thefeaturecolumn order containsthenumberofclicks per session before buying the product which does not provideanysubstantialinformationthatcanbeused.
Similarly,thefeatures session ID, location, price 2 and model photography have information that cannot be usedtoservethepurposeifthisanalysis.
APPENDIX II - The source code.
importpandasaspd importnumpyasnp importseabornassns importmatplotlib.pyplotasplt %matplotlibinline
df=pd.read_csv("e shopclothing2008.csv",sep=';') df.head(10)
sns.displot(data=df,x='price',kind='hist',bins=10) df.shape df.info()
csdf=df[['month','day','page1(maincategory)','price', 'page']]
csdf = csdf.rename(columns={'month':'Month', 'day':'Day','page1(maincategory)':'Type','price':'Price', 'page':'Page'})
csdf.Type=csdf.Type.replace({1:'Trousers',2:'Skirts',3: 'Blouses',4:'Sale'})
csdf.Month = csdf.Month.replace({4: 'April', 5: 'May', 6: 'June',7:'July',8:'August'}) csdf.head()
by_month=csdf.Month.value_counts() by_month.plot(kind='bar',color=['purple','black','black',' black','orange'])
plt.xlabel('Months') plt.ylabel('Numberofproductssold') plt.title('Numberofproductssoldeachmonth') plt.show()
aug=csdf.loc[csdf['Month']=='August'] april=csdf.loc[csdf['Month']=='April'] may=csdf.loc[csdf['Month']=='June'] june=csdf.loc[csdf['Month']=='June'] july=csdf.loc[csdf['Month']=='July']
aug_day=aug['Day'].value_counts() april_day=april['Day'].value_counts() may_day=may['Day'].value_counts() june_day=june['Day'].value_counts() july_day=july['Day'].value_counts()
Impact Factor value: 7.529
9001:2008
Journal
Page3877
Volume:
april=pd.DataFrame(april_day)
april.reset_index(inplace=True) may=pd.DataFrame(may_day) may.reset_index(inplace=True)
june=pd.DataFrame(june_day) june.reset_index(inplace=True)
july=pd.DataFrame(july_day)
july.reset_index(inplace=True) aug=pd.DataFrame(aug_day) aug.reset_index(inplace=True)
fig, axs = plt.subplots(nrows=3, ncols = 2, figsize=[14,18])
#sns.lineplot(x=april['index'],y=april['Day']) axs[0,0].bar(april['index'],april['Day'],color='slateblue') axs[0,0].set_title('Salesperdayinapril')
axs[0,1].bar(may['index'],may['Day'],color='teal') axs[0,1].set_title('Salesperdayinmay')
axs[1,0].bar(june['index'],june['Day'],color='cadetblue') axs[1,0].set_title('Salesperdayinjune') axs[1,1].bar(july['index'],july['Day'],color='brown') axs[1,1].set_title('Salesperdayinjuly')
axs[2,0].bar(aug['index'],aug['Day'],color='wheat') axs[2,0].set_title('Salesperdayinaugust') by_month_4=by_month['April':'June'] axs[2,1].bar(by_month_4.index,by_month_4.values,color =['tan','black','black','black'])
axs[2,1].set_title('salespermonthApriltoJuly') plt.show()
df_grp_mnth=csdf[['Month','Price']].groupby('Month').su m()
df_grp_mnth.head() plt.pie(df_grp_mnth.Price,explode=[0.1,0,0,0,0],shadow= True, startangle=90, colors=['olive', 'khaki', 'salmon', 'lightseagreen','springgreen'],autopct='%1.1f%%') plt.legend(df_grp_mnth.index,title='Months',loc=(1,.5)) plt.show()
df_grp_type_avg=csdf[['Type','Price']].groupby('Type').m ean() df_grp_type_avg
fig,ax=plt.subplots(figsize=[14,6])
ax.bar(df_grp_type_avg.index, df_grp_type_avg.Price, color = ['dimgrey', 'dimgrey', 'orangered', 'dimgrey'], alpha=.8)
ax.set_title('AverageCostofClothingType',fontsize=18) plt.show()
total_types=csdf.Type.value_counts() df_grp_type_sum=csdf[['Type','Price']].groupby('Type').s um()
df_type=df_grp_type_sum
p-ISSN: 2395-0072
df_type['Total']=total_types df_type['Average']=df_grp_type_avg['Price'] df_type=df_type.rename(columns={'Price':'Value'}) df_type
fig, axs = plt.subplots(nrows=2, ncols = 2, figsize=[14, 12])
axs[0,0].bar(df_type.index,df_type.Total, color=['gray','gray','gray','crimson'],alpha=.8)
axs[0,0].set_title('ItemsSoldbyType',fontsize=18) axs[0,1].bar(df_type.index,df_type.Value, color=['gray', 'gray', 'gray', 'mediumspringgreen'], alpha=.8)
axs[0,1].set_title('Total Sales Amount by Type', fontsize=18)
axs[0,1].set_ylabel('USD,inMillions')
axs[1,0].pie(df_type.Total, explode=(0, 0, 0, 0.05), autopct='%1.1f%%', shadow=True,startangle=90, colors=['lightgray','gray','dimgray','crimson'])
axs[1,0].axis('equal')
axs[1,0].set_title("ShareofSalesperType",fontsize=18) axs[1,0].legend(df_type.index, title="Clothing Type", loc="upperright")
axs[1,1].pie(df_type.Value, explode=(0, 0, 0, 0.05), autopct='%1.1f%%', shadow=True,startangle=90, colors=['lightgray', 'gray', 'dimgray', 'mediumspringgreen'])
axs[1,1].axis('equal')
axs[1,1].set_title("Share of Total Sales in Dollars per Type",fontsize=18)
axs[1,1].legend(df_type.index, title="Clothing Type", loc="upperright")
plt.show() csdf.corr()
page_count=csdf.Page.value_counts()
df_grp_page_avg=csdf[['Price','Page']].groupby('Page').m ean() df_grp_page_sum=csdf[['Price','Page']].groupby('Page').s um()
df_page=df_grp_page_sum df_page['Average']=df_grp_page_avg df_page['Pages']=page_count
df_page
sns.barplot(x=df_page.index,y='Average',data=df_page) plt.title('AveragePriceofitemsperPage') plt.show()
sns.barplot(x=df_page.index,y='Price',data=df_page) plt.title('TotalDollarsworthofitemssoldperpage')
International
of Engineering and Technology (IRJET) e ISSN: 2395 0056
Volume: 09 Issue: 04 | Apr 2022 www.irjet.net p-ISSN: 2395-0072
plt.show()
sns.barplot(x=df_page.index,y='Pages',data=df_page) plt.title('Noofitemssoldperpage') plt.show()
fig,ax=plt.subplots(nrows=1,ncols=2,figsize=[14,7])
ax[0].pie(df_page.Pages, explode=(0.1, 0, 0, 0, 0), autopct='%1.1f%%', shadow=True,startangle=90, colors=['steelblue','green','limegreen','lightgreen', 'gold'])
ax[0].legend(df_page.index)
ax[0].set_title('Composotion of sales per page',fontsize=20)
ax[1].pie(df_page.Price, explode=(0.1, 0, 0, 0, 0), autopct='%1.1f%%', shadow=True,startangle=90, colors=['steelblue','green','limegreen','lightgreen', 'gold'])
ax[1].legend(df_page.index)
ax[1].set_title('Composotion of price per page',fontsize=20) plt.show()
fromsklearn.preprocessingimportStandardScaler scaler=StandardScaler() df_pca=df.drop(['year','page 2 (clothing model)','price_cat','price'],axis=1) scaler.fit(df_pca)
df_pca.head() scaled_df=scaler.transform(df_pca) scaled_df
fromsklearn.decompositionimportPCA
pca=PCA().fit(scaled_df)
plt.plot(np.cumsum(pca.explained_variance_ratio_)) plt.xlabel('numberofcomponents') plt.ylabel('cumulativeexplainedvariance')
pca=PCA(n_components=2) pca.fit(scaled_df) x_pca=pca.transform(scaled_df) y=df['price_cat'].values y=np.array([int(i)foriiny])
fig,axes=plt.subplots(1,2)
axes[0].scatter(scaled_df[:1000,0], scaled_df[:1000,1], c=y[0:1000])
axes[0].set_xlabel('x1')
axes[0].set_ylabel('x2')
axes[0].set_title('BeforePCA')
axes[1].scatter(x_pca[:1000,0], x_pca[:1000,1], c=y[0:1000])
axes[1].set_xlabel('PC1')
axes[1].set_ylabel('PC2') axes[1].set_title('AfterPCA') plt.show()
fromsklearn.datasetsimportmake_blobs fromsklearn.clusterimportKMeans scaleddf=pd.DataFrame(scaled_df) scaleddf=scaleddf.rename({0:'month',1:'day',2:'order',3: 'country',4:'sessionID', 5:'page1', 6:'colour', 7:'location',8:'model photography', 9:'price',10:'price2',11:'page'},axis=1)
scaleddf.head()
x=scaleddf.iloc[:,[5,6]].values y=scaleddf['price']
wcss_list=[] foriinrange(2,10): kmeans = KMeans(n_clusters=i, init='k means++', random_state=42) kmeans.fit(X) wcss_list.append(kmeans.inertia_) plt.plot(range(2,10),wcss_list) plt.title('TheElobwMethodGraph') plt.xlabel('Numberofclusters(k)') plt.ylabel('wcss_list') plt.show()
kmeans = KMeans(n_clusters=3, init='k means++', random_state=42) y_kmeans=kmeans.fit_predict(x)
x, y_kmeans = make_blobs(n_samples=600, centers=3, cluster_std=0.60,random_state=0)
plt.scatter(x[y_kmeans == 0, 0], x[y_kmeans == 0, 1], s = 100,c='blue',label='Cluster1')#forfirstcluster plt.scatter(x[y_kmeans == 1, 0], x[y_kmeans == 1, 1], s = 100,c='green',label='Cluster2')#forsecondcluster plt.scatter(x[y_kmeans== 2, 0], x[y_kmeans == 2, 1], s = 100,c='red',label='Cluster3')#forthirdcluster # plt.scatter(x[y_kmeans == 3, 0], x[y_kmeans == 3, 1],s =100,c='cyan',label='Cluster4')#forfourthcluster plt.title('Clustersofcustomers') plt.xlabel('Products') plt.ylabel('Price') plt.legend() plt.show()
© 2022, IRJET | Impact Factor value: 7.529 | ISO 9001:2008 Certified Journal | Page3879